
Water Supply and Sanitation in Kenya - Home | WSP · 3 Water Supply and Sanitation in Kenya:...
36
Water Supply and Sanitation in Kenya Turning Finance into Services for 2015 and Beyond An AMCOW Country Status Overview
Transcript of Water Supply and Sanitation in Kenya - Home | WSP · 3 Water Supply and Sanitation in Kenya:...

Water Supply and Sanitation in KenyaTurning Finance into Services for 2015 and Beyond
An AMCOW Country Status Overview

The first round of Country Status Overviews (CSO1) published in 2006 benchmarked the preparedness of sectors of 16 countries in Africa to meet the WSS MDGs based on their medium-term spending plans and a set of ‘success factors’ selected from regional experience. Combined with a process of national stakeholder consultation, this prompted countries to ask whether they had those ‘success factors’ in place and, if not, whether they should put them in place.
The second round of Country Status Overviews (CSO2) has built on both the method and the process developed in CSO1. The ‘success factors’ have been supplemented with additional factors drawn from country and regional analysis to develop the CSO2 scorecard. Together these reflect the essential steps, functions and results in translating finance into services through government systems—in line with Paris Principles for aid effectiveness. The data and summary assessments have been drawn from local data sources and compared with internationally reported data, and, wherever possible, the assessments have been subject to broad-based consultations with lead government agencies and country sector stakeholders, including donor institutions.
This second set of 32 Country Status Overviews (CSO2) on water supply and sanitation was commissioned by the African Ministers’ Council on Water (AMCOW). Development of the CSO2 was led by the World Bank administered Water and Sanitation Program (WSP) in collaboration with the African Development Bank (AfDB), the United Nations Children’s Fund (UNICEF), the World Bank and the World Health Organization (WHO).
This report was produced in collaboration with the Government of Kenya and other stakeholders during 2009/10. Some sources cited may be informal documents that are not readily available.
The findings, interpretations, and conclusions expressed in this volume do not necessarily reflect the views of the collaborating institutions, their Executive Directors, or the governments they represent. The collaborating institutions do not guarantee the accuracy of the data included in this work. The boundaries, colors, denominations, and other information shown on any map in this work do not imply any judgment on the part of the collaborating institutions concerning the legal status of any territory or the endorsement or acceptance of such boundaries.
The material in this publication is copyrighted. Requests for permission to reproduce portions of it should be sent to [email protected] The collaborating institutions encourage the dissemination of this work and will normally grant permission promptly. For more information, please visit www.amcow.net or www.wsp.org
Photograph credits: The Water and Sanitation Program
© 2011 Water and Sanitation Program

Water Supply and Sanitation in KenyaTurning Finance into Services for 2015 and Beyond
An AMCOW Country Status Overview

2
An AMCOW Country Status Overview
Strategic Overview
The architecture of the water supply and sanitation subsectors in Kenya has undergone significant change in the last decade, in response to a slow deterioration of urban services through the 1980s and ’90s. Initiated with a new Water Act in 2002, significant policy revision and restructuring of institutional roles is still ongoing and will need to be aligned with the new Constitution of Kenya 2010. Most of the reform emphasis has been in the water supply subsectors, especially urban, but sanitation is now regaining emphasis with a new policy published in 2007 and a strategy and investment plan in development. These reforms of the enabling environment are beginning to yield impacts in the coverage and quality of services. Kenya’s challenge is to finalize the reform of enabling aspects such as strategies and investment plans, further clarifying roles and responsibilities, at the same time as significantly scaling up resources and systems for implementing the development of new services on the ground.
If rates of progress on water supply and sanitation coverage are not accelerated, sector targets in Kenya will be missed in both rural and urban areas. The biggest overall gaps are for rural and urban sanitation, and at current rates of progress only a third of the population will have access to safe sanitation in 2015. Urban water supply coverage is currently lower than it was in 1990, though there are signs that this downward trend is reversing. Progress has been made in rural water supply but will need to be accelerated to meet sector targets.
For water supply, financial allocations to the main sector ministry have increased six-fold since 2003/04, while development partner contributions have almost quadrupled since 2006/07. Estimates for required and anticipated capital investment suggest that urban water supply has sufficient funds for water supply infrastructure, but additional funding needs for urgent water storage and bulk transfer schemes will require consideration. Anticipated capital investment for rural water supply falls short of requirements and is highly fragmented, making it difficult to manage and report on. For sanitation, though
anticipated capital investments are close to requirements, this assumes households will meet a substantial share of costs, especially in rural areas. However, there is currently no clear policy on promotion and marketing to encourage households to invest in sanitation.
Significant improvements can still be made throughout the ‘service delivery pathway’ through which finance is turned into services. Upstream, separation and clarification of roles is incomplete for all subsectors—especially rural and urban sanitation—including for governance, regulation, ownership, and operations. Levels of disbursement and expenditure can still be improved to make the most of increased allocations to the sector from donors and government.
Among policy issues, public support for sanitation hardware vs. software must be clarified. While finance for a national network of environmental health workers is available they have very limited operational funding and no capital funding to subsidize sanitation.
Moving downstream, aspects for sustaining and developing services are comparatively underdeveloped. The equity of resource allocation—particularly in rural water supply—can be significantly improved. Additionally, this subsector lacks adequate management systems, finance and capacity to monitor, maintain, and expand services.
In urban areas, water supply and sanitation and sewerage reforms have yet to result in increased coverage, quality, and equity, with an increasing risk of raw water shortage due to lags in developing storage, transmission mains, and treatment capacity.
Finally, in terms of checks and balances, while the monitoring and evaluation architecture is elaborate, greater use of the findings captured by information systems and reports is needed to drive performance improvements. The second AMCOW Country Status Overview (CSO2) has been produced in collaboration with the Government of Kenya and other stakeholders.
An AMCOW Country Status Overview
2

3
Water Supply and Sanitation in Kenya: Turning Finance into Services for 2015 and BeyondWater Supply and Sanitation in Kenya: Turning Finance into Services for 2015 and Beyond
3
Rural water supply• Improvemanagementandcoordinationofworksandinvestmentplanning.• Enhancetargetingofinvestmentsbydevelopingandimplementingadatabasetomonitorcoverage/functionalityof
rural water supply systems.• Raisefundstoreducethedeficit,especiallyformultivillagebulksupplies.
Urban water supply• Agreeonfinalplacementofwaterservicesassets.• Intensifyfocusoninformalsettlements.• Raisefundsforstorageandtransmissionprojectscriticaltosecurewaterresourcestocopewithexistingdemandand
future expected urban growth.• Enforceadherencetocorporategovernanceprinciplessetoutbytheregulator.
Urban sanitation and hygiene• Ensurethesanitationstrategyoutlinestheroleofenvironmentalhealthworkersinurbanareas;addressesthehigh
degreeofsharedsanitation,especiallyamongtenants;andimprovescoordinationamongresponsibleministries.• Identifyandinvestinlow-costsewerageoptionsincludingsmall-boresewerageanddecentralized,neighborhood-
based treatment plants.
Rural sanitation and hygiene• Completethesanitationstrategyensuringit: o takesaclearstandonhardwaresubsidiesandincorporatesthisintoasubsectorcosting; o specifies clear roles for and makes full use of the 6000+ environmental health workers for sanitation and hygiene
promotion; o putsinplaceamechanismformonitoringuptake;and o addresses vulnerable groups.
Sectorwide• AligntheWaterAct2002withtheConstitutionofKenya2010.
Agreed priority actions to tackle these challenges, and ensure finance is effectively turned into services, are:

4
An AMCOW Country Status Overview

5
Water Supply and Sanitation in Kenya: Turning Finance into Services for 2015 and Beyond
Acronyms and Abbreviations ........................................................................................................................... 6
1. Introduction .................................................................................................................................................... 7
2. Sector Overview: Coverage and Finance Trends ............................................................................................... 8
3. ReformContext:IntroducingtheCSO2Scorecard ......................................................................................... 11
4. Institutional Framework ................................................................................................................................ 13
5. Financing and its Implementation .................................................................................................................. 15
6. Sector Monitoring and Evaluation ................................................................................................................. 18
7. Subsector:RuralWaterSupply ...................................................................................................................... 20
8. Subsector: Urban Water Supply ..................................................................................................................... 22
9. Subsector:RuralSanitationandHygiene ....................................................................................................... 25
10. Subsector: Urban Sanitation and Hygiene ...................................................................................................... 27
NotesandReferences ................................................................................................................................... 29
Contents
6
An AMCOW Country Status Overview
Acronyms and Abbreviations
AfDB African Development BankAMCOW African Ministers’ Council on WaterCAPEX Capital expenditureCBO Community-based organizationCLTS Community-Led Total SanitationCSO(2) Country Status Overviews (second round)Danida Danish International Development AgencyDPHO District Public Health OfficerDWO District Water OfficerESH Environmental sanitation and hygieneGDP Gross domestic productGNI Gross national incomeGTZ Gesellschaft für Technische
Zusammernarbeit, a German technical assistance agency
HH HouseholdJMP Joint Monitoring Programme (UNICEF/
WHO)LA Local AuthorityLIC Low income countryM&E Monitoring and evaluationMDG Millennium Development GoalMIC Middle income countryMoE Ministry of EducationMoF Ministry of FinanceMoLG Ministry of Local GovernmentMoPHS Ministry of Public Health and Sanitation
MoWI Ministry of Water and IrrigationMTEF Medium Term Expenditure FrameworkNGO Nongovernmental organizationNWCPC National Water Conservation and Pipeline
CorporationO&M Operations and maintenanceOPEX Operations expenditurePROMIS ProjectManagementInformationSystemPSP Private sector participationRSH RuralsanitationandhygieneRWS RuralwatersupplySIDA Swedish International Development
Cooperation AgencySIM Sector Investment ModelSIP Sector Investment PlanSWAp Sector-Wide ApproachUNICEF United Nations Children’s FundUSH Urban sanitation and hygieneUWS Urban water supplyWARIS WaterRegulatoryInformationSystemWASH Water, Sanitation and HygieneWASREB WaterServicesRegulatoryBoardWHO World Health OrganizationWS Water servicesWSB Water Services BoardWSP Water and Sanitation ProgramWSTF Water Services Trust Fund
Exchange rate 2010 average: US$1 = KES 79.1
An AMCOW Country Status Overview

7
Water Supply and Sanitation in Kenya: Turning Finance into Services for 2015 and Beyond
1. Introduction
The African Ministers Council on Water (AMCOW) commissioned the production of a second round of Country Status Overviews (CSOs) to better understand what underpins progress in water supply and sanitation and what its member governments can do to accelerate that progress across countries in Sub-Saharan Africa (SSA).2 AMCOW delegated this task to the World Bank’s Water and Sanitation Program and the African Development Bank who are implementing it in close partnership with UNICEF and WHO in over 30 countries across SSA. This CSO2 report has been produced in collaboration with the Government of Kenya and other stakeholders during 2009/10.
The analysis aims to help countries assess their own service delivery pathways for turning finance into water supply and sanitation services in each of four subsectors: rural and urban water supply, and rural and urban sanitation and hygiene. TheCSO2analysishasthreemaincomponents:areviewofpastcoverage;acostingmodeltoassesstheadequacyoffutureinvestments;andascorecardwhichallowsdiagnosisofparticularbottlenecksalongtheservicedeliverypathway.The CSO2’s contribution is to answer not only whether past trends and future finance are sufficient to meet sector targets, but what specific issues need to be addressed to ensure finance is effectively turned into accelerated coverage in water supply and sanitation. In this spirit, specific priority actions have been identified through consultation. A synthesis report, available separately, presents best practice and shared learning to help realize these priority actions.

8
An AMCOW Country Status Overview
2. Sector Overview: Coverage and Finance Trends
Coverage: Assessing Past Progress
The most recent official estimates of access from the Government of Kenya put water supply coverage at 42 percent and sanitation coverage at 31 percent in 2006 (urban and rural areas combined). The chances of meeting ambitious government targets for 2015, of 76 percent in each case, appear slim.3 The Government’s estimates and targets are taken from the Sector Investment Plan (SIP 2030),4 which forms the focus of the CSO2 report in assessing the adequacy of coverage trends and finance. The SIP’s definition of water supply coverage is stringent, revising 2006 household survey results downwards on the basis of quality and proximity of water supplies.5
The CSO2 also benchmarks countries’ own estimates of coverage using internationally comparable data from the UNICEF/WHO Joint Monitoring Programme (JMP).6 For water supply, the JMP estimates are more positive, with coverage increasing from 43 percent in 1990 to 59 percent in 2008. The Millennium Development Goal (MDG) target is, however, for almost three-quarters (72
Sanitation
100%
80%
60%
40%
20%
0%1985 1990 1995 2000 2005 2010 2015 2020
JMP estimates
SIP estimate
MDG target
SIP target
Cov
erag
e
Water supply
Figure 1Progress in water supply and sanitation coverage
100%
80%
60%
40%
20%
0%1985 1990 1995 2000 2005 2010 2015 2020
SIP estimates
JMP estimates
SIP target
MDG target
Cov
erag
e
Sources: SIP and JMP 2010 report.
An AMCOW Country Status Overview
percent) of Kenyans to have access to improved water supply by 2015. On current trends this will be missed by 7 percentage points (Figure 1). For sanitation, the JMP trend line portrays access increasing from 26 percent in 1990 to 31 percent in 2008. Figure 1 shows that this is in line with the government’s 2006 estimate, but less than half way to the MDG target of 63 percent.
Investment Requirements: Testing the Sufficiency of Finance
Past rates of coverage will need to be accelerated with additional finance. The costings presented here are those developed by the Government of Kenya in its Sector Investment Model (SIM), which underpins the SIP 2030. The SIM estimates of capital investment requirements (CAPEX) to meet government targets for water supply and sanitation are compared with anticipated public CAPEX and the assumed contribution from households, based on user contribution policy (Figure 2). Investment requirements for operations and maintenance (OPEX) are assessed separately.
9
Water Supply and Sanitation in Kenya: Turning Finance into Services for 2015 and Beyond
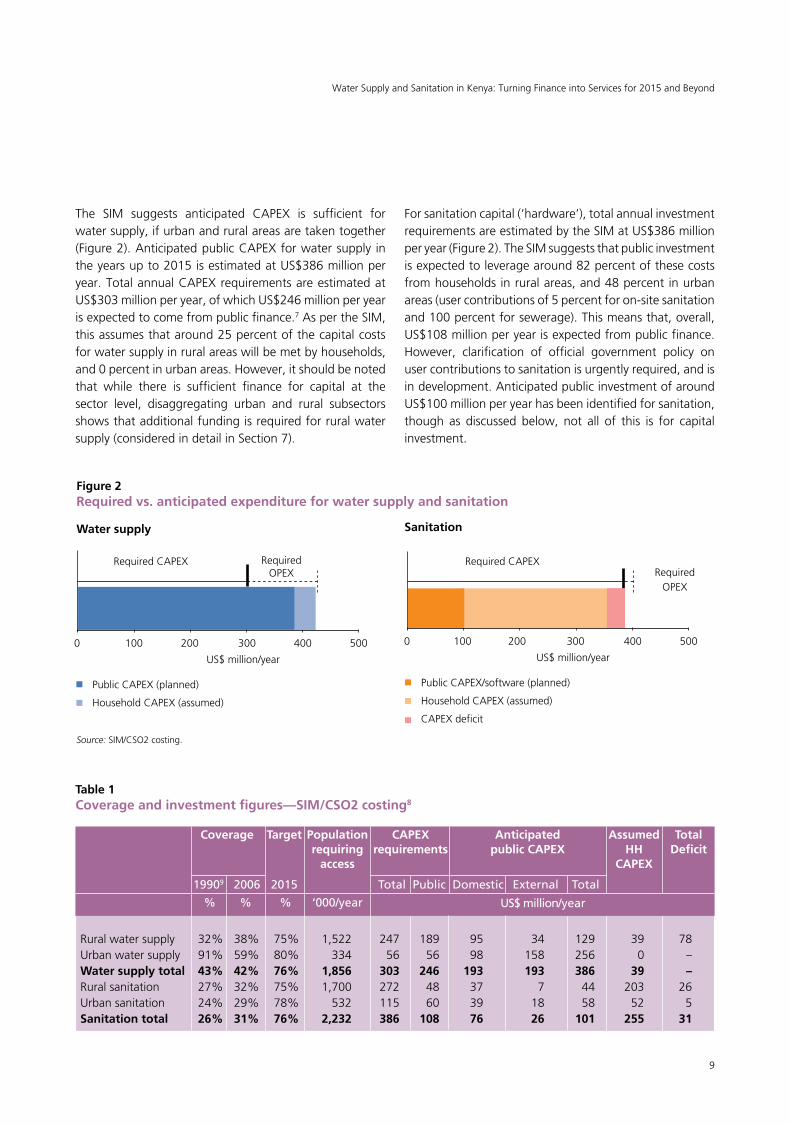
The SIM suggests anticipated CAPEX is sufficient for water supply, if urban and rural areas are taken together (Figure 2). Anticipated public CAPEX for water supply in the years up to 2015 is estimated at US$386 million per year. Total annual CAPEX requirements are estimated at US$303 million per year, of which US$246 million per year is expected to come from public finance.7 As per the SIM, this assumes that around 25 percent of the capital costs for water supply in rural areas will be met by households, and 0 percent in urban areas. However, it should be noted that while there is sufficient finance for capital at the sector level, disaggregating urban and rural subsectors shows that additional funding is required for rural water supply (considered in detail in Section 7).
Sanitation
0 100 200 300 400 500
RequiredCAPEXRequired
OPEX
US$ million/year
Public CAPEX/software (planned)
Household CAPEX (assumed)
CAPEX deficit
Water supply
Figure 2Required vs. anticipated expenditure for water supply and sanitation
0 100 200 300 400 500
RequiredCAPEX Required OPEX
US$ million/year
Public CAPEX (planned)
Household CAPEX (assumed)
Source: SIM/CSO2 costing.
For sanitation capital (‘hardware’), total annual investment requirements are estimated by the SIM at US$386 million per year (Figure 2). The SIM suggests that public investment is expected to leverage around 82 percent of these costs from households in rural areas, and 48 percent in urban areas (user contributions of 5 percent for on-site sanitation and 100 percent for sewerage). This means that, overall, US$108 million per year is expected from public finance. However, clarification of official government policy on user contributions to sanitation is urgently required, and is in development. Anticipated public investment of around US$100 million per year has been identified for sanitation, though as discussed below, not all of this is for capital investment.
Table 1Coverage and investment figures—SIM/CSO2 costing8
Coverage Target Population CAPEX Anticipated Assumed Total requiring requirements public CAPEX HH Deficit access CAPEX
19909 2006 2015 Total Public Domestic External Total
% % % ‘000/year
Ruralwatersupply 32% 38% 75% 1,522 247 189 95 34 129 39 78Urban water supply 91% 59% 80% 334 56 56 98 158 256 0 –Water supply total 43% 42% 76% 1,856 303 246 193 193 386 39 –Ruralsanitation 27% 32% 75% 1,700 272 48 37 7 44 203 26Urban sanitation 24% 29% 78% 532 115 60 39 18 58 52 5Sanitation total 26% 31% 76% 2,232 386 108 76 26 101 255 31
US$ million/year

10
An AMCOW Country Status Overview
Table 2Annual OPEX, SIM estimates
Subsector OPEX US$ million/year
Ruralwatersupply 65Urban water supply 59Water supply total 124Ruralsanitation 4Urban sanitation 13Sanitation total 17
If JMP data and their respective MDG targets are switched for government coverage data and targets investment requirements would be: lower for rural water supply and sanitation, but higher for urban water supply. Investment requirements for urban sanitation are similar.
There are a number of reasons why the above depiction of investments may be over-optimistic. The first is operation and maintenance (O&M) requirements (Table 2). As in many countries, in Kenya there is an implicit assumption that O&M costs will be recovered from users, though in practice this is not always achieved. If any annual O&M requirement has to be subsidized from the public purse, for example to utilities that do not achieve operational cost recovery, it reduces the amount available for capital investment.
Anothermajorreasonforcautionistheineffectivenessofuser contribution policies. This is a particular concern for sanitation. For on-site sanitation there is an expectation that households will contribute 95 percent of capital costs, but the state still has a duty to safeguard public health by encouraging households to shoulder the expense of building facilities. Policy is unclear on how this will be financed. The SIM estimates additional software investment requirements of around US$30 million per year. Part of the anticipated public investment shown in Figure 2 (Sanitation) is in fact going to software, in paying the salaries of 6,000+ environmental health workers employed by the Ministry of Public Health and Sanitation (MoPHS). However, the amount of time these workers dedicate to sanitation and hygiene is limited because they are given no specific budget for promotion materials. If a public contribution of 5 percent of the capital cost of on-site facilities is insufficient to increase coverage without additional software support, then anticipated public investment needs to increase—whether for hardware subsidies or software.
A furthermajor consideration,which is not depicted inTable 1, is the additional cost associated with water transfer and storage. Though the CSO2 focuses on water supply
An AMCOW Country Status Overview
and sanitation, rather than water resource management, raw water availability is an important consideration. Kenya’s water resource situation, particularly for urban areas, has become precarious. The CSO2 estimates an additional US$150 million per year is required to urgently develop additional water storage and transfer, up to 2015—though no government costing or allocation has been developed as yet. Other policy assumptions behind the costing models can, of course, increase or decrease the investment requirements. The SIM technology mix is relatively high-end. Almost a quarter of rural households to be served in the remaining MDG period are to be served with private, piped household water supply, while 40 percent of the urban population to gain access to sanitation are expected to connect to mains sewerage.10 Greater emphasis on cheaper technologies would, of course, reduce the investment requirements, but may also reduce the quality (and safety) of services.
These considerations are only part of the picture. Bottlenecks can, in fact, occur throughout the service delivery pathway—all the institutions, processes, and actors that translate sector funding into sustainable services. Where the pathway is well developed sector funding should turn into services at the estimated unit costs. Where it is not, the above investment requirements may be gross underestimates. The rest of this report evaluates the service delivery pathway in its entirety, locating the bottlenecks and presenting the agreed priority actions to help address them.

11
Water Supply and Sanitation in Kenya: Turning Finance into Services for 2015 and Beyond
3. Reform Context: Introducing the CSO2 Scorecard
Water supply and, to a lesser extent, sanitation in Kenya have undergone significant reforms since the ’90s, when it became clear that the government’s ambitious long-term targets, set in the early ’80s, would not be reached. This recent history puts the service delivery pathway in context, which can then be explored in detail using the CSO2 scorecard, an assessment tool providing a snapshot of reform progress across the ‘building blocks’ that make up the service delivery pathway. The CSO2 scorecard assesses the building blocks of service delivery in turn: three building blocks which relate to enabling services;threewhichrelatetodevelopingnewservices;andthreewhich relate to sustaining services. Each building block is assessed against specific indicators and scored from 1 to 3 accordingly.11
By the ’90s, sector performance in Kenya had deteriorated, particularly in urban areas, exacerbated by the government’s limited funding to the sector, poor management of utilities, mismanagement of funds, and an unprecedented growth in demand. Poor performance, however, only became a significant impetus for change with civic pressure, expressed through formal complaints procedures and the media, over several public health crises directly related to poor water services in the ’90s. Macroeconomic reform initiatives promoted by bilateral agencies and international finance institutions also played a part in catalyzing reform.
To date, reform effort has concentrated ‘upstream’ in the service delivery pathway—on the enabling environment for service delivery. Figure 3 indicates that Kenya’s enabling building blocks score well against its peer group, reflecting extensive policy and planning reforms as well as strong budget allocation. Much of this arose with a new Water Act in 2002, giving rise to a new set of Water Sector Institutions (WSIs), including an independent regulator(theWaterServicesRegulatoryBoard,WASREB).Ownership was devolved to the regional level with the creation of Water Services Boards (WSBs), who in turn were intended to allocate responsibility for operation to local water services providers, and encourage community management. A new Water Policy had been produced
in 1999, but the resulting strategy to operationalize the policy was not developed until 2007, followed by a SIP in 2009.12 The sanitation subsector is somewhat behind: an environmental sanitation and hygiene policy was published in 2007, and the accompanying strategy and investment plan are in development.13 However, several of the enabling reforms initiated with the 2002 Act present ongoing challenges, including embedding the Sector-Wide Approach (SWAp) adopted in 2006. Furthermore, with the enactment of the Constitution of Kenya 2010, the Water Act 2002 will need to be reviewed to be brought into line with the new supreme law.
Further along the service delivery pathway, key challenges to developing new services efficiently include the need for criteria to match resource allocation at national level with need at local level; and for systems to monitoroutput more effectively. The final, downstream end of the service delivery pathway relates to sustaining services—as Figure 3 indicates Kenya’s subsectors
Figure 3Average scorecard results for enabling, sustaining, and developing stages of the service delivery pathway, and peer-group comparison
Enabling
Sustaining Developing
Kenya average scores
Averages, LICs, GNI p.p. >US$500
Source: CSO2 scorecard.
12
An AMCOW Country Status Overview
perform below the peer-group average, reflecting the need to monitor the functionality of rural water points, to improve cost recovery in urban and rural areas and to reduce nonrevenue water. For sanitation there is a need to establish whether the cadre of public health extension workers is having an impact on the household uptake of toilet facilities.
Sections 4 to 6 highlight challenges across three thematic areas—the institutional framework, finance and monitoring and evaluation (M&E). The related scorecard indicators which give an empirical basis for evaluation are highlighted in the section (each of the nine building blocks is scored against three indicators). The scorecards for each subsector are presented in their entirety in sections 7 to 10.
An AMCOW Country Status Overview
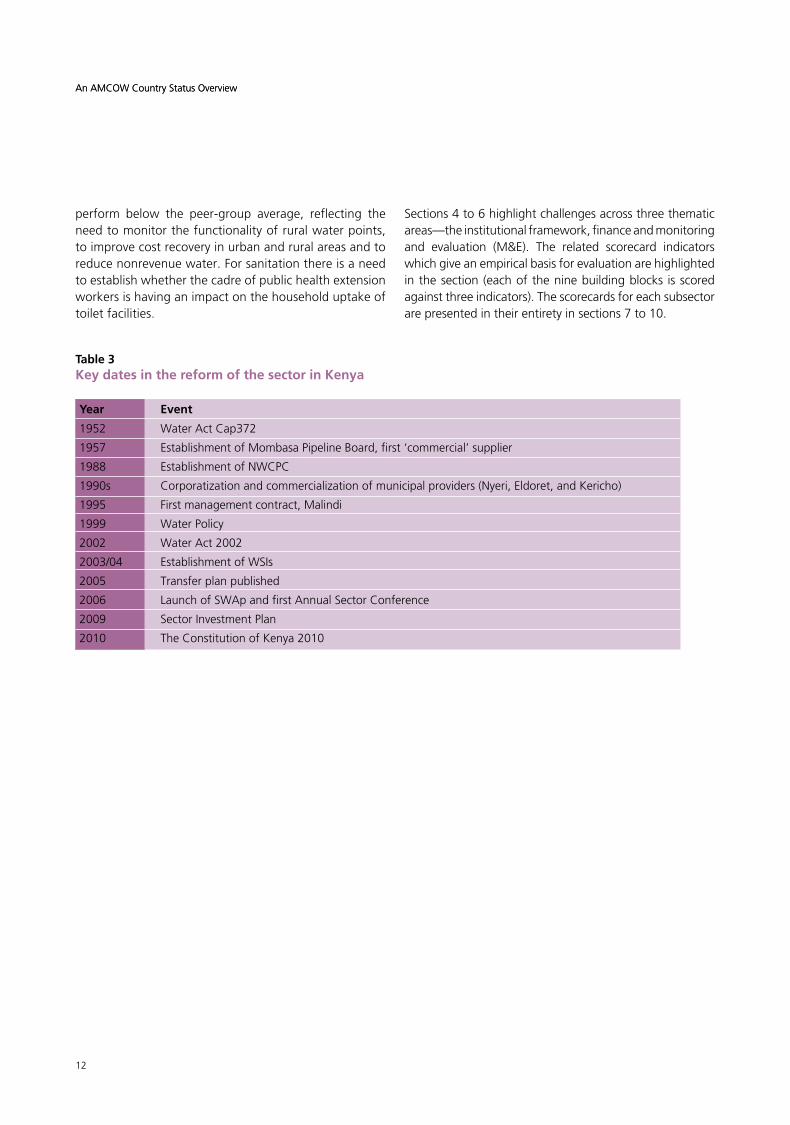
Table 3Key dates in the reform of the sector in Kenya
Year Event
1952 Water Act Cap372
1957 Establishment of Mombasa Pipeline Board, first ‘commercial’ supplier
1988 Establishment of NWCPC
1990s Corporatization and commercialization of municipal providers (Nyeri, Eldoret, and Kericho)
1995 First management contract, Malindi
1999 Water Policy
2002 Water Act 2002
2003/04 Establishment of WSIs
2005 Transfer plan published
2006 Launch of SWAp and first Annual Sector Conference
2009 Sector Investment Plan
2010 The Constitution of Kenya 2010

13
Water Supply and Sanitation in Kenya: Turning Finance into Services for 2015 and Beyond
4. Institutional Framework
A major aim of the institutional reforms following theWater Act 2002 was to clearly separate roles among different institutions in order to minimize duplication and maximize efficiency. Related scorecard indicators,whichlook at the extent to which national targets have been set, policies, and institutional roles put in place, show that all subsectors perform similarly, but below the average for Kenya’s peer group (Figure 4). This section considers institutional challenges in detail, building on the snapshot provided by scorecard indicators with in-depth analysis. Figure 5 presents the intended architecture for the sector and subsectors.15
Regulation: Empowering WASREB. While several promisinginitiativeshaveemergedfromWASREB,suchastwo comparative benchmarking reports on water services (WS) providers,16 the regulator could be strengthened further. WASREB does not have total authority overregulation, with potential duplication of responsibilities with WSBs and the Ministry of Water and Irrigation (MoWI) over inspecting, monitoring, and reporting on the
Figure 4Scorecard indicator scores relating to institutional framework compared to peer group (see endnotes)14
Kenya average scores
Averages, LICs, GNI p.p. >US$500
Source: CSO2 scorecard.
RWS
RSH
USH UWS
WS providers’ performance. Despite gaining prosecution powers in 2008 WASREB’s mandate and capacity toenforce license provisions, issue regulations, and make tariff reviews and determinations is yet to be fully exercised. In relation to the tariff regime, areas for attention include defining responsibility for tariff reviews in rural areas and for smallproviders; thedesignof theexisting retailtariff structure and price adjustmentmethodology; andremuneration for WSBs including the lease fee paid to local authorities.17
Assets and staff: Concluding the transfer. The creation of new WSIs required the transfer of water supply and sewerage assets from the MoWI, local authorities (LAs), the National Water Conservation and Pipeline Corporation (NWCPC), and other public bodies to the WSBs, and staff to both WSBs and WS providers. MoWI issued a Transfer Plan for assets in 2005 but that elapsed in 2008 before all aspects had been executed. Legal inconsistencies, stakeholder opposition, and limited funding for required studies and investments appear to be the main blockages, making managing and financing assets more difficult. The WSBs have taken administrative responsibility for most assets formerly belonging to the MoWI but have not received the deeds of ownership, while district water officers (DWOs) formally report to WSBs but continue to receive direct funding from the MoWI for asset development. Liabilities, particularly outstanding infrastructure development loans from before the transfer began, put the financial viability of WSBs and some larger WS providers at risk. The status of water assets belonging to LAs, nongovernmental organizations (NGOs), NWCPC, and other public corporations is not yet agreed upon. The incomplete asset transfer directly impacts the financial viability of WS providers. First, the lease fees paid to LAs by them—over US$14 million since 2004 in the case of the Nairobi utility—are a drain on the sector as they are not being reinvested by the LAs. Second, it compromises the ability of WSBs to access investment finance from the market as the assets are not on their books. In terms of staff transfer, the delays reduce cohesion, with staff transferred from

14
An AMCOW Country Status Overview
different institutions still under the terms and salaries of their previous employers, and limit WSIs’ ability to select new staff based on merit. A new transfer plan was drafted and submitted for inclusion in the Gazette in early 2010.18 However, in late 2010 the asset transfer has again been put on hold pending the alignment of the Water Act 2002 with the new Constitution. The underling financial implications of the assets and their transfer will nevertheless persist requiring a clear and conclusive decision.
Operations: Creating viable service providers. Since 2004, 118 WS providers have registered, including a large number of small independent providers, community-based organizations (CBOs) and NGOs, but many are still unregistered. A rationalization process has begun, ‘clustering’ several small providers where this improvesviability;manymeanwhileremainunclustered,
struggling to recover even O&M costs. At the still smaller, nonnetworked level of water kiosks in peri-urban areas, WASREBhasdevelopedmanagementstandards.
Private sector participation: Enabling a positive contribution. The role of local entrepreneurs is emerging in public sanitation, secondary water supply (through kiosks, trucks or tankers) and spare parts for rural water supply. Large-scale private investment is unlikely due to the complex institutional setup in the sector, still evolving tariff regulation, and low political support for private sector participation (PSP). At medium-scale, open competition for contracts for WS provider operation and management has been limited. Despite a relatively competitive domestic market in technology and related services, contracting private enterprises to provide specific services (such as monitoring, billing, or rural water supply O&M) is rare.
An AMCOW Country Status Overview
Figure 5Institutional roles and relationships in the water supply and sanitation sector
Source: CSO2 analysis.
Sectorleadership
Water supplySewerage and related hygiene
promotionGeneral sanitation and
hygiene promotionSchool
SanitationUrban
Sanitation
National
Regional
Local
Regulation
Servicedevelopmentand provision
MoWI: Ministry of Water and Irrigation. Policy lead on water supply, oversight of WSBs and water services providers (including theirsanitationactivities);limitedserviceprovisionthroughDWOs.MoPHS: Ministry of Physical Health and Sanitation. Policy lead on Environmental Sanitation and Hygiene (ESH).MoE: Ministry of Education. Supervision of ESH in schools.LAs: Local authorities. Supervision of urban sanitation. WASREB: WaterServicesRegulatoryBoard.Technicalstandardsand tariffs, issues licenses and tariff guidelines.NWCPC: National Water Conservation and Pipeline Corporation. Bulk supply development. WSTF: Water Services Trust Fund. Provides grants for capital investment in underserved areas.
MoWl MoPHS MoE
WASREB
WSTF
LAs
NWCPC
WSBs
WS providers & DWOs DPHOs
WSBs: Water Services Boards. Ownership of assets previously belongingtocentralgovernment,MoWIorparastatals;mayalso‘acquire… use of assets’ belonging to local authorities. Can operate as Water Service Providers (below) or bulk service providers. Provide hygiene promotion associated with sewerage.WS providers: Water service providers. Operation and management. Can include local authority owned companies, NGOs and CBOs.DWOs: District Water Officers, local MoWI officials. DPHOs: District Public Health Officers, local MoPHS officials.Additional bodies:KenyaWaterInstitute(capacitydevelopment);Water Appeal Board (dispute resolution).

15
Water Supply and Sanitation in Kenya: Turning Finance into Services for 2015 and Beyond
The scorecard indicators relating to finance range from the development of a SWAp and costed investment program, to the overall sufficiency of finance and extent of utilization (foreign and domestic). As can be seen from Figure 6, average indicator scores are high across most subsectors—rural water is affected by its large financing deficit. However, as outlined below, there are a number of outstanding challenges in the way financial resources are obtained, allocated, and disbursed.
Planning: Linking inputs, outputs, and need. A number of strategies and plans have been developed. The latest, dealing specifically with financing, is the SIP 2030 and accompanying Strategic Sector Investment Model (SIM). Baseline data (no detailed investment plans were provided by the WSIs) and ownership of the SIP within the sector could nonetheless be enhanced. In general plans and strategies are not always linked to each other, to available resources, and to specific sector targets, reducing their contribution as consistent and achievable roadmaps for the sector (the Water Services Trust Fund’s Strategic Plan and the Pro-Poor Implementation Plan for WS providers are
5. Financing and its Implementation
promising exceptions).20 For urban water supply especially, planning for water storage and transfer has been lacking. No new water resources have been developed for Nairobi since 1994. Domestic and commercial users are increasingly drilling private boreholes, with uncertain implications for groundwater.
Budgeting: Directing finance effectively. The move to three-year rolling budgets with the Medium Term Expenditure Framework (MTEF) in 1999, as well as more recent public financial management reforms, appear to have paid dividends for the water sector as a whole.21 The MoWI’s budget has increased in absolute terms from US$64 million in 2003/04 to US$379 million in 2009/10, as well as relative to GDP, from 0.4 percent in 2003/04 to 0.9 percent in 2008/09, implying it has more than kept pace withinflation.Themajorityofthecapitalbudgetgrowthhas gone to water supply and sanitation (which account for over 80 percent of the MoWI’s allocation) rather than irrigation. However, additional clarity in the Ministries’ budget structure is still needed to enable more transparent tracking of urban versus rural and water supply versus sanitation allocations. The budget has also yet to be fully realigned to the new water sector institutions (WSBs and WS providers) with 25 percent of the budget still going through prereform institutions including the NWCPC and the DWOs 15 percent and 10 percent in 2009/10, respectively, set to increase to 18 percent and 14 percent by 2011/12).
Allocations to the MoPHS for ‘Environmental Health Services’ began in 2008/09 and doubled to US$34 million for 2009/10: most of this appears to pay the salaries of 6,000 environmental health workers, but specific financing for education and promotion resources are not discernible (see rural sanitation subsector focus). The lack of clarity extends back to the institutional arrangements, with the MoWI and MoPHS sitting in different budget sector working groups. The Ministry of Local Government (MoLG) also has a responsibility for urban sanitation but no separate budget line. As a proportion of GDP the 2008/09 allocation to sanitation (0.06 percent) was
Figure 6Scorecard indicator scores relating to financing and its implementation compared to peer group19
Kenya average scores
Averages, LICs, GNI p.p. >US$500
Source: CSO2 scorecard.
RWS
RSH
USH UWS

16
An AMCOW Country Status OverviewAn AMCOW Country Status Overview
still only 10 percent of what was recommended by the eThekwini declaration, to which Kenya is a signatory, though with the assumed user contributions this would be well above the 0.5 percent GDP.22 A key challenge to the sanitation subsector is to ensure this leveraging of user contributions.
Expenditure: Delivering resources efficiently. Utilization of funds by the MoWI has fluctuated between 94 percent and 76 percent—rates that are higher than many other countries in the region, but which could still be improved. In a review of the 2008/09 third quarter, the MoWI was found to be one of the three ministries with highest underspending.23 According to a recent budget performance report this can be attributed to liquidity issues limiting and delaying releases from the Ministry of Finance (MoF), shortfalls in the MoWI’s budget in turn delaying transfer of funds to districts, tax exemption delays, postelection disturbances in 2007/08, and limited adsorption capacity among the new WSIs.24 Development partner funding also shows underspending in some instances, which the MoWI attributes to limited adsorption capacity among WSIs (because of slow procurement and implementation processes), as well as accounting delays.
Sector trust funds: Enhancing equity. Currently the only sector-specific fund, the Water Services Trust Fund
Rural water supply:Total: $246,875,780
Per capita: $162
Urban water supply:Total: $56,280,831
Per capita: $169
Rural sanitation:Total: $271,969,273
Per capita: $174
Urban sanitation:Total: $114,510,128
Per capita: $226
Domestic planned investment
Assumed household investment
External planned investment
Gap
Source: SIM and CSO2 costing.
(WSTF) employs an allocation formula to target finance on thebasisofneedandqualityofprojects.Criteriaincludea poverty index, water and sanitation coverage in the case of theWSTF’sCommunityProjectCycle (for rural areas)as well as value for money and community participation measuresinthecaseoftheUrbanProjectCycle.Butthisequity-focused finance is a small proportion of the total sectorbudget(around4percentoftheprojected2010/11budget). Even if fully executed only around 15 percent of the 1.86 million people requiring access each year to meet Kenya’s target would be reached.25 Yet the WSTF has many of the ingredients of a good practice service delivery mechanism—pooling of donor and domestic funds, transparentcriteria forproject selection,aclearlysetoutprojectcycle—soitpresentsanopportunitytobebuilt on and scaled up.
Donor finance: Aligning and harmonizing. Between 2006/07 and 2009/10, development partner funding to the sector increased at a significant annualized rate of 53 percent, from US$54 million to US$191 million. As can be seen from Figure 7, the proportion of anticipated investment varies by subsector, with urban water supply set to receive 58 percent of anticipated public investment from external sources, and rural sanitation 8 percent (with a further 8 percent from NGOs). In 2009/10 almost 80 percent was provided as loans, mostly flowing
Figure 7Overall annual and per capita investment requirements and contribution of anticipated financing by source

17
Water Supply and Sanitation in Kenya: Turning Finance into Services for 2015 and Beyond
through partners’ own payment systems (63 percent) rather than government payment systems (37 percent). The proportion not routed through government systems may in fact be higher because the figures do not capture funding routed via NGOs (estimated at an additional 10 percent in the SIP 2030). The SWAp and the Sector Conference (Joint Annual Review) were launched in2006 (relaunched in 2009) including the agreement of ‘Partnership Principles’,26 and smaller multilateral cooperation agreements have been made between the MoWI and donors such as Danida, SIDA, UNICEF, and GTZ. Although the SWAp has provided a useful forum for discussing sector issues, harmonization and alignment still need to be improved in practice.27 Key issues include limited donor awareness and engagement with the SIP as a viable sector plan, low levels of donor financing to the WSTF, an increasing number of agencies (10 in2005,16 in2008)andprojects (35 in2005,80in 2008), and increased funding flowing to the water sector from domestic nonwater sector-specific trust funds.28 Coordinating such a fragmented sector—relative to other countries in the region—is a real challenge.
This coordination task carried out by the Water Sector Working Group, comprising sector ministries, WSIs and donors, would be greatly enhanced if the SIP or a revision of it were used as a common framework.
Market finance: Embracing innovation. Innovative forms of finance are emerging in Kenya. A local bank, K-Rep, has providedmicro-finance loans totalling US$1million (an average of US$68,000) to viable community projects in rural areas with the support of the GlobalPartnership on Output Based Aid. The WSTF plans to employasimilarmechanismforprojectsoutsideitsusual,poverty-targeted locations.29 In February 2009 the first infrastructure bond was issued by the Central Bank of Kenya. Of the maximum amount of US$240.5 million, US$54 million will be used to fund water projects—mostly dams and sewerage.30 The bond was 45 percent oversubscribed, indicating the potential for WSBs or the most viable large WS providers (for example, the NCWSC)toissueproject-specificbonds.Suchinitiativestoleverage market finance require the sector to continue to demonstrate its commercial viability.

18
An AMCOW Country Status Overview
In Kenya, the M&E architecture is elaborate and has evolved rapidly since 2002, moving away from projectmonitoring towards an integrated sectorwide monitoring system. Scorecard indicators relating to M&E are found throughout the service delivery pathway, from the presence of an annual review (for which Kenya scores well) to the monitoring of output and consistency of household surveys in monitoring water supply and satiation outcomes. Overall, however, average indicator scores indicate there is much to be improved (Figure 8). As explained below, the linkages within and between different stages in the M&E cycle could be strengthened. Fostering accountability is a further challenge considered in this section.
Monitoring and evaluation: Strengthening feedback. Figure 9 demonstrates the need to streamline the M&E architecture in Kenya’s water, sanitation, and hygiene (WASH) sector. Specific M&E roles have been designated, for example, a Technical Audit and Performance Contract Monitoring Unit within the MoWI and an M&E officer in the MoPHS’ Department of Environmental Health.
6. Sector Monitoring and Evaluation
TheWASREB’stwo ImpactReportshavesetapromisingexample for performance monitoring of WS providers,32 anditsinformationsystem,WARIS,hasconsolidateddataon WSB and WS provider performance, including Key Sector Indicators. However, the broader picture shows that strong links within and between different stages of the M&E cycle are not yet in place. Over the past two years increasing numbers of plans and strategies have been developed, with limited guidance on complementarities to existing documents.33 In terms of links between stages, it is not clear that findings captured in information systems and reports are used to drive performance improvements. The NWCPC’s poor performance in the 2007 Value for Money Study does not appear to have had consequences and its budget allocation is set to increase.34 Nor does the M&E system yet dovetail fully with the planning system. The Annual Sector Review provides a useful forum fordiscussion of progress against sector plans and targets, and sets and reviews its own sector undertakings, while theMoWI’sannualPerformanceReviewpicksuponeightof the Key Sector Indicators. Nonetheless it appears several plans and strategies are not being individually monitored or evaluated, including the MoWI’s Pro-Poor Implementation Plan—a concern given the ambition of this initiative to improve equity through careful targeting.35 While at the aggregate level information on physical output is available, this has yet to be broken down by location, type, and cost of investments. Accountability structures: Improving information and participation. Accountability extends beyond effective M&E structures, to ensuring that institutions foster the civic attitudes that allow them to respond, and be seen to respond, to users and other institutions. Customer representation is beginning to be developed, for exampleWASREB’sWaterActionGroups.AllWSIshavecreated websites, and the MoWI and some others issue regular newsletters updating stakeholders on reforms. Nevertheless, the quality of online information varies. For example, the Water Sector Policy is not available on any website. Annual reports addressed to the public are issued by only a few WSIs. The WSTF’s Community and Urban
Figure 8Scorecard indicator scores relating to sector M&E, compared to peer group31
RWS
RSH
Kenya average scores
Averages, LICs, GNI p.p. >$500
USH UWS
Source: CSO2 scorecard.
An AMCOW Country Status Overview

19
Water Supply and Sanitation in Kenya: Turning Finance into Services for 2015 and Beyond
ProjectCyclesincludepromisingcommunityparticipationmeasures, which are also recommended by the MoWI’s Value for Money Study and Pro-Poor Implementation Plan, though replicating this capacity in other WSIs has yet to be achieved. Finally, Kenya’s WASH sector is still confronting the challenge of corruption: a recent survey by Transparency International (2009) identified that 12
percent of householder respondents knew someone who had given a bribe to receive water services. The MoWI’s performance contract now requires that corruption is monitored, and the fact that it is discussed at all is a significant step. Confidence in sector reforms (which in turn leads to willingness to pay) will depend on prompt and visible action in response to corruption issues.
Figure 9The monitoring and evaluation cycle in the Kenyan water sector
Source: CSO2 analysis.
Quarterly/annual performance, accounting and license reports provided by WSIs to MoWI andWASREB;projectevaluationsandsectorperformancereportsprovidedtodonors;
quarterly/annual public expenditure reviews for sector ministries
Threesystemsalready:forWASREB(‘WARIS’),WSTF(‘PROMIS’),andWSBs(forasset
management). There are also systems to monitor WSSservicesinurbanareas(‘Majidata’),
and provide a sector overview (MoWI sector information system) in development
Proliferation of indicator sets: 16 Key Service Indicators, 11 Minimum Service Level Indicators, 19 WSS Performance Indicators, 18/19 license and SPA indicators, >60 WASREBindicators.Also‘SectorUndertakings’,agreedatannualsectorreview
Policies for water and sanitation, as well as
government plans such as Vision 2030
Various plans, strategies, performance contracts and investment plans developed
(and being developed) by MoWI, MoPHS, Ministry of Health and Ministry of Environment and
NaturalResources.
3 MTEFs encompassing WASH
services (infrastructure, environment and health);Additionaldistrict budgets and special funds at the
local level
Objectives
Reports
InformationSystems
Plans
Budgets
Indicators

20
An AMCOW Country Status Overview
7. Subsector: Rural Water Supply
Priority actions for rural water supply
• Improvemanagement and coordination of works and investment planning, tackling the fragmentedfundingflowsbetweenthedistricts,NWCPC,WSBs,NGOsandtheWSTF,andothertrustfunds.
• EnhancetargetingofRWSinvestmentbydevelopingandimplementingadatabasetomonitorcoverage/functionalityof ruralwater supply systems, equivalent toWASREB’s ‘WARIS’ system forWSBsandWSproviders.
• RaisefundstoreducethedeficitinRWS,especiallyformulti-villagebulkwatersupplies.
US$129 million per year, which should be able to leverage household contributions of US$39 million per year (based on subsidy policy). The SIM also estimates additional OPEX requirement of US$65 million per year—currently this is either a real or deferred burden on public finance, since recovery of operations and maintenance costs from user fees is rare for rural and small town schemes (see below).
Figure 12 shows the scorecard results for the rural water supply service delivery pathway. The scorecard uses a simple colour code to indicate: building blocks that are largely in place,actingasadriveronservicedelivery(score>2,green);building blocks that are a drag on service delivery and requireattention (score1–2,yellow);andbuildingblocks
According to the government’s own estimates used in the SIM, coverage stood at 38 percent in 2006, leaving a significant shortfall relative to the 2015 SIP target of 75 percent. The JMP estimates that coverage is higher, however, having increased from 32 percent in 1990 to 52 percent. Piped coverage (household connections) remains limited in rural areas. JMP and government estimates differ in what is counted as improved access, and so cannot be directlycompared(governmentestimatesareadjustedforwater quality and collection time).
The SIM’s estimate of required investment for the government target indicates a shortfall of US$78 million per year (Figure 11), assuming anticipated public investment of
Figure 10Rural water supply coverage
1
0.8
0.6
0.4
0.2
01985 1990 1995 2000 2005 2010 2015 2020
SIP estimate
JMP, improved
SIP target
JMP, piped
Sources: SIM and JMP 2010 report.
Figure 11Rural water supply investment requirements
0 100 200 300 400
RequiredCAPEXRequired
OPEX
US$ million/year
Public CAPEX (planned)
Household CAPEX (assumed)
CAPEX deficit
Source: SIM and CSO2 costing.
Cov
erag
e

21
Water Supply and Sanitation in Kenya: Turning Finance into Services for 2015 and Beyond
Figure 12Rural water supply scorecard
that are inadequate, constituting a barrier to service delivery and a priority for reform (score <1, red).
The subsector scorecard indicates that most concerns for the subsector relate to downstream aspects of the service delivery pathway (Figure 12), though Kenya also scores worse than its peer group for enabling building blocks (Figure 13). In terms of developing services, the equity building block scores poorly. Indicators for this building block include the use of allocation criteria to target funds: in Kenya this is currentlyrestrictedtotheprojectcyclesoftheWSTF,whichalso uses participatory planning for investment decisions. The strict criteria and limited resources of the fund mean that many communities may not qualify. As for other subsectors, reliable data on output (where and to what standard services are being developed) is lacking.
There are also concerns about sustaining existing services (maintenance and expansion). Indicators for maintenance include the presence of regular functionality surveys—the first of which was conducted in 2009, finding only 58 percent of rural water sources to be functional36—and whether user financing covers O&M costs (rarely, on available evidence, even in small towns). Willingness-to-pay studies are rarely used to establish cost recovery plans despite indications that people in rural areas can spend 15 percent of their monthly income on water. The role of DWOs in providing back-stoppingsupport is limitedandthemajorityofruralschemes are not registered as WS providers. The low
score for expansion reflects the absence of mechanisms to support planning and financing for schemes—WSBs have few resources to support small schemes, coordination between the responsible institutions has been limited. A bright spot among indicators for use is that collection time for rural water is relatively low, with only 17 percent taking more than 30 minutes to collect water.
Figure 13Average RWS scorecard scores for enabling, sustaining and developing stages of the service delivery pathway, and peer-group comparison
EnablingPolicy
2 2.5 1 2.5 1 1.5 1.5 0.5 1.5
Planning Budget Expenditure Equity Output Maintenance Expansion Use
Developing Sustaining
Enabling
Kenya average scores
Averages, LICs, GNI p.p. >US$500
Sustaining Developing
Source: CSO2 scorecard.
Source: CSO2 scorecard.

22
An AMCOW Country Status OverviewAn AMCOW Country Status Overview
Access to improved water supply in urban areas has dropped over the review period against a background of rapid urban growth: the JMP trend line shows a decline (from 91 percent in 1990 to 83 percent in 2008), while the SIP estimate, with its stricter definition of coverage, is below even this, at 59 percent (Figure 14). However, even with the drop in coverage reported by the JMP, somewhere between 3 and 6.5 million people in urban Kenya gained access to improved sources of drinking water over the 1990 to 2008 period, highlighting the challenge that keeping up with urban population growth poses.37
Reaching the SIP target of 80 percent seems a distant
8. Subsector: Urban Water Supply
Priority actions for urban water supply
• Alignthe2002WaterActwiththeConstitutionofKenya2010andagreefinalplacementofwaterservicesassets.
• Intensifyfocusoninformalsettlements,extendingformalinfrastructureandcuttingoutvendors.
• Raisefundsforstorageandtransmissionprojectscriticaltosecurewaterresourcestocopewithexistingdemandandfutureexpectedurbangrowth,includingtheNairobistorageandMzimapipelineprojects.
• Enforceadherencetocorporategovernanceprinciplessetoutbytheregulator.
prospect but both the 2009 Housing and Population Census and sector data from service providers reported bytheregulatorWASREBindicatethatthisnegativelong-term trend may be reversed. The Census reports access to piped water supply in urban areas at 53 percent, considerably higher than the 44 percent reported by the JMP in 2008. In addition, though based on a different definitionofcoverage,WASREBreportsarise insupply-side coverage from 39 percent in 2005/6 to 45 percent in 2008/9.38
Reaching the government’s SIP target is estimated to
Figure 14Urban water supply coverage
1
0.8
0.6
0.4
0.2
01985 1990 1995 2000 2005 2010 2015 2020
SIP estimate
JMP, improved
SIP target
JMP, piped
Source: SIM and JMP 2010 report.
Cov
erag
e
Figure 15Urban water supply investment requirements
0 100 200 300
RequiredCAPEX
Required OPEX
US$ million/year
Public CAPEX (planned)
Source: SIM and CSO2 costing.

23
Water Supply and Sanitation in Kenya: Turning Finance into Services for 2015 and Beyond
require US$56 million per year, which appears affordable given US$256 million per year in anticipated public investments (Figure 15). OPEX requirements are estimated at US$59 million per year—again, ineffective cost recovery from user fees, compensated for by operating subsidies to utilities, mean this is a drain on available public finance. Furthermore, the depicted capital costs are for treatment and distribution only—an estimated additional US$150 million per year is urgently needed for storage and transfer capacity.
The upstream building blocks of the urban water supply service delivery pathway (policy, planning, budget, and expenditure) scorewell (Figure16).Reformshavedramatically changed the architecture of the subsector,
and important initiatives for the enabling environment include a SWAp, annual joint sector reviewand the SIP2030, though all of these still need to be fully embedded and operationalized in the subsector. As Figure 17 shows, Kenya’s scores are fractionally below the peer group average, even among enabling environment building blocks.
As in rural water supply, there is some way to go to improve downstream building blocks including the equity of services, the quality and monitoring of output, and structures for funding and supporting maintenance. An equity indicator for urban water supply is the presence of specific pro-poor plans for utilities: the MoWI’s Pro-Poor Implementation Plan mandates WS providers to create poverty-targeted expansion plans, to bring improved access to areas of greatest need.39 However, actual progress is limited to a few WS providers (for example, Nairobi, Kisumu) and there is no clear monitoring of impacts. Indicators for the output building block include the quantity of facilities built, but information on the rate of expansion of household connections and standpipes by the MoWI is limited. Water quality standards are in place but are not regularly monitored (limited evidence suggests 83 percent of water quality samples were compliant with residual chlorine standards). High levels of nonrevenue waterreducethescoreformaintenance:WASREB’slatestbenchmarking report found this to be as high as 47 percent. A further maintenance indicator is cost recovery: for most of the larger service providers this is sufficient to cover operations and maintenance, but not for around 60 percent of providers (mainly small-scale).40 The ongoing ‘clustering’ of smaller WS providers may help to improve financial viability, but requires careful negotiation with current owners and existing, viable utilities. Autonomy—financial, legal, and managerial—of the WSBs and WS
Figure 16Urban water supply scorecard
EnablingPolicy
2 2.5 2 3 1.5 0.5 1 1.5 1.5
Planning Budget Expenditure Equity Output Maintenance Expansion Use
Developing Sustaining
Source: CSO2 scorecard.
Figure 17Average UWS scorecard scores for enabling, sustaining, and developing stages of the service delivery pathway, and peer-group comparison
Enabling
Kenya average scores
Averages, LICs, GNI p.p. >US$500
Sustaining Developing
Source: CSO2 scorecard.

24
An AMCOW Country Status OverviewAn AMCOW Country Status Overview
providers would also be strengthened by coming to final agreement on the placement of water services assets and enforcing the 2008, WASREB-developed corporategovernance guidelines. The alignment of the Water Act 2002 with the Constitution of Kenya 2010 will affect how the ‘clustering’ of WS providers, and the autonomy of both WSBs and WS providers, will be structured. A final issue is raw water availability—one of the indicators for
expansion is whether utilities have adequate strategies for securing additional raw water resources. Water crises in 2009, 2006, and 2000 have not yet catalyzed government and service providers to act together to address long-term challenges, and with uneven distribution of water resources and a high level of aridity (80 percent of Kenya’s land area is arid or semi-arid) the problem of raw water availability is likely to increase.

25
Water Supply and Sanitation in Kenya: Turning Finance into Services for 2015 and Beyond
The government’s estimate of rural sanitation coverage and baseline for the SIM is 32 percent (2006). As can be seen in Figure 18, this is roughly in line with the JMP trend line, which puts coverage at 32 percent in 2008 (a slight increase from 27 percent in 1990). Unlike in the water supply subsectors, the JMP and government use similar definitions of improved coverage. Both figures indicate there is a considerable shortfall relative to the government target of 75 percent (government). The JMP estimates a further 18 percent use shared latrines (with 18 percent resorting to open defecation).
The SIM estimates that a total of US$272 million per year is required for sanitation hardware alone (that is, not including promotion and marketing costs) of which households are expected to contribute around 80
9. Subsector: Rural Sanitation and Hygiene
Priority actions for rural sanitation and hygiene
• Completethesanitationstrategy(indevelopment)ensuringit: o Takes a clear stand on level of subsidy to households; o Makesfulluseofthe6,000–7,000environmentalhealthworkersforpromotionactivities; o Puts in place a mechanism for monitoring the uptake of sanitation; o Addresses vulnerable groups; and o Incorporates a costing for the intended results.
percent.41 If this is the case, anticipated public investment plus leveraged household finance leaves a deficit of US$26 million per year. However, as discussed below, policy on subsidies vs. promotion requires clarification. The SIM estimates a small OPEX requirement of US$4 million. This figure is calculated in relation to sewerage only.
The service delivery pathway for rural sanitation is less developed than either water supply subsectors (Figure 20), in particular for developing services, where the average score drops below the peer group average (Figure 21). For building blocks relating to enabling and sustaining services, Kenya’s performance is above average. The high enablingscoresnonethelessconcealamajorshortcomingfor rural sanitation: unclear policy on the relative role of subsidies for hardware, and ‘software’ activities such as
Figure 19Rural sanitation investment requirements
0 100 200 300
RequiredCAPEX Required OPEX
US$ million/year
Public CAPEX (planned)
Household CAPEX (assumed)
CAPEX deficit
Source: SIM and CSO2 costing.
Figure 18Rural sanitation coverage
100%
80%
60%
40%
20%
0%1985 1990 1995 2000 2005 2010 2015 2020
JMP improvedSIP estimate
JMP, improved + sharedSIP target
Source: SIM and JMP 2010 report.
Cov
erag
e

26
An AMCOW Country Status Overview
promotion and marketing. Although Kenya has a National Environmental Sanitation and Hygiene Policy (picked up as one indicator for the policy building block), it is not clear on how households are to be encouraged to invest in sanitation, and how this will be financed—an especially urgent issue given the SIM’s assumption that households will meet 80 percent of the costs. Although in Figure 19 the US$44 million per year in anticipated public investment is contrasted with hardware (capital) investment requirements, this sum is currently mainly intended for software, in the form of the salaries of more than 6,000 public health workers employed at the local level by the MoPHS’s Environmental Health and Sanitation Unit. These workers are expected to contribute around 60 percent
Figure 21Average RSH scorecard scores for enabling, sustaining, and developing stages of the service delivery pathway, and peer-group comparison
of their efforts to sanitation and hygiene promotion, but there is no budget line within the MoPHS to fund such activities, and other health issues tend to take priority. The MoPHS is developing ‘schemes of service’ to set out its responsibilities and performance targets for hygiene and sanitation promotion. Meanwhile, the SIM estimates that additional costs for hygiene promotion are around US$24 million per year, but it is not clear whether this includes staffing costs, promotional materials, or both.
This lack of clarity has implications downstream in the service delivery pathway. Low scores for output arise because with unclear policy, there has been limited development of promotion tools, and little attempt to establish what types of output (for example, hardware subsidies, promotion, or marketing) are most effective in encouraging uptake. Low-cost methods such as Community-Led Total Sanitation (CLTS) have undergone trials, but challenges such as opposition from strong traditional beliefs, expectation of subsidies, and a lack of quality facilitators persist.42 The uptake building block scores poorly on indicators relating to the number and type of facilities being built by households, and handwashing practice (uptake of hygiene promotion activities): studies suggest that between 20 and 60 percent of primary caregivers wash hands with soap at critical times. In schools, widespread hygiene education does not appear to have followed through into practice, with only 1 percent handwashing with soap.43 Markets for sanitation hardware, however, appear robust in rural areas—with high scores for indicators relating to the supply chain and private sector capacity—largely as a result of entrepreneurship.
Figure 20Rural sanitation and hygiene scorecard
Enabling
Kenya average scores
Averages, LICs, GNI p.p. >US$500
Sustaining Developing
Source: CSO2 scorecard.
EnablingPolicy
2 2.5 2 2 1 0.5 2 0.5 1.5
Planning Budget Expenditure Equity Output Markets Up-take Use
Developing Sustaining
Source: CSO2 scorecard.
An AMCOW Country Status Overview

27
Water Supply and Sanitation in Kenya: Turning Finance into Services for 2015 and Beyond
Sanitation coverage in urban areas is the lowest of any subsector: the government’s estimate and SIM baseline is 29 percent for 2006, while the JMP puts 2008 coverage at 27percent,upjust3percentfrom24percentin1990.Asin the rural subsector, reaching the Government’s target of 78 percent would require a massive acceleration of pastprogress.The JMPestimates that in factamajorityof urban Kenyans (51 percent) use shared latrines, with 2 percent resorting to open defecation.
To meet the government target by 2015, the SIM estimates that US$115 million per year is needed for sanitation hardware. The expected household contribution is slightly lower than in the rural subsector, at around 50 percent (though subsidy policy is again unclear). This is due to a
10. Subsector: Urban Sanitation and Hygiene
Priority actions for urban sanitation and hygiene
• Ensurethatthesanitationstrategy: o Outlines the role of Environmental Health Workers in promoting sanitation; o Addresses the high degree of shared sanitation where most people are tenants and so pressure on
landlordsisrequired;and o Improves coordination among ministries dealing with urban sanitation.
• Identifylowcostsewerageoptionsincludingsmall-boresewerageanddecentralized,neighborhood-basedtreatment plants.
higher prevalence of sewerage in urban areas, which is fully subsidized despite the fact it is unlikely to benefit the poorest. As in the rural subsector, this leaves a slight deficit relative to anticipated public investments, of US$5 million per year (Figure 23). OPEX requirements of US$13 million per year are estimated for sewerage, which will require public finance if effective cost recovery is not secured from users.
The urban sanitation service delivery pathway has the lowest aggregate score of any subsector, though performance is slightly above average for enabling and sustaining building blocks (Figure 25). The overall pattern is similar to that found for rural sanitation: output and up-take building blocks again receive scores below 1, constituting
Figure 23Urban sanitation investment requirements
0 50 100 150
RequiredCAPEX Required OPEX
US$ million/year
Public CAPEX (planned)
Household CAPEX (assumed)
CAPEX deficit
Source: SIM and CSO2 costing.
Figure 22Urban sanitation coverage
100%
80%
60%
40%
20%
0%1985 1990 1995 2000 2005 2010 2015 2020
JMP, improved
SIP estimate
JMP, improved + shared
SIP target
Source: SIM and JMP 2010 report.
Cov
erag
e

28
An AMCOW Country Status Overview
a barrier on the entire pathway. As in the rural subsector, policy on public support for software vs. hardware needs to be clarified, and a clearer link established between different government outputs, and uptake by households. Public consultation suggests sanitation is currently a low priority for urban communities,44 indicating that additional promotion and marketing is necessary: the SIM estimates additional hygiene promotion costs in the urban context of US$6 million per year. However, the appropriate approach
may differ from what works in the rural context. A variant of CLTS, adapted to urban areas, might be applied to increase uptake of urban on-site latrines, which are used by 40–50 percent of those with access. Such approaches could also encourage the large number of users of shared facilities to construct their own facilities. However, the effectiveness of CLTS in an urban context is uncertain across the region, and would require development before large-scale adoption. As in other subsectors, better baseline data is a key step to understanding the nature of the challenge. There is currently no systematic monitoring of the number and quality of facilities built by households, and no surveys have focused on hygiene behavior in urban areas (scorecard indicators for uptake). The development of ‘Maji Data’, designed to map sanitation and watersupply in low-income areas and harmonize definitions and approaches, may enhance understanding.
Sewerage has, up to now, received the bulk of hardware subsidies, despite the fact that it is mainly accessed by wealthier Kenyans. The MoWI’s own assessment indicates 20 percent of urban Kenyans have sewerage connections, but that only 3–4 percent of urban wastewater receives treatment, while industrial wastewater treatment is also a concern. In the long term, sewerage remains the likely preferable option in terms of public health, but exploration of low-cost technologies is required if it is to benefit poorer Kenyans. In the short term, with many existing treatment plants operating well below design capacity (15–20 percent on average) it appears that networks could be extended in some areas without the need to invest in expensive additional treatment.45
Figure 24Urban sanitation and hygiene scorecard
Figure 25Average USH scorecard scores for enabling, sustaining, and developing stages of the service delivery pathway, and peer-group comparison
EnablingPolicy
2 2.5 2 2 1 0.5 2 0.5 1
Planning Budget Expenditure Equity Output Markets Up-take Use
Developing Sustaining
Enabling
Kenya average scores
Averages, LICs, GNI p.p. >US$500
SustainingDeveloping
Sources: CSO2 scorecard.
Source: CSO2 scorecard.
An AMCOW Country Status Overview

29
Water Supply and Sanitation in Kenya: Turning Finance into Services for 2015 and Beyond
1 Global Economic Monitor, The World Bank. 2010 average.
2 The first round of CSOs was carried out in 2006 covering 16 countries and is summarized in the report, ‘Getting Africa on Track to Meet the MDGs on Water and Sanitation’.
3 In the absence of baseline estimates derived using an identical methodology, it is not possible to formally estimate whether past coverage trends are sufficient to meet these targets.
4 MoWI (Ministry of Water and Irrigation). 2009. Sector Investment Plan for the Water and Sanitation Sector in Kenya.
5 SIPcoverageestimatesareadjustedfromthoseoftheKenyaIntegrated Household; targets are based on subsectortargets in the National Water Services Strategy (MoWI, 2007) and the national development plan, Vision 2030 (Ministry of State for Planning, National Development, and Vision 2030, 2008).
6 JMP estimates are based on a linear regression of nationally representative household surveys. Notwithstanding the different definition of improved water supply access, the JMP estimates for Kenya are reasonably robust, since the trend line is calculated using linear regression of a reasonable number of household survey results, with few outliers.
7 The annual investment requirements for the SIM are calculated from the ‘base year’ of 2006 (the year in which the Kenya Integrated Budget Survey was completed). For the CSO2 scenario investment requirements are calculated from 2008 (latest year included in the JMP 2010 update). In both cases the assumption is that the annual investment requirement was actually met in past years (2006–09 for the SIM, 2008–09 for the CSO2 costing model). If the required investment was not in fact met in those years, the annual investment requirements for future years must be revised upwards. Given allocations and expenditure rates in previous years, it is more likely that investment requirements are underestimated, than overestimated.
8 Due to rounding, component figures may not sum to totals.
9 In the absence of an official 1990 government baseline for 1990, the latest JMP coverage estimates are shown.
10 GTZ/MoWI. 2009. Improving Urban Sanitations Systems: Wastewater Treatment Plants. A Rapid Response toImprove Environmental Sanitation.
NotesandReferences
11 The CSO2 scorecard methodology and conceptual framework are discussed in detail in the synthesis report.
12 MoWI. 2007. National Water Services Strategy 2007–2015;and2009.SectorInvestmentPlanfortheWaterandSanitation Sector in Kenya.
13 Ministry of Health. 2007. National Environmental Sanitation and Hygiene Policy.
14 Indicators relating to the Institutional framework section are as follows: All subsectors: targets in national development plans/PRSP; subsector policy agreed andapproved (gazetted as part of national policy or as standalonepolicy);RWS/UWS:institutionalrolesdefined;RSH/USH:institutionalleadappointed.
15 Institutional roles and relationships in the water and sanitation sector will be reviewed and aligned with the Constitution of Kenya 2010.
16 WASREB(WaterServicesRegulatoryBoard).2007.Impact:APerformanceReportofKenya’sWaterServicesSubsector,IssueNo.1;and2009.IssueNo.2.
17 The main financial relationship between WS providers and WSBs takes the form of a lease fee, based on a fixed percentage of revenues billed. This is unrelated to the WSB’s actual costs such as asset development and administrative costs. Furthermore, WSBs pass on a part of the lease fee to local authorities, regardless of whether they have serviced loans related to the assets, that is, have actually paid for them.
18 Castalia.2009.ReviewofImplementationofKenyaWaterServices Transfer Plan. Final report to MoWI and WSP 2009.
19 Indicators relating to section on Financing and its Implementation are as follows: All subsectors: programmatic Sector-Wide Approach; investment program based onMDGneedsassessment;sufficientfinancetomeetMDG(andsubsidypolicy inthecaseofsanitation);percentofofficialdonorcommitmentsutilized;percentofdomesticcommitments utilized.
20 Water Services Trust Fund. 2008. Strategic Plan 2008–2012;MoWI.2007.Pro-PoorImplementationPlan.
21 Ministry of Finance/EC. 2008. PEFA Public Financial ManagementPerformanceAssessmentReportforKenya,p 6.

An AMCOW Country Status Overview
22 The eThekwini declaration, agreed at the AfricaSan+5 conference, called for African countries to commit at least 0.5 percent of GDP to sanitation and hygiene. It should be pointed out that the MoPHS’s ESH budget line is the only discernible budget line which goes largely to sanitation. Other sanitation expenditure may be being routed elsewhere through the MoPHS and MoWI, but cannot be traced.
23 Ministry of Finance. 2009. Quarterly Economic and BudgetaryReview.ThirdQuarter2008/09,p14.
24 IEA. 2008. Water and Sanitation sector. Budget Performance 2003–2008 and Emerging Policy Issues.
25 Water Services Trust Fund. 2008. Strategic Plan 2008–2012.
26 MoWI and Development Partners. 2008. Water Sector in Kenya: A Sector-Wide Approach to Planning, Partnership Principles.
27 According to a recent review the SWAp arrangements have “worked well in terms of discussing sector issues. Actual results in terms of harmonized and aligned practices (are) still at an embryonic stage: GoK-donor cooperation restricts itself to bilateral agreements and some pooled funding”; Train4Dev. 2009. Report on the SWAp JointLearning Event in support of the water sector in Kenya, Annex 6, 29.
28 Water Sector Technical Group. 2005 and 2008. Development Partner Matrix.
29 A microfinance credit window using the Output Based Aid approach.
30 Central Bank of Kenya. 2009. Invitation to Bid for Treasury Infrastructure Bond, IFB 1/2009/12.
31 Indicators relating to the M&E section are as follows: All subsectors: annual review setting newundertakings;subsector spend identifiable in budget (UWS: inc. recurrent subsidies);budgetcomprehensivelycoversdomestic/donorfinance;RWS,RSH,andUSH:domestic/donorexpenditurereported; UWS: audited accounts and balance sheetsfrom utilities; RWS, RSH, and USH: periodic analysis ofequitycriteriabyCSOsandgovernment;UWS:pro-poorplansdevelopedandimplementedbyutilities;RWS/UWS:nationally consolidated reporting of output; RSH/USH:monitoring of quantity and quality of uptake relative to promotion and subsidy efforts; all subsectors: questionsand choice options in household surveys consistent with MDG definitions.
32 WASREB.2007.Impact:APerformanceReportofKenya’sWaterServicesSubsector,IssueNo.1;and2009.IssueNo.2.
33 For example: MoWI. 2007. National Water Services Strategy 2007–2015 vs. MoWI. 2009. Water Sector Strategic Plan 2009–2013 (draft).
34 MoWI. 2007. Value for Money Study.
35 MoWI. 2007. Pro-Poor Implementation Plan.
36 MoWI. 2009. Sample Survey on Water Quality and Functionality of Water Systems.
37 Growth figures for the period vary considerably from 3.8 percent (UN) to 5.8 percent (KNBS). The latter figure is an overestimate due to a change in the definition used by the Housing and Population Census between 1989 and 1999. UN.2009.WorldPopulationProspects:The2008RevisionPopulation Database, and KNBS Housing and Population Census 1979, 1989, 1999, and 2009.
38 WASREB.2010.Impact:APerformanceReportofKenya’sWater Services Subsector.
39 MoWI. 2007. Pro-Poor Implementation Plan.
40 WASREB.2009.Impact:APerformanceReportofKenya’sWater Services Subsector, Issue No. 2.
41 The CSO2 investment requirement estimates do not include the cost of hygiene promotion and other software activities, relative to the targets, due to the difficulty of estimating such costs on a per capita basis.
42 Institute for Development Studies. 2009. ‘Beyond Subsidies: Triggering a Revolution in Rural Sanitation’;CSO2 interviews.
43 UNICEF, Government of Kenya, and WSP. 2007. Are Your Hands Clean Enough? Study of Handwashing with SoapBehaviorinKenya;MoWI.2008.SampleSurveyonSanitation 2008.
44 Orgut. 2009. Feasibility Study: The Provision of Water and Sanitation Services through the Health Sector. Final draft.
45 GTZ/MoWI. 2009. Improving Urban Sanitations Systems: Wastewater Treatment Plants. A Rapid Response toImprove Environmental Sanitation.
30

Notes

Notes


For enquiries, contact:Water and Sanitation Program–Africa RegionThe World Bank, Upper Hill RoadP.O. Box 30577, 00100, Nairobi, KenyaTel: +(254) 20 322 6300 E-mail: [email protected] site: www.wsp.org


![Water,Sanitation,andHygieneServiceAvailabilityatRural ... · inadequate water supply and sanitation [3]. Inadequate drinking water, sanitation, and hygiene in nonhousehold settings,](https://static.fdocuments.net/doc/165x107/5e81efd69f9e151ba6551f5b/watersanitationandhygieneserviceavailabilityatrural-inadequate-water-supply.jpg)


