Water Rights Documentation
24
Poseidon’s Justice Project: What-If Scenarios for Water Rights Team Members: Michael Stickel Yosef Gamble Alex Romano Zayne Betts Erin Palmer Faculty Advisor: Dr. Lulofs Client: Dr. Pease
-
Upload
yosef-gamble -
Category
Documents
-
view
104 -
download
0
Transcript of Water Rights Documentation
Poseidon’s Justice
Project: What-If Scenarios for Water Rights
Team Members:
Michael Stickel Yosef Gamble Alex Romano Zayne Betts Erin Palmer
Faculty Advisor: Dr. Lulofs Client: Dr. Pease
i
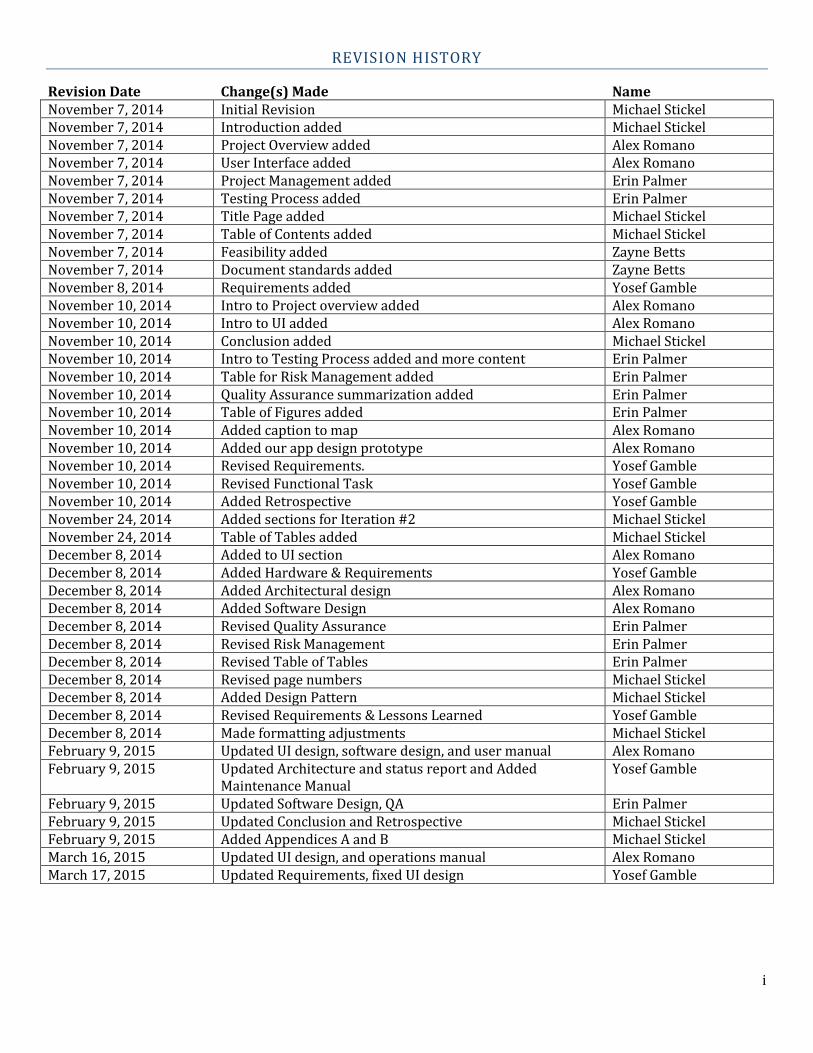
REVISION HISTORY
Revision Date Change(s) Made Name November 7, 2014 Initial Revision Michael Stickel November 7, 2014 Introduction added Michael Stickel November 7, 2014 Project Overview added Alex Romano November 7, 2014 User Interface added Alex Romano November 7, 2014 Project Management added Erin Palmer November 7, 2014 Testing Process added Erin Palmer November 7, 2014 Title Page added Michael Stickel November 7, 2014 Table of Contents added Michael Stickel November 7, 2014 Feasibility added Zayne Betts November 7, 2014 Document standards added Zayne Betts November 8, 2014 Requirements added Yosef Gamble November 10, 2014 Intro to Project overview added Alex Romano November 10, 2014 Intro to UI added Alex Romano November 10, 2014 Conclusion added Michael Stickel November 10, 2014 Intro to Testing Process added and more content Erin Palmer November 10, 2014 Table for Risk Management added Erin Palmer November 10, 2014 Quality Assurance summarization added Erin Palmer November 10, 2014 Table of Figures added Erin Palmer November 10, 2014 Added caption to map Alex Romano November 10, 2014 Added our app design prototype Alex Romano November 10, 2014 Revised Requirements. Yosef Gamble November 10, 2014 Revised Functional Task Yosef Gamble November 10, 2014 Added Retrospective Yosef Gamble November 24, 2014 Added sections for Iteration #2 Michael Stickel November 24, 2014 Table of Tables added Michael Stickel December 8, 2014 Added to UI section Alex Romano December 8, 2014 Added Hardware & Requirements Yosef Gamble December 8, 2014 Added Architectural design Alex Romano December 8, 2014 Added Software Design Alex Romano December 8, 2014 Revised Quality Assurance Erin Palmer December 8, 2014 Revised Risk Management Erin Palmer December 8, 2014 Revised Table of Tables Erin Palmer December 8, 2014 Revised page numbers Michael Stickel December 8, 2014 Added Design Pattern Michael Stickel December 8, 2014 Revised Requirements & Lessons Learned Yosef Gamble December 8, 2014 Made formatting adjustments Michael Stickel February 9, 2015 Updated UI design, software design, and user manual Alex Romano February 9, 2015 Updated Architecture and status report and Added
Maintenance Manual Yosef Gamble
February 9, 2015 Updated Software Design, QA Erin Palmer February 9, 2015 Updated Conclusion and Retrospective Michael Stickel February 9, 2015 Added Appendices A and B Michael Stickel March 16, 2015 Updated UI design, and operations manual Alex Romano March 17, 2015 Updated Requirements, fixed UI design Yosef Gamble
ii
TABLE OF CONTENTS
Table of Figures .................................................................................................................................................................. iii
Table of Tables ..................................................................................................................................................................... iv
Introduction ........................................................................................................................................................................... 1
Project Overview ................................................................................................................................................................. 1
Project Management .......................................................................................................................................................... 2
Process Model & Team Organization...................................................................................................................... 2
Risk Management ........................................................................................................................................................... 2
Software Development Tools..................................................................................................................................... 2
Requirements ........................................................................................................................................................................ 3
Hardware and Software Requirements ................................................................................................................. 3
Functional Requirements ............................................................................................................................................ 3
Nonfunctional Requirements..................................................................................................................................... 4
Feasibility ........................................................................................................................................................................... 5
Design ....................................................................................................................................................................................... 5
Architectural Design ..................................................................................................................................................... 5
User Interface Design ................................................................................................................................................... 7
Software Design............................................................................................................................................................ 10
Design Patterns............................................................................................................................................................. 10
Database Design ........................................................................................................................................................... 10
Quality Assurance ............................................................................................................................................................. 10
Document Standards .................................................................................................................................................. 11
Coding Standards ......................................................................................................................................................... 11
Change Control Process ............................................................................................................................................ 12
Testing Process ............................................................................................................................................................. 12
Operation Manual ............................................................................................................................................................. 12
Maintenance Manual ....................................................................................................................................................... 13
Conclusion ........................................................................................................................................................................... 13
Retrospective ................................................................................................................................................................. 13
Status Report ................................................................................................................................................................. 14
Lessons Learned ............................................................................................................................................................... 14
Appendix A: Functions ................................................................................................................................................... 15
Appendix B: Tables .......................................................................................................................................................... 18
iii
TABLE OF FIGURES
Figure 1: Use case for interaction with user interface .............................................................................................. 4 Figure 2: Architectural Design ............................................................................................................................................ 6 Figure 3: Development Architecture Design ................................................................................................................. 6 Figure 4: Current application .............................................................................................................................................. 7 Figure 5: Our addition ............................................................................................................................................................ 8 Figure 6: Current app with addition ................................................................................................................................. 9 Figure 7: Group workflow ..................................................................................... Error! Bookmark not defined. Figure 8: Iteration 1 Burndown Chart (Effort is in Story Points) ......... Error! Bookmark not defined.
iv
TABLE OF TABLES
Table 1: Risk Management Analysis ................................................................................................................................. 2 Table 2: Hardware and Software Requirements ......................................................................................................... 3 Table 3: Functional task descriptions .............................................................................................................................. 4 Table 4: Bare Bones Version ................................................................................................................................................ 5 Table 5: Enhanced Version ................................................................................................................................................... 5 Table 6: Project report ........................................................................................................................................................ 14 Table 7: Project Metrics ...................................................................................................................................................... 14
1
INTRODUCTION
Central Washington University’s Center for Spatial Information has requested features that will allow users to create what-if scenarios for determining the best distribution ratio for water rights in Kittitas County. Our project will be building off of a web-based system that they currently have in place that utilizes ArcGIS for displaying mapping and monitoring water rights and water distribution in the Kittitas County.
The main feature that we will be implementing in our project is the ability for the User to determine different what-if scenarios for water rights in Kittitas County depending on the amount of rain fall at a given time. The User will be able to set theoretical levels of rain fall by use of a slider, prompting the interface to display the required data. To do this, the interface will be linked to both a climate database and a geo-spatial water database.
By providing this documentation, we hope to include those involved with this project throughout the course of our iterative process. Although we will continue to meet with the Client and our Project Advisor, this report will provide a formal means of monitoring the project’s progress that can be referred to at any time as well as providing a guide for us in the creation of the project. The major sections that will be covered in this document include:
Project Overview – provides an overview of the project
Project management - explains how we will be tackling the issue
Requirements – describes the requirements given to us by the client
Design – provides a look into the design of our project
Quality Assurance – insures a plan to produce a quality, uniform project
Conclusion – provides an overview of the entire iteration and what needs to be worked on for
iteration #2
PROJECT OVERVIEW
In this section we will identify all parties involved in this project and their roles. We will go over the application in its current state and what is to be added, and talk a little bit about we plan to solve this task.
Our client is Dr. Michael Pease, a professor in the Geography department of Central Washington University. He has requested that we expand on an already existing web application that he and other geographers in the Kittitas area use currently. Our stake holders involved are Dr. Michael Pease, our advisor, Dr. Ed Lulofs, Center for Spatial Information (CSI), and our team. What the application does now is it allows people to see a map of the Kittitas area and all the bodies of water contained in it. From the map view you are able to click on bodies of water to get more information about from the Department of Ecology.
What Dr. Pease would like to do with this application is to offer “what-if” scenarios to water levels in the area. These scenarios will test what would potentially happen if a certain body of water got more or less water than usual. Our solution is to add a toolbar to the existing application that will allow the user to test these scenarios. This solution needs to be developed rather than bought because we are adding features and usability to an existing application. As far as we know there is nothing you can buy to do this for you.
2
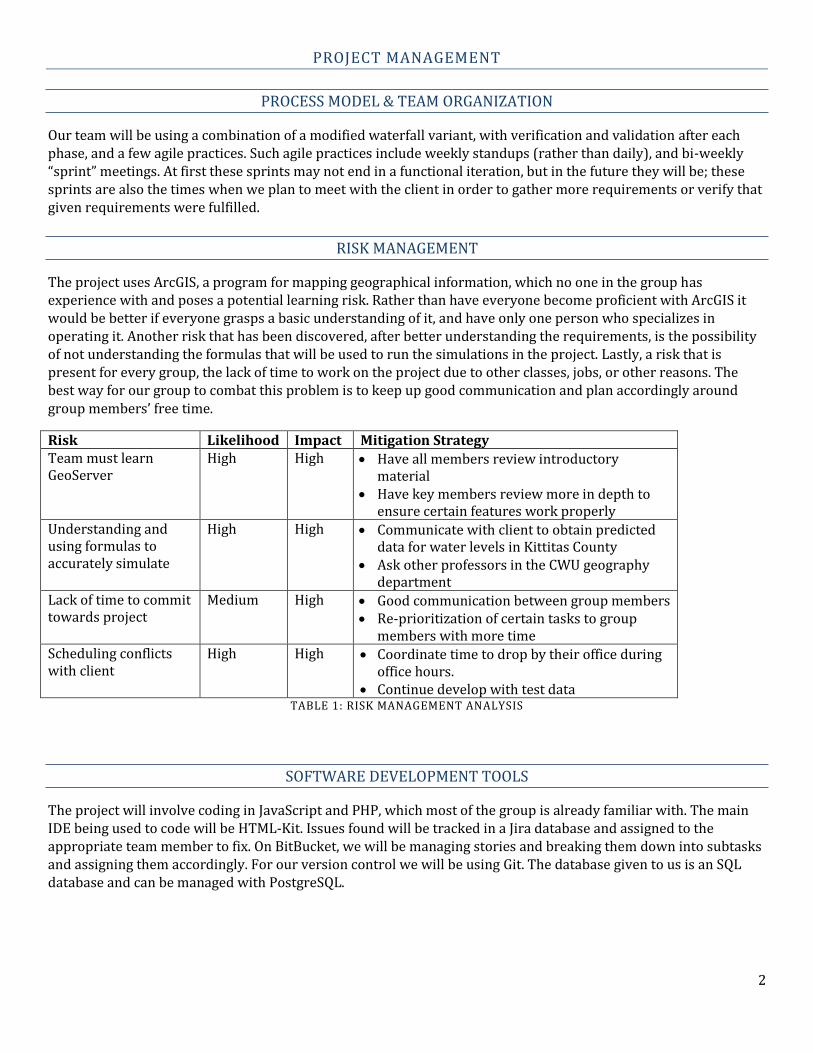
PROJECT MANAGEMENT
PROCESS MODEL & TEAM ORGANIZATION
Our team will be using a combination of a modified waterfall variant, with verification and validation after each phase, and a few agile practices. Such agile practices include weekly standups (rather than daily), and bi-weekly “sprint” meetings. At first these sprints may not end in a functional iteration, but in the future they will be; these sprints are also the times when we plan to meet with the client in order to gather more requirements or verify that given requirements were fulfilled.
RISK MANAGEMENT
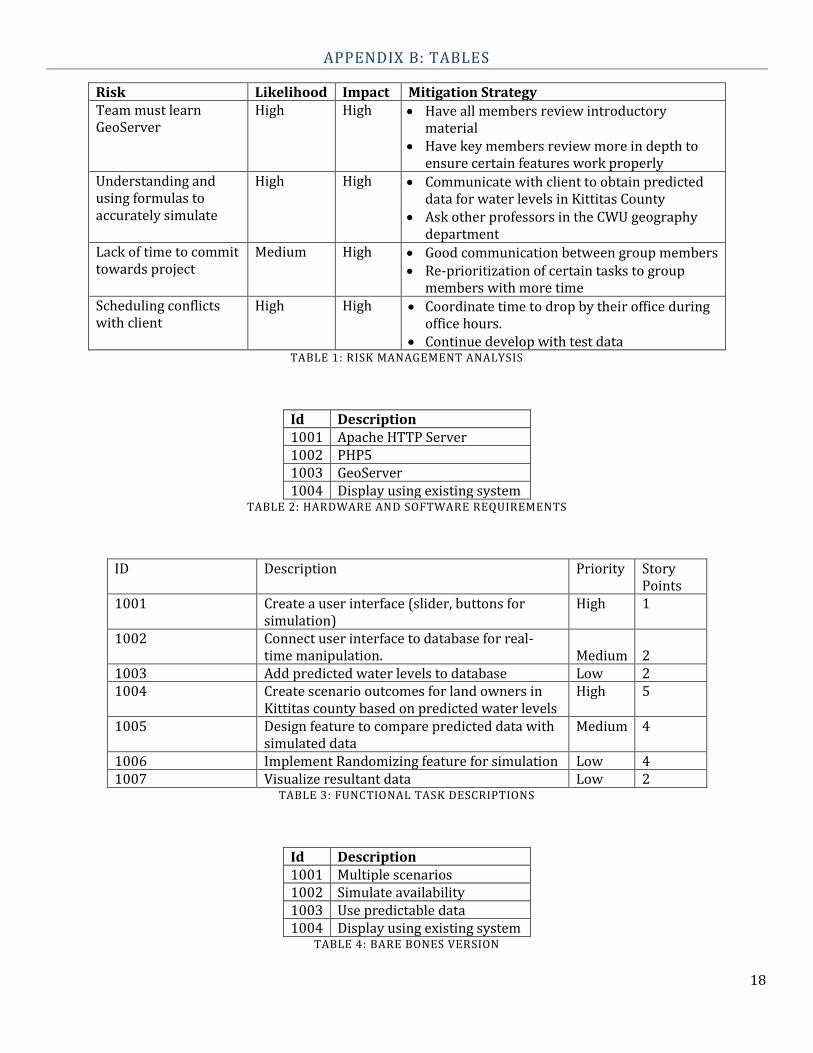
The project uses ArcGIS, a program for mapping geographical information, which no one in the group has experience with and poses a potential learning risk. Rather than have everyone become proficient with ArcGIS it would be better if everyone grasps a basic understanding of it, and have only one person who specializes in operating it. Another risk that has been discovered, after better understanding the requirements, is the possibility of not understanding the formulas that will be used to run the simulations in the project. Lastly, a risk that is present for every group, the lack of time to work on the project due to other classes, jobs, or other reasons. The best way for our group to combat this problem is to keep up good communication and plan accordingly around group members’ free time.
Risk Likelihood Impact Mitigation Strategy Team must learn GeoServer
High High Have all members review introductory material
Have key members review more in depth to ensure certain features work properly
Understanding and using formulas to accurately simulate
High High Communicate with client to obtain predicted data for water levels in Kittitas County
Ask other professors in the CWU geography department
Lack of time to commit towards project
Medium High Good communication between group members Re-prioritization of certain tasks to group
members with more time Scheduling conflicts with client
High High Coordinate time to drop by their office during office hours.
Continue develop with test data TABLE 1: RISK MANAGEMENT ANALYSIS
SOFTWARE DEVELOPMENT TOOLS
The project will involve coding in JavaScript and PHP, which most of the group is already familiar with. The main IDE being used to code will be HTML-Kit. Issues found will be tracked in a Jira database and assigned to the appropriate team member to fix. On BitBucket, we will be managing stories and breaking them down into subtasks and assigning them accordingly. For our version control we will be using Git. The database given to us is an SQL database and can be managed with PostgreSQL.
3
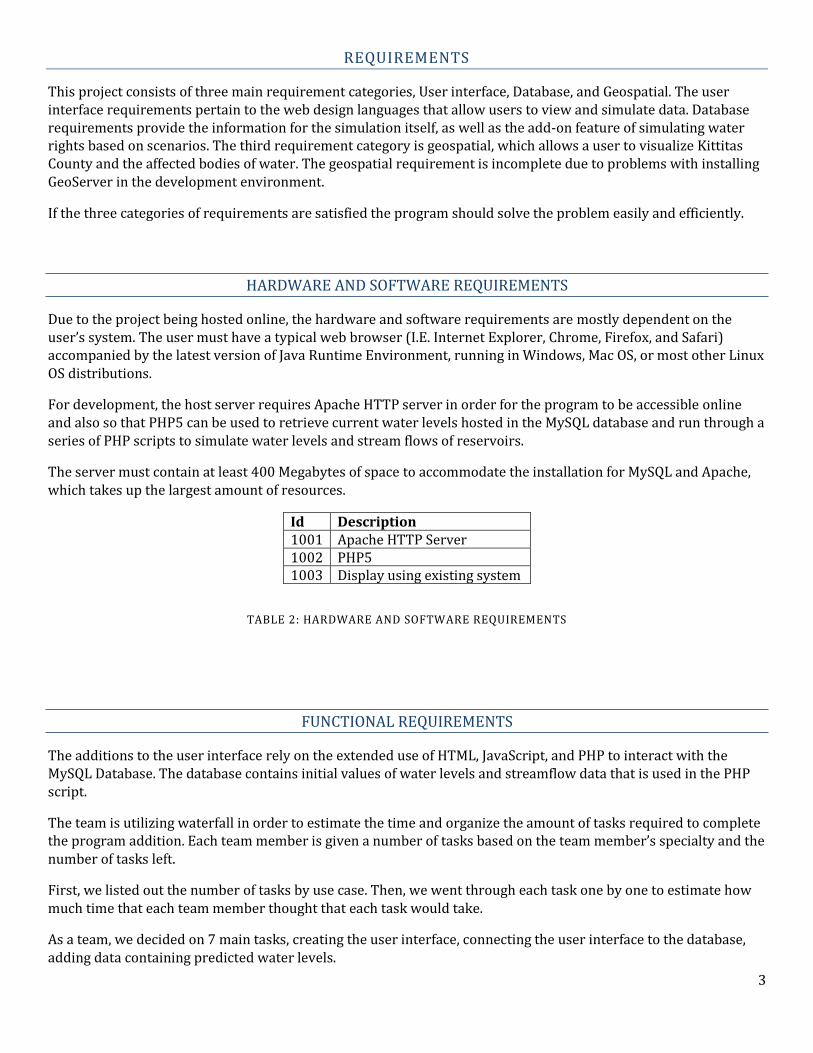
REQUIREMENTS
This project consists of three main requirement categories, User interface, Database, and Geospatial. The user interface requirements pertain to the web design languages that allow users to view and simulate data. Database requirements provide the information for the simulation itself, as well as the add-on feature of simulating water rights based on scenarios. The third requirement category is geospatial, which allows a user to visualize Kittitas County and the affected bodies of water. The geospatial requirement is incomplete due to problems with installing GeoServer in the development environment.
If the three categories of requirements are satisfied the program should solve the problem easily and efficiently.
HARDWARE AND SOFTWARE REQUIREMENTS
Due to the project being hosted online, the hardware and software requirements are mostly dependent on the user’s system. The user must have a typical web browser (I.E. Internet Explorer, Chrome, Firefox, and Safari) accompanied by the latest version of Java Runtime Environment, running in Windows, Mac OS, or most other Linux OS distributions.
For development, the host server requires Apache HTTP server in order for the program to be accessible online and also so that PHP5 can be used to retrieve current water levels hosted in the MySQL database and run through a series of PHP scripts to simulate water levels and stream flows of reservoirs.
The server must contain at least 400 Megabytes of space to accommodate the installation for MySQL and Apache, which takes up the largest amount of resources.
Id Description 1001 Apache HTTP Server 1002 PHP5 1003 Display using existing system
TABLE 2: HARDWARE AND SOFTWARE REQUIREMENTS
FUNCTIONAL REQUIREMENTS
The additions to the user interface rely on the extended use of HTML, JavaScript, and PHP to interact with the MySQL Database. The database contains initial values of water levels and streamflow data that is used in the PHP script.
The team is utilizing waterfall in order to estimate the time and organize the amount of tasks required to complete the program addition. Each team member is given a number of tasks based on the team member’s specialty and the number of tasks left.
First, we listed out the number of tasks by use case. Then, we went through each task one by one to estimate how much time that each team member thought that each task would take.
As a team, we decided on 7 main tasks, creating the user interface, connecting the user interface to the database, adding data containing predicted water levels.
4
FUNCTIONAL REQUIREMENTS TASKS
ID Description Priority Story Points
1001 Create a user interface (slider, buttons for simulation)
High 1
1002 Connect user interface to database for real-time manipulation.
Medium
2
1003 Add predicted water levels to database Low 2 1004 Create scenario outcomes for land owners in
Kittitas county based on predicted water levels High 5
1005 Design feature to compare predicted data with simulated data
Medium 4
1006 Implement Randomizing feature for simulation Low 4 1007 Visualize resultant data Low 2
TABLE 3: FUNCTIONAL TASK DESCRIPTIONS
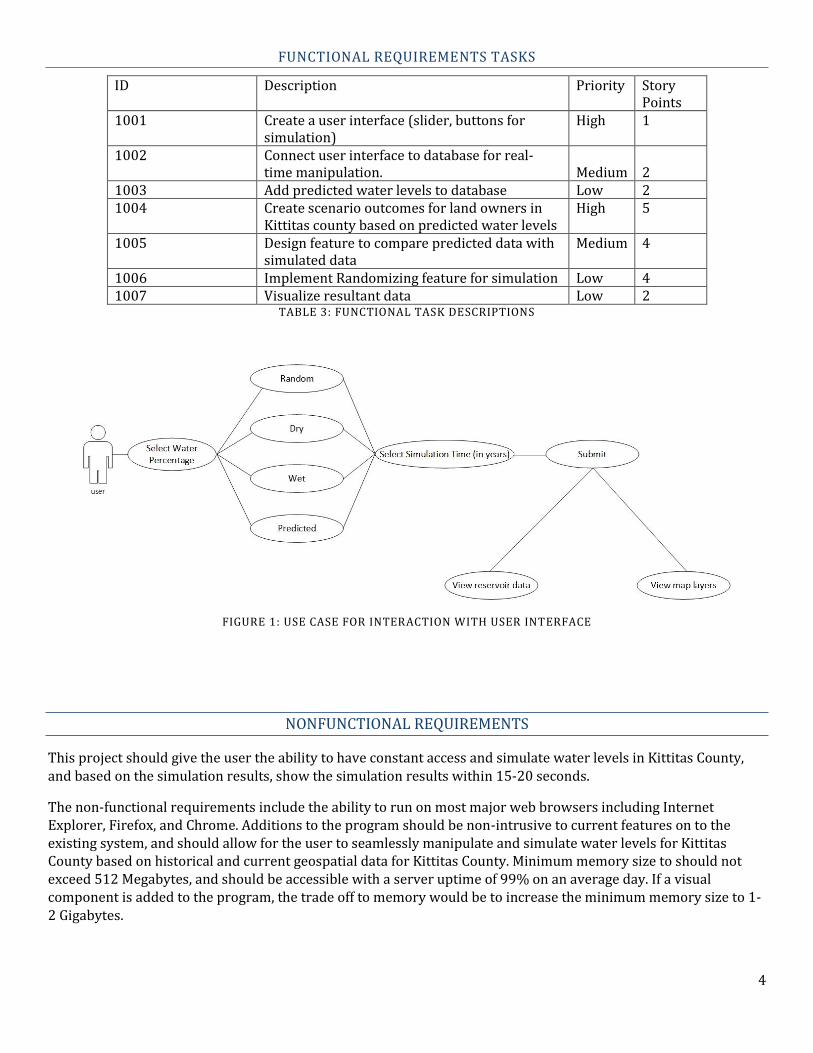
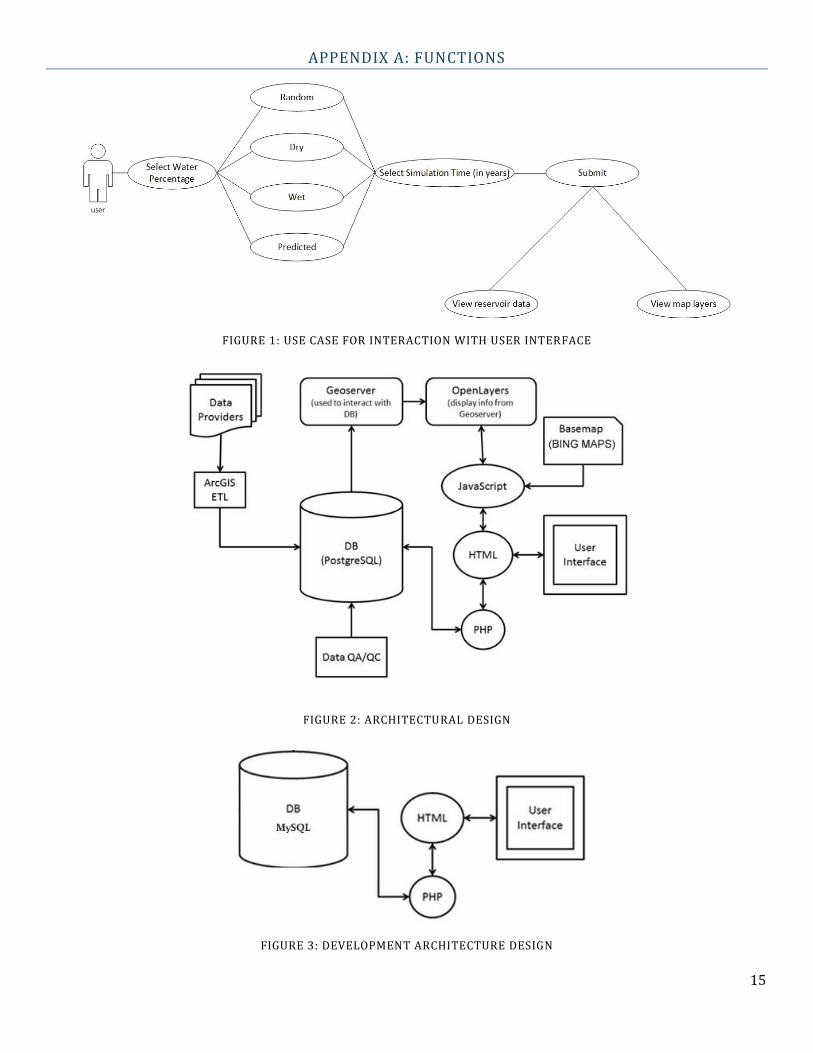
FIGURE 1: USE CASE FOR INTERACTION WITH USER INTERFACE
NONFUNCTIONAL REQUIREMENTS
This project should give the user the ability to have constant access and simulate water levels in Kittitas County, and based on the simulation results, show the simulation results within 15-20 seconds.
The non-functional requirements include the ability to run on most major web browsers including Internet Explorer, Firefox, and Chrome. Additions to the program should be non-intrusive to current features on to the existing system, and should allow for the user to seamlessly manipulate and simulate water levels for Kittitas County based on historical and current geospatial data for Kittitas County. Minimum memory size to should not exceed 512 Megabytes, and should be accessible with a server uptime of 99% on an average day. If a visual component is added to the program, the trade off to memory would be to increase the minimum memory size to 1-2 Gigabytes.
5
FEASIBILITY
Completing the essential requirements for the system is very feasible in the time we are given. Because the project is building onto an existing system all of the requirements are additions to the current system in order to create more functionality. The essential additions to the system will allow users to run simulations to determine who has rights to the water that is available depending on availability. Other potential additions that could be made in the enhanced system could simulate the economic impact of water levels.
SYSTEM
ESSENTIAL SYSTEM
The essential system for the water right's simulator must allow for multiple scenarios, simulate water availability for 3-4 years, use real world predictable data in the simulations, and display the information using the existing system.
Id Description 1001 Multiple scenarios 1002 Simulate availability 1003 Use predictable data 1004 Display using existing system
TABLE 4: BARE BONES VERSION
ENHANCED SYSTEM
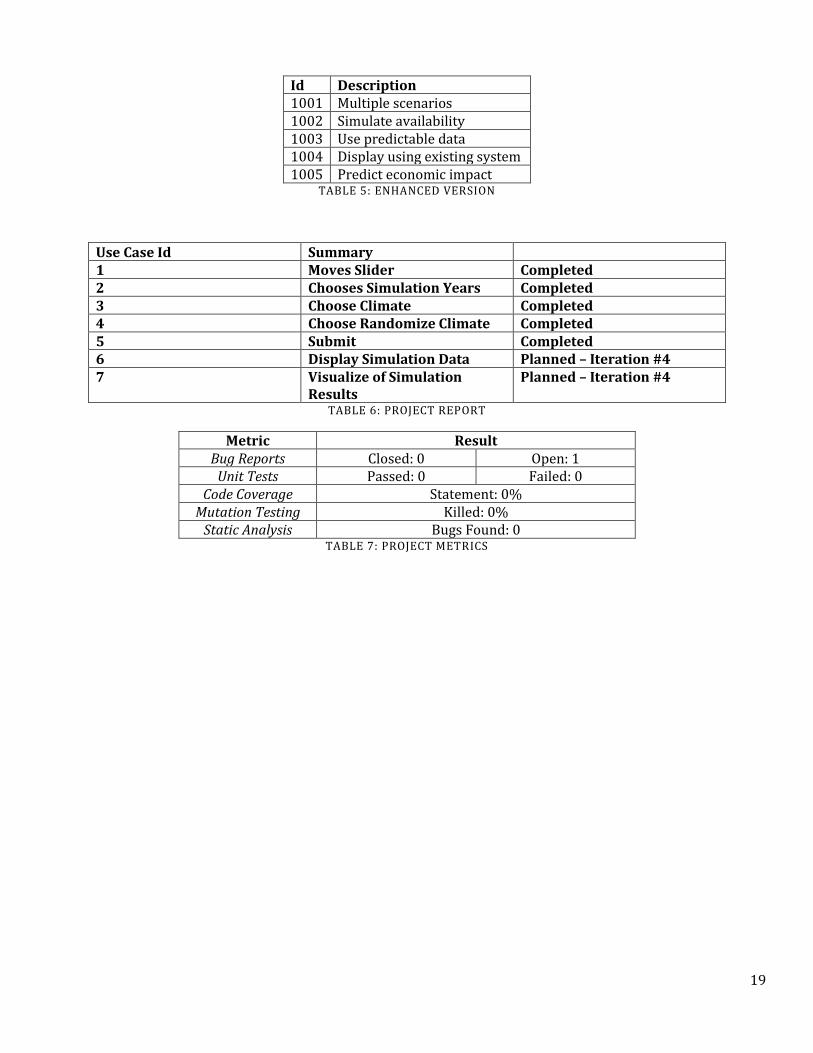
The enhanced version of the water right's simulator will include all the features of the essential system, as well as features to predict economic impact.
Id Description 1001 Multiple scenarios 1002 Simulate availability 1003 Use predictable data 1004 Display using existing system 1005 Predict economic impact
TABLE 5: ENHANCED VERSION
DESIGN
The design for a majority of this project has already been created, so the extent of the design process is to add additional modules that will separate the simulation functionality from the current visual components of map layers that present reservoirs, rivers, wells, etc.
ARCHITECTURAL DESIGN
In this section we will briefly explain what different components of the system we are using and how they interact with each other. Also we will mention what changes we will make to their existing components.
6
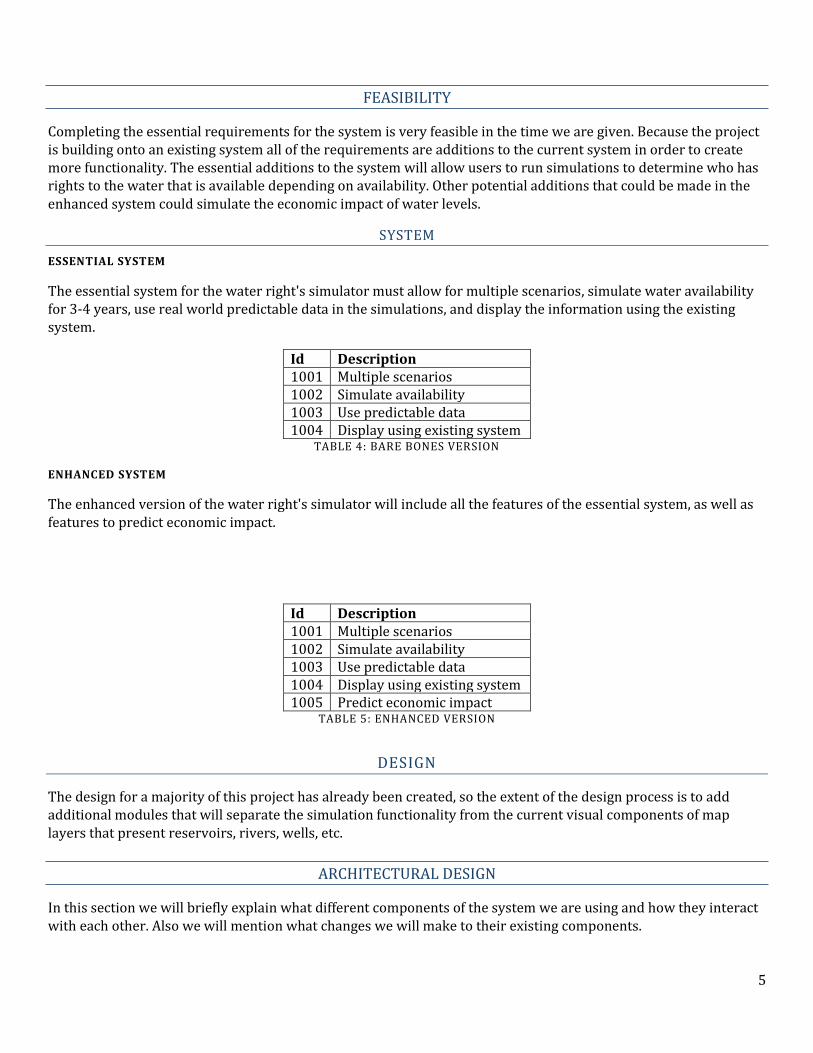
Pictured below is a high-level view of all the components of the program that our design was based from. All of these pieces are already in place on the geography department’s server; however we must change them to fit the requirements of our program. For instance, a user interface was programmed to leave out unused search functions and information, which required creating new a new database and web pages.
FIGURE 2: ARCHITECTURAL DESIGN
In the base product that is ran by the Geography Department, PostgreSQL holds data that is provided by ArcGIS and various governmental data sources to provide for the geospatial data of Kittitas County. GeoServer retrieves the data to create layers in conjunction with OpenLayers to provide a user with a visual of the county. Bing Maps, and OpenLayers interact with both PHP and JavaScript to allow users to view data, search for specific reservoirs and rivers, and activate/deactivate layers from being viewable in the user interface.
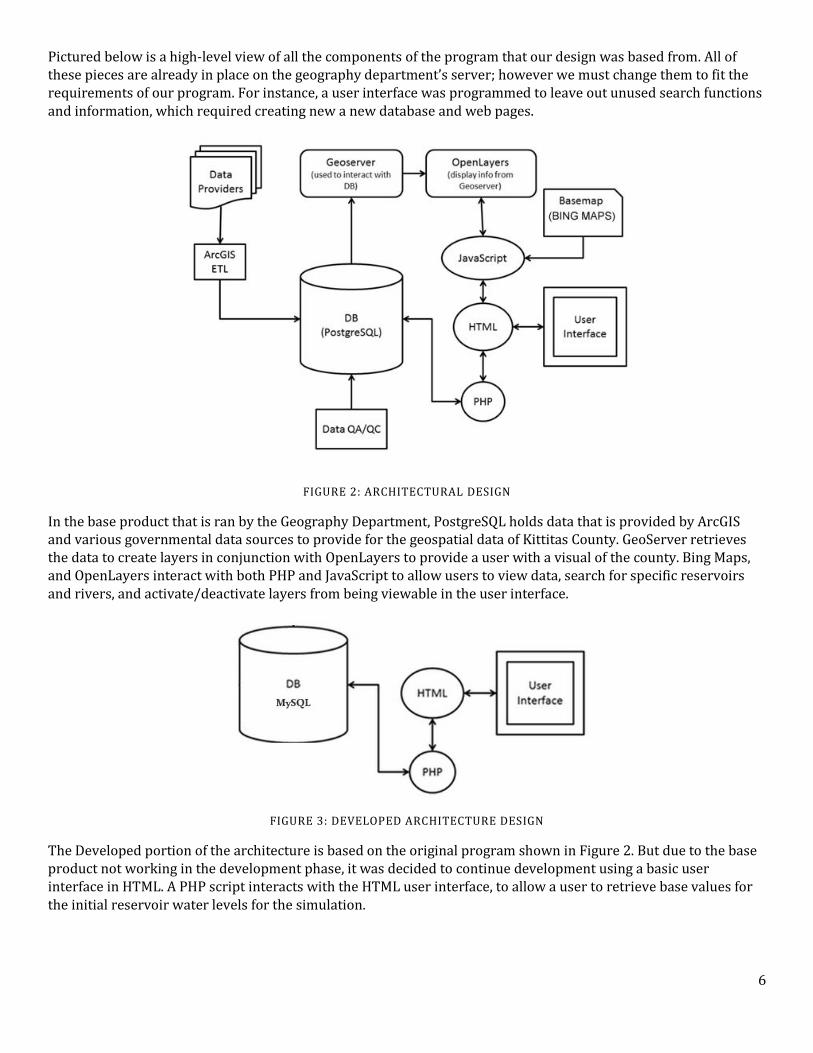
FIGURE 3: DEVELOPED ARCHITECTURE DESIGN
The Developed portion of the architecture is based on the original program shown in Figure 2. But due to the base product not working in the development phase, it was decided to continue development using a basic user interface in HTML. A PHP script interacts with the HTML user interface, to allow a user to retrieve base values for the initial reservoir water levels for the simulation.
7
USER INTERFACE DESIGN
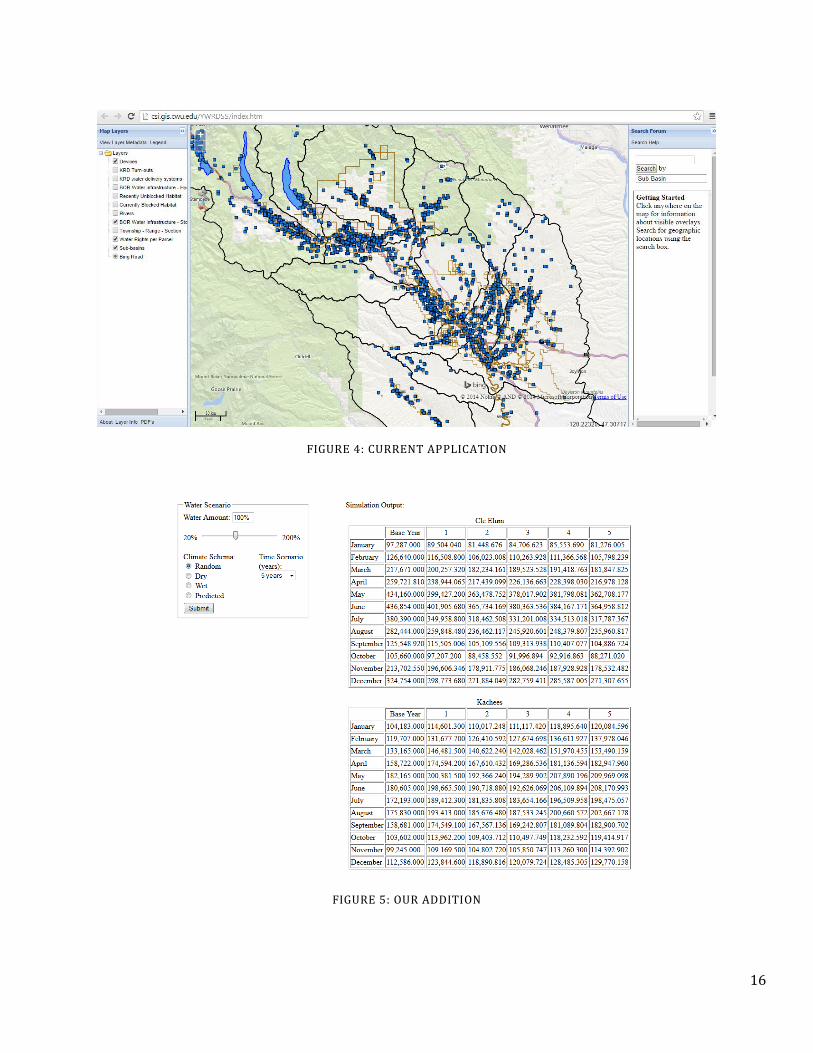
In this section we provide a look and description of what the user interface does currently. Then we give an idea of what the user interface should look like and do once we are done with this project.
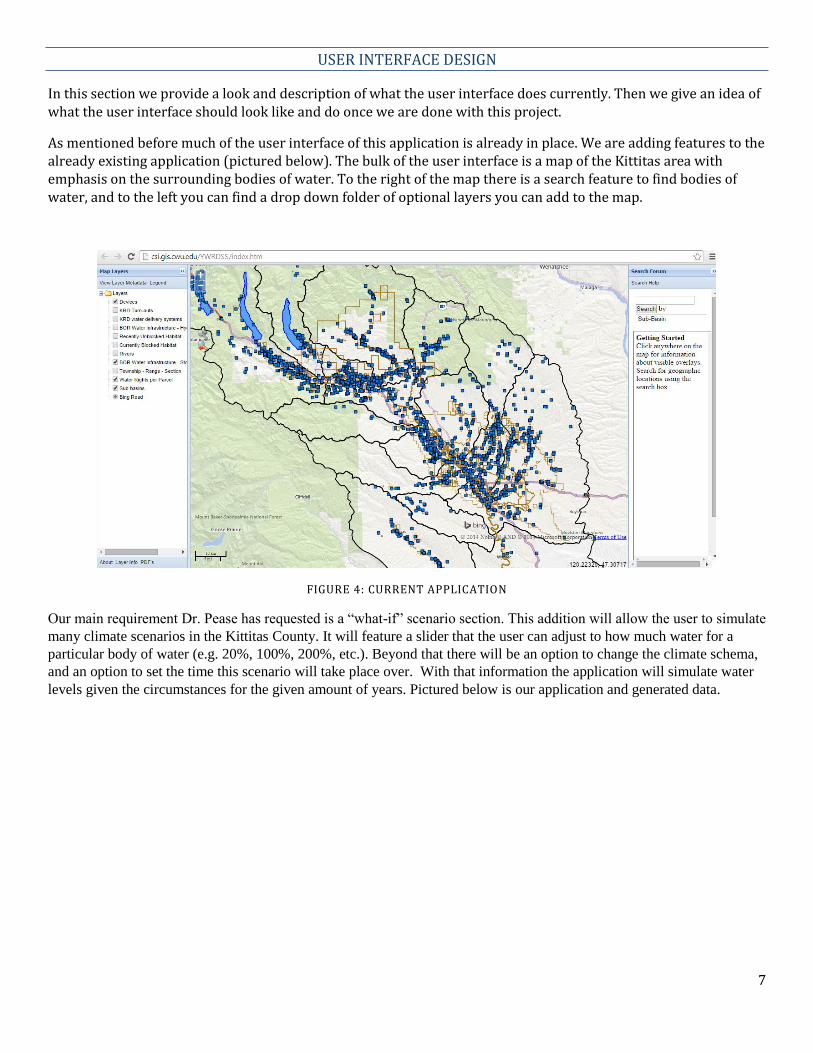
As mentioned before much of the user interface of this application is already in place. We are adding features to the already existing application (pictured below). The bulk of the user interface is a map of the Kittitas area with emphasis on the surrounding bodies of water. To the right of the map there is a search feature to find bodies of water, and to the left you can find a drop down folder of optional layers you can add to the map.
FIGURE 4: CURRENT APPLICATION
Our main requirement Dr. Pease has requested is a “what-if” scenario section. This addition will allow the user to simulate
many climate scenarios in the Kittitas County. It will feature a slider that the user can adjust to how much water for a
particular body of water (e.g. 20%, 100%, 200%, etc.). Beyond that there will be an option to change the climate schema,
and an option to set the time this scenario will take place over. With that information the application will simulate water
levels given the circumstances for the given amount of years. Pictured below is our application and generated data.
8
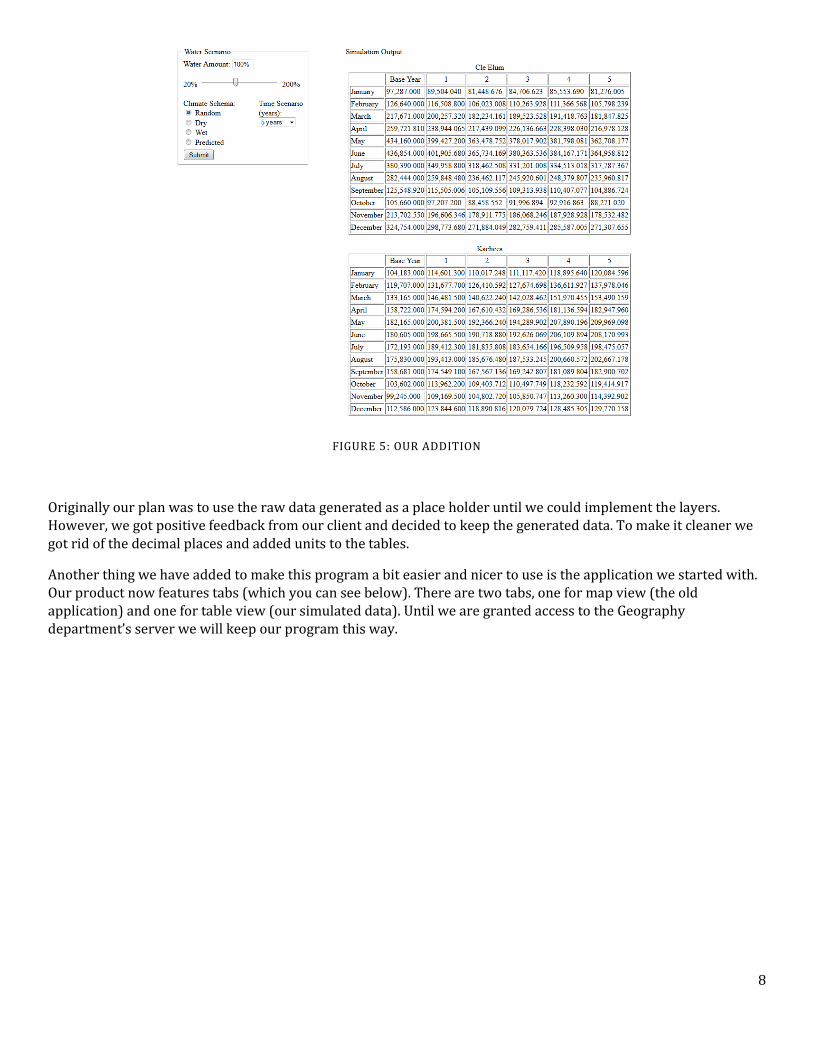
FIGURE 5: OUR ADDITION
Originally our plan was to use the raw data generated as a place holder until we could implement the layers. However, we got positive feedback from our client and decided to keep the generated data. To make it cleaner we got rid of the decimal places and added units to the tables.
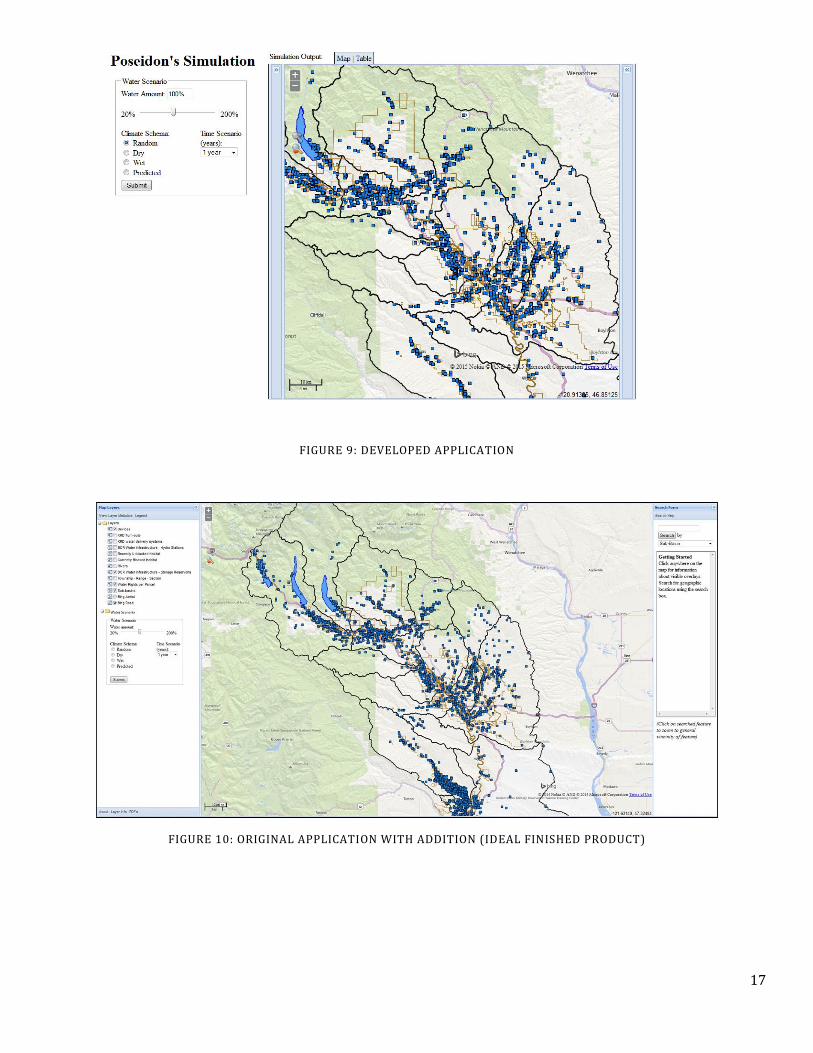
Another thing we have added to make this program a bit easier and nicer to use is the application we started with. Our product now features tabs (which you can see below). There are two tabs, one for map view (the old application) and one for table view (our simulated data). Until we are granted access to the Geography department’s server we will keep our program this way.
9
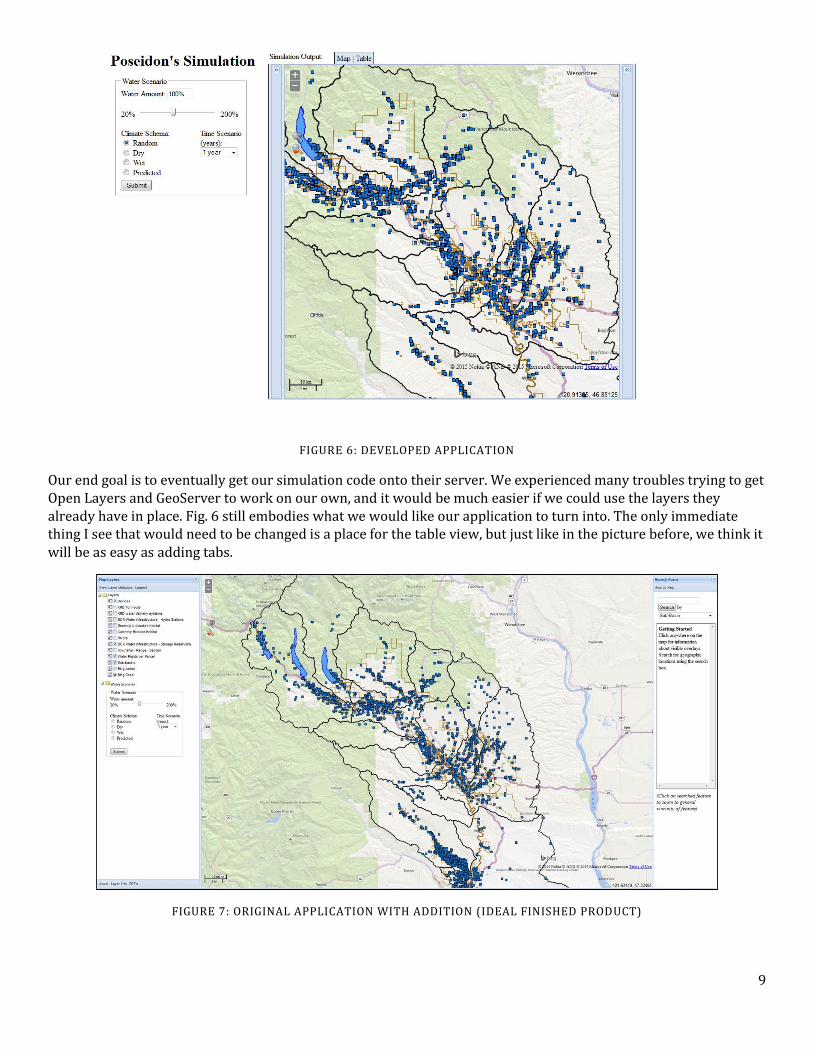
FIGURE 6: DEVELOPED APPLICATION
Our end goal is to eventually get our simulation code onto their server. We experienced many troubles trying to get Open Layers and GeoServer to work on our own, and it would be much easier if we could use the layers they already have in place. Fig. 6 still embodies what we would like our application to turn into. The only immediate thing I see that would need to be changed is a place for the table view, but just like in the picture before, we think it will be as easy as adding tabs.
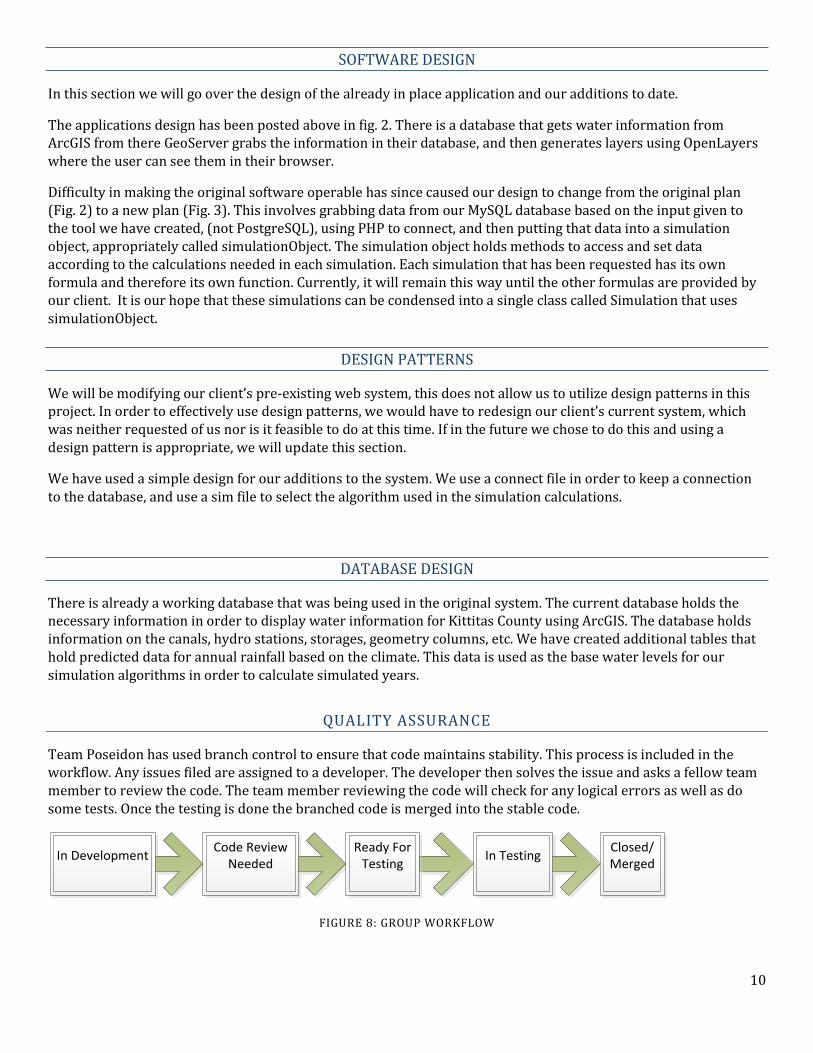
FIGURE 7: ORIGINAL APPLICATION WITH ADDITION (IDEAL FINISHED PRODUCT)
10
SOFTWARE DESIGN
In this section we will go over the design of the already in place application and our additions to date.
The applications design has been posted above in fig. 2. There is a database that gets water information from ArcGIS from there GeoServer grabs the information in their database, and then generates layers using OpenLayers where the user can see them in their browser.
Difficulty in making the original software operable has since caused our design to change from the original plan (Fig. 2) to a new plan (Fig. 3). This involves grabbing data from our MySQL database based on the input given to the tool we have created, (not PostgreSQL), using PHP to connect, and then putting that data into a simulation object, appropriately called simulationObject. The simulation object holds methods to access and set data according to the calculations needed in each simulation. Each simulation that has been requested has its own formula and therefore its own function. Currently, it will remain this way until the other formulas are provided by our client. It is our hope that these simulations can be condensed into a single class called Simulation that uses simulationObject.
DESIGN PATTERNS
We will be modifying our client’s pre-existing web system, this does not allow us to utilize design patterns in this project. In order to effectively use design patterns, we would have to redesign our client’s current system, which was neither requested of us nor is it feasible to do at this time. If in the future we chose to do this and using a design pattern is appropriate, we will update this section.
We have used a simple design for our additions to the system. We use a connect file in order to keep a connection to the database, and use a sim file to select the algorithm used in the simulation calculations.
DATABASE DESIGN
There is already a working database that was being used in the original system. The current database holds the necessary information in order to display water information for Kittitas County using ArcGIS. The database holds information on the canals, hydro stations, storages, geometry columns, etc. We have created additional tables that hold predicted data for annual rainfall based on the climate. This data is used as the base water levels for our simulation algorithms in order to calculate simulated years.
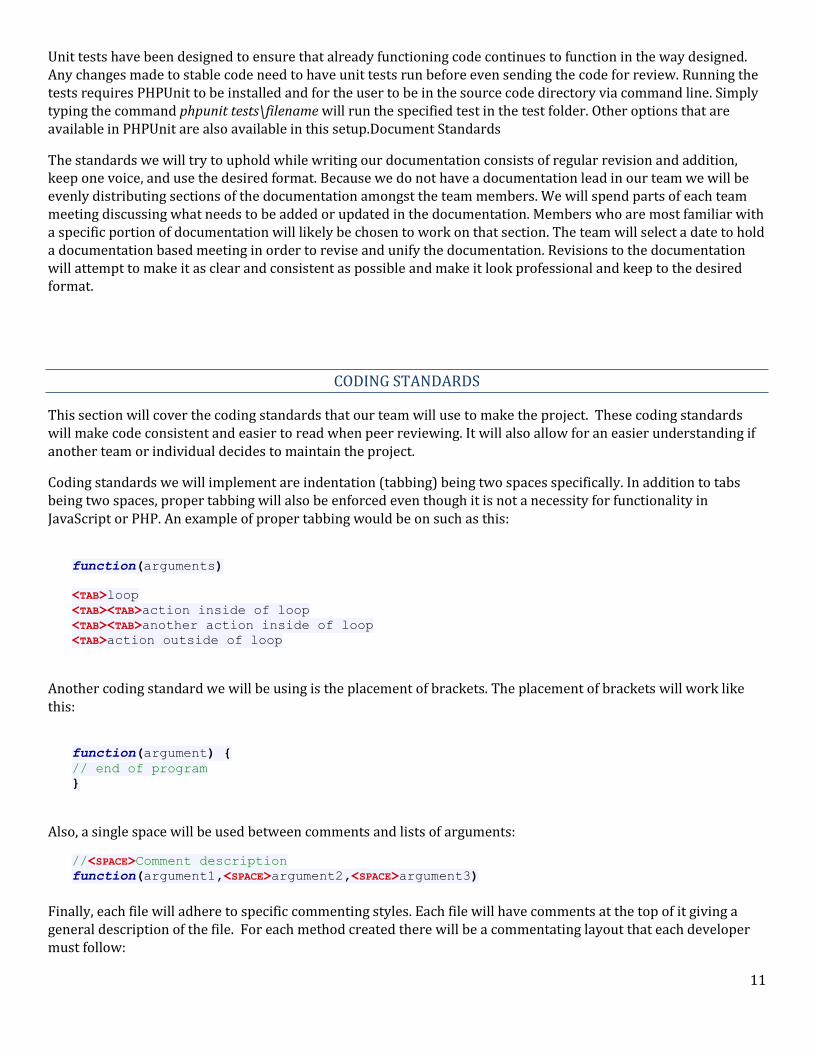
QUALITY ASSURANCE
Team Poseidon has used branch control to ensure that code maintains stability. This process is included in the workflow. Any issues filed are assigned to a developer. The developer then solves the issue and asks a fellow team member to review the code. The team member reviewing the code will check for any logical errors as well as do some tests. Once the testing is done the branched code is merged into the stable code.
FIGURE 8: GROUP WORKFLOW
In Development
Code Review Needed
In Testing
Closed/Merged
Ready For Testing
11
Unit tests have been designed to ensure that already functioning code continues to function in the way designed. Any changes made to stable code need to have unit tests run before even sending the code for review. Running the tests requires PHPUnit to be installed and for the user to be in the source code directory via command line. Simply typing the command phpunit tests\filename will run the specified test in the test folder. Other options that are available in PHPUnit are also available in this setup.Document Standards
The standards we will try to uphold while writing our documentation consists of regular revision and addition, keep one voice, and use the desired format. Because we do not have a documentation lead in our team we will be evenly distributing sections of the documentation amongst the team members. We will spend parts of each team meeting discussing what needs to be added or updated in the documentation. Members who are most familiar with a specific portion of documentation will likely be chosen to work on that section. The team will select a date to hold a documentation based meeting in order to revise and unify the documentation. Revisions to the documentation will attempt to make it as clear and consistent as possible and make it look professional and keep to the desired format.
CODING STANDARDS
This section will cover the coding standards that our team will use to make the project. These coding standards will make code consistent and easier to read when peer reviewing. It will also allow for an easier understanding if another team or individual decides to maintain the project.
Coding standards we will implement are indentation (tabbing) being two spaces specifically. In addition to tabs being two spaces, proper tabbing will also be enforced even though it is not a necessity for functionality in JavaScript or PHP. An example of proper tabbing would be on such as this:
function(arguments)
<TAB>loop
<TAB><TAB>action inside of loop
<TAB><TAB>another action inside of loop
<TAB>action outside of loop
Another coding standard we will be using is the placement of brackets. The placement of brackets will work like this:
function(argument) {
// end of program
}
Also, a single space will be used between comments and lists of arguments:
//<SPACE>Comment description
function(argument1,<SPACE>argument2,<SPACE>argument3)
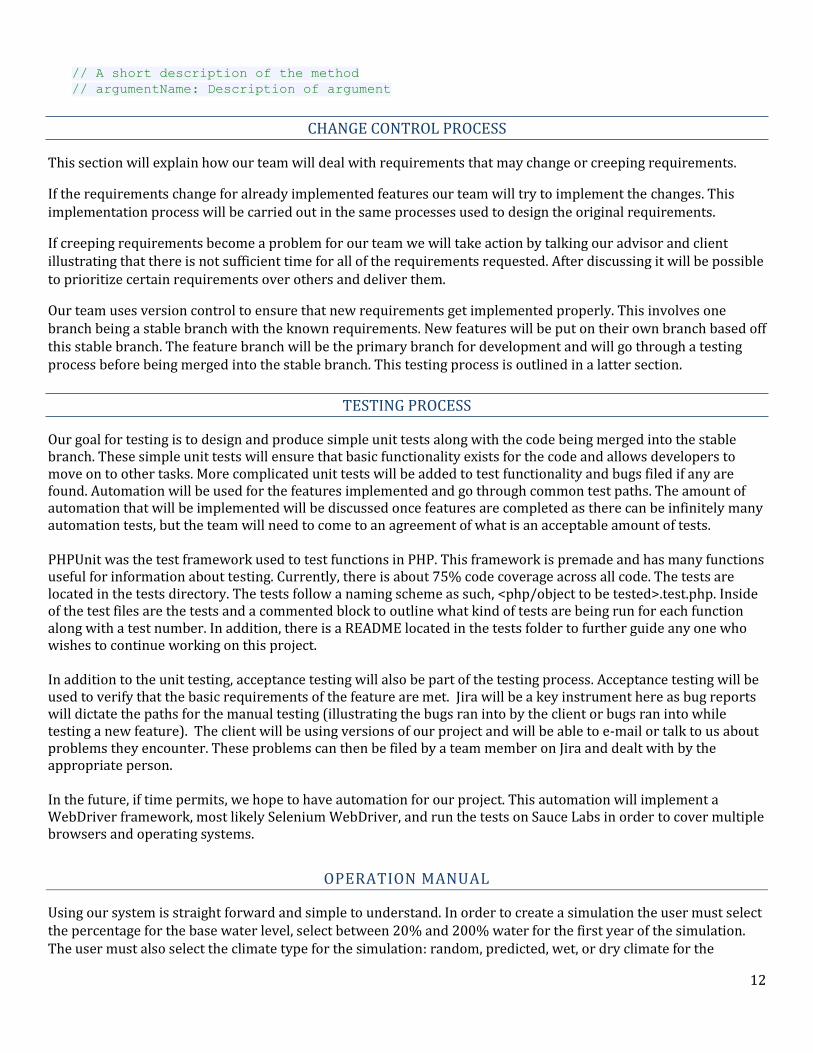
Finally, each file will adhere to specific commenting styles. Each file will have comments at the top of it giving a general description of the file. For each method created there will be a commentating layout that each developer must follow:
12
// A short description of the method
// argumentName: Description of argument
CHANGE CONTROL PROCESS
This section will explain how our team will deal with requirements that may change or creeping requirements.
If the requirements change for already implemented features our team will try to implement the changes. This implementation process will be carried out in the same processes used to design the original requirements.
If creeping requirements become a problem for our team we will take action by talking our advisor and client illustrating that there is not sufficient time for all of the requirements requested. After discussing it will be possible to prioritize certain requirements over others and deliver them.
Our team uses version control to ensure that new requirements get implemented properly. This involves one branch being a stable branch with the known requirements. New features will be put on their own branch based off this stable branch. The feature branch will be the primary branch for development and will go through a testing process before being merged into the stable branch. This testing process is outlined in a latter section.
TESTING PROCESS
Our goal for testing is to design and produce simple unit tests along with the code being merged into the stable branch. These simple unit tests will ensure that basic functionality exists for the code and allows developers to move on to other tasks. More complicated unit tests will be added to test functionality and bugs filed if any are found. Automation will be used for the features implemented and go through common test paths. The amount of automation that will be implemented will be discussed once features are completed as there can be infinitely many automation tests, but the team will need to come to an agreement of what is an acceptable amount of tests. PHPUnit was the test framework used to test functions in PHP. This framework is premade and has many functions useful for information about testing. Currently, there is about 75% code coverage across all code. The tests are located in the tests directory. The tests follow a naming scheme as such, <php/object to be tested>.test.php. Inside of the test files are the tests and a commented block to outline what kind of tests are being run for each function along with a test number. In addition, there is a README located in the tests folder to further guide any one who wishes to continue working on this project.
In addition to the unit testing, acceptance testing will also be part of the testing process. Acceptance testing will be used to verify that the basic requirements of the feature are met. Jira will be a key instrument here as bug reports will dictate the paths for the manual testing (illustrating the bugs ran into by the client or bugs ran into while testing a new feature). The client will be using versions of our project and will be able to e-mail or talk to us about problems they encounter. These problems can then be filed by a team member on Jira and dealt with by the appropriate person. In the future, if time permits, we hope to have automation for our project. This automation will implement a WebDriver framework, most likely Selenium WebDriver, and run the tests on Sauce Labs in order to cover multiple browsers and operating systems.
OPERATION MANUAL
Using our system is straight forward and simple to understand. In order to create a simulation the user must select the percentage for the base water level, select between 20% and 200% water for the first year of the simulation. The user must also select the climate type for the simulation: random, predicted, wet, or dry climate for the
13
duration of the simulation. Finally the user must select the length of the simulation: 1 to 5 or 10 years long. Once everything has been selected the user must press the submit button and the simulation will begin. Currently the simulation outputs the simulated data to a table separated by year and month. The numbers are in acre feet, which is an acre of area (66ft X 660ft) with a depth of 1 foot. The simulation will eventually create layers that will show the difference between original and simulated water levels.
In addition to this, we have also taken the original program and integrated it into our program. Now the user will see two tabs at the top of the page. Map view will show the user the map of the original program and it comes with all the functionality the program offers. However, if a simulation is run while in map view the view will automatically switch to table view; which offers raw data of the simulation you have just run. As of now running a simulation does not affect map view.
MAINTENANCE MANUAL
Installing the script requires apache2, MySQL, and php5 to be installed.
In windows, XAMPP, a server environment installs all of the required software. After XAMPP finishes installation, navigate to the root installation folder and open the file ‘xampp-control.exe’. Apache and MySQL needs to be started by clicking start button next to the label for both services. Once the Apache and MySQL label turn green in the XAMPP control window, use an internet browser and navigate to ‘localhost/phpmyadmin’. From there, navigate to Databases in the top left corner of the window and enter the name ‘water_levels’ and click Create. Once created, navigate to the newly created water_levels database. Then navigate to Import at the top menu, click choose file, upload water-rights. SQL from the root folder of the script, and click the ‘Go’ button. The script should simulate without additional edits to the code.
CONCLUSION
The problem presented to us by the client was to provide select users the ability to estimate what-if scenarios for water rights within Kittitas County up to ten years in advance. In order to solve this problem, we have provided a means for the user to select the number of years to be estimated, a percentage for the average water fall for those years, and the climate at that time – dry, wet, normal, or random. Once these values have been submitted, the simulation will run and calculate the estimated water levels for the desired years.
RETROSPECTIVE
Over the course of this project, we spent a lot of time trying to get in contact with the client. Our advisor has been very accessible, but due to class schedules, the entire team has not been able to commit to being a part of every meeting. As a result of late resources, no access to the client’s server, and an inability to reach the client when needed, we struggled to finish the project by the deadline.
As a team, we established a time to meet for our weekly meetings, both at the beginning and end of the week, in order to insure the best possible turnout. What could have been improved, is our communication with the client and establishing contact personally rather than via email or phone. Unfortunately, this form of communication was not an effective means of reaching the client either. Through the advisement of our advisor, we were able to establish a work around that got us through the presentations with working simulations. Because we never received access to the client’s server, we were unable to add our feature to their web system. However, we decided to implement the client’s web system in our feature instead, which allowed for us to show what it was capable of.
14
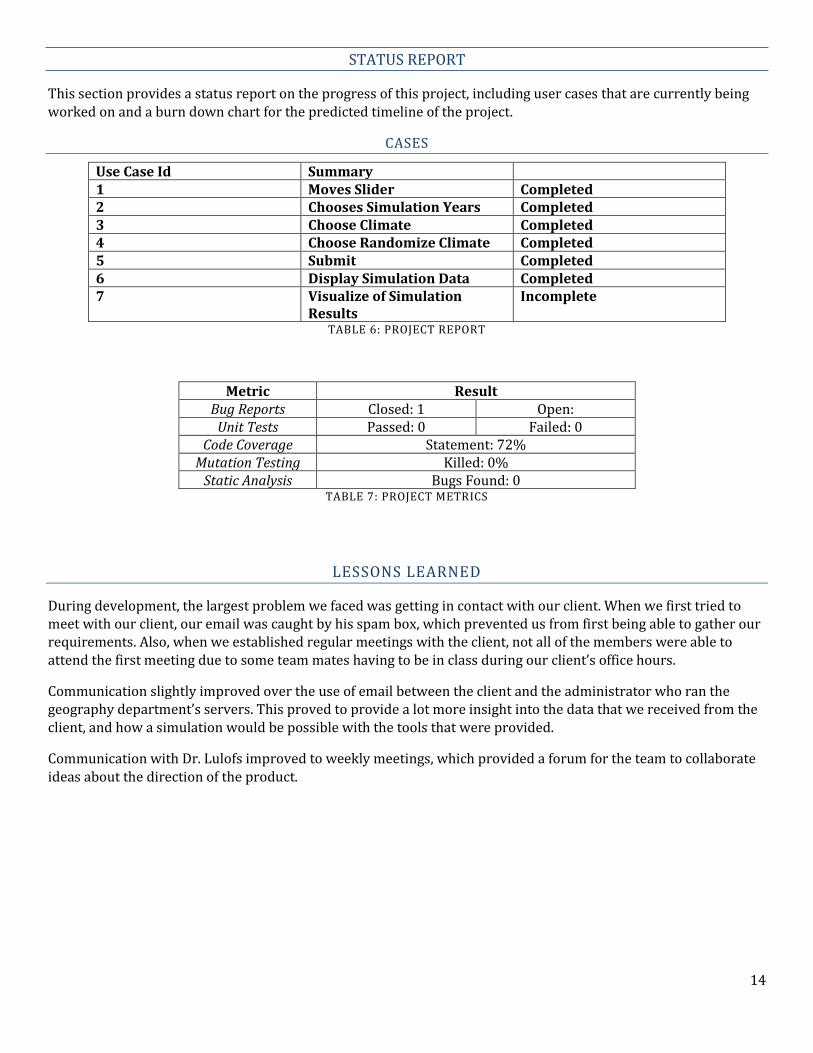
STATUS REPORT
This section provides a status report on the progress of this project, including user cases that are currently being worked on and a burn down chart for the predicted timeline of the project.
CASES
Use Case Id Summary 1 Moves Slider Completed 2 Chooses Simulation Years Completed 3 Choose Climate Completed 4 Choose Randomize Climate Completed 5 Submit Completed 6 Display Simulation Data Completed 7 Visualize of Simulation
Results Incomplete
TABLE 6: PROJECT REPORT
Metric Result Bug Reports Closed: 1 Open:
Unit Tests Passed: 0 Failed: 0 Code Coverage Statement: 72%
Mutation Testing Killed: 0% Static Analysis Bugs Found: 0
TABLE 7: PROJECT METRICS
LESSONS LEARNED
During development, the largest problem we faced was getting in contact with our client. When we first tried to meet with our client, our email was caught by his spam box, which prevented us from first being able to gather our requirements. Also, when we established regular meetings with the client, not all of the members were able to attend the first meeting due to some team mates having to be in class during our client’s office hours.
Communication slightly improved over the use of email between the client and the administrator who ran the geography department’s servers. This proved to provide a lot more insight into the data that we received from the client, and how a simulation would be possible with the tools that were provided.
Communication with Dr. Lulofs improved to weekly meetings, which provided a forum for the team to collaborate ideas about the direction of the product.
15
APPENDIX A: FUNCTIONS
FIGURE 1: USE CASE FOR INTERACTION WITH USER INTERFACE
FIGURE 2: ARCHITECTURAL DESIGN
FIGURE 3: DEVELOPMENT ARCHITECTURE DESIGN
16
FIGURE 4: CURRENT APPLICATION
FIGURE 5: OUR ADDITION
17
FIGURE 9: DEVELOPED APPLICATION
FIGURE 10: ORIGINAL APPLICATION WITH ADDITION (IDEAL FINISHED PRODUCT)
18
APPENDIX B: TABLES
Risk Likelihood Impact Mitigation Strategy Team must learn GeoServer
High High Have all members review introductory material
Have key members review more in depth to ensure certain features work properly
Understanding and using formulas to accurately simulate
High High Communicate with client to obtain predicted data for water levels in Kittitas County
Ask other professors in the CWU geography department
Lack of time to commit towards project
Medium High Good communication between group members Re-prioritization of certain tasks to group
members with more time Scheduling conflicts with client
High High Coordinate time to drop by their office during office hours.
Continue develop with test data TABLE 1: RISK MANAGEMENT ANALYSIS
Id Description 1001 Apache HTTP Server 1002 PHP5 1003 GeoServer 1004 Display using existing system
TABLE 2: HARDWARE AND SOFTWARE REQUIREMENTS
ID Description Priority Story Points
1001 Create a user interface (slider, buttons for simulation)
High 1
1002 Connect user interface to database for real-time manipulation.
Medium
2
1003 Add predicted water levels to database Low 2 1004 Create scenario outcomes for land owners in
Kittitas county based on predicted water levels High 5
1005 Design feature to compare predicted data with simulated data
Medium 4
1006 Implement Randomizing feature for simulation Low 4 1007 Visualize resultant data Low 2
TABLE 3: FUNCTIONAL TASK DESCRIPTIONS
Id Description 1001 Multiple scenarios 1002 Simulate availability 1003 Use predictable data 1004 Display using existing system
TABLE 4: BARE BONES VERSION
19
Id Description 1001 Multiple scenarios 1002 Simulate availability 1003 Use predictable data 1004 Display using existing system 1005 Predict economic impact
TABLE 5: ENHANCED VERSION
Use Case Id Summary 1 Moves Slider Completed 2 Chooses Simulation Years Completed 3 Choose Climate Completed 4 Choose Randomize Climate Completed 5 Submit Completed 6 Display Simulation Data Planned – Iteration #4 7 Visualize of Simulation
Results Planned – Iteration #4
TABLE 6: PROJECT REPORT
Metric Result Bug Reports Closed: 0 Open: 1
Unit Tests Passed: 0 Failed: 0 Code Coverage Statement: 0%
Mutation Testing Killed: 0% Static Analysis Bugs Found: 0
TABLE 7: PROJECT METRICS