Water Resources Stewardship Report
88
National Park Service U.S. Department of the Interior Natural Resource Program Center Water Resources Stewardship Report Monocacy National Battlefield Natural Resource Technical Report NPS/NRPC/WRD/NRTR—2007/048
Transcript of Water Resources Stewardship Report

National Park Service U.S. Department of the Interior Natural Resource Program Center
Water Resources Stewardship Report Monocacy National Battlefield Natural Resource Technical Report NPS/NRPC/WRD/NRTR—2007/048

ON THE COVER Photographs: Monocacy National Battlefield taken by NPS National Capital Region Network staff

Water Resources Stewardship Report Monocacy National Battlefield Natural Resource Technical Report NPS/NRPC/WRD/NRTR—2007/048 Don Weeks David Vana-Miller National Park Service Water Resources Division P.O. Box 25287 Denver, Colorado 80225 Marian Norris National Park Service Inventory and Monitoring Program National Capital Region Network 4598 MacArthur Blvd., NW Washington, DC 20007 Andrew Banasik Monocacy National Battlefield 4801 Urbana Pike Frederick, MD 21704 August 2007 U.S. Department of the Interior National Park Service Natural Resources Program Center Fort Collins, Colorado
i

The Natural Resource Publication series addresses natural resource topics that are of interest and applicability to a broad readership in the National Park Service and to others in the management of natural resources, including the scientific community, the public, and the NPS conservation and environmental constituencies. Manuscripts are peer-reviewed to ensure that the information is scientifically credible, technically accurate, appropriately written for the intended audience, and is designed and published in a professional manner. The Natural Resources Technical Reports series is used to disseminate the peer-reviewed results of scientific studies in the physical, biological, and social sciences for both the advancement of science and the achievement of the National Park Service’s mission. The reports provide contributors with a forum for displaying comprehensive data that are often deleted from journals because of page limitations. Current examples of such reports include the results of research that addresses natural resource management issues; natural resource inventory and monitoring activities; resource assessment reports; scientific literature reviews; and peer reviewed proceedings of technical workshops, conferences, or symposia. Views, statements, findings, conclusions, recommendations and data in this report are solely those of the author(s) and do not necessarily reflect views and policies of the U.S. Department of the Interior, NPS. Mention of trade names or commercial products does not constitute endorsement or recommendation for use by the National Park Service. Printed copies of reports in these series may be produced in a limited quantity and they are only available as long as the supply lasts. This report is also available from the NPS Water Resources Division technical reports website on the internet, or by sending a request to the address on the back cover. (http://www.nature.nps.gov/water/wrdpub.cfm) Please cite this publication as: Weeks, D., D. Vana-Miller, M. Norris and A. Banasik. 2007. Water Resources Stewardship Report, Monocacy National Battlefield. Natural Resource Technical Report NPS/NRPC/WRD/NRTR—2007/048. National Park Service, Fort Collins, Colorado. NPS D-75, August 2007
ii

Contents Page
Contents ......................................................................................................................................... iii
Figures............................................................................................................................................ vi
Tables............................................................................................................................................ vii
Executive Summary ....................................................................................................................... ix
Introduction..................................................................................................................................... 1
National Park Service Planning Framework....................................................................... 1
Water Resources Stewardship Report Objectives............................................................... 3
Water Resources Stewardship Report and NEPA .............................................................. 3
National Battlefield Location and Demography ............................................................................. 5
Management Zones and Desired Conditions .................................................................................. 9
Water Resources Goals ..................................................................................................... 10
Description of Natural Resources ................................................................................................. 11
Climate.............................................................................................................................. 11
Physiography..................................................................................................................... 11
Geology............................................................................................................................. 12
Soils................................................................................................................................... 14
Hydrology ......................................................................................................................... 14
Watersheds............................................................................................................ 14
Surface Water........................................................................................................ 15
Rivers and Streams ................................................................................... 15
Wetlands and Riparian Areas............................................................................................ 15
Ground Water.................................................................................................................... 20
Water Quality.................................................................................................................... 20
iii

Air Quality ........................................................................................................................ 21
Biological Resources ........................................................................................................ 22
Flora ...................................................................................................................... 22
Fauna..................................................................................................................... 22
National Capital Region Network, Inventory and Monitoring Program .......................... 23
National Battlefield Land Use .......................................................................................... 23
Fundamental and Important Water Resources.............................................................................. 25
National Battlefield Purpose and Significance ................................................................. 25
Indicators and Target Values ............................................................................................ 25
Chemical Indicators and Target Values............................................................................ 26
Water Temperature ............................................................................................... 26
Bacteria ................................................................................................................. 27
Dissolved Oxygen................................................................................................. 27
pH.......................................................................................................................... 27
Acid-Neutralizing Capacity .................................................................................. 28
Nutrients................................................................................................................ 28
Physical Indicators and Target Values.............................................................................. 29
Habitat Evaluation ................................................................................................ 29
Stream Classification ............................................................................................ 31
Aquifer Characteristics ......................................................................................... 31
Biological Indicators and Target Values........................................................................... 32
Water Resource Evaluation........................................................................................................... 35
Current Condition vs Target Value................................................................................... 35
Chemical Indicators .............................................................................................. 35
Biological Indicators............................................................................................. 37
iv

Physical Indicators ................................................................................................ 38
Stressors ........................................................................................................................................ 41
Non-Point Source Pollution .............................................................................................. 41
Crop Production.................................................................................................... 41
Livestock Production ............................................................................................ 41
Transportation and Utility Corridors .................................................................... 42
Point Source Pollution ...................................................................................................... 43
Wastewater Treatement Systems .......................................................................... 43
Underground Storage Tanks and Salvage Yard.................................................... 43
Hazardous Waste Spills ........................................................................................ 44
Land Use Influences on Aquatic Habitat .......................................................................... 44
Stream Morphology .............................................................................................. 44
Sedimentation ....................................................................................................... 44
Riparian Buffers.................................................................................................... 45
Water Demands..................................................................................................... 45
Non-native Plants.................................................................................................. 45
Strategies....................................................................................................................................... 47
Water Resource Goal: Chemical integrity of park waters (surface and ground waters) is improved and/or maintained to support all native life and meet or exceed designated use standards ........................................................................................................................... 47
Inventory and Monitoring:.................................................................................... 47
Riparian Restoration and Protection ..................................................................... 48
Hazardous Material Spill Prevention and Response............................................. 49
Cultural Landscape Management ......................................................................... 50
Other Management Strategies............................................................................... 53
v

Water Resource Goal: Hydrologic integrity of park waters (surface and ground waters) is improved and/or maintained to support natural geomorphic processes of fluvial and aquifer systems and to support native life......................................................................... 54
Inventory and Monitoring ..................................................................................... 54
Water Rights. ........................................................................................................ 57
Literature Cited ............................................................................................................................. 59
Figures
Page
Figure 1. The “new” NPS framework for planning and decision making ..................................... 2
Figure 2. Monocacy National Battlefield location map................................................................. 6
Figure 3. Monocacy National Battlefield existing farmsteads and management zones ................ 7
Figure 4. Monthly mean precipitation and air temperature range, Frederick, Maryland............. 11
Figure 5. Physiographic Provinces in Maryland........................................................................... 12
Figure 6. Monocacy National Battlefield geologic map.............................................................. 13
Figure 7. a) Location of Monocacy Watershed. b) Maryland Drainage Basins .......................... 16
Figure 8. Monocacy River, mean daily stream flow (2004-2007)................................................ 17
Figure 9. Stream and spring locations, Monocacy National Battlefield ....................................... 18
Figure 10. Monocacy National Battlefield sample locations....................................................... 36
vi

Tables Page
Table 1. Monocacy National Battlefield Management Zones and Desired Conditions for natural resources ........................................................................................................................................ 9
Table 2. Monocacy National Battlefield Water Resource Goals................................................. 10
Table 3. Importance of Riparian Buffers ..................................................................................... 19
Table 4. Qualitative habitat metrics used to assess stream condition ........................................... 31
Table 5. The new FIBI metrics and threshold values for streams in the Warmwater Highlands classification in Maryland............................................................................................................ 33
Table 6. The new BIBI metrics and threshold values for streams in the Combined Highlands classification in Maryland............................................................................................................ 33
Table 7. Narrative descriptions of stream biological integrity associated with categories of the IBI scores ..................................................................................................................................... 33
Table 8. Water quality samples not meeting established target value(s) in 2004........................ 35
Table 9. Percentage of water quality samples not meeting established target values(s) (2004-2006) ............................................................................................................................................ 36
Table 10. Percentage of water quality samples not meeting established target value(s) (2005-2006) ............................................................................................................................................ 37
Table 11. Index scores and target values for the five FIBI and BIBI sites at MONO................. 38
Table 12. BIBI metric scores for MONO sites ............................................................................ 38
Table 13. Physical Habitat Index scores and target values for MONO sites sampled by Hilderbrand et al. (2005).............................................................................................................. 38
Table 14. Qualitative suite of Habitat Metrics for MONO sites................................................... 39
Table 15. Mean and percent effectiveness of riparian buffers at removing nitrogen .................. 49
Table 16. Rosgen (1996) assessment levels for stream classification ......................................... 55
vii

viii

Executive Summary
This Water Resources Stewardship Report is one of several planning products offered by the NPS Water Resources Division that assist national park units with achieving or maintaining water resource integrity.
Water resources at Monocacy National Battlefield (MONO) play a vital role in the historic landscape, and should be managed to protect the character and quality of the national battlefield’s significant cultural resources and to preserve important interpretive views. MONO is also responsible for maintaining natural processes within the battlefield boundaries, which is supported by several laws and policies such as the National Park Service Organic Act (1916) and National Park Service Management Policies (2006). With the completion of MONO’s General Management Plan (GMP), the national battlefield will build from the GMP’s desired conditions for natural and cultural resources, determining the health of those resources and defining approaches (strategies) that move the resources toward the desired condition. This Water Resources Stewardship Report assists MONO with this process, defining water resource goals supporting the GMP desired conditions, evaluating water resource health, and identifying stressors negatively impacting the aquatic environments (streams, aquifers, wetlands, etc.). Strategies are then listed that begin to move MONO’s aquatic environments towards the water resource goals and ultimately towards the desired condition. Water Resource Goals Building from the MONO General Management Plan’s desired condition for the Natural Resources Zone (see below), two water resource goals were developed that support the desired condition. Monocacy National Battlefield Desired Condition (National Park Service, 2007):
“Natural resources would be maintained in as natural a state as possible, given cultural resource preservation needs. This would include maintaining riparian buffers for water quality, reestablishing native species, and controlling exotic vegetation. Any existing cultural and natural resources in this zone would be managed according to NPS policies, with minimal tolerance for disturbance.”
Monocacy National Battlefield Water Resource Goals
Goal A: Chemical integrity of park waters (surface and ground waters) is improved and/or maintained to support all native life and to meet or exceed designated use standards. Goal B: Hydrologic integrity of park waters (surface and ground waters) is improved and/or maintained to support natural geomorphic processes of fluvial and aquifer systems and to support native life.
ix

These water resource goals should be applied across all five management zones at MONO since influences to water resources (e.g., steams and aquifers) in one zone can impact water resources in another zone. Indicators, Target Values, and Water Resource Health Indicators were selected to provide a barometer of health for MONO’s water resources. Target values were established for the respective indicator parameters to distinguish between acceptable and unacceptable function of natural systems. These indicators provide a cost-effective way for park managers to monitor progress in maintaining or achieving target values that meet the water resource goal(s) and ultimately the national battlefield’s desired conditions for natural resources. With indicator parameters and target values established, the condition of MONO’s water resources was evaluated from existing monitoring information and a list of strategies was generated, based on resource conditions and stressors. Implementation of appropriate strategies will ultimately move MONO’s water resources (surface water and ground water) and associated environments (wetlands, riparian areas, floodplains, etc.) towards the established target values for the respective indicator parameters. The indicators and respective target values selected to assess water quality in the national battlefield are listed below. The percent of samples exceeding the target value are also listed, with impairment found in all indicators except for acid neutralizing capacity. Indicators Target Value Percent not
meeting Target Value
Number of samples
Water Temperature ≤ 75ºF (23.9°C) 17% 178 Dissolved Oxygen ≥ 5.0 mg/L 36% 166 pH 6.5 – 8.0 37% 171 Acid Neutralizing Capacity > 600 µeq/L 0% 44 Nitrate (interim target value) < 3.0 mg/L 32% 182 Nitrite (interim target value) < 0.010 mg/L 60% 5 Ammonia (interim target value) < 0.05 mg/L 36% 22 Orthophosphate (interim target value) < 0.010 mg/L 60% 5
x

The indicators and respective target values selected to assess biological health of four streams in the national battlefield are listed below using the Fish Index of Biological Integrity (FIBI) and the Benthic Index of Biological Integrity (BIBI). The condition of both fish and benthic fauna ranged from “very poor” to “fair” (Southerland et al., 2005a). Stream Fish Index of Biological
Integrity (condition) Target Value
Benthic Index of Biological Integrity (condition)
Target Value
“Old” Visitor Center Creek 2.7 - 3.0 (poor - fair) ≥ 4 2.1 - 2.6 (poor) ≥ 4 Harding’s Run 1.3 (very poor) ≥ 4 2.8 (poor) ≥ 4 Thomas Farm Creek No fish ≥ 4 1.9 (very poor) ≥ 4 Bush Creek 3.6 (fair) ≥ 4 3.4 (fair) ≥ 4 The indicators and respective target values selected to assess physical condition of four streams in the national battlefield are listed below using the Physical Habitat Index (PHI). Based on this evaluation, the quality of aquatic habitat ranged from “severely degraded” to “partially degraded” (Paul et al., 2002). Stream Physical Habitat Index Target Value “Old” Visitor Center Creek 69.6 – 75.9 (partially degraded) ≥ 81 Harding’s Run 56.6 (degraded) ≥ 81 Thomas Farm Creek 30.8 (severely degraded) ≥ 81 Bush Creek 74.1 (partially degraded) ≥ 81 Stressors The stressors contributing to degradation of MONO’s water resources include:
Influences from crop and livestock management (e.g., bacteria and nutrient pollution, erosion and sedimentation) within and outside the national battlefield boundary.
Lack of adequate riparian buffer along streams inside and outside the national battlefield degrading aquatic habitat (e.g., elevated stream temperatures, reduction of physical habitat, elevated erosion and sedimentation, reduction in pollutant filtration).
Influences from transportation corridors (railway, highway, and county roads) including runoff pollutants (e.g., chlorides) and potential hazardous material spills.
Failures in wastewater treatment systems, including septic systems, that impact surface and ground water resources (elevated bacteria and nutrients).
Leaking underground storage tanks contaminating shallow aquifers (petroleum contamination).
Increased regional population growth and development increasing water demands on surface and ground water resources and increasing impervious surfaces that increase runoff.
xi

Strategies The following strategies work towards improving water resource data collection and begin to address the known stressors, moving MONO’s water resources towards the water resource goals, and ultimately towards the desired condition. Water Quality Monitoring Program MONO and National Capitol Region Network (NCRN) staff should coordinate sampling efforts (water quality parameters, sample methodologies, and sample locations) between their respective water quality programs at the national battlefield (Conneely, 2004; National Park Service, 2005). This would enable the data generated from both programs to be used together for trend analyses. Sampling frequencies should also compliment each other to maximize efficiencies in seasonal evaluations and sampling costs. Nutrient Target Values Since there are no state criteria for nutrients, it is recommended that nutrient samples be concurrently collected with biological assessments in MONO to examine the statistical relationship between nutrient concentrations and the assessment endpoints, such as the fish and benthic indices of biotic integrity. Once clear nutrient relationships can be correlated with water resource health, park-specific numerical criteria can be determined that support the goals for MONO’s water resources. Until this has been completed, interim nutrient target values have been provided based on regional data. Riparian Restoration and Protection The national battlefield is encouraged to maximize riparian buffers along stream corridors. Riparian stream buffers are an effective solution to reduce sedimentation and stream erosion, filter pollutants, and maintaining natural stream temperatures. These riparian buffers must be established in keeping with MONO’s historic landscape (National Park Service, 2005). This report presents some of the latest information on stream responses to various riparian buffers, describing benefits from various riparian types (i.e., grass vs forest buffers) and riparian widths. Within the context of preserving the historic landscape at MONO, maximum benefits from riparian buffers to improve water quality and reduce erosion should be the objective. An approach, thought to maximize nutrient removal capacity of buffers to protect streams in agricultural use, involves a three-zone system (Schultz et al. 1995, National Resource Conservation Service, 2003) characterized by a zone of grasses and forbs immediately next to the area of disturbance, a middle zone of shrubs, and a zone of trees nearest to the stream channel. In theory, sediments and nutrients in surface runoff flowing from agricultural fields are intercepted first by the grass zone, while nutrients entering deeper subsurface pathways are taken up by shrub and tree roots (Natural Research Council, 2002).
xii

Hazardous Material Spill Prevention and Response Roadways and railways cross through the national battlefield and are used to transport a variety of products that include hazardous materials. A hazardous material spill along these transportation corridors could have serious consequences to the battlefield’s aquatic resources. Along with these external threats to hazardous materials, MONO manages hazardous materials for internal park operations (i.e., pesticides, paint, gasoline, etc.). These materials should be managed (following regulated containment and disposal procedures) to minimize potential impacts to the national battlefield’s environment. A Spill Contingency Plan (SCP) for the national battlefield should be prepared. The SCP should outline response procedures for small spills that can be addressed locally and identify notification and response procedures for larger spills that require immediate additional assistance. This includes coordination with the Maryland Department of Transportation, Federal Highway Administration, U.S. EPA, Maryland Department of the Environmental, Federal Emergency Management Agency, and other appropriate entities. Cultural Landscape Management Agricultural and livestock activities maintain the historic agrarian character of the national battlefield’s landscape. A management challenge for the National Park Service is maintaining the agrarian character while protecting natural resources. Agriculture encompasses approximately 760 acres within with 1355 acres of fee simple ownership. An agricultural Special Use Permit is issued to the farmer for a 5-year period, which outlines conditions placed on the operation of the farms. Some of these conditions include setting the stocking rate (number of livestock per acre), establishing and preserving riparian buffers, controlling noxious weeds, and requiring pesticide use applications and annual use logs. Per Maryland state law, each farmer is required to prepare and follow a Nutrient Management Plan. This plan analyzes the crop yield and nutrient requirements and levels and availability of nutrients in the soil to balance crop nutrient requirements and the amount and type of fertilizer that should be applied to the land. Crop Management: Pesticides, herbicides, and fertilizers should be used conservatively inside the boundaries of the national battlefield. The quantity, application methods, and timing of these chemical applications can influence offsite contamination of aquatic environments. Occasional pesticide sampling of MONO’s water resources is recommended during peak application periods and runoff events to evaluate efficiencies of the applications and best management practices that mitigate offsite migration. Coordination is also recommended with CSX Railroad and the Maryland Department of Transportation on herbicide use practices. Minimizing herbicide application should be encouraged whenever possible.
xiii

Developing procedures to work with Soil Conservation Districts regarding agricultural impacts is also recommended (Frederick County, 2004). This would include erosion control, crop rotation, nutrient management, soil conservation, and integrated pest management (National Park Service, 2005). Best management practices recommended by the Chesapeake Bay Program (2006a) that reduce or eliminate soil loss, prevent runoff, and provide for the proper application rates of nutrients to cropland include:
• Vegetated buffer strips at the edge of crop fields; • Conservation tillage that leaves at least 30% of the field surface covered with crop
residue after planting is completed and involves reduced or minimum tillage; • Strip cropping, where alternate strips of row crop or small grain and hay are planted in
the same field. There are three main types: contour strip cropping, field strip cropping and buffer strip cropping;
• Soil conservation and water quality planning; • Nutrient management planning; and • Stream bank fencing.
Livestock Management: Two of the three tributaries that empty into the Monocacy River flow through pastures where livestock have access to the streams. Impacts from livestock include increases in nutrient and bacteria levels, as well as sedimentation due to bank erosion from unrestricted cattle access (Conneely, 2004). Animal waste management includes manure storage structures, runoff controls for barnyards, guttering and nutrient management. These systems address the handling, storage, transport and utilization of animal waste as fertilizer on cropland (Chesapeake Bay Program, 2006a). Consideration for constructing wetlands within impacted drainages is recommended to assist in remediation of nutrient runoff from agricultural lands in MONO. Harding’s Run at the Baker Farm is one potential wetlands site for consideration. Fencing cattle from direct contact with streams will also improve water quality while protecting important riparian habitat that will further remediate contaminated runoff. Stream Channel Morphology MONO should classify its streams on the basis of channel morphology (physical parameters), providing an understanding of “stream health” and answering the questions, “Is the stream morphology (physical characteristics) impaired?...and if so, why?” One recommended stream classification method is described in Rosgen (1996). In this method, a combination of morphological variables important for different scales of analysis from coarse to
xiv

very fine resolutions are used to create the hierarchy for defining stream morphology. These four assessment levels for stream classification are outlined below. Rosgen (1996) assessment levels for stream classification. Level 1: describe the geomorphic characteristics that result from the integration of basin relief, landform and valley morphology. The dimension, pattern, form, and profile of rivers are used to delineate geomorphic types at a coarse-scale. Level 2: The channel entrenchment, dimensions, patterns, profile, and boundary materials are quantified and described by discreet categories of stream types. Level 3: Describes the existing condition of the stream as it relates to its stability, response potential, and function. At this level, additional field parameters are evaluated that influence the stream state (e.g., riparian vegetation, sediment supply, flow regime, debris occurrence, depositional features, channel stability, bank erodibility, and direct channel disturbances). Level 3 analyses are useful as a basis for integrating companion studies such as fish habitat indices and riparian surveys. Level 4: Verifies stream process relationships inferred from the preceding assessments. The objective is to establish empirical relationships for use in prediction. The developed empirical relationships are specific to individual stream types for a given state, and enable extrapolation to other similar reaches for which the Level 4 data is not available. Sediment Sedimentation derived from nonpoint sources is the major contributor to the Monocacy River’s water quality problems (Monocacy Scenic River Local Advisory Board, 1990). Sediment “pollution” is the number one impairment of streams nationwide (Southerland et al., 2005b). Best management practices that reduce sediment inputs into aquatic environments include riparian buffers, restrictive cattle access to streams, and proper hiking trail designs. For example, hiking trails should minimize impacts on steep slopes, highly erodible soils, hydric soils, wetlands, and floodplains (National Park Service, 2005). Floodplain Management Floodplains exist in the national battlefield where there are perennial and intermittent streams. Some of MONO’s historic structures are located within these floodplains and can be at risk to damage from flooding (National Park Service, 2007). In managing floodplains, the NPS will (1) manage for the preservation of floodplain values; (2) minimize potentially hazardous conditions associated with flooding; and (3) comply with the NPS Organic Act and all other federal laws and executive orders (i.e., Executive Order 11988: Floodplain Management, 2006 Park Management Policies) related to the management of activities in flood-prone areas (National Park Service, 2006). When it is not practicable to locate or relocate development to a site outside the floodplain, the NPS is instructed to prepare and approve a statement of findings in accordance with procedures described in Director’s Order 77-2 (Floodplain Management). Requirements for development in floodplains are contained in Executive Order 11988 (National Park Service, 2006).
xv

Aquifer Characterization Elevation of the local ground water table(s) (potentiometric surface) in the immediate area of MONO should be established to document ground water flow directions, seasonal fluctuations and overall trends in ground water levels. With increasing development pressures in the region and recent droughts, it is important for MONO to collect baseline data on the aquifer(s) that recharge the national battlefield’s springs and streams and supply the operational needs (potable water supply) at MONO. The direction and velocity of ground water flow will assist in the identification of threatened areas and point source pollution. MONO should use the existing ground water wells in the national battlefield and add to that network of wells (installation of piezometers), if necessary. It will be important to know the “screened’ intervals of the wells in order to correlate the measurement to the appropriate aquifer (shallow vs deep aquifer). From the water level data, ground water flow directions can be determined for the respective aquifers. Aquifer tests (slug tests) can define hydraulic conductivity and flow velocities. Water quality samples from existing wells and springs should continue, using the surface water chemical parameters and target values presented in this report. For potable water supplies, MONO should use the U.S. E.P.A. drinking water standards (U.S. Environmental Protection Agency, 2007) as target values. Wetlands Inventory Wetlands within the national battlefield boundary should be delineated, building from the National Wetland Inventory (NWI) maps prepared by the U.S. Fish and Wildlife Service. Wetlands may be missed on the NWI maps since the aerial surveys do not typically capture small wetlands (< 0.5 acre) common around springs and seeps. Qualified staff or certified wetlands specialists should use the Cowardin system used by the NPS to delineate wetlands, and conform with NPS Management Policies concerning wetlands and wetlands protection actions and in NPS DO 77-1. The spatial extent of wetlands and wetland types should be captured on MONO’s existing geographic information system (GIS) database and updated as new information is made available. Water Rights Water rights, whether federal or state law-based, are needed by MONO to meet the water needs of park operations and to protect natural, water-dependent resources. The NPS should consider authorities under Maryland and federal law on a case-by-case basis, pursuing those that are most appropriate to accomplish the purposes and protect water-related resources at MONO. While preserving its legal remedies, the NPS should work with state water administrators to protect park resources and, if conflicts amongst multiple water users arise, seek resolution through good faith negotiations.
xvi

Other Management Strategies
Over time, hiking trails deteriorate by natural process and by wear from recreational traffic. The magnitude of trail deterioration is determined by characteristics of the trail, its environments, and the recreation use the trail receives (Cole, 1987). Sediment yield during precipitation events on trails can enter a waterbody and can degrade water quality through increased turbidity and total dissolved solids. Aquatic habitat can also be negatively impacted from increased sediment yields by covering the natural substrate through increased sediment deposition. MONO should evaluate current trail designs, closing unwanted access and redesigning trails, as needed, to minimize sedimentation into surface waters at MONO (Motivans, 1995).
Individual septic systems are common in the immediate area of MONO. These systems
remove pollutants from wastewater to protect the public health and environment. Pollutants such as bacteria, viruses, nitrate, ammonia, and suspended solids can enter aquatic environments and potable water supplies if not treated properly. As a result, discharge limits are set and used to evaluate systems to make sure they stay in compliance with those standards. MONO should contact the Frederick County Government, Environmental Health Program: Well and Septic Branch (301.600.1726) to determine compliance of existing septic systems that influence MONO’s water resources and to learn of alternative sewage systems that may be more environmentally friendly in sensitive karst areas.
Invasive exotic plant species should be managed to retain desirable cultural and natural
landscape characteristics such as field patterns and the composition of wooded and agricultural areas (National Park Service, 2005). Not much is known about how to reduce the Asian clam (Corbicula fluminea) population, which is present in MONO (Motivans, 1995). Another inventory of the Asian clam population in the national battlefield is encouraged to evaluate the trends of this exotic species.
Runoff from impervious surfaces such as parking lots can concentrate polluted runoff
(oils, metals, chlorides, etc.) into the local aquatic environments. MONO should consider stormwater treatment for parking lot runoff using bioretention areas, filter strips, and other proven practices that can be integrated into the landscaped areas (Frederick County, 2007; National Park Service, 2005).
xvii

xviii
Introduction This Water Resources Stewardship Report (WRSR) is designed to build from Monocacy National Battlefield’s (MONO’s) General Management Plan (GMP) and support development of MONO's Resource Stewardship Strategies (RSS). The RSS serves as a bridge between the qualitative statements of desired condition established in the GMP and the measurable goals and implementing actions that will be identified in the park Strategic Plan and Implementation Plans. The following section outlines the NPS planning framework and describes how this report fits into this planning process. National Park Service Planning Framework The National Park Service (NPS) Water Resources Division initiated a program in 1991 that assists parks with their water resources planning needs. Recent changes in NPS general planning (2004 Park Planning Program Standards) and resources planning (draft Director’s Order 2.1: Resource Stewardship Planning) required programmatic revision to the existing NPS Water Resources Planning Program to assure that its products support the new NPS planning framework within which planning and decision-making are now accomplished. Within this new planning framework, six discrete elements of planning are captured in six planning-related documents (Figure 1). The Foundation for Planning and Management (Foundation Document) defines the legal and policy requirements that mandate the park’s basic management responsibilities, and identifies and analyzes the resources and values that are fundamental to achieving the park’s purpose or otherwise important to park planning and management. The General Management Plan (GMP) uses information from the Foundation Document to define broad direction for resource preservation and visitor use in a park, and serves as the basic foundation for park decision-making, including identification of management zones and desired conditions for fundamental and important park resources and visitor experiences. The Program Management Plan tiers off the GMP identifying and recommending the best strategies for achieving the desired resource conditions and visitor experiences presented in the GMP. Program planning serves as a bridge to translate the qualitative statements of desired condition established in the GMP into measurable or objective indicators that can be monitored to assess the degree to which the desired conditions are being achieved. Based on information obtained through this analysis, strategies are listed that move the resource(s) and visitor experiences towards the desired conditions. The Program Management Plan component for natural and cultural resources is the Resource Stewardship Strategy (Figure 1).
1

Foundation
GMP
ProgramMgmt
Plans – RSS
Strategic
Plan Implementation
Plans
Annual Performance Plan and Report
WHY
WHAT HOW
NPS PLANNING FRAMEWORK
LONG TERM SHORT TERM
Water Resources Foundation Report
Water Resources Stewardship Report
Figure 1. The ‘new” NPS framework for planning and decision making (blue boxes). Green boxes represent WRD planning products or assistance. RSS = Resource Stewardship Strategy.
The Strategic Plan tiers off the Program Management Plan identifying the highest-priority strategies, including measurable goals that work toward maintaining and/or restoring the park’s desired conditions over the next 3 to 5 years. Implementation Plans tier off the Strategic Plan describing in detail (including methods, cost estimates, and schedules) the high-priority actions that will be taken over the next several years to help achieve the desired conditions for the park. The Annual Performance Plan and Report measures the progress of projects from the Implementation Plan with objectives from the Strategic Plan. The Water Resources Foundation Report and the Water Resources Stewardship Report support this new planning framework. The Water Resources Foundation Report (Figure 1) addresses the needs of either the Foundation Document or phase one of the GMP. The Water Resources Stewardship Report (Figure 1) is designed specifically to address the water resource needs in a park’s Resources Stewardship Strategy. In 2002, MONO began the planning process to prepare its first GMP to comply with the 1978 National Parks and Recreation Act requiring all NPS units to develop a GMP. The GMP was needed to address new information and understanding about the park’s resources, along with the accelerated development trends in the Frederick, Maryland area. Presently, the draft GMP/EIS for MONO has been completed and will be soon released for public review.
2

MONO requested technical assistance from the NPS Water Resources Division in 2006 to develop this Water Resources Stewardship Report, in support of the national battlefield’s next planning product, the Resource Stewardship Strategy (RSS). Water Resources Stewardship Report Objectives The overarching goal of a Water Resources Stewardship Report is the development of comprehensive strategies for fundamental and important water resources that work toward achieving or maintaining the GMP’s desired conditions, with measurable or objective indicators to assess the degree to which the desired conditions are being achieved. More specifically, this Water Resources Stewardship Report for MONO will: 1) define the national battlefield’s water resource goals which support the desired conditions from its GMP in terms of objective, measurable values for water resources; 2) summarize existing information on water resources, and if insufficient, develop strategies for its acquisition; 3) assess existing water resources in terms of measurable values in comparison with values defined for achievement of desired conditions – if information is incomplete or lacking quality, describe strategies for its acquisition; 4) describe trends in water resource conditions based on available monitoring information – if information is insufficient, develop strategies for its acquisition and analysis; 5) identify and analyze water resource management issues that are impediments to achievement and maintenance of desired conditions; 6) develop resource strategies to achieve and maintain the desired resource conditions; and 7) assess the effectiveness of previous and current resource management actions in achieving or maintaining desired resource conditions and the implications for the comprehensive strategies. Water Resources Stewardship Report and NEPA The National Environmental Policy Act (NEPA) mandates that federal agencies prepare a study of the impacts of major federal actions having a significant effect on the human environment and alternatives to those actions. The adoption of formal plans may be considered a major federal action requiring NEPA analysis if such plans contain decisions affecting resource use, examine options, commit resources or preclude future choices. Lacking these elements, this Water Resources Stewardship Report has no measurable impacts on the human environment and is categorically excluded from further NEPA analysis. According to Director’s Order (DO) #12 Handbook (section 3.4), Water Resources Stewardship Reports normally will be covered by one or more of the following Categorical Exclusions: • 3.4.B (1) Changes or amendments to an approved plan when such changes have no potential
for environmental impact. • 3.4.B (4) Plans, including priorities, justifications, and strategies, for non-manipulative
research, monitoring, inventorying, and information gathering. • 3.4.B (7) Adoption or approval of academic or research surveys, studies, reports and similar
documents that do not contain and will not result in NPS recommendations. • 3.4.E (2) Restoration of non-controversial native species into suitable habitats within their
historic range.
3

• 3.4.E (4) Removal of non-historic materials and structures in order to restore natural conditions when the removal has no potential for environmental impacts, including impacts to cultural landscapes or archeological resources.
• 3.4.E (6) Non-destructive data collection, inventory, study, research, and monitoring activities.
• 3.4.E (7) Designation of environmental study areas and research natural areas, including those closed temporarily or permanently to the public, unless the potential for environmental (including socioeconomic) impact exists.
These Categorical Exclusions require that formal records be completed (Section 3.2, DO-12 Handbook) and placed in park files. It is the responsibility of the national battlefield to complete the documentation for the applicable Categorical Exclusion(s) when the Water Resources Stewardship Report is approved and published.
4
National Battlefield Location and Demography MONO was established to commemorate the Battle of Monocacy, which took place on July 9, 1864. The national battlefield is located about three miles south of Frederick, Maryland, in Fredrick County, 30 miles northwest of Washington, D.C. Approximately two miles of Interstate 270 bisect the national battlefield (Figure 2). Frederick County is one of the fastest growing counties in the region. From 1990 to 2000, the county experienced a 30% increase in population, while the State of Maryland's total population increased 10.8% during the same time frame. The population increased 9% (18,328 people) from 2001 to 2005. The population is expected to increase from 220,743 in 2005 to 243,220 people in 2010, exceeding the Census 2000 projections (Frederick County, 2007). Urbana, located three miles south of the battlefield, has been projected for growth beyond the present 20-year growth area. This new development would extend north to within one mile of MONO (National Park Service, 2005). The Urbana Region Plan, which is part of the Frederick County Comprehensive Plan, supports the preservation of agricultural land between MONO and Urbana to protect the national battlefield’s integrity and to provide an open space buffer between Urbana and Frederick. As part of this, the county has initiated the acquisition of easements along the Baker Valley Road corridor (National Park Service, 2005). MONO is managed primarily as a cultural resource whose historic landscape resembles that of the Civil War era, with the majority of the national battlefield consisting of livestock pasture and agricultural fields. Within the national battlefield’s boundaries are 1,647 acres, encompassing most of the lands upon which the Battle of Monocacy was fought. Six farmsteads are still maintained within the park boundary (Figure 3). These properties consist of livestock pasture and agriculture fields being used to grow crops such as corn, soybeans, small grains and alfalfa. In addition to the park’s goal of protecting its historic landscape, the NPS is also dedicated to preserving and protecting the natural resources in the area, allowing public use of these resources in a manner that is compatible with the legislative intent of the national battlefield and the 1916 Organic Act and 2006 NPS Management Policies.
5

Figure 2. Monocacy National Battlefield location map (National Park Service, 2000).
6

Figure 3. Monocacy National Battlefield existing farmsteads and management zones (National Park Service, 2007).
7

8

Management Zones and Desired Conditions The preferred alternative in MONO’s draft GMP/EIS divides the park into five different management zones (Figure 3), each with specific management prescriptions. These management prescriptions articulate the desired vision for the national battlefield that park managers will strive to achieve (desired condition). The management zones and respective desired resource conditions are listed in Table 1 (National Park Service, 2007).
Table 1. Monocacy National Battlefield Management Zones and Desired Conditions for natural resources (National Park Service, 2007).
Battlefield Preservation Zone Desired Condition: The battlefield preservation
zone would be managed to preserve the agrarian setting reminiscent of the battle era. Through continued agricultural practices, farm fields and hedgerows would be maintained, as would the relationship of open to wooded sections of the battlefield. Natural resources would be managed to reinforce the cultural landscape and agricultural character.
Visitor Services Zone Desired Condition: Any existing cultural and natural resources in the visitor services zone would be managed according to NPS policies with moderate tolerance for disturbance.
Commemorative Zone Desired Conditions: Monuments and formal landscapes would be maintained in keeping with NPS policies. The immediate landscape would be highly managed to form an appropriate setting for the monuments. Any existing natural resources in this zone would be managed according to NPS policies, with moderate tolerance for disturbance.
Natural Resources Zone Desired Conditions: Natural resources would be maintained in as natural a state as possible, given cultural resource preservation needs. This would include maintaining riparian buffers for water quality, reestablishing native species, and controlling exotic vegetation. Any existing cultural and natural resources in this zone would be managed according to NPS policies, with minimal tolerance for disturbance.
Maintenance and Administrative Zone Desired Condition: Any existing cultural and natural resources in the maintenance and administration zone would be managed according to NPS policies, with moderate tolerance for disturbance.
9

Because flowing water resources are unidirectional and cross management zones, they should be managed holistically. For example, impacts to surface or ground water resources in the Maintenance and Administration Zone could affect the health of aquatic systems in the Natural Zone. This is especially true in the sensitive karst landscape where MONO is located. Water Resource Goals The overall management goal of MONO is to maintain the historic landscape’s approximate appearance during the period of the Civil War. This historic landscape includes crops (corn, wheat, barley, soybeans and alfalfa), forest habitat (Brooks Hill), livestock, open fields, streams, riparian habitat, and some small wetlands (National Park Service, 2005). MONO’s water resources play a vital role in this historic landscape, and should be managed to protect the character and quality of the national battlefield’s significant cultural resources and to preserve important interpretive views. These management objectives should be balanced by encouraging biological diversity through strategies that protect the battlefield’s watershed and associated water resources (springs, streams, wetlands) (National Park Service, 2007). Building from the MONO desired condition for the Natural Resources Zone (see below), two water resource goals were developed that support that desired condition (Table 2). As previously discussed, these water resource goals should be applied across all five management zones. The achievement of these water resource goals will assist MONO in meeting its desired condition for natural resources. Monocacy National Battlefield Desired Condition (National Park Service, 2007):
“Natural resources would be maintained in as natural a state as possible, given cultural resource preservation needs. This would include maintaining riparian buffers for water quality, reestablishing native species, and controlling exotic vegetation. Any existing cultural and natural resources in this zone would be managed according to NPS policies, with minimal tolerance for disturbance.”
Table 2. Monocacy National Battlefield Water Resource Goals.
Goal A: Chemical integrity of park waters (surface and ground waters) is improved and/or maintained to support all native life and to meet or exceed designated use standards. Goal B: Hydrologic integrity of park waters (surface and ground waters) is improved and/or maintained to support natural geomorphic processes of fluvial and aquifer systems and to support native life.
10

Description of Natural Resources Climate The climate of MONO is typical of the mid-Atlantic states; temperate and humid. Moderate precipitation dominates the Potomac River Basin. The area is influenced by prevailing westerly winds, which are frequently interrupted by surges of cool northern and warm southern air masses. In the warmer half of the year, the basin is affected by showers and thunderstorms. These storms often cause flash flooding in the narrow valleys (Hobba et al., 1972). Most flooding events occur in either early spring due to spring rains and snow melting, or early fall during hurricane season. Figure 4 presents climate data from 1948-2002 for Frederick, Maryland. The annual average precipitation is 39.6 inches. On average, the area receives 18.7 inches of snow annually (Southeast Regional Climate Center, 2007). May is the wettest month (3.8 inches) with February typically the driest month (2.6 inches). Average monthly air temperatures range from 33.3° F in January to 77.3° F in July (Southeast Regional Climate Center, 2007).
0
2
4
6
8
JAN
FEB
MAR AP
R
MAY JU
N
JUL
AUG
SEP
OC
T
NO
V
DEC
Month
Pre
cipi
tatio
n (in
ch)
020406080100
Tem
pera
ture
(F)
Table 1. Monocacy National Battlefield Management Zones and Desired Conditions.
Figure 4. Monthly mean precipitation (bars) and air temperature range (diamond- whiskers) (1948-2002), Frederick, Maryland (Southeast Regional Climate Center, 2007).
Physiography The landscape of MONO consists of the broad Monocacy River valley and ridges of less resistant geology. The national battlefield is situated in the western Piedmont physiographic province, known as the Lowland Section (Figure 5), bounded by the Blue Ridge Province to the west and the Upland Section of the Piedmont Plateau Province to the east (Maryland Geological Survey, 2001). The river is confined to the Frederick Valley and tends to flow along the west base of the resistant ridges. These ridges, like Brooks Hill, are underlain by plunging anticlines of hard rock. Uplift and erosion have produced “valley and ridge” topography, with linear ridges and intervening valleys. To the west of the national battlefield, the landscape is a broad open valley underlain by carbonate rocks that are susceptible to chemical erosion producing the
11

local karst features (i.e., sinkholes and springs). To the east, the landscape is an elevated plateau underlain by fine-grained metamorphic rocks. Most of the battlefield is on flat land just north of Interstate Highway 270, which consists of terrace deposits overlying rocks of the Frederick Formation (Southwood and Denenny, 2006).
Monocacy National Battlefield approx. location
Figure 5. Physiographic Provinces in Maryland (Maryland Geological Survey, 2001).
Geology
Moving from oldest to youngest in Figure 6 (Southwood and Denenny, 2006), the Ijamsville phyllite (ЄZi) is the oldest geologic unit in MONO, consisting of blue, purple and green phyllite, slate, and phyllonite that contains veins of white quartz. The Ijamsville phyllite is exposed in the extreme southeastern part of the park. The lower and middle Cambrian Araby Formation (Єar) consists of light-brownish-gray sandy metasiltstone and graphitic metashale. The Araby Formation is exposed along the Monocacy River (where the river has cut into the ridges) in cuts along the railroad bed in the northeast part of the battlefield, and road cuts in the southeast part of the battlefield. The Araby Formation is conformably overlain by limestone and limestone breccia of the Frederick Formation (Rocky Springs Station Member (Єfr)).
The Frederick Formation contains the carbonate rocks associated with the local karst features (sinkholes, springs). The upper Cambrian Frederick Formation is a thick interval of thin- to medium-bedded limestone and dolostone with thin intervals of shale and sandstone. The Rocky Springs Station Member is characterized by intervals of polymitctic limestone breccia.
12

13Figure 6. Monocacy National Battlefield geologic map (Southwood and Denenny, 2006). (note: location for MONO Visitor Center identified on this map changed in 2007)

An interval of gray to black shale (Єfrs) locally is interbedded. The Adamstown Member (Єfa) consists of thinly bedded limestone with thin intervals of shale. The Lime Kiln member (Єfl) consists of thinly bedded limestone interbedded with algal limestone at the top of the formation. The best exposures of the Frederick Formation are along the Monocacy River and within creek beds.
The predominant surficial deposits--fluvial terraces (Qt) and alluvium (Qa)--are found in the Monocacy River valley (Figure 6). Sand, gravel, and sandstone boulders on flat benches are terrace deposits as much as 50 feet above river level. The present floodplain is broad and susceptible to flooding during high rainfall. The river flows on bedrock and the alluvium, locally as much as 20 feet thick. Within the floodplain are sinkholes (Qs) that formed as the result of dissolution of the underlying carbonate rocks of the Frederick Formation. Fine colluvium consisting of the Araby Formation’s metasiltstone chips and cobbles mantles the shallow bedrock on the lower slopes of ridges and hills (Southwood and Denenny, 2006).
Soils
Most soils in the lowland areas of the national battlefield are of the Cordorus and Lindside series. Soils in the upland areas are of the Cardiff and Whiteford series. On the basis of the 2001 soil survey, the Maryland Geological Survey has designated some areas of the national battlefield as highly erodible land, taking into account the soils present and slope. The soil survey documented 14 soils in the national battlefield that the U.S. Department of Agriculture has classified as prime farmland. The largest area of prime farmland is the southern third of the Best Farm. Hydrology Watersheds According to the NPS Management Policies, the NPS will manage watersheds as complete hydrologic systems, and will minimize human disturbance to the natural upland processes that deliver water, sediment, and woody debris to streams (National Park Service, 2006). The battlefield is located within the 14,670-mi2 Potomac River drainage basin, the fourth largest watershed on the East Coast (Belval and Sprague, 1999). The Potomac is one of nine river basins, and the second largest drainage that forms the 64,000-mi2 Chesapeake Bay watershed. The Chesapeake Bay is the largest estuary in the United States, providing habitat for abundant and diverse wildlife populations and supporting an economy that includes fishing, shipping, and recreation. Watersheds are delineated by the U.S. Geological Survey using a nationwide system based on surface hydrologic features. This system divides the country into 21 regions, 222 subregions, 352 accounting units, and 2,262 cataloguing units (U.S. Geological Survey, 2006). A hierarchical hydrologic unit code (HUC) consisting of 2 digits for each level in the hydrologic unit system is used to identify any hydrologic area. The 6-digit accounting units and the 8-digit cataloguing units are generally referred to as basin and sub-basin, respectively. HUC is defined as the Federal
14

Information Processing Standard (FIPS) and generally serves as the backbone for the country's hydrologic delineation. Within the Potomac River drainage basin, MONO straddles the Monocacy River and is located within the 8-digit cataloguing sub-basin called “Monocacy” (USGS cataloging unit: 02070009) (Figure 7a). More specifically, the battlefield is contained within the Lower Monocacy River drainage of this watershed (Figure 7b), draining 194,700 acres before emptying into the Potomac River (Maryland Department of Natural Resources, 2003a). Surface Water
Rivers and Streams: Streams in MONO are all part of the Monocacy River system that drains the eastern portion of the Middle Potomac River basin. The Monocacy River is the largest Maryland tributary of the Potomac River (Monocacy Scenic River Local Advisory Board, 1990). From 2004 to 2007, mean daily stream flows for the river immediately upstream from the national battlefield ranged from approximately 60 to 18,000 cfs (Figure 8). The Monocacy River is fed by three tributaries that run through MONO. The three tributaries are Bush Creek, Harding’s Run, and Thomas Farm Creek/“Old” Visitor Center Creek (Figure 9). The Monocacy River flows directly through and along the boundary of the national battlefield for approximately 2.5 miles. Approximately 0.8 miles of Bush Creek passes through the north central part of the national battlefield. Bush Creek is the largest Monocacy River tributary within the national battlefield, a moderately narrow, rapidly flowing creek with scoured sections of banks and cobble beds from periodic high flows. Small pockets of wetlands and narrow floodplain forest are also present along the creek (Motivans, 1995). As the creek nears its confluence with the river, the stream channel becomes incised and much of the stream bank is undercut. Agriculture is the dominant land use within the Bush Creek watershed with approximately a third of the watershed still forested. Given the long history of human habitation and agricultural land use in the region, streams are far from pristine. The streams support a variety of fish and invertebrate biota, including several sport fish species (Frederick County, 2004). The Gambrill Mill is in the 100-year floodplain of the Monocacy River and Bush Creek. Historic structures whose locations are integral to their significance are exempt from compliance with the NPS Procedural Manual 77-1, “Floodplain Management” (National Park Service, 2005). After the 1968 Maryland Scenic and Wild Rivers Act was adopted, the first inventory, Scenic Rivers in Maryland, was released by the Maryland Department of State Planning in 1970. The Monocacy River was identified as a significant state resource, and worthy of immediate study, and as a prime candidate for State Scenic River designation. In 1974, the Monocacy River was added to the Maryland scenic river system (Monocacy Scenic River Local Advisory Board, 1990).
15

Figure 7. a.) Location of Monocacy Watershed. b.) Maryland Drainage Basins (Maryland Department of Natural Resources, 1998).
Monocacy National Battlefield
Figure 7b
Figure 7a
16
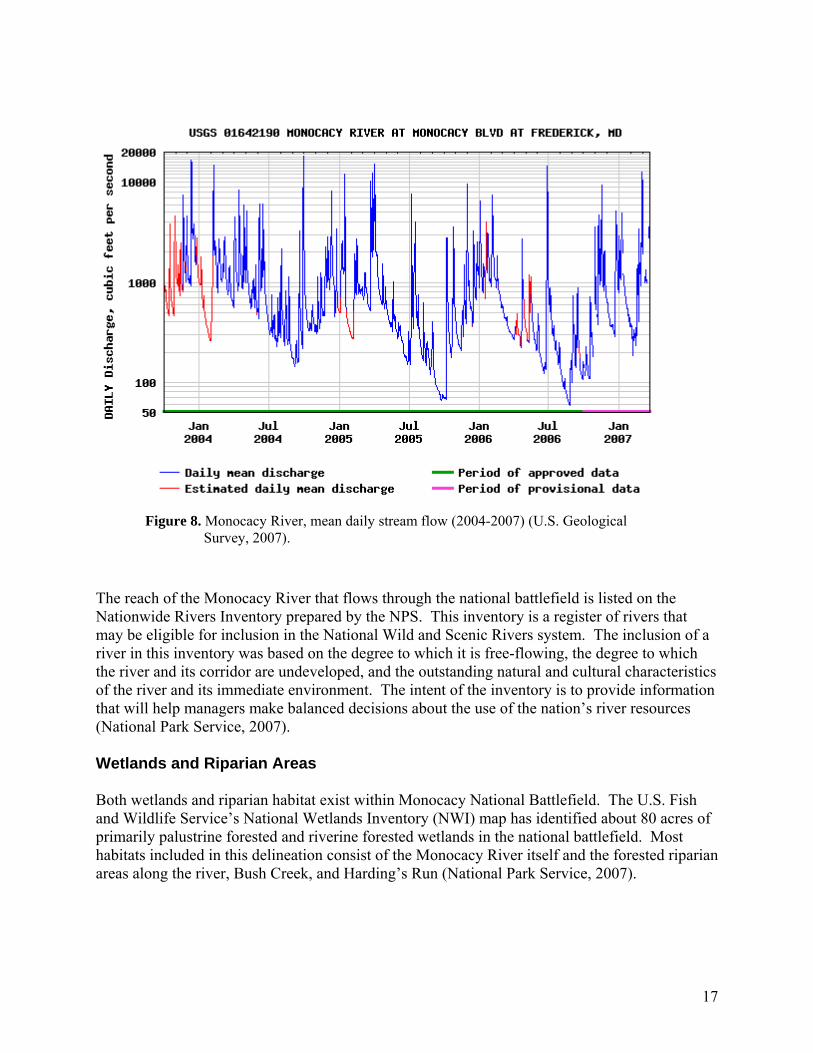
Figure 8. Monocacy River, mean daily stream flow (2004-2007) (U.S. Geological Survey, 2007).
The reach of the Monocacy River that flows through the national battlefield is listed on the Nationwide Rivers Inventory prepared by the NPS. This inventory is a register of rivers that may be eligible for inclusion in the National Wild and Scenic Rivers system. The inclusion of a river in this inventory was based on the degree to which it is free-flowing, the degree to which the river and its corridor are undeveloped, and the outstanding natural and cultural characteristics of the river and its immediate environment. The intent of the inventory is to provide information that will help managers make balanced decisions about the use of the nation’s river resources (National Park Service, 2007). Wetlands and Riparian Areas Both wetlands and riparian habitat exist within Monocacy National Battlefield. The U.S. Fish and Wildlife Service’s National Wetlands Inventory (NWI) map has identified about 80 acres of primarily palustrine forested and riverine forested wetlands in the national battlefield. Most habitats included in this delineation consist of the Monocacy River itself and the forested riparian areas along the river, Bush Creek, and Harding’s Run (National Park Service, 2007).
17

18
Figure 9. Stream and spring locations, Monocacy National Battlefield.

Wetlands represent transitional environments between terrestrial and aquatic systems where the water table is at or near the surface or the land is covered by shallow water (Cowardin et al., 1979). Flora within these wetland systems exhibit extreme spatial variability, triggered by very slight changes in elevation. Temporal variability is also great because the surface water depth is highly influenced by changes in precipitation, evaporation and/or infiltration. Cowardin et al. (1979) developed a wetland classification system that is now the standard in the federal government. In this system, a wetland must have one or more of the following attributes: (1) at least periodically, the land supports predominately hydrophytes; (2) the substrate is predominately undrained hydric soil; and (3) the substrate is non-soil and is saturated with water or covered by shallow water at some time during the growing season of each year. There are four federal government agencies responsible for identifying and delineating wetlands: the U.S. Army Corps of Engineers, U.S. Environmental Protection Agency, U.S. Fish and Wildlife Service, and Natural Resources Conservation Service. Natural riparian zones are some of the most diverse, dynamic, and complex biophysical habitats in the terrestrial environment (Naiman et al., 1993). The riparian zone encompasses that stream channel between low and high watermarks and that portion of the terrestrial landscape from the high watermark toward the uplands where vegetation may be influenced by elevated water tables or flooding and by the ability of the soils to hold water (Naiman and Decamps, 1997). Riparian forest buffers are integral to the health of the Chesapeake Bay and its rivers, including the Monocacy River, for many reasons (Table 3). Not all of the existing forested riparian buffers within the national battlefield’s boundaries meet the ≥ 35 feet width requirement established by the Chesapeake Bay Program.
Table 3. Importance of Riparian Buffers (Chesapeake Bay Program, 2006b).
Filtering Runoff: Rain that runs off the land can be slowed and infiltrated in the forest, which helps settle out sediment, nutrients and pesticides before they reach streams. Infiltration rates of forests are 10 to15 times higher than those of grass turf areas and 40 times higher than those of a plowed field. Studies have shown 30 to 98 percent reductions of nutrients (nitrogen and phosphorus), sediment, pesticides and other pollutants in surface and groundwater after passing through a riparian forest. In addition, trees provide deep root systems that hold soil in place, thereby stabilizing streambanks and reducing erosion. Nutrient Uptake: Tree roots absorb fertilizers and other pollutants that originate on the land. Nutrients are stored in leaves, limbs and roots instead of reaching the stream. Through a process called 'denitrification,' bacteria in the riparian forest floor convert harmful nitrates to nitrogen gas, which is then harmlessly released into the air. Canopy and Shade: Cool stream temperatures maintained by riparian vegetation are essential to the health of aquatic species. Shading moderates water temperatures and protects against rapid fluctuations that can harm stream health and reduce fish spawning and survival. Leaf Food: Leaves from the riparian forest fall into streams and are trapped on woody debris (fallen trees and limbs) and rocks where they provide food and habitat for small bottom-dwelling creatures (i.e., crustaceans, amphibians, insects and small fish), which are critical to the aquatic food chain. Habitat: Riparian forests offer a tremendous diversity of habitat. The layers of habitat provided by trees, shrubs and grasses and the transition of habitats from aquatic to upland areas make these areas critical in the life stages of more than one-half of all native Chesapeake Bay species. While the overall impact of these riparian forest corridors may be greatest in headwaters and smaller order streams, there is a clear link all the way to the Chesapeake Bay.
19

Ground Water Transmissivity (the rate at which water flows through rock) can be extremely variable in the Piedmont physiographic province, ranging from 100 to 35,000 gallons/day/foot (gpd/ft). Small to moderate supplies of ground water are available throughout the region, but locally favorable geologic conditions may provide larger amounts (Vokes and Edwards, 1974). The mean yield of existing Piedmont wells is about 12,960 gpd, which is usually sufficient for domestic use and most small farm and commercial uses (Nutter and Otto, 1969). Water supplies for large farms and light industry can be developed if favorable hydrogeologic conditions exist, otherwise, surface water supplies are utilized (Clearwater et al., 2000) As stated earlier, much of MONO is underlain by the carbonate rocks (limestone and dolomite) of the Frederick Formation, producing an environmentally sensitive karst terrain. In a karst landscape, much of the ground water flow takes place in pipe-like or sheet-like voids that have been created and/or enlarged by the solvent action of circulating water. Consequently, karst aquifers are heterogeneous and ground water does not follow all the rules of typical ground water movement, as developed for homogeneous media (Duigon, 1997). Recharge to a karst aquifer can be diffuse, as widespread precipitation infiltrates the overlying soils and sediments. Recharge can also be concentrated, as surface runoff is directed into a sinkhole or losing stream. The development of the network of solution conduits joining recharge and discharge depends on topography, lithology, and geologic structure (Duigon, 1997). Topography influences ground water well selection in Frederick County because it is the surface expression of the underlying geology. Wells drilled in valleys typically have the highest average yields, while those drilled on hilltops or ridges typically have the lowest yields. Ground water is used by MONO and the local community for potable water, with ground water wells located adjacent to the Gambrill Mill (1 well), Gambrill House (1 well), Thomas Farm (2 wells), Lewis Farm (1 abandoned well), Worthington Farm (1 active well and 1 abandoned well), Baker Farm (2 wells), Best Farm (1 well), and the Blockhouse at the Thomas Farm (1 well). There are several springs and seeps in the national battlefield. These do not produce large volumes of water, but are important aquatic habitat for the local flora and fauna. Water Quality The NPS Water Resources Division (WRD) completed a comprehensive summary of existing surface water quality data for MONO, the Baseline Water Quality Inventory and Analysis, Monocacy National Battlefield (National Park Service, 2000). This document presents the results of surface water quality data retrievals for MONO from six of the U.S. Environmental Protection Agency's (EPA) national databases: (1) Storage and Retrieval (STORET) water quality database management system; (2) River Reach File (RF3); (3) Industrial Facilities Discharge (IFD); (4) Drinking Water Supplies (DRINKS); (5) Water Gages (GAGES); and (6) Water Impoundments (DAMS). The results of the MONO water quality criteria screen found 13 groups of parameters that exceeded screening criteria at least once within the study area, which extended approximately three miles upstream and one mile downstream from the national battlefield boundary. Dissolved
20
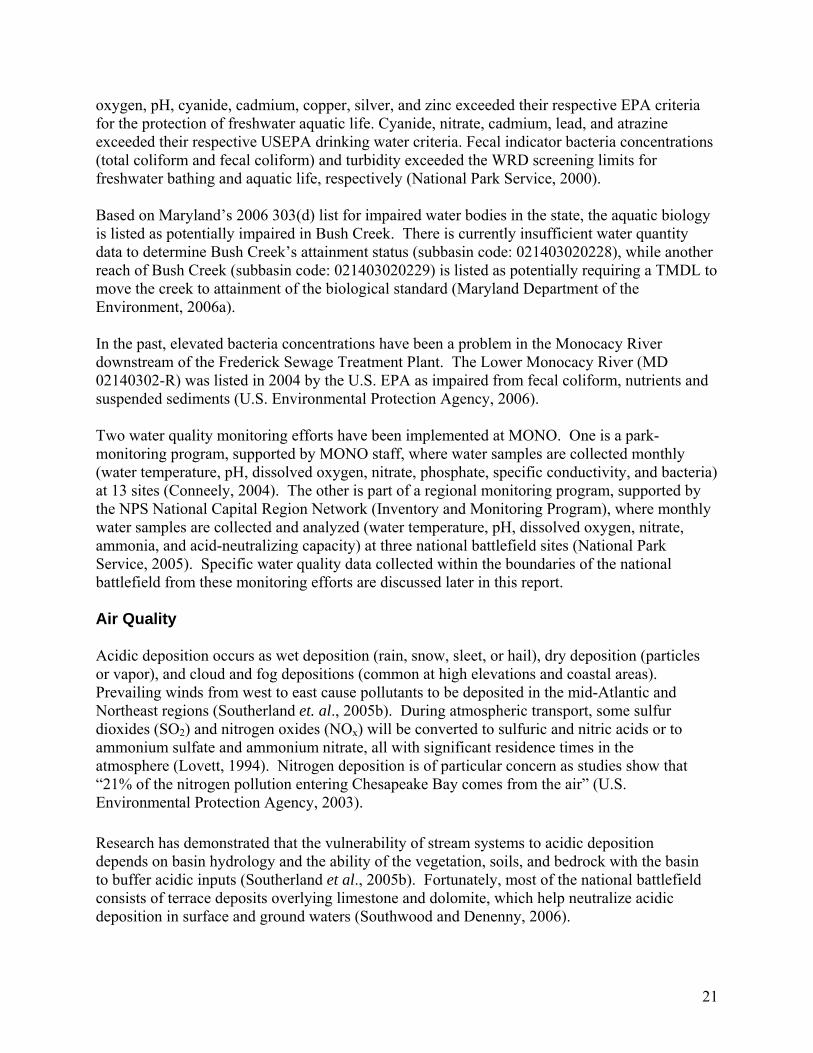
oxygen, pH, cyanide, cadmium, copper, silver, and zinc exceeded their respective EPA criteria for the protection of freshwater aquatic life. Cyanide, nitrate, cadmium, lead, and atrazine exceeded their respective USEPA drinking water criteria. Fecal indicator bacteria concentrations (total coliform and fecal coliform) and turbidity exceeded the WRD screening limits for freshwater bathing and aquatic life, respectively (National Park Service, 2000). Based on Maryland’s 2006 303(d) list for impaired water bodies in the state, the aquatic biology is listed as potentially impaired in Bush Creek. There is currently insufficient water quantity data to determine Bush Creek’s attainment status (subbasin code: 021403020228), while another reach of Bush Creek (subbasin code: 021403020229) is listed as potentially requiring a TMDL to move the creek to attainment of the biological standard (Maryland Department of the Environment, 2006a). In the past, elevated bacteria concentrations have been a problem in the Monocacy River downstream of the Frederick Sewage Treatment Plant. The Lower Monocacy River (MD 02140302-R) was listed in 2004 by the U.S. EPA as impaired from fecal coliform, nutrients and suspended sediments (U.S. Environmental Protection Agency, 2006). Two water quality monitoring efforts have been implemented at MONO. One is a park- monitoring program, supported by MONO staff, where water samples are collected monthly (water temperature, pH, dissolved oxygen, nitrate, phosphate, specific conductivity, and bacteria) at 13 sites (Conneely, 2004). The other is part of a regional monitoring program, supported by the NPS National Capital Region Network (Inventory and Monitoring Program), where monthly water samples are collected and analyzed (water temperature, pH, dissolved oxygen, nitrate, ammonia, and acid-neutralizing capacity) at three national battlefield sites (National Park Service, 2005). Specific water quality data collected within the boundaries of the national battlefield from these monitoring efforts are discussed later in this report. Air Quality Acidic deposition occurs as wet deposition (rain, snow, sleet, or hail), dry deposition (particles or vapor), and cloud and fog depositions (common at high elevations and coastal areas). Prevailing winds from west to east cause pollutants to be deposited in the mid-Atlantic and Northeast regions (Southerland et. al., 2005b). During atmospheric transport, some sulfur dioxides (SO2) and nitrogen oxides (NOx) will be converted to sulfuric and nitric acids or to ammonium sulfate and ammonium nitrate, all with significant residence times in the atmosphere (Lovett, 1994). Nitrogen deposition is of particular concern as studies show that “21% of the nitrogen pollution entering Chesapeake Bay comes from the air” (U.S. Environmental Protection Agency, 2003).
Research has demonstrated that the vulnerability of stream systems to acidic deposition depends on basin hydrology and the ability of the vegetation, soils, and bedrock with the basin to buffer acidic inputs (Southerland et al., 2005b). Fortunately, most of the national battlefield consists of terrace deposits overlying limestone and dolomite, which help neutralize acidic deposition in surface and ground waters (Southwood and Denenny, 2006).
21

The encroachment from urban areas such as Frederick and Urbana, as well as heavy traffic on I-270, also poses a threat to MONO’s air quality.
Biological Resources Water resources are critical to the sustenance of MONO’s populations of flora and fauna. Biological resources are intimately linked to hydrological systems. For example, riparian habitat is closely tied to the health of both wetlands and streams, influencing fish and invertebrate assemblages. Characteristics of riparian habitat structure such as the ratio of edge to interior, the degree of canopy complexity within riparian strata (e.g., herb/forbs, shrubs, sub-canopy tree, and overstory tree), and the degree of fragmentation is highly associated with amount and type of wildlife use (National Park Service, 2004). Based on the Physical Habitat Index (PHI), 15% of the streams in Frederick County had minimally degraded habitat and 29% had degraded or severely degraded physical habitat. The remaining 56% had partially degraded habitat (Kazyak et al., 2005). Flora The vegetation composition and patterns at MONO are indicative of the open natural and agricultural landscape in the Piedmont region of Maryland. Approximately 40% of the national battlefield is forested, with the remainder of land primarily agricultural. The patchwork of these upland and riparian forested areas interspersed with agricultural and open fields offers a number of vegetation and habitat types. Several national battlefield vegetation studies have been or are being conducted. Their findings record more than 375 different plant species, of which more than 100 are exotic (National Park Service, 2005). The proliferation of invasive nonnative plant species has introduced monocultures of species that are not congruent with the historic scene and threaten to take over areas that once supported only native plants (National Park Service, 2007). Among the natural resources are forested areas on and around Brooks Hill and Bush Creek and the south end of the Lewis Farm. These areas, the largest forested tracts in the national battlefield, offer resource benefits in the form of carbon cycling, locally significant plant communities, and interior forest and wildlife habitat (National Park Service, 2007). Significant natural resources include three plants on the state’s “watch-list”: Short’s rockcress (Arabis shortii), dwarf larkspur (Delphinium tricorne), and harbinger-of-spring (Erigenia bulbosa), which have been located in the extreme southern section of the national battlefield (National Park Service, 2005). Fauna The bald eagle (Haliaeetus leucocephalus) has been sited in the national battlefield. Although recently delisted from the endangered and threatened status (August 2007), bald eagles continue to receive protection under the 1940 Bald Eagle Protection Act (16 U.S.C. 668-668d) and the 1972 Migratory Bird Treaty Act (16 U.S.C. 703-712).
22

Fifty-three species of fish occur in the Middle Potomac River basin; 49 species occur in the Monocacy River drainage (Roth et al., 1999). Raesly (2004) collected 38 species of fish and one hybrid during sampling at 10 sites in MONO representing the Monocacy River and four of its tributaries. The Monocacy River site had 25 species, with the following most abundant species; Pimephales notatus, Cyprinella spiloptera, Ambloplites rupestris, and Lepomis auritus. One site on Bush Creek also had 25 species; most abundant species included Rhinichthys cateractae, Cottus caeruleomentum, R. atratulus, and Campostoma anomalum. Two other sites on Bush Creek had 17 and 22 species. Other tributary sites (n = 5) ranged from 1 to 14 species. Dominant species from these sites included P. notatus, R. atratulus, and C. caeruleomentum. One species collected by Raesley (2004) that is of significance is Margariscus margarita, a state listed threatened species. This species is rare and exhibits a localized distribution in the Middle Potomac River basin.
Hilderbrand et al. (2005) sampled benthic macroinvertebrates from five tributary sites in MONO. They identified 48 taxa from these sites (identifications to the genus level or lowest practical taxon). The exotic Asian clam, Corbicula fluminea, was identified in Bush Creek (Motivans 1995). National Capital Region Network, Inventory and Monitoring Program The National Capital Region Network (NCRN) Inventory and Monitoring (I&M) program has identified 22 indicators of ecological condition within the National Capital Region (NCR), which are commonly called “vital signs”. The NCRN is implementing vital signs monitoring within 11 NCR parks, including MONO. An essential component of vital signs monitoring is the portrayal of how vital signs yield information about the condition of park resources. NCRN is collaborating with the University of Maryland Center for Environmental Sciences (UMCES), technical experts and partners that can help to develop an overall reporting framework for ecological condition: Ecosystem Health Report Cards. These report cards are created for each park and for the Region using ecological thresholds gleaned from the literature and state and federal regulations. A draft pilot report card has been completed for Rock Creek Park. The reporting process will eventually be applied to all parks, including MONO, as soon as it is finalized. Some of the work completed by the NCRN (e.g., vital sign indicators) has been applied in the later sections of this report. National Battlefield Land Use The primary land use within MONO’s boundary is agriculture. It encompasses approximately 760 acres within the 1355 acres of fee simple ownership. Agricultural activities within the park include pasturing heifers, dairy cows, and beef cattle; cultivating row crops, including corn, soybeans, and small grains; and growing cool season pasture grasses for hay production. The park maintains this agricultural landscape through agreements with local farmers. An agricultural Special Use Permit is issued to the farmer for a five-year period, which enumerates conditions placed on the operation of the farms. Some of these conditions include setting the stocking rate (number of livestock per acre), establishing and preserving riparian buffers, controlling noxious weeds, and requiring pesticide use applications and annual use logs.
23
The stocking rate is one animal per acre of pasture during the growing season (approximately April through November), and one animal per two acres of pasture all other times – unless supplemental feed is used. Riparian buffers and grassed waterways must also be established and maintained. The plan requires a minimum 30 foot (from the center of the stream) permanent buffer of perennial vegetation (i.e. grass or shrubs). It also stipulates that these areas will not be tilled or sprayed with herbicide during treatment of adjacent fields. Noxious weeds must also be controlled by either mechanical or chemical methods (i.e., herbicide). If pesticide is used, the farmers must submit pesticide use applications by January 1 of each year. These applications detail what pesticides are to be used, where they will be applied, on what crops they will be applied, and for what pest. Per Maryland state law, each farmer is required to prepare and follow a Nutrient Management Plan. This plan analyzes the crop yield and nutrient requirements and levels and availability of nutrients in the soil to balance crop nutrient requirements and the amount and type of fertilizer that should be applied to the land. It achieves this analysis through soil testing, crop yield statistics, and manure testing. The soil in each field is tested for nutrient (N, P, K, Mg, and Ca) content and pH, and recommendations are given to create a field-specific strategy for nutrient application. These recommendations also detail the type of fertilizer to be applied (i.e. chemical, manure), correct application rate (based on plant need), timing of nutrient application, and application method that should be used. The constant balancing of these factors to achieve maximum crop yield with the most efficient nutrient application is what makes the Nutrient Management Plan an important part of the farmers’ conservation practices. A copy of this plan is submitted to the park, and is another part of the management requirements placed on the farmers. Also, the USDA Natural Resources Conservation Service, in cooperation with the state Soil Conservation District, provides Conservation Plans for each farm. These plans primarily deal with soil conservation, but also cover wetland conservation and other practices. Included are an inventory of highly erodible soils and their soil descriptions, and conservation requirements for crop and pasture fields – including areas needing conservation crop rotation, conservation tillage, cover crops, stream fencing, nutrient and waste management, and grazing regimes. These inventories, recommendations and requirements are listed for each field, providing specific management guidelines for each site. The park also engages in active control of invasive, exotic plant species. Currently, over 130 different exotic species have been documented, with the park actively engaged in control of over one dozen. The control efforts utilize an Integrated Pest Management strategy to optimize effectiveness of control with the least environmental impact. These activities include manual pulling of weeds, mechanical control through mowing or trimming, chemical control through the use of herbicides, or the combination of all these methods.
24

Fundamental and Important Water Resources National Battlefield Purpose and Significance The purpose statements of a NPS unit communicate the reason(s) for which it was set aside and preserved by Congress. For Monocacy National Battlefield, the purposes are (National Park Service, 2007):
• to preserve the beastworks, earthworks, walls, and other defenses and shelters used by the Confederate and Union armies on July 9, 1864, as well as the buildings, roads and outlines of the battlefield;
• to commemorate the Battle of Monocacy; and • to provide opportunities for visitors to understand and appreciate the significance of the
Battle of Monocacy within the full context of the Civil War and American history. Significance statements define what is most important about the national battlefield’s resources and values and are based on the purpose of why the national battlefield was created. The MONO significance statement that applies to natural resources, including water resources, is (National Park Service, 2007):
• A national battlefield where visitors can experience a historic landscape, structures, and transportation corridors that have changed little since the Battle of Monocacy. As a result, it offers many opportunities for understanding the evolution of settlement in the region and the Civil War within the broader context of American history.
It is important for NPS units to identify the resources and values critical to achieving the park’s purpose and maintaining its significance. Identifying the fundamental and important resources and values at MONO ensures that all planning is focused on what is truly most significant about the national battlefield. Building from the Purpose and Significance of MONO, the Monocacy River is considered a “fundamental” resource of the national battlefield and the other water resources are considered “important” resources, contributing to the civil war landscape on the day of the battle. These important water resources consist of both surface water and ground water; including streams, wetlands, and springs that support a variety of biological communities such as riparian floodplains along the Monocacy River. Indicators and Target Values Indicators are selected to provide a barometer of health for MONO’s water resources. Target values are established for the respective indicator parameters to distinguish between acceptable and unacceptable function of natural systems. Although not comprehensive in evaluating natural resource health, appropriate indicators provide a cost-effective way for park managers to monitor progress in maintaining or achieving target values that meet the water resource goals (see Table 2) and ultimately the national battlefield’s desired conditions for natural resources presented earlier on page 10.
25

With indicator parameters and target values established, the condition of MONO’s water resources will be evaluated and a list of strategies generated, based on resource conditions and stressors. Strategies will also include the collection/interpretation of data where minimal or no information exists to adequately measure natural resource health. Implementation of appropriate strategies will ultimately move MONO’s water resources (surface water and ground water) and associated environments (wetlands, riparian areas, etc.) towards the established target values for the respective indicator parameters. The indicators recommended for MONO’s water resources are discussed in the following sections under chemical, physical and biological indicators and target values. Chemical Indicators and Target Values Building from the NPS National Capital Region Network (NCRN) water quality vital signs and the Maryland water quality standards for designated streams, chemical indicator parameters were selected for MONO with associated target values. The water quality vital signs (indicators) selected for the National Capital Region, including MONO, are pH, dissolved oxygen, conductance, water temperature, acid neutralizing capacity (ANC) and nutrients – nitrate, ammonia, nitrite, orthophosphate (National Park Service, 2005). These vital signs provide the foundation for MONO’s chemical indicators. We used the following criteria to judge quality of the water resource-based indicators: 1) measurable – enables recording and analysis in quantitative and qualitative terms; 2) precise – used or defined the same way by all people, with little variability; 3) consistent – used or measured the same way, so that any results depict measurements of the same thing over time; and 4) sensitive – detects changes proportionately in response to actual changes in the condition being measured. Criteria for target value(s) included: 1) impact oriented – represents the desired status of specific water resource based attributes; 2) measurable – definable in relation to some standard scale; 3) specific – clearly defined so that all people involved have the same understanding of what the terms mean; and 4) credible – representing researchers’ best scientific judgment as to what is necessary for conservation success. These criteria and other aspects of the recurrent problem of setting measurable objectives are discussed by Tear et al. (2005). The state of Maryland designated the Monocacy River as IV-P (Recreational Trout Waters and Public Water Supply) and the tributaries are listed as I (Water Contact Recreation and Protection of Nontidal Warmwater Aquatic Life) (Maryland Department of the Environment, 2007; Bill Seiger pers. com., 2007). Water quality criteria have been established for these stream designations. These criteria provide the foundation for the chemical indicator target values, unless otherwise noted. Water Temperature Water temperature is one of the most important water quality parameters and has direct effects on water chemistry and the functions of aquatic organisms. Temperature influences the dissolved
26
oxygen content of the water; the rate of photosynthesis by algae and other aquatic plants; the metabolic rates of organisms; the sensitivity of organisms to toxic wastes, parasites and diseases; and the timing of reproduction and migration of aquatic organisms. Factors which can affect temperature include sunlight energy (seasonal and daily changes), shade, air temperature, stream flow, water depth, inflow of groundwater or surface water, and the color and turbidity (cloudiness) of the water. Other factors include soil erosion, storm water runoff, and alterations to stream morphology, substrate and flow. Based on the Maryland water quality criteria, MONO’s streams should not exceed 75°F (23.9°C). MONO Water Temperature Target Value: ≤ 75°F (23.9°C) Bacteria Coliform bacteria occur naturally in water systems, soil, and the digestive systems of animals. While most coliform bacteria are non-pathogenic, high levels of this bacteria may indicate the presence of pathogenic organisms. E. coli, a pathogenic fecal coliform bacteria, is the “most common disease causing bacteria in the feces of warm-blooded animals” (U.S. Dept. of the Interior, 2001). Because most fecal coliforms are non-pathogenic, E. coli testing is thought to be a more specific, reliable indicator of public health hazards than testing for fecal coliform (Jackson et al., 1989). Based on the water quality criteria defined by the state of Maryland, a public health hazard will be presumed if E. coli levels exceed 126 counts/100ml based on a geometric mean of at least five samples taken over 30 days or if levels exceed 576 counts/100ml on a single sample in a waterway where “Infrequent Full Body Contact Recreation” occurs. MONO E. coli Target Value: 126 counts/100 ml for 30 day 5-sample geometric mean or 576 counts/ 100 ml single sample Dissolved Oxygen Dissolved oxygen (DO) refers to the amount of oxygen dissolved in water. The dissolved oxygen concentration in water can directly affect reproduction and incubation, changes in species, and death of adult and juvenile fish and other organisms. Factors which affect the DO concentration in water include temperature, DO sources such as photosynthesis, DO sinks such as respiration and breakdown of organic material, and salinity. Low dissolved oxygen levels can result from algal blooms, low flows, elevated water temperature, human waste and animal waste. Based on the Maryland water quality criteria, MONO’s streams should equal or exceed a dissolved oxygen concentration of 5.0 mg/L. MONO Dissolved Oxygen Target Value: ≥ 5.0 mg/L pH pH is a measure of hydrogen (H+) ions in a water sample, with pH values lower than 7 indicating acidity while pH values higher than 7 indicate alkalinity. At the extreme ends of the pH scale (2
27

or 13), physical damage to gills, exoskeleton, and fins of aquatic species can occur. Changes in pH may also alter the concentrations of other substances in water to a more toxic form and increase toxic substance mobility, making it easier for organisms to absorb. In fresh water, increasing temperature decreases pH. Some factors that may affect pH in park waters include acid rain and fertilizers. Based on the Maryland water quality criteria, MONO’s streams should maintain a pH between 6.5 and 8.0. MONO pH Target Value: 6.5 – 8.0 Acid Neutralizing Capacity (ANC) Although pH is the most commonly used measure of acidification, acid neutralizing capacity (ANC) is a better overall measure of acidification and acid sensitivity because it indicates which systems are likely to become acidified under episodic conditions. The following ANC values were used to characterize streams according to acid sensitivity: < 0 µeq/L (acidic), 0 < ANC < 50 µeq/L (highly sensitive to acidification), 50 < ANC < 200 µeq/L (sensitive to acidification), and > 200 µeq/L (not sensitive to acidification) (Southerland et al., 2005b). According to Southerland et al. (2005b), ANC is typically well above the 200 µeq/L (800-1000 µeq/L) for the Upper Potomac basin, including MONO. Based upon these findings for the Upper Potomac basin, a target value > 600 µeq/L ANC was selected for MONO waters. It should be noted that the “Upper Potomac basin” as defined by Southerland et al. (2005b) is different from the Federal basins that include MONO, presented earlier in Figure 7a. MONO Acid Neutralizing Capacity Target Value > 600 µeq/L Nutrients Nutrients such as nitrogen and phosphorus are important for life in all aquatic systems. In the absence of human influence, streams contain a background level of nutrients that is essential to the survival of the aquatic plants and animals in that system. However, during the last several hundred years, the amount of nutrients in many stream systems has increased, as a result of anthropogenic influences such as agricultural runoff, wastewater discharge, and urban/suburban nonpoint sources. Elevated nitrogen concentrations are one contributor to nutrient enrichment in aquatic systems. Excessive nitrogen loading may lead to the eutrophication of the water body. Eutrophication often decreases the level of dissolved oxygen available to aquatic organisms. Prolonged exposure to low dissolved oxygen values can suffocate adult fish or lead to reduced recruitment. Increased nutrient loads are also thought to be harmful to humans by causing toxic algal blooms. In Maryland, concern for nutrient loadings to the Chesapeake Bay has drawn attention to the amounts of materials transported throughout the watershed by stream tributaries (Roth et al., 1999). Unfortunately, “excess” is a difficult determination to make because nutrient concentrations vary widely and interact with many other biological and physical conditions that can lead to undesirable effects. Factors than can influence nutrient criteria include: geographic region,
28
waterbody types, seasonality, and designated uses. As a result, there is no state criterion for nutrient concentrations. The national safe drinking water criterion for nitrate is < 10 mg/L (U.S. Environmental Protection Agency, 2007). Since there are no state criteria for nutrients, interim criteria are recommended based on Southerland et al. (2005b), where nutrient samples were collected from the Upper Potomac basin for 1 – 4 order streams. Southerland et al. (2005b) reviewed data from the second round of the Maryland Biological Stream Survey (MBSS), estimating nutrient thresholds.
st th
MONO “Interim” Nutrient Target Values: Nitrate: < 3.0 mg/L, Nitrite: < 0.010 mg/L, Ammonia: < 0.05 mg/L, Orthophosphate: < 0.010 mg/L Once clear nutrient relationships can be correlated with water resource health through park-specific studies, new nutrient criteria that support the goals for MONO’s water resources can replace these interim targets (see Strategies, Nutrient Target Values). Physical Indicators and Target Values Several sources were referenced in selecting appropriate physical indicators that would reflect physical aspects of MONO’s water resource health and provide appropriate target values. First, the current NCRN’s vital signs (indicators) for natural stream morphology and ground water processes were identified. They included; stream habitat structure, river depth, stream flow, stream discharge, and ground water elevation (National Park Service, 2005). These vital signs, along with some others, were then applied to two regionally-accepted habitat indices that evaluate stream condition and provide target values for their respective metrics: 1) Physical Habitat Index (Paul et al., 2002); and 2) Qualitative Suite of Habitat Metrics (Kazyak, 2001). Details on each of these methodologies are described in the following sections. Habitat Evaluation Physical stream habitat is the physical template upon which the biological structure of stream communities is built; without adequate habitat the biological potential of streams is limited. Not surprisingly, stream health, as determined by the condition of biological communities, has been shown to be directly correlated to physical habitat quality (Rankin 1995; Roth et al. 1996). Degradation of the physical habitat is among the leading causes of stream impairment nationwide (U.S. Environmental Protection Agency, 2000) and a critical factor affecting stream biodiversity (Allan and Flecker, 1993). An important component of any assessment program is, therefore, a sound habitat assessment approach. Together, chemical and physical data are used to assess water quality independently and also help identify stressors responsible for degraded biological conditions. In 1999, the Maryland Biological Stream Survey developed a provisional Physical Habitat Index (PHI) to synthesize physical habitat measurements into a single multi-metric index of physical habitat quality (Hall et al., 1999). A PHI was developed for coastal and non-coastal streams in
29

Maryland. The state followed methods largely adapted from other national and regional protocols (Pflakin et al., 1989; Ohio Environmental Protection Agency, 1987; Rankin, 1989). Paul et al. (2002) revised the PHI for use in streams across three classifications: coastal, piedmont, and highlands. As with the biological multi-metric indices used by Maryland, the PHI develops expectations for the structure and function of physical habitat from reference sites. That is, the approach compares the physical attributes of stream habitat to physical attributes at minimally-disturbed sites. For the Highlands region of Maryland that includes MONO (Paul et al., 2002), the PHI includes the following metrics and their associated habitat features reflected by the metrics:
METRIC FEATURE Transformed bank stability Geomorphology
Epibenthic substrate Visual Habitat Transformed percent shading Riparian Condition
Riparian width Riparian Condition Remoteness Remoteness
The metric scores are combined and the PHI score is adjusted to a centile scale that rates each sample site as follows: 81-100 (minimally degraded); 66-80 (partially degraded); 51-65 (degraded); and 0-50 (severely degraded). Interestingly, Roth et al. (1999) determined that a score of < 42 for the 1999 PHI was a threshold for stress based on 539 Maryland sites with a FIBI or BIBI score rated poor or very poor. MONO Target Value for Physical Habitat Index: ≥ 81 (note: use at existing NCR Network Vital Signs sampling sites at MONO) The Qualitative Suite of Habitat Metrics (Kazyak, 2001) is based on eight qualitative metrics of in-stream habitat quality that are scored for each site based on observations of habitat condition in streams during sampling visits (Table 4). The individual metric scores are interpreted based on several categories of habitat degradation; they are not combined into an index. Table 4 delineates the target value for each of these metrics. This suite of habitat metrics should be used at park-based monitoring sites, replacing the RCE (Riparian, Channel, and Environmental Inventory) currently used by MONO. It should be noted that none of these metrics is grounded through an understanding of reference site expectations.
30
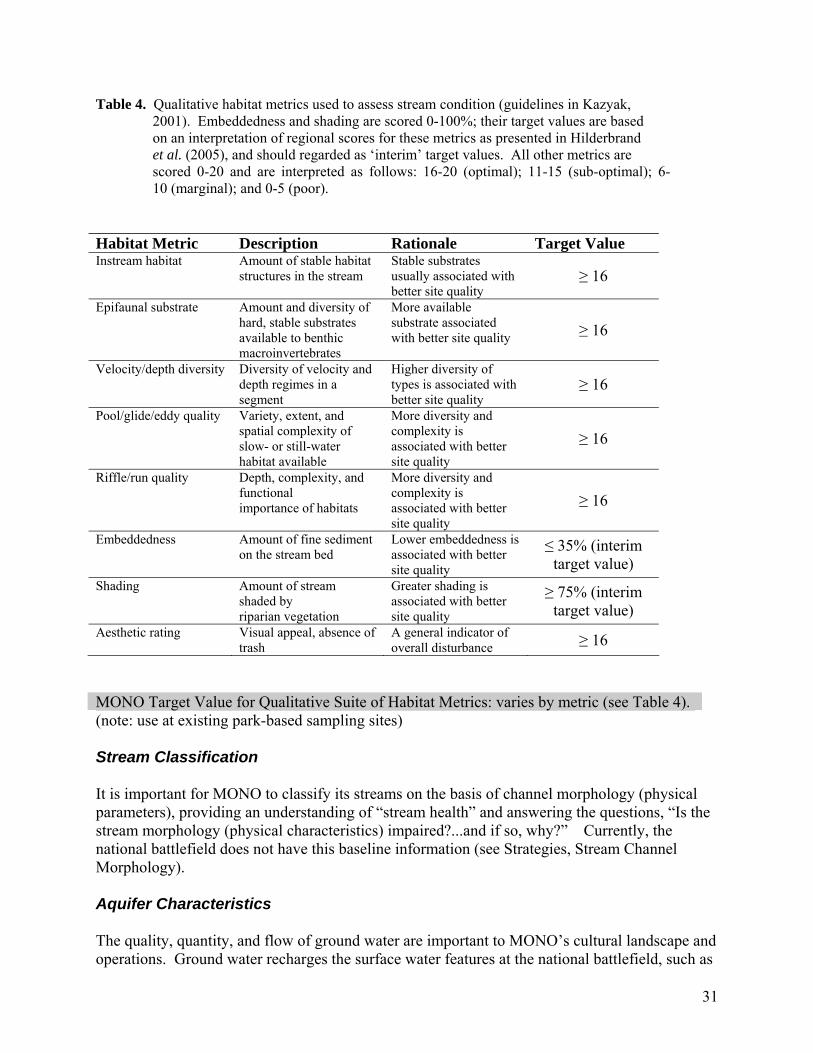
Table 4. Qualitative habitat metrics used to assess stream condition (guidelines in Kazyak, 2001). Embeddedness and shading are scored 0-100%; their target values are based on an interpretation of regional scores for these metrics as presented in Hilderbrand et al. (2005), and should regarded as ‘interim’ target values. All other metrics are scored 0-20 and are interpreted as follows: 16-20 (optimal); 11-15 (sub-optimal); 6- 10 (marginal); and 0-5 (poor).
Habitat Metric Description Rationale Target Value Instream habitat Amount of stable habitat
structures in the stream Stable substrates usually associated with better site quality
≥ 16
Epifaunal substrate Amount and diversity of hard, stable substrates available to benthic macroinvertebrates
More available substrate associated with better site quality ≥ 16
Velocity/depth diversity Diversity of velocity and depth regimes in a segment
Higher diversity of types is associated with better site quality
≥ 16
Pool/glide/eddy quality Variety, extent, and spatial complexity of slow- or still-water habitat available
More diversity and complexity is associated with better site quality
≥ 16
Riffle/run quality Depth, complexity, and functional importance of habitats
More diversity and complexity is associated with better site quality
≥ 16
Embeddedness Amount of fine sediment on the stream bed
Lower embeddedness is associated with better site quality
≤ 35% (interim target value)
Shading Amount of stream shaded by riparian vegetation
Greater shading is associated with better site quality
≥ 75% (interim target value)
Aesthetic rating Visual appeal, absence of trash
A general indicator of overall disturbance ≥ 16
MONO Target Value for Qualitative Suite of Habitat Metrics: varies by metric (see Table 4). (note: use at existing park-based sampling sites) Stream Classification It is important for MONO to classify its streams on the basis of channel morphology (physical parameters), providing an understanding of “stream health” and answering the questions, “Is the stream morphology (physical characteristics) impaired?...and if so, why?” Currently, the national battlefield does not have this baseline information (see Strategies, Stream Channel Morphology). Aquifer Characteristics The quality, quantity, and flow of ground water are important to MONO’s cultural landscape and operations. Ground water recharges the surface water features at the national battlefield, such as
31

streams, ponds, springs and wetlands. MONO also uses ground water as a potable water supply, with wells located inside and outside the national battlefield to satisfy the park and local community water needs. Currently, MONO does not have a baseline for seasonal ground water elevations, flow direction and flow velocity for the aquifer(s) that support natural resources and park operations (see Strategies, Groundwater Assessment). Biological Indicators and Target Values Biological integrity refers to the capacity to support and maintain a balanced, integrated, and adaptive biological system having the full range of elements (e.g., populations, species, assemblages) and processes (e.g. biotic interactions, energy dynamics, biogeochemical cycles) expected in a region’s natural habitat (Karr et al., 1986). The biological integrity of water resources is jeopardized by altering one or more of five classes of environmental factors: 1) alteration of physical habitat, 2) modifications of seasonal flow of water, 3) changes in the food base of the system, 4) changes in interactions within the stream biota, and 5) chemical contamination (Karr, 1992). Multi-metric indices of biotic integrity are the most common indicators of stream condition in use today. Just over a decade ago, 42 states used multi-metric indices of biological condition (U.S. Environmental Protection Agency, 1996). In 1998, Maryland developed fish (FIBI; Roth et al., 1998) and benthic macroinvertebrate (BIBI; Stribling et al., 1998) indices of biotic integrity as part of the Maryland Biological Stream Survey. These indices develop their expectations for the structure and function of biological assemblages from reference sites. This approach compares the ecological attributes of biological assemblages to assemblages at minimally-disturbed sites which by definition have high scores. These attributes, called metrics, quantify biological aspects of assemblages that correlate well with human influence, such as species composition, trophic composition, and abundance. These metrics, singularly or in aggregate, provide both numeric and narrative descriptions of resource condition, which can be compared among watersheds, across a single watershed, and over time (Karr, 1981). Recently, Southerland et al. (2005a) developed new FIBIs and BIBIs for Maryland that are based on a more refined dataset of reference streams; include more natural variation across geographic regions and stream types; and show more sensitivity via more classes, different metric combinations, or alternative scoring methods. The FIBI and BIBI applicable to MONO are detailed in Tables 5 and 6, respectively. Threshold scores for each metric are summed and the mean represents the FIBI or BIBI index score. For both, index scores range from 0 to 5.0; Table 7 provides the narrative description and qualitative value for various ranges in index score.
32
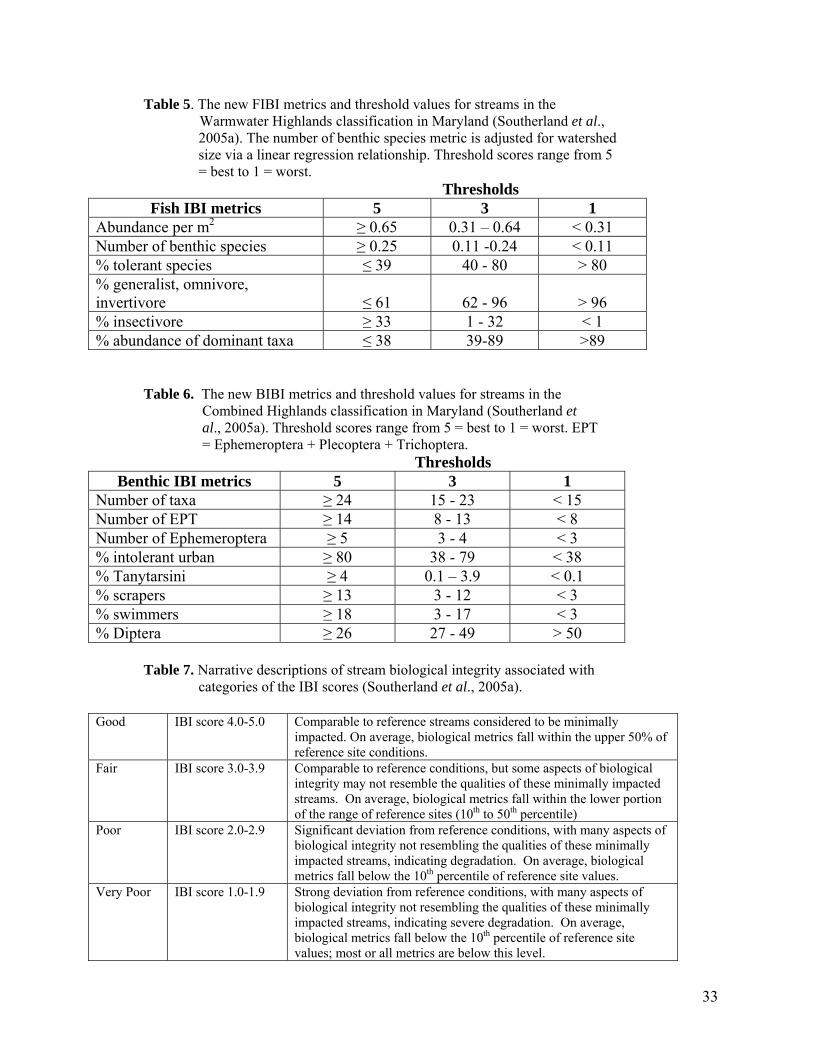
Table 5. The new FIBI metrics and threshold values for streams in the Warmwater Highlands classification in Maryland (Southerland et al., 2005a). The number of benthic species metric is adjusted for watershed size via a linear regression relationship. Threshold scores range from 5 = best to 1 = worst.
Thresholds Fish IBI metrics 5 3 1
Abundance per m2 ≥ 0.65 0.31 – 0.64 < 0.31 Number of benthic species ≥ 0.25 0.11 -0.24 < 0.11 % tolerant species ≤ 39 40 - 80 > 80 % generalist, omnivore, invertivore
≤ 61
62 - 96
> 96
% insectivore ≥ 33 1 - 32 < 1 % abundance of dominant taxa ≤ 38 39-89 >89
Table 6. The new BIBI metrics and threshold values for streams in the Combined Highlands classification in Maryland (Southerland et al., 2005a). Threshold scores range from 5 = best to 1 = worst. EPT = Ephemeroptera + Plecoptera + Trichoptera.
Thresholds Benthic IBI metrics 5 3 1
Number of taxa ≥ 24 15 - 23 < 15 Number of EPT ≥ 14 8 - 13 < 8 Number of Ephemeroptera ≥ 5 3 - 4 < 3 % intolerant urban ≥ 80 38 - 79 < 38 % Tanytarsini ≥ 4 0.1 – 3.9 < 0.1 % scrapers ≥ 13 3 - 12 < 3 % swimmers ≥ 18 3 - 17 < 3 % Diptera ≥ 26 27 - 49 > 50
Table 7. Narrative descriptions of stream biological integrity associated with categories of the IBI scores (Southerland et al., 2005a).
Good IBI score 4.0-5.0 Comparable to reference streams considered to be minimally
impacted. On average, biological metrics fall within the upper 50% of reference site conditions.
Fair IBI score 3.0-3.9 Comparable to reference conditions, but some aspects of biological integrity may not resemble the qualities of these minimally impacted streams. On average, biological metrics fall within the lower portion of the range of reference sites (10th to 50th percentile)
Poor IBI score 2.0-2.9 Significant deviation from reference conditions, with many aspects of biological integrity not resembling the qualities of these minimally impacted streams, indicating degradation. On average, biological metrics fall below the 10th percentile of reference site values.
Very Poor IBI score 1.0-1.9 Strong deviation from reference conditions, with many aspects of biological integrity not resembling the qualities of these minimally impacted streams, indicating severe degradation. On average, biological metrics fall below the 10th percentile of reference site values; most or all metrics are below this level.
33

Hilderbrand et al. (2005) analyzed stream site condition using both the FIBI and BIBI at various National Capital Region parks. They found that the indices responded differently to the various landscape, chemical, and physical attributes of sites and reflected the importance of using more than one taxonomic group to measure site condition. For instance, benthic macroinvertebrates were most closely related to water chemistry, especially nitrates. In contrast, fishes demonstrated little correlation to chemistry or land uses and were more associated with habitat features. Barker et al. (2006), looking at the effects of agricultural riparian buffers on stream health in Maryland, found similar results. In their study, site-based land management was not a controlling factor for the FIBI, and hence, it would not be prudent to use the FIBI to evaluate site-scale factors. In contrast, the BIBI responded to site-specific variables that reflected instream condition, adjacent land use, and chemistry. MONO Target Value for Fish Index of Biotic Integrity: ≥ 4.0 MONO Target Value for Benthic Index of Biotic Integrity: ≥ 4.0 (use at existing NCR Network Vital Signs sampling sites at MONO)
34

Water Resource Evaluation Current Condition versus Target Value A minimal amount of information exists on the condition of aquatic resources in the National Capital Region parks, including MONO (National Park Service, 2002). With indicator parameters and target values established in the previous sections, we can begin to evaluate the condition of MONO’s water resources using available data and further refining the assessments as more information is collected. By identifying which indicators and sampling locations achieve or do not achieve the selected target value, we can then begin to correlate influences (stressors) for the impacted water resources. In this section, the water resource evaluations are grouped under the following: chemical, physical and biological indicators, with each summarized in a table format. Chemical Indicators During a one-time 2004 water quality sampling event at MONO (Hilderbrand et al., 2005), four indicator parameters [nitrite (NO2) = 0.0323 mg/L (MONY-103), 0.0194 mg/L (MONY-301), and 0.0151 mg/L (MONY-201); nitrate (NO3) = 4.6 mg/L (MONY-103) and 3.58 mg/L (MONY-102); orthophosphate (OPO4) = 0.0211 mg/L (MONY-102), 0.0196 mg/L (MONY-103), and 0.010 mg/L (MONY-301); and pH = 9.46 (MONY-101 and MONY-103) and 9.38 (MONY-201)] did not meet the target value(s) (Table 8). The specific sampling locations are presented in Figure 10. Sampling sites in Figure 10 are dominated by agriculture in their watersheds (57-72% by area). Site 301 is a 3rd order stream site on Bush Creek. Sites 101 and 201 are on “Old” Visitor Center Creek and are 1st and 2nd order, respectively. (It should be noted that the name Visitor Center Creek was recently changed to “Old” Visitor Center Creek since a new visitor center was built at a different location in the national battlefield.) Sites 102 and 103 are on Harding’s Run and Thomas Farm Creek, respectively, and both are 1st order sites. Table 8. Water quality samples not meeting established target value(s) in 2004 (Hilderbrand et al., 2005).
Name (station #) pH NO2 NO3 OPO4 ANC “Old” Visitor Center Creek (MONY-101) 1 0 0 0 0 Harding’s Run (MONY-102) 0 0 1 1 0 Thomas Farm Creek (MONY-103) 0 1 1 1 0 Visitor Center Creek (MONY-201) 1 1 0 0 0 Bush Creek (MONY-301) 1 1 0 1 0
35

In reviewing the data from MONO’s water quality monitoring program (2004-2006), four indicator parameters (pH, NO3 (nitrate), DO (dissolved oxygen), and Temp (water temperature)) exceeded the established target value at most of the sites sampled (see Table 9). Sampling events were in April through August, with one sampling event in November (2004). The highest water temperature recorded was 30.3ºC at Harding’s Run #2 (07/17/06). The highest nitrate concentration was 23.9 mg/L at Thomas Pool (08/18/05). The Thomas #2 site had the highest pH (8.60) (04/25/06). The lowest dissolved oxygen concentration recorded was 0.27 mg/L at the VC (“Old” Visitor Center) Pond (07/17/06) and the lowest pH recorded was 4.43 at Lewis Spring (07/12/05). Table 9. Percentage of water quality samples not meeting the established target value(s) (2004-2006).
Station Name pH (n) NO3 (n) DO (n) Temp (n) VC Pond 50% (12) 0% (11) 83% (12) 15% (13) Thomas Pool 100% (11) 83% (12) 82% (11) 17% (12) Lewis Spring House 92% (12) 46% (13) 50% (12) 23% (13) Brooks Hill Pool 50% (2) 67% (3) 0% (2) 0% (3) Gambrill Spring 100% (1) 100% (1) no sample 0% (1) Harding’s Run #1 33% (12) 30% (13) 25% (12) 31% (13) Harding’s Run #2 33% (12) 15% (13) 17% (12) 31% (13) Harding’s Run #3 27% (11) 9% (11) 27% (11) 50% (12) Harding’s Run #4 0% (11) 9% (11) 45% (11) 42% (12) Bush Creek #1 0% (11) 15% (13) 17% (12) 8% (13) Bush Creek #2 25% (12) 8 % (13) 25% (12) 8% (13) Thomas #1 18% (11) 18% (11) 36% (11) 8% (12) Thomas #2 9% (11) 50% (12) 18% (11) 8% (12)
Figure 10. Monocacy National Battlefield sample locations (from Hilderbrand et al., 2005).
36

In reviewing water quality data collected at three sites by the NPS NCR network (2005-2006), four indicator parameters [pH, NO3 (nitrate), NH3 (ammonia), and DO (dissolved oxygen)] exceeded the established target value at all sites sampled, excluding pH collected at Harding’s Run (see Table 10). Sampling events were from May through August. The highest water temperature recorded was 23.4ºC at Bush Creek (BUCK) on 07/24/06 and 08/15/06. The highest nitrate concentration recorded was 14.2 mg/L at Harding’s Run (HARU) (10/06/05). The highest ammonia concentration recorded was 0.152 mg/L at “Old” Visitor Center Creek (VCCR) and the highest pH recorded was 9.42 at BUCK. The lowest acid neutralizing capacity was 616 µeq/L at HARU (02/23/06). The lowest pH recorded was 7.07 at HARU (01/23/06). Table 10. Percentage of water quality samples not meeting established target value(s) (2005-2006).
Name (station #) pH (n) NO3 (n) NH3 (n) DO (n) Temp (n) ANC (n) MONO-BUCK 77% (13) 14% (14) 33% (6) 15% (13) 0% (13) 0% (12) MONO-HARU 0% (12) 46% (13) 20% (5) 50% (12) 0% (12) 0% (11) MONO-VCCR 25% (12) 77% (13) 17% (6) 17% (12) 0% (11) 0% (11)
Potable water used for MONO’s facilities is obtained from ground water wells near the facilities. Based on the samples collected, the quality of ground water for personal consumption meets all required drinking water standards (National Park Service, 2007). Biological Indicators Hilderbrand et al. (2005) provide a baseline of biological conditions for five stream sites at MONO (Figure 10). However, they used the older, pre-2005 Fish Index of Biotic Integrity (FIBI) and Benthic Index of Biotic Integrity (BIBI). Therefore, MONO/NCRN should re-calculate the index values using the newer FIBIs and BIBIs of Southerland et al. (2005b). Undoubtedly, index scores will change such that current condition, as discussed below, is for illustration purposes only. However, it is unlikely that index scores would change enough to meet the target value.
Biological assessments using the FIBI and BIBI indicate generally poor condition in the smaller streams at MONO; no sites met target values (Table 11). The Bush Creek site rates as fair for both the FIBI and BIBI; all other sites range from poor to very poor for both the FIBI and BIBI. Although 48 taxa were recorded across the five MONO sites, sites scored low on Ephemeroptera related metrics, Tanytarsini chironomids, and intolerant taxa (Table 12). The latter illustrates an important point with regard to the use of any multi-metric index – do not lose sight of the individual metric values and their trends. They can provide information that can be early warning signs of incipient anthropogenic impacts. Individual metrics are often more valuable than the index score.
37
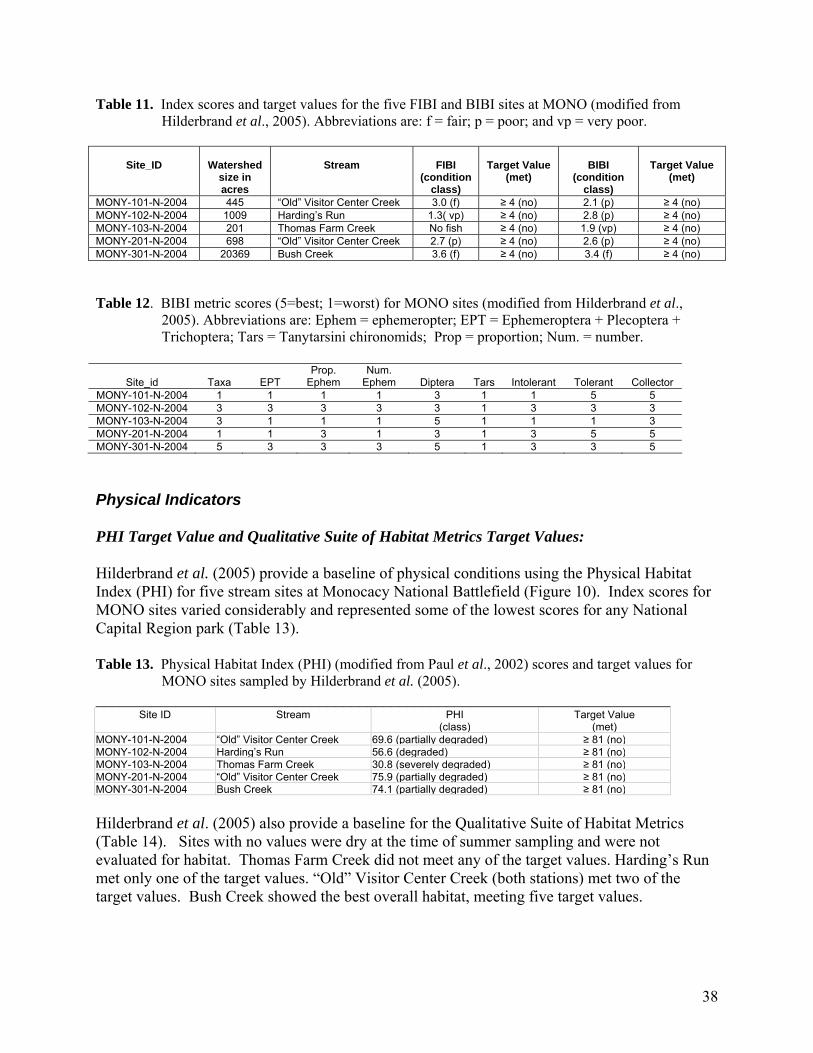
Table 11. Index scores and target values for the five FIBI and BIBI sites at MONO (modified from Hilderbrand et al., 2005). Abbreviations are: f = fair; p = poor; and vp = very poor.
Site_ID
Watershed
size in acres
Stream
FIBI
(condition class)
Target Value
(met)
BIBI
(condition class)
Target Value
(met)
MONY-101-N-2004 445 “Old” Visitor Center Creek 3.0 (f) ≥ 4 (no) 2.1 (p) ≥ 4 (no) MONY-102-N-2004 1009 Harding’s Run 1.3( vp) ≥ 4 (no) 2.8 (p) ≥ 4 (no) MONY-103-N-2004 201 Thomas Farm Creek No fish ≥ 4 (no) 1.9 (vp) ≥ 4 (no) MONY-201-N-2004 698 “Old” Visitor Center Creek 2.7 (p) ≥ 4 (no) 2.6 (p) ≥ 4 (no) MONY-301-N-2004 20369 Bush Creek 3.6 (f) ≥ 4 (no) 3.4 (f) ≥ 4 (no) Table 12. BIBI metric scores (5=best; 1=worst) for MONO sites (modified from Hilderbrand et al., 2005). Abbreviations are: Ephem = ephemeropter; EPT = Ephemeroptera + Plecoptera + Trichoptera; Tars = Tanytarsini chironomids; Prop = proportion; Num. = number.
Site_id Taxa EPT Prop.
Ephem Num.
Ephem Diptera Tars Intolerant Tolerant Collector MONY-101-N-2004 1 1 1 1 3 1 1 5 5 MONY-102-N-2004 3 3 3 3 3 1 3 3 3 MONY-103-N-2004 3 1 1 1 5 1 1 1 3 MONY-201-N-2004 1 1 3 1 3 1 3 5 5 MONY-301-N-2004 5 3 3 3 5 1 3 3 5
Physical Indicators PHI Target Value and Qualitative Suite of Habitat Metrics Target Values: Hilderbrand et al. (2005) provide a baseline of physical conditions using the Physical Habitat Index (PHI) for five stream sites at Monocacy National Battlefield (Figure 10). Index scores for MONO sites varied considerably and represented some of the lowest scores for any National Capital Region park (Table 13). Table 13. Physical Habitat Index (PHI) (modified from Paul et al., 2002) scores and target values for MONO sites sampled by Hilderbrand et al. (2005). ________________________________________________________________________
Site ID Stream PHI (class)
Target Value (met)
MONY-101-N-2004 “Old” Visitor Center Creek 69.6 (partially degraded) ≥ 81 (no) MONY-102-N-2004 Harding’s Run 56.6 (degraded) ≥ 81 (no) MONY-103-N-2004 Thomas Farm Creek 30.8 (severely degraded) ≥ 81 (no) MONY-201-N-2004 “Old” Visitor Center Creek 75.9 (partially degraded) ≥ 81 (no) MONY-301-N-2004 Bush Creek 74.1 (partially degraded) ≥ 81 (no) Hilderbrand et al. (2005) also provide a baseline for the Qualitative Suite of Habitat Metrics (Table 14). Sites with no values were dry at the time of summer sampling and were not evaluated for habitat. Thomas Farm Creek did not meet any of the target values. Harding’s Run met only one of the target values. “Old” Visitor Center Creek (both stations) met two of the target values. Bush Creek showed the best overall habitat, meeting five target values.
38

Table 14. Qualitative Suite of Habitat Metrics for MONO sites (Hilderbrand et al., 2005). Parenthetical letters refer to meeting (Y) or not meeting (N) the target value.
site_id Stream Instream habitat
Epifaunal substrate
Velocity- depth
Pool/ glide
Riffle/ run Embed Shading
Aesthetic rating
MONY-101-N-2004
“Old” Visitor Center Creek
7 (N) 13 (N) 7 (N)
6 (N)
8 (N) 35 (Y) 30 (N) 16 (Y)
MONY-102-N-2004 Hardings Run
9 (N) 10 (N) 7 (N)
8 (N)
7 (N) 41 (N) 88 (Y) 8 (N)
MONY-103-N-2004 Thomas Farm
Creek 6 (N) 6 (N) 6 (N)
5 (N)
6 (N) 60 (N) 10 (N) 8 (N)
MONY-201-N-2004
“Old” Visitor Center Creek
9 (N) 11 (N) 8 (N)
8 (N)
11 (N) 40 (N) 89 (Y) 16 (Y)
MONY-301-N-2004 Bush Creek
17 (Y) 14 (N) 16 (Y)
14 (N)
18 (Y) 30 (Y) 75 (Y) 15 (N)
39

40

Stressors In evaluating water resources at MONO, the identification of stressors is critical for development of appropriate management strategies to restore or protect the management goals for water resources. Stressor identification assists NPS management with the formulation of approaches that address impaired aquatic systems. Aquatic habitat degradation can result from a variety of human activities occurring within the stream itself or in the surrounding riparian zone and watershed. Urban development, agriculture and livestock grazing are well-known examples of human activities affecting streams at a broader scale. Alone or in combination, these human activities may cause changes in vegetative cover, sediment loads, hydrology, and other factors influencing stream habitat quality. In watersheds affected by anthropogenic stress, riparian forests can ameliorate inputs of nutrients, sediments, and other pollutants to streams. They also provide other functions such as shade, and inputs of leaf litter and large woody debris. This section identifies some of the known stressors at MONO, under common themes, that influence water resources at the national battlefield. Non-Point Source Pollution Crop Production Nutrients were elevated above the respective target values for most sites sampled in MONO (Tables 8, 9, and 10). This is not surprising given the heavy agriculture land use practices within and outside the national battlefield boundary. The elevated nutrient concentrations likely contributed to the low dissolved oxygen concentrations recorded, where most sites were found to be less than the target value of 5 mg/L at least once during the sampling events (Table 9 and 10). Eighty three percent and 82% of the dissolved oxygen samples collected from the “Old” Visitor Center Pond and Thomas Farm Creek (Thomas Pool), respectively, were below the target value. pH values were both above and below the target range (6.5 - 8.0) for many of MONO’s water quality samples. At a Thomas Farm Creek site (Thomas Pool), 100% of the samples collected exceeded the target range (see Table 9). This is surprising since limestone and dolomite would provide some level of buffering to neutralize waters. The acid-neutralizing capacity of waters is high (> 600 µeq/L) at the national battlefield and not sensitive to acidification. Hilderbrand et al. (2005) speculated that the high pH recorded at some water quality sampling sites may be in response to agricultural lime applications in the area. Livestock Production Livestock is also a major source for nutrient loading in the national battlefield, along with bacteria contamination and negative impacts to riparian habitat and stream morphology. Stream corridors are particularly attractive to livestock for many reasons. They are generally highly productive, providing ample forage. Water is close at hand, shade is available, and slopes
41

are gentle, generally less than 35 percent in most areas. Unless carefully managed, livestock can overuse these areas and cause significant problems. Platts (1991) reviewed 19 studies of grazing in riparian areas, of which 15 reported either decreased fish abundance with livestock grazing or an increase in fish abundance with cessation of grazing. Unmanaged grazing can significantly change stream geomorphology. Bank instability and increased sedimentation can cause channel widening and increases in the width/depth ratio. Increased meandering may result, causing further instability. Reduced vegetative cover can increase soil compaction and decrease the depth and productivity of topsoil. Loss of cover of mid-story and overstory plants decreases shade and increases water temperatures. Sediment from upland or stream bank erosion can reduce water quality through increases in turbidity and attached chemicals. Where animal concentrations are large, fecal material can increase nutrient loads above standards and introduce bacteria and pathogens. Dissolved oxygen reductions can result from high temperatures and nutrient-rich waters. Extensive loss of ground cover in the watershed and stream corridor can decrease infiltration and increase runoff, leading to higher flood peaks and additional runoff volume. Flow peaks may come earlier in the runoff cycle, producing a flashier stream system. Transportation and Utility Corridors Parts of the battlefield have been degraded, primarily by the construction of Interstate 270. Approximately two miles of Interstate 270 pass through MONO, bisecting the battlefield. The I-270/U.S. Multi-Modal Corridor Study includes several alternatives for widening I-270 through the national battlefield (U.S. Department of Transportation and Maryland Department of Transportation, 2002). The alternatives range from constructing one to two more lanes in each direction, for a total of six- and eight-lane highway, respectively. The national battlefield acreage required for the new lanes was initially calculated at 11.74 acres for the one lane expansion and 22.52 acres for the two lane expansion. The study included consideration of three measures for reducing the required acreage for road construction in MONO: steeper slopes, retaining walls, and reduced width of inside shoulders. Under the two-lane expansion alternative, substantial retaining walls averaging seven feet in height would be required (National Park Service, 2005). Historic Urbana Pike (State Highway 355) is the main access for visitors to the battlefield and runs north-south through the eastern part of MONO. This highway, which has four lanes on the north side of the national battlefield, is heavily used by commuters, residents, and business vehicles. In the national battlefield, the highway is two lanes (National Park Service, 2005). Chloride values were double the regional averages at all sites in the national battlefield except Bush Creek, which was also above average. Hilderbrand et al. (2005) suggested that the high chloride levels could be related to runoff from Interstate 270 and other major roads to the east. Runoff from impervious surfaces within the national battlefield such as parking lots can concentrate polluted runoff (oils, metals, chlorides, etc.) into the local aquatic environments.
42

The Urbana Region Plan identifies a transitway alignment along the east side of the Interstate 270 (Frederick County Department of Planning and Zoning, 2004). This alignment is depicted as traversing the Lewis, Thomas, and Best farms, but the plan recommends further study of the transitway alignment to determine feasibility, in part because of the potential impact on the battlefield. In recognition of the national battlefield’s significance, it also indicates that MD 355 should be maintained as a two-lane roadway through MONO (National Park Service, 2005). MONO is crossed by several utility lines, including water, sewer, and gas (National Park Service, 2005). Population growth and associated development have increased pressure to expand the existing infrastructure and install new infrastructure in the national battlefield. Such proposals include running more water and sewer lines through various areas of the battlefield. Point Source Pollution Wastewater Treatment Systems Surface and ground water quality are threatened by point source pollution from septic systems on or near the national battlefield, as well as a wastewater treatment plants that discharge upstream into the Monocacy River (Site ID: MD0021610 and MD0020877) and along the national battlefield’s eastern boundary (Site ID: MD0021822). These pollutants may affect nutrient and bacteria levels, pH, and conductivity of the watershed, as well as promote accelerated eutrophication (Conneely, 2004). In the past, elevated bacteria concentrations have been a problem in the Monocacy River downstream of the Frederick Sewage Treatment Plant. The Lower Monocacy River (MD 02140302-R) was listed in 2004 by the U.S. EPA as impaired from fecal coliform, nutrients and suspended sediments (U.S. Environmental Protection Agency, 2006). The NPS Center for Urban Ecology collected water samples (August 2003) from MONO’s “Old” Visitor Center Pond in response to several fish kills, excessive aquatic plant growth, and offensive odors (Runde, 2003). The results from the 2003 samples confirmed a very low dissolved oxygen concentration in the pond of 0.24 mg/L, far below the 5.0 mg/L target value recommended for the protection of early life stages for aquatic fauna. The low nutrient concentrations (nitrate = 0.03 mg/L; nitrite = 0.0002 mg/L; ammonia = 0.05 mg/L) were attributed to the prolific growth of aquatic plants in the pond. Runde (2003) expected an eventual transfer of nutrients to the water column, and then to pond sediments, when the plants perish. MONO’s septic system is thought to contribute to the nutrient loading at the “Old” Visitor Center Pond, but dye tracing was unable to confirm this theory. Underground Storage Tanks and Salvage Yard Water samples collected in 1990 and 1991 from a groundwater seep located adjacent to the Phillip and Stup properties contained trace amounts of toluene and MTBE, each associated with petroleum products. These contaminates suggest groundwater contamination (gasoline) from leaking underground storage tanks (Maryland Department of the Environment, 1990 & 1991). A junkyard located along MONO’s eastern boundary may be another source for shallow ground water contamination.
43

Hazardous Waste Spills A number of major transportation routes are within or adjacent to MONO. Along with interstates and roads, the CSX Railroad extends through the national battlefield, paralleling the Monocacy River and Bush Creek (National Park Service, 2005). Trucks and rail cars carry fuel oil, diesel fuel, gasoline, and a variety of agricultural and industrial chemicals along these corridors. Both the type and quantity of material transported along these arteries are sufficient to cause serious water quality problems within MONO if a spill were to occur. Land Use Influences on Aquatic Habitat Stream Morphology All streams that pass through the national battlefield exhibit some degree of channel structure degradation, in part from increased upstream runoff. Construction and development in the surrounding area have increased the amount of impervious surface and contributed to this harmful change. As Bush Creek nears its confluence with the Monocacy River, the stream channel becomes incised and much of the stream bank is undercut (National Park Service, 2007). As Harding’s Run passes under Baker Valley Road and through the national battlefield, its volume increases and the stream becomes more incised. Near the mouth of the stream, the banks are eight feet high and extremely undercut (National Park Service, 2007). Other intermittent streams that run through the national battlefield usually contain flowing water about six to eight months of the year and typically display degraded channel structures (National Park Service, 2007). Sedimentation Freshwater mussels and aquatic associates across all drainages in Maryland are undergoing drastic population declines primarily due to increased sedimentation and siltation, poor water quality from changes in land use, and agriculture runoff (Motivans, 1995). Sediment within the water column and streambed can come from both terrestrial and channel sources. Initially, cleared land and removal of important riparian habitat produces large sediment loads into streams and can lead to an aggradation phase where the channels are filled with sediment. Following construction, sediment loads are reduced and the increased high flows, resulting from increased runoff, gradually remove the sediment so the channel widens and deepens. During this erosional phase, most of the sediment carried by the stream comes from channel erosion rather than terrestrial sources (Southerland et al., 2005b). Fine sediment can interfere with breathing, feeding, reproducing, and food production for many aquatic species (Wood and Armitage, 1997). Consequently, sediments can depress populations of invertebrates and fishes and increase the dominance of silt-tolerant species. MONO’s water quality and aquatic resources are at risk from sedimentation and stream erosion, caused in part by poor agricultural practices and surrounding development (National Park Service, 2005). The lack of native freshwater mussels in Bush Creek could be due to several factors: general habitat degradation or pollution, lack of a fish host, the exotic Asian clam, or sedimentation. Since there was not an abundance of Asian clam in Bush Creek, it is not believed
44

to be a major factor on the lack of freshwater mussels. Freshwater mussels have very specialized habitat requirements. They need a stable, relatively silt-free streambed (but not too rocky) and well-oxygenated shallow water free of pollutants. Upstream non-point source pollution (e.g., agricultural runoff) is likely the most important limiting factor for freshwater mussels at Bush Creek (Motivans, 1995). Based on Maryland’s 2006 303(d) list for impaired water bodies in the state, the aquatic biology is listed as potentially impaired in Bush Creek. There is currently insufficient water quantity data to determine Bush Creek’s attainment status (subbasin code: 021403020228), while another reach of Bush Creek (subbasin code: 021403020229) is listed as potentially requiring a TMDL to move the creek to attainment of the biological standard (Maryland Department of the Environment, 2006a). Riparian Buffers Water temperatures exceeded the target value (75ºF (23.9ºC)) at many sites sampled (2004-2006) by NPS staff (Table 9). The reduced riparian cover that reduces shading is likely a factor for these high water temperatures. Water Demands During the droughts of 1999 and 2002, hundreds of domestic wells failed, some public water systems’ well yields were significantly reduced and public water systems using surface supplies without adequate reservoir storage were dangerously close to being unable to meet demands. Some systems installed emergency water intakes, some violated permit flow-by conditions, and some communities hauled water from other localities to meet their water needs. Citizens and businesses felt the economic and lifestyle pinch of water restrictions, and natural ecosystems were stressed as streambeds across the State went dry (Wolman et al., 2006). Non-native Plants The most extensive stressor (92% of stream miles in the county) characterized by the Maryland Biological Stream Survey in Frederick County (2000-2004) is non-native terrestrial plants in the riparian zone. Other stressors found are: streams with non-native aquatic fauna (54% stream miles); eroded banks (19% stream miles); streams with > 5% urban land use upstream (13% stream miles); and streams with no riparian buffer zone (11% stream miles) (Kazyak et al., 2005).
45

46

Strategies The heart of a park’s Resource Stewardship Strategy (RSS), as the title implies, is to identify strategies that move priority park resources toward the desired conditions established in the GMP. This section takes MONO’s two water resource goals and lists strategies, under common themes, for consideration in MONO’s RSS report. These strategies work towards improving water resource data collection and begin to address known stressors, moving MONO’s water resources towards the water resource goal, and ultimately towards the desired condition. Water Resource Goal: Chemical integrity of park waters (surface and ground waters) is improved and/or maintained to support all native life and meet or exceed designated use standards Inventory and Monitoring Water Quality Monitoring Program: MONO and NCRN staff should coordinate sampling efforts (water quality parameters, sample methodologies, and sample locations) between their respective water quality programs at the national battlefield (Conneely, 2004; National Park Service, 2005a). This would enable the data generated from both programs to be used together for trend analyses. Sampling frequencies should also compliment each other to maximize efficiencies in seasonal evaluations and sampling costs. E coli sampling is recommended due to the history of bacteria contamination in MONO’s aquatic environments. For one of the parameters currently sampled, acid neutralizing capacity (ANC), a reduction in the sampling frequency is recommended. The high ANC values recorded in MONO (> 600 µeq/L) support the high ANC values presented by Southerland et al. (2005b) for the region, offering adequate buffering against acidification of water resources. Nutrient Target Values: Since there are no State criteria for nutrients, it is recommended that nutrient samples be concurrently collected with biological assessments in MONO to examine the statistical relationship between nutrient concentrations and the assessment endpoints, such as the fish and benthic indices of biotic integrity. Once clear nutrient relationships can be correlated with water resource health, park-specific numerical criteria can be determined that support the goals for MONO’s water resources. Until this has been completed, interim nutrient target values are provided based on regional data. Nutrient TMDLs are under development for the Upper and Lower Monocacy River Watershed. Ground Water Assessment: Water quality samples from existing wells and springs should continue, using the surface water chemical parameters and target values presented in this report. For potable water supplies,
47
MONO should use the U.S. EPA drinking water standards (U.S. Environmental Protection Agency, 2007) as target values. Riparian Restoration and Protection Substantial evidence exists to emphasize the importance of maintaining riparian zones in headwater regions, which can be areas of high nitrogen removal (Richardson et al. 2004; Bernhardt et al. 2005). Riparian stream buffers are also an effective solution to reduce sedimentation and stream erosion, while maintaining important aquatic habitat (maintaining natural stream temperatures and providing important structural habitat). For MONO, riparian buffers must be established in keeping with the historic landscape (National Park Service, 2005). The national battlefield is encouraged to maximize riparian buffers along stream corridors. Implementation of Riparian Forest Buffer Systems (RFBS) within the Chesapeake Bay watershed has been encouraged, especially for agricultural areas. The NPS is one of 15 federal agencies participating in this regional effort to identify and implement riparian buffer restoration projects (Lowarance et al., 1995). This section presents some of the latest information on stream responses to various riparian buffers, describing benefits from various riparian types (i.e., grass vs forest buffers) and riparian widths. Within the context of preserving the historic landscape at MONO, maximizing benefits from riparian buffers to improve water quality and reduce erosion should be the objective. Given the amount of agricultural land use in MONO, it is important to understand the capability of riparian zone types and widths to control nutrients entering water bodies. Meyer et al. (2006) reviewed 66 studies from the riparian buffer zone literature. They found nitrogen removal effectiveness varied widely among studies but overall, buffers were effective at removing large proportions of the nitrogen found in water flowing through riparian zones (mean of 74% effectiveness; see Table 15). Furthermore, a small but significant proportion of the variance in removal of nitrogen was explained by buffer width – that is wider buffers removed more nitrogen, but other factors also must have affected effectiveness. Additionally, greater consistency of nitrogen removal was evident with increasing buffer width. For example, nitrogen removal effectiveness in buffers < 50 m wide was more variable than those > 50 m where nearly all buffers exhibited a 75%-removal effectiveness. Finally, grass buffers were significantly less effective than forest buffers at removing nitrogen whereas other buffers were equally effective (Table 15). However, grass riparian buffers are better than none at all. For example, conversion of a portion of a corn field to a riparian buffer of fine leaf fescue decreased overland flow concentrations of total Kjeldahl nitrogen by 70% and nitrate by 83%. Grass filter strips 4.6- and 9.1-m wide reduced surface nitrate runoff from no-till cornfields by 27% and 57%, respectively. But, similar filter strips installed below animal feedlots were ineffective (Dillaha et al. 1988, 1989). Combining grass with forest greatly improved nitrogen removal effectiveness (Table 15). Lee et al. (2003) found that the addition of a 9.2-m woody buffer to a 7.1-m grass buffer increased effectiveness by 20%, removing 84% of the total nitrogen and 85% of the nitrate in runoff.
48

Table 15. Mean and percent effectiveness of riparian buffers at removing nitrogen (after Meyer et al., 2006). Buffer widths necessary to achieve a given percent effectiveness (50%, 75%, 90%) are approximate values predicted by the non-linear model y=a*ln(x)+b. Effectiveness was not predicted (np) for models with R2 values < 0.2.
An approach, thought to maximize nutrient removal capacity of buffers to protect streams in agricultural use, involves a three-zone system (Schultz et al., 1995, National Resources Conservation Service, 2003) characterized by a zone of grasses and forbs immediately next to the area of disturbance, a middle zone of shrubs, and a zone of trees nearest to the stream channel. In theory, sediments and nutrients in surface runoff flowing from agricultural fields are intercepted first by the grass zone, while nutrients entering deeper subsurface pathways are taken up by shrub and tree roots (Natural Research Council, 2002). Additionally, this or any other riparian buffer system may behave differently given the karst environment that underlies the national battlefield. Barker et al. (2006) used MBSS data to determine effects of agricultural riparian buffers on measures of biological stream health. They determined that BIBI and PHI were the most appropriate indicators to measure effectiveness of buffer installations. Furthermore, the threshold width for improved PHI indicated that installation of even narrow forest buffers (< 5 m) may directly affect instream habitat. BIBI scores were demonstrably higher only at wider buffer sites, indicating that an investment of more than 35 m may be necessary to see ecological effects. Hazardous Material Spill Prevention and Response Roadways and railways cross through the national battlefield and are used to transport a variety of products that include hazardous materials. A hazardous material spill along these transportation corridors could have serious consequences to the battlefield’s aquatic resources. Along with these external threats to hazardous materials, MONO manages hazardous materials for internal park operations (i.e., pesticides, paint, gasoline, etc.). These materials should be managed (following regulated containment and disposal procedures) to minimize potential impacts to the national battlefield’s environment.
49

This section provides a recommended framework for managing hazardous materials and responding to accidental spills that impact the national battlefield. MONO staff should delineate spill-sensitive natural resources and develop a mechanism to provide resource-specific information and advice to the Department of Interior Regional Response Team in the event of a major spill. In working with the response team, MONO may decide to store important spill mitigation supplies within the national battlefield, if appropriate, to help facilitate an emergency response. Appropriate MONO and NCR staff should be familiar with all applicable regional and local Hazardous Materials Spill Contingency Plans, and response action Standard Operation Procedures (SOPs). Historic spills and associated responses that have affected MONO should be reviewed. From these reviews, a Spill Contingency Plan (SCP) for the national battlefield should be prepared. The SCP should provide outline response procedures for small spills that can be addressed locally and identify notification and response procedures for larger spills that require immediate additional assistance. This includes coordination with the Maryland Department of Transportation, Federal Highway Administration, U.S. EPA, Maryland Department of the Environment, FEMA, and other appropriate entities. A spill prevention and response program for hazardous materials should be established at MONO. Standard measures include procedures for storing and handling hazardous materials, spill containment, cleanup, and reporting procedure, as well as limiting refueling and other hazardous activities to non-sensitive sites (National Park Service, 2005). Safety meetings and preparedness drills should be conducted annually after the SCP is in place. Cultural Landscape Management Agricultural activities maintain the historic agrarian character of the national battlefield’s landscape. A management challenge for the NPS is maintaining the agrarian character while protecting natural resources. Agriculture encompasses approximately 760 acres within the 1355 acres of fee simple ownership. Agricultural activities within the park include pasturing heifers, dairy cows, and beef cattle; cultivating row crops, including corn, soybeans, and small grains; and growing cool season pasture grasses for hay production. The park maintains this agricultural landscape through agreements with local farmers. An agricultural Special Use Permit is issued to the farmer for a 5-year period, which enumerates conditions placed on the operation of the farms. Some of these conditions include setting the stocking rate (number of livestock per acre), establishing and preserving riparian buffers, controlling noxious weeds, and requiring pesticide use applications and annual use logs. Per Maryland state law, each farmer is required to prepare and follow a Nutrient Management Plan. This plan analyzes the crop yield and nutrient requirements and levels and availability of nutrients in the soil to balance crop nutrient requirements and the amount and type of fertilizer that should be applied to the land. A copy of this plan is submitted to the park, and is another part of the management requirements placed on the farmers.
50

The sections below build from the required Special Use Permits and Nutrient Management Plans, elevating strategies that minimize water resource impacts from the cultural landscape management in the national battlefield. Crop Management: Pesticides, herbicides, and fertilizers should be used conservatively inside the boundaries of the national battlefield. The quantity, application methods, and timing of these chemical applications can influence offsite contamination of aquatic environments. Pesticides, herbicides and fertilizers can make their way into surface water and ground water from leaching and rain events, negatively impacting aquatic resources and potable water supplies. Implementation of Integrated Pest Management techniques (based on the specific soils, climate, pest history, and crop for a particular field) will reduce contamination of waterways. Proper storage, mixing and handling of pesticides are also essential in minimizing risk to the environment. Occasional pesticide sampling of MONO’s water resources is recommended during peak application periods and runoff events to evaluate efficiencies of the applications and best management practices. Coordination is recommended with CSX Railroad and the Maryland Department of Transportation on herbicide use practices. Minimizing herbicide application should be encouraged whenever possible. For example, Motivans (1995) recommended changing chemical application to mechanical weed control along fence lines. Developing procedures to work with Soil Conservation Districts regarding agricultural impacts are also recommended (Frederick County, 2004). Some best management practices are already in place to limit soil erosion and runoff into streams. This would include erosion control, crop rotation, nutrient management, and soil conservation (National Park Service, 2005). Conventional and conservation tillage practices affect the movement of water, soil and chemicals within and from a field. Conservation tillage refers to many different types of tillage and planting practices which leave crop residues on the soil surface. Crop residue cushions the erosive impact of raindrops on the soil surface, slows surface water flow, enhances infiltration, reduces wind erosion and conserves soil moisture. Different tillage practices affect soil properties which subsequently affect contaminant movement within and from a field. Tillage reduces the ability for water to infiltrate down through the soil profile by disturbing soil structure. The amount or proportion of water infiltration and runoff can vary greatly among fields, depending on slopes, soil texture, structure and internal drainage (Faucett et al., 1994). Tillage practices can change the volume of runoff and erodible sediment which moves off the field. A review of several paired watershed studies by Faucett et al. (1994) showed that conventional tillage fields tend to have significant water runoff, soil erosion, and agri-chemical loss while conservation tillage fields show no seasonal runoff. They also noted that conservation tillage systems have often, but not always, increased infiltration and reduced runoff. Although
51

conservation tillage systems have been shown to reduce total water runoff, concentrations of pesticides are sometimes increased by the reduced runoff volume. This may be due to an increased reliance on herbicides in some conservation tillage systems. Best management practices recommended by the Chesapeake Bay Program (2006a) that reduce or eliminate soil loss, prevent runoff, and provide for the proper application rates of nutrients to cropland include:
• Vegetated buffer strips at the edge of crop fields • Conservation tillage that leaves at least 30% of the field surface covered with crop
residue after planting is completed and involves reduced or minimum tillage. • Strip cropping, where alternate strips of row crop or small grain and hay are planted in
the same field. There are three main types: contour strip cropping, field strip cropping and buffer strip cropping.
• Soil conservation and water quality planning • Nutrient management planning, which helps to maintain high yields and save money on
the use of fertilizers while reducing nutrient pollution of waterways. • Stream bank fencing to restrict stream access.
Livestock Management: Two of the three tributaries that empty into the Monocacy River flow through pastures where livestock have access to the streams. Impacts from livestock include increases in nutrient and bacteria levels, as well as sedimentation due to bank erosion from unrestricted cattle access (Conneely, 2004). The negative impacts of livestock grazing riparian areas can be prevented, minimized, or improved by controlling when, where, how long, and with what intensity livestock graze in the riparian area. Off stream watering reduces the time animals spend at the stream under small acreage grazing conditions. When given the choice, cattle drank from an off-stream water trough 92% of the time, compared to the time that they spent drinking from the stream. Stream bank erosion was reduced by 77%, as were concentrations of total suspended solids (90%), total nitrogen (54%), and total phosphorus (81%) when an alternative water source was provided. Similar reductions were observed in concentrations of bacteria (Sheffield et al., 1997).
A grazing cow returns 79% of the nitrogen, 66% of the phosphorus and 82% of the potassium to the pasture. These nutrients do not always get recycled in the needed locations; in continuously grazed pastures, nutrients are often deposited near the shade, the water tank, or the lane areas between shade and water. Streambank stability and riparian zone vegetation can be improved by locating shade and water away from the stream. Riparian vegetation functions such as shade, sediment storage, and hydrologic effects (e.g., water storage and aquifer recharge) often recover quickly (i.e., 5-10 years) with livestock exclusion or substantial reductions in grazing intensity (Myers and Swanson, 1995; Clary and Webster, 1989). Bank stabilization, channel geometry, habitat complexity, and other channel characteristics also recover quickly but may take longer in deeply incised stream channels. Various grazing management systems have been implemented throughout the western United States, but out of 17 riparian grazing systems described by Platts
52
(1991), only light use and complete livestock exclusion provided adequate protection to riparian and fisheries resources. If livestock need to cross streams, provide them with controlled stream crossings. Encouraging animals to drink or cross at managed points will reduce random trampling of stream banks and decrease the risk of animal injury. Wohl and Carline (1996) found that two of three streams responded favorably to streambank fencing, bank stabilization and the installation of rock lined animal crossing. In general, abundance of macroinvertebrates was highest in the ungrazed stream, which also supported the highest abundance of fish. However, in the two grazed streams total dissolved solids decreased by 50% and macroinvertebrate density increased by at least 70%. The majority of the research literature shows that totally excluding livestock from the stream is the most acceptable best management practice. In reality, this practice is seldom followed because of the high cost of fencing streams and riparian areas that are grazed by livestock. Low or moderate grazing in riparian areas has effects that are much less significant than heavy or unmanaged grazing (Trimble and Mendel, 1995). Several grazing strategies have been employed to reduce the effects of grazing on riparian systems. Many researchers agree with Myers and Swanson (1995) who indicated that deferred rotation grazing led to improvement of aquatic and riparian habitats, but that complete rest produced the most improvement. Management intensive grazing includes moving livestock at a high stocking density frequently though a series of paddocks. This reduces the time animals spend in the riparian areas and has been demonstrated to reduce the impact in and along streams in relation to continuous grazing (Cox, 1998). Barriers and buffers can be planted to intercept and contain contaminants that are being carried from agricultural lands. In most cases, these are strips of vegetation that slow the velocity of runoff water enough for sediment to settle out, water to infiltrate into the ground and nutrients to be taken up by plants. Grassed waterways, vegetative strips and field borders are examples of buffers that can be used in annually cropped fields. Consideration for constructing wetlands within impacted drainages is recommended to assist in remediation of nutrient runoff from agricultural lands in MONO. Harding’s Run at the Baker Farm is one potential site for consideration of a wetlands project. Other Management Strategies
Over time, hiking trails deteriorate by natural process and by wear from recreational traffic. The magnitude of trail deterioration is determined by characteristics of the trail, its environment, and the recreation use the trail receives (Cole, 1987). Sediment yield during precipitation events on trails can enter a waterbody and can degrade water quality through increased turbidity and total dissolved solids. Aquatic habitat can also be negatively impacted from increased sediment yields by covering the natural substrate through increased sediment deposition. MONO should evaluate current trail designs, closing unwanted access and redesigning trails, as needed, to minimize sedimentation into surface waters at MONO (Motivans, 1995).
Individual septic systems are common in the immediate area of MONO. These systems
remove pollutants from wastewater to protect the public health and environment.
53

Pollutants such as bacteria, viruses, nitrate, ammonia, and suspended solids can enter aquatic environments and potable water supplies if not treated properly. As a result, discharge limits are set and used to evaluate systems to make sure they stay in compliance with those standards. MONO should contact the Frederick County Government, Environmental Health Program: Well and Septic Branch (301.600.1726) to determine compliance of existing septic systems that influence MONO’s water resources and to learn of alternative sewage systems that may be more environmentally friendly in sensitive karst areas.
Invasive exotic plant species should be managed to retain desirable cultural and natural
landscape characteristics such as field patterns and the composition of wooded and agricultural areas (National Park Service, 2005). Not much is known about how to reduce the Asian clam (Corbicula fluminea) population, which is present in MONO (Motivans, 1995). Another inventory of the Asian clam population in the national battlefield is encouraged to evaluate the trends of this exotic species.
Runoff from impervious surfaces such as parking lots can concentrate polluted runoff
(oils, metals, chlorides, etc.) into the local aquatic environments. MONO should consider stormwater treatment for parking lot runoff using bioretention areas, filter strips, and other proven practices that can be integrated into the landscaped areas (Frederick County, 2007; National Park Service, 2005).
Water Resource Goal: Hydrologic integrity of park waters (surface and ground waters) is improved and/or maintained to support natural geomorphic processes of fluvial and aquifer systems and to support native life. Inventory and Monitoring Stream Channel Morphology: It is important for MONO to classify its streams on the basis of channel morphology (physical parameters), providing an understanding of “stream health” and answering the questions, “Is the stream morphology (physical characteristics) impaired?...and if so, why?” A combination of morphological variables important for different scales of analysis from coarse to very fine resolutions are used to create the hierarchy for defining stream morphology. Rosgen (1996) uses a hierarchy of four assessment levels that vary from a broad geomorphic characterization down to a very detailed-specific description and assessment. These four assessment levels for stream classification are outlined in Table 16.
54

Table 16. Rosgen (1996) assessment levels for stream classification. Level 1: describe the geomorphic characteristics that result from the integration of basin relief, landform and valley morphology. The dimension, pattern, form, and profile of rivers are used to delineate geomorphic types at a coarse-scale. Level 2: The channel entrenchment, dimensions, patterns, profile, and boundary materials are quantified and described by discreet categories of stream types. Level 3: Describes the existing condition of the stream as it relates to its stability, response potential, and function. At this level, additional field parameters are evaluated that influence the stream state (e.g., riparian vegetation, sediment supply, flow regime, debris occurrence, depositional features, channel stability, bank erodibility, and direct channel disturbances). Level 3 analyses are useful as a basis for integrating companion studies such as fish habitat indices and riparian surveys. Level 4: Verifies stream process relationships inferred from the preceding assessments. The objective is to establish empirical relationships for use in prediction. The developed empirical relationships are specific to individual stream types for a given state, and enable extrapolation to other similar reaches for which the Level 4 data is not available. The Rosgen (1996) stream classification method is based on extensive field observations and quantitative studies of hundreds of stream systems and has formed a basis for many restoration designs for impaired stream systems across the nation. It should be noted that although this approach is accepted and used by many field professionals (e.g., U.S. Forest Service), there are some who believe the over-simplified approach is inappropriate for such a complex field of science. Floodplain Management: Floodplains exist in the national battlefield where there are perennial and intermittent streams. Some of MONO’s historic structures are located within these floodplains and can be at risk to damage from flooding. For example, the Grambill Mill is within the 100-year floodplain of the Monocacy River and Bush Creek (National Park Service, 2007). In managing floodplains, the NPS will (1) manage for the preservation of floodplain values; (2) minimize potentially hazardous conditions associated with flooding; and (3) comply with the NPS Organic Act and all other federal laws and executive orders (i.e., Executive Order 11988: Floodplain Management, 2006 Park Management Policies) related to the management of activities in flood-prone areas (National Park Service, 2006). When it is not practicable to locate or relocate development to a site outside the floodplain, the NPS is instructed to prepare and approve a statement of findings in accordance with procedures described in Director’s Order 77-2 (Floodplain Management). Requirements for development in floodplains are contained in Executive Order 11988 (National Park Service, 2006). Sediment: Sedimentation derived from nonpoint sources is the major contributor to the Monocacy River’s water quality problems (Monocacy Scenic River Local Advisory Board, 1990). Sediment “pollution” is the number one impairment of streams nationwide (Southerland et al., 2005b).
55
In Rosgen’s Level 3 stream assessment (Table 5), sediment is evaluated. Sediment analyses can be divided into measurements of bedload and suspended sediment, changes in sediment storage, size distributions, and source areas (Rosgen, 1996). Monitoring should emphasize both suspended and bedload sediment. Suspended sediment is often used to determine sediment sources (supply). Bedload, while influenced by supply, is more often associated with an energy limitation (stream discharge) rather than a supply limitation. Bedload is also more critical for stability assessments since the coarse sediment is more sensitive to an energy requirement for transport. Maryland considers a subset of the MBSS Physical Habitat parameters (riffle/run quality, bank stability, riparian buffer width, instream habitat, epifaunal substrate) to be indicators of sediment impacts. These data are being used in conjunction with the Chesapeake Bay Program (Phase 5 Watershed Model) to develop sediment TMDLs. Currently, numeric thresholds for sediment have not been established. Based on the existing sediment TMDLs for other streams, the long-term average annual TMDL allocation for a Maryland 8-digit watershed is given in tons/year. To determine a water quality threshold for a given stream, one would have to know the long-term average annual discharge of the entire watershed, and divide the TMDL allocation by this discharge to define a stream-specific total suspended solids (TSS) threshold in parts per million (ppm) or mg/L. Alternatively for sampling under baseflow conditions only, a long-term daily limit TMDL allocation, which is only applicable during baseflow conditions, is given in pounds per day (lbs/day). To determine a quality threshold for a given stream, one would have to know the discharge of the entire watershed on an average day under baseflow conditions and divide the TMDL allocation by discharge to define a stream-specific TSS threshold. Best management practices that reduce sediment inputs into aquatic environments include riparian buffers, restrictive cattle access to streams, and proper hiking trail designs. For example, hiking trails should minimize impacts on steep slopes, highly erodible soils, hydric soils, wetlands, and floodplains (National Park Service, 2005). Aquifer Characterization: Elevation of the local ground water table(s) (potentiometric surface) in the immediate area of MONO should be established to document ground water flow directions, seasonal fluctuations and overall trends in ground water levels. With increasing development pressures in the region and recent droughts, it is important for MONO to collect baseline data on the aquifer(s) that recharge the national battlefield’s springs and streams and supply the operational needs (potable water supply) at MONO. The direction and velocity of ground water flow will assist in the identification of threatened areas and point source pollution. MONO should use the existing ground water wells in the national battlefield and add to that network of wells (installation of piezometers), if necessary. It will be important to know the “screened’ intervals of the wells in order to correlate the measurement to the appropriate aquifer (shallow versus deep aquifer). From the water level data, ground water flow directions can be
56

determined for the respective aquifers. Aquifer tests (slug tests) can define local hydraulic conductivity and flow velocities. Wetlands Inventory: Wetlands within the national battlefield boundary should be delineated, building from the National Wetland Inventory (NWI) maps prepared by the U.S. Fish and Wildlife Service. Wetlands maybe missed from on the NWI maps since the aerial surveys do not typically capture small wetlands (< 0.5 acre), common around springs and seeps. Qualified staff or certified wetlands specialists should use the Cowardin system used by the NPS to delineate wetlands, and conform with NPS Management Policies concerning wetlands and wetlands protection actions and in NPS DO 77-1. The spatial extent of wetlands and wetland types should be captured on MONO’s existing geographic information system (GIS) database and updated as new information is made available. Water Rights Water rights, whether federal or state law-based, are needed by MONO to meet the water needs of park operations and to protect natural, water-dependent resources. The NPS should consider authorities under Maryland and federal law on a case-by-case basis, pursuing those that are most appropriate to accomplish the purposes and protect water-related resources at MONO. While preserving its legal remedies, the NPS should work with state water administrators to protect park resources and, if conflicts amongst multiple water users arise, seek resolution through good faith negotiations.
57

58
Literature Cited Allan, J. and A. Flecker. 1993. Biodiversity Conservation in Running Waters. BioScience 43:32-
43. Barker, L., G. Felton, and E. Russek-Cohen. 2006. Use of Maryland biological stream survey
data to determine effects of agricultural riparian buffers on measures of biological stream health. Environmental Monitoring and Assessment 117:1-19.
Belval, D.L. and L.A. Sprague. 1999. Monitoring Nutrients in the Major Rivers Draining to
Chesapeake Bay. Water-Resources Investigations Report 99-4238. Richmond, VA. 14 pp. Bernhardt, E. and many others. 2005. Can’t see the forest for the stream? In-stream processing
and terrestrial nitrogen exports. BioScience 55:219-230. Chesapeake Bay Program. 2006a. http://www.chesapeakebay.net/nutr2.htm Chesapeake Bay Program. 2006b. http://chesapeakebay.net/ripar1.htm Clary, W. and B. Webster. 1989. Managing grazing of riparian areas in the Intermountain
Region. Gen. Tech. Rept. INT-23. U.S. Forest Service, Intermountain Research Station, Ogden, Utah.
Clearwater, D., P. Turgeon, C. Nobel, and J. LaBranche. 2000. An Overview of Wetlands and
Water Resources of Maryland. Maryland Wetland Conservation Plan Work Group. 62 pp. Cole, D.N. 1987. Research on soil and vegetation in wilderness: A state-of-knowledge review. In
R.C. Lucas (comp.), Proceedings, national wilderness research conference: Issues, state-of-knowledge, future directions. General Technical Report INT-220. USDA Forest Service. Ogden, UT. pp. 135-177.
Conneely, B. 2004. Water Quality Monitoring Plan. Monocacy National Battlefield. NPS,
Frederick, MD. pp. 12 + appendices. Cowardin, L.M., V. Carter, F.C. Golet, and E.T. LaRoe. 1979. Classification of Wetlands and
Deepwater Habitats of the United States. U.S. Fish and Wildlife Service, FWS/OBS-79/31. Cox, C. 1998. Fish and invertebrate communities in the Whitewater River watershed: a GIS-
based examination of land use effects. M.S. thesis, Univ. Minnesota, St. Paul. Dillaha, T., J. Sherrard, D. Lee, S. Mostaghimi, and V. Shanholtz. 1988. Evaluation of vegetative
filter strips as a best management practice for feed lots. J. Water Poll. Control Fed. 60:1231-1238.
Dillaha, T., R. Reneau, S. Mostaghimi, and D. Lee. 1989. Vegetative filter strips for agricultural
nonpoint source pollution control. Trans. Am. Soc. Agricultural Eng. 32:513-519.
59
Duigon, M.T. 1997. A brief discussion of the Project, “Karst Hydrogeology in the Hagerstown Valley, Maryland and its Influence on Ground-Water-Quality Protection”. Maryland Geologic Survey. Baltimore, MD. 2 pp.
Faucett, R., B. Christensen, and D. Tjernea. 1994. The impact of conservation tillage on pesticide
runoff into surface water: A review and analysis. J. Soil Water Cons. 2:126-135. Frederick County. 2004. Lower Monocacy River, Watershed Restoration Action Strategy.
Frederick County, Division of Public Works. Frederick, MD. 91 pp. Frederick County. 2007. Demographics of Frederick County Population. Office of Economic
Development, Frederick County, Maryland. http://www.discoverfrederickmd.com/fastfacts/people/demographics.cfm
Frederick County. 2007a. Recommended Model Development Principles for Frederick County,
Maryland. Center for Watershed Protection. Ellicott City, MD. 20 pp. Frederick County Department of Planning and Zoning. 2004. Urbana Region Plan. Frederick,
Maryland. 80 pp. Hall, L., R. Morgan, E. Perry, and A. Waltz. 1999. Development of a provisional habitat index
for Maryland freshwater streams. Prepared by University of Maryland, Wye Research and Education Center and Appalachian Laboratory for Maryland Department of Natural Resources, Monitoring and Non-Tidal Assessment Division. CBWP-MANTA-EA-99-12.
Hilderbrand, R., R. Raesly and P. Kazyak. 2005. Baseline water resources inventory to support
aquatic and watershed management activities in National Capital Region parks (Final Report to Douglas Curtis, National Park Service-Center for Urban Ecology, Washington, DC). 41 pp.
Hobba, W.A., Jr., E.A. Friel, and J.L. Chisholm. 1972. Water Resources of the Potomac River
Basin, West Virginia. River Basin Bulletin 3. U.S. Geological Survey, Water Resources Division. 110 pp.
Jackson and others. 1989. Comparison of fecal coliform E. coli: Impact for utilities under the
new total coliform rule. August 18, 2004. http://www.idex.com/water/products/refs/096328900L.pdf.
Karr, J.R. 1981. Assessment of biotic integrity using fish communities. Fisheries 6:21-27. Karr, J. K. Fausch, P. Angermeir, P.Yant and I. Schlosser. 1986. Assessment of biological
integrity in running water: a method and its rationale. Illinois Natural History Survey Special Publication No. 5, Champaign, IL.
Karr, J. 1992. Measuring biological integrity: lessons from streams. Pages 83-104 in S. Woodley,
J. Kay, and G. Francis, eds., Ecological integrity and the management of ecosystems. St. Lucie Press, Delray Beach, FL.
60
Kazyak, P.G. 2001. Maryland Biological Stream Survey sampling manual. Maryland Department of Natural Resources, Monitoring and Non-tidal Assessment Division. Annapolis, MD.
Kazyak, P.F., A. Brindley, and M.T. Southerland. 2005. Maryland Biological Survey 2000-2004.
Vol. VIII: County Results. CBWP-MANTA-EA-05-5. pp. 8-161 – 8-175. Lee, K.-H., T. Isenhart, and R. Schultz. 2003. Sediment and nutrient removal in an established
multi-species riparian buffer. J. Soil Water Conservation 58:1-7. Lowarance, R., L.S. Altier, J.D. Newbold, R.R. Schnabel, P.M. Groffman, J.M. Denver, D.L.
Correll, J.W. Gilliam, J.L. Robinson, R.B. Brinsfield, K.W. Staver, W. Lucas, and A.H. Todd. 1995. Water Quality Functions of Riparian Forest Buffer Systems in Chesapeake Bay Watershed. Nutrient Subcommittee of the Chesapeake Bay Program. EPA 903-R-95-004. 67 pp.
Maryland Department of the Environment. 1990. Groundwater sample results (September, 19,
1990. Leaking Underground Storage Tank Projects Division. Baltimore, MD. 3 pp. Maryland Department of the Environment. 1991. Groundwater sample results (October 2, 1991).
Leaking Underground Storage Tank Division. Baltimore, MD. 2 pp. Maryland Department of the Environment. 2006a. 2006 List of Impaired Surface Waters [303(d)
List] and integrated Assessment of Water Quality in Maryland (Revised Final). http://www.mde.state.md.us/Programs/WaterPrograms/TMDL/Maryland%20303%20dlist/2006_303d_list_final.asp Baltimore, MD. 71 pp.
Maryland Department of the Environment. 2007. Water Quality Standards.
http://www.mde.state.md.us/ResearchCenter/Data/waterQualityStandards/index.asp Baltimore, MD.
Maryland Department of Natural Resources. 1998. Maryland Clean Water Action Plan, Final
Report on Unified Watershed Assessment, Watershed Prioritization and Plans for Restoration Strategies. Maryland Clean Water Action Plan Technical Workgroup.
Maryland Department of Natural Resources. 2003a. Lower Monocacy River Watershed
Characterization. Annapolis, MD. 55 pp. Meyer, P., S. Reynolds, M. McCutchen, and T. Canfield. 2006. Riparian buffer width, vegetative
cover, and nitrogen removal effectiveness: A review of current science and regulations. EPA/600/R-05/118. U.S. Environmental Protection Agency, Cincinnati, OH.
Meyers, T. and S. Swanson. 1995. Impact of deferred rotation grazing on stream characteristics
in central Nevada: a case study. North Am. J. Fisheries Management 15:428-439.
61

Motivans, K. 1995. Vegetation and Aquatic Survey of the Bush Creek Tract with Emphasis on Rare, Threatened, and Endangered Species of Plants and Freshwater Mussels. Monocacy National Battlefield. Maryland Natural Heritage Program, Maryland Dept. of Natural Resources. Annapolis, MD. 30 pp.
Monocacy Scenic River Local Advisory Board. 1990. The Monocacy River Scenic River Study
and Management Plan. 88 pp. Naiman, R., H. Decamps, and M. Pollock. 1993. The role of riparian corridors in maintaining
regional biodiversity. Ecol. Appl. 3:209-212. Naiman, R. and H. Decamps. 1997. The ecology of interfaces: riparian zones. Ann. Rev. Ecol.
Syst. 28:621-658. National Park Service. 2000. Baseline Water Quality Data, Inventory and Analysis, Monocacy
National Battlefield. National Park Service, Tech. Rpt. NPS/NRWRD/NRTR-99/253. NPS Water Resources Division, Fort Collins, CO. 375 pp. + appendices.
National Park Service. 2002. Aiding Management by Assessing Condition and Identifying
Stressors of Aquatic Resources in National Capital Region Parks. Oct. 1, 2002 – March 1, 2003. pp. 13.
National Park Service. 2004. Vital Signs Monitoring Plan, Phase III (draft). San Francisco Bay
Area Network. 141 pp. National Park Service. 2005. Long-term Monitoring Plan for Natural Resources in the National
Capital Region Network. Inventory and Monitoring Program, Center for Urban Ecology. Washington, D.C.
National Park Service. 2006. Management Policies. U.S. Dept. of the Interior. Washington, D.C.
168 pp. National Park Service. 2007. (draft) General Management Plan / Environmental Impact
Statement. Monocacy National Battlefield, Maryland. 197 pp. Natural Research Council. 2002. Riparian areas: functions and strategies for management.
National Academy Press, Washington, DC. National Resources Conservation Service. 2003. National handbook of conservation practices.
U.S. Department of Agriculture, Washington, DC. Nutter, J.L., and Otton, E.G. 1969. Ground-water occurrence in the Maryland Piedmont:
Maryland Geological Survey, Report of Investigations, No. 10. Baltimore, MD. 56 pp. Ohio Environmental Protection Agency. 1988. Biological criteria for the protection of aquatic
life, volumes 1-3. Ecological Assessment Section, Division of Water Quality Monitoring and Assessment, Ohio EPA, Columbus, OH.
62

Paul, M., J. Stribling, R. Klauda, P. Kazyak, M. Southerland, and N. Roth. 2002. A physical habitat index for freshwater wadeable streams in Maryland. CBWP-MANTA-EA-03-04, Natural Resources, Monitoring and Non-tidal Assessment Division, Annapolis, Maryland.
Platts, W. 1991. Influences of forest and rangeland management on salmonid fishes and their
habitats. pp. 389-423 in American Fisheries Society Special Publication no. 19, Bethesda, Maryland.
Rankin, E.T. 1989. The qualitative habitat evaluation index (QHEI): rationale, methods, and
application. Ohio EPA, Division of Water Quality Planning and Assessment, Ecological Analysis Section. Columbus, OH.
Rankin, E. 1995. Habitat indices in water resource quality assessments. In: Davis, W. and T.
Simon. Biological assessment and criteria: tools for water resource planning and decision making. Lewis Publishers, Boca Raton, FL.
Raesly, R.L. 2004. Inventory and Biological Monitoring of Fishes in National Park of the
National Capital Region (Final Report). Frostburg State University, Dept. of Biology. Richardson, W. and many others. 2004. Denitrification in the Upper Mississippi River: rates,
controls, and contribution to nitrate flux. Canadian J. Fish. Aquatic Sci. 61:1102-1112. Rosgen, D. 1996. Applied River Morphology. Wildland Hydrology. Pagosa Springs, CO. Roth, N., J. Allan, and D. Erickson. 1996. Landscape influences on stream biotic integrity
assessed at multiple spatial scales. Landscape Ecology 11:141-156. Roth, N.E., M.T. Southerland, J.C. Chaillou, R.J. Klauda, P.F. Kazyak, S.A. Stranko, S.B.
Weisberg, L.W. Hall, Jr., and R.P. Morgan II. 1998. Maryland Biological Stream Survey: Development of a fish index of biotic integrity. Environmental Management and Assessment 51:89-106.
Roth, N. and many others. 1998. Maryland biological stream survey: development of a fish index
of biotic integrity. Environmental Monitoring and Assessment 51:89-106. Roth, N.E., M.T. Southerland, G. Mercurio, J.C. Chaillou, P.F. Kazyak, S..S. Stranko, A.P.
Prochaska, D.G. Heimbuch, and J.C. Seibel. 1999. State of the Streams: 1995-1997 Maryland Biological Stream Survey Results. Prepared by Versar, Inc., Columbia, MD and Post, Buckley, Schuh, and Jernigan, Inc., Bowie, MD and Maryland Department of Natural Resources, Monitoring and Non-Tiday Assessment Division. CBWP-MANTA-EA-99-6. Annapolis, MD.
Roth, N.E., M.T. Southerland, G. Mercurio, and J.H. Volstad. 2001 Maryland Biological Stream
Survey 2000-2004 Volume 1: ecological assessment of watersheds sampled in 2000. Report submitted to Maryland Dept. of Natural Resources (CBWP-MANTA-EA-01-5).
63

Runde, J. 2003. Preliminary Report on Monocacy National Battlefield visitor center’s pond testing. National Park Service, Natural Resources and Science, Center for Urban Ecology. Washington D.C. 4 pp.
Schultz, R. and many others. 1995. Design and placement of a multi-species riparian buffer strip.
Agroforestry Sys. 29:201-225. Seiger, B. 2007. Personal communication (410.537.3821). Maryland Department of the
Environment. Baltimore, MD. Sheffield, R., S. Mostaghimi, D. Vaughan, E. Collins, and V. Allen. 1997. Off-stream water
sources for grazing cattle as a stream bank stabilization and water quality BMP. Trans. ASAE 40:595-604.
Southeast Regional Climate Center. 2007. Climate data summary (1948-2002), Frederick Police
Brks, Maryland (183348). http://cirrus.dnr.state.sc.us/cgi-bin/sercc/cliMONtavt.pl?md3348. Southerland, M., and many others. 2005a. New biological indicators to better asses the condition
of Maryland streams. CBWP-MANTA-EA-05-13, Volume 16, Maryland Biological Stream Survey, Maryland Department of Natural Resources, Monitoring and Non-tidal Assessment Division, Annapolis, Maryland.
Southerland, M., L. Erb, G. Rogers, R. Morgan, K. Eshleman, M. Kline, K. Kline, S. Stranko, P.
Kazyak, J. Killian, J. Ladell, and J. Thompson. 2005b. Maryland Biological Stream Survey 2000-2004. Vol. XIV: Stressors Affecting Maryland Streams. CBWP-MANTA-EA-05-11.
Southwood, S. and D. Denenny. 2006. Geologic map of the National Parks in the Capital
Region, Washington, D.C., Virginia, Maryland, and West Virginia: U.S. Geological Survey Open-File Report 2005-1331. 26 pp.
Stribling, J.B., B.K. Jessup, J.S. White, D. Boward, and M. Hurd. 1998. Development of a
benthic index of biotic integrity for Maryland streams. Tetra Tech, Inc., and Maryland Dept. of Natural Resources, Monitoring and Non-Tidal Assessment Program. CBWP-MANTA-EA-98-3.
Tear, T. 2005. How much is enough? The recurrent problem of setting measurable objectives in
conservation. Bioscience. 55: 835-849. Trimble, S. and A. Mendel. 1995. The cow as a geomorphic agent – a critical review.
Geomorphology 13:233-253. U.S. Department of the Interior. 2001. Total coliform and E. Coli fact sheet. August17, 2004.
http://www.usbr.gov/pmts/water/media/pdfs/TC&Ecoli.pdf. U.S. Environmental Protection Agency. 1996. Summary of state biological assessment programs
for streams and rivers. EPA 230-R-96-007. Office of Policy, Planning and Evaluation, Washington, DC.
64

U.S. Environmental Protection Agency. 2000. The quality of our nation’s waters. U.S. Environmental Protection Agency, Office of Water, EPA 851/S/00/001, Washington, DC.
U.S. Environmental Protection Agency. 2003. Atmospheric Deposition and Water Quality
(August 2004). http://www.epa.gov/owow/oceans/airdep/air1.html. U.S. Environmental Protection Agency. 2006. Total Maximum Daily Loads.
http://iaspub.epa.gov/tmdl/enviro.control?p_list_id=MD-02140302-R U.S. Environmental Protection Agency. 2007. Drinking water contaminants.
http://www.epa.gov/safewater/contaminants/index.html ) U.S. Department of Transportation and Maryland Department of Transportation. 2002. Multi-
Modal Corridor Study. Frederick and Montgomery Counties, Maryland. Draft Environmental Impact Statement and Section 4(f) Evaluation. http://www.i-270corridorp3.com/images/draft_deis/2002DEIS-I-270-US15Multi%20ModalCorridorStudy-summary.pdf
U.S. Geological Survey. 2006. National Hydrography Dataset, Geodatabase.
http://nhdgeo.usgs.gov/viewer.htm U.S. Geological Survey. 2007. National Water Information System.
http://waterdata.usgs.gov/nwis/dv?cb_00060=on&format=gif_default&begin_date=2003-10-01&end_date=2007-03-22&site_no=01642190&referred_module=sw
Vokes, H.E. and J. Edwards, Jr. 1974. Geography and geology of Maryland: Maryland
Geological Survey, Bulletin, 19. Baltimore, MD. 242 pp. Wohl, N. and R. Carline. 1996. Relations among riparian grazing, sediment loads,
macroinvertebrates, and fishes in three central Pennsylvania streams. Can. J. Fisheries Aquatic Sci. 53(supple 1):260-266.
Wolman, M.G. and others. 2006. 2005 Advisory Committee on the Management and Protection
of the State’s Water Resources, Interim Report, July 2006. 39 pp. + appendices. Wood, P.J. and P.D. Armitage. 1997. Biological effects of fine sediment in the lotic
environment. Environmental Management 21:203-217.
65

66

The Department of the Interior protects and manages the nation’s natural resources and cultural heritage; provides scientific and other information about those resources; and honors its special responsibilities to American Indians, Alaska Natives, and affiliated Island Communities. NPS D-75, August 2007
67

National Park Service U.S. Department of the Interior Natural Resource Program Center Natural Resources Program Center Water Resources Division 1201 Oak Ridge Drive, Suite 250 Fort Collins, Colorado 80525
www.nature.nps.gov/water EXPERIENCE YOUR AMERICA TM