The Moon Phases Earth’s Rotation Earth’s Revolution Earth’s Size and Shape 10 20 30 40 50.
1
INTRODUCTION
'Water is one of the abundantly available substance in the nature which men have
exploiting more than any other resources for the sustenance of life. Water of good
quality is required for living organisms. ―Water is the elixir of life.‖Water is required
for various domestic purposes like irrigation, shipping, sanitation, power generation,
drinking, industries etc. About 73% of earth is covered with marine and fresh water
which is present in rivers, lakes, ponds, glaciers, mountains with ice caps etc. The
fresh water content is only 2.76% of the total amount of global water out of which
only 2.4% fresh water is available. From this fresh water about 0.3% to 0.5% is
available for drinking purpose of the total world water. Human population increases
day by day and it increases consumption of amount of fresh water.
Water resources of Earth
Water is continually moving around, through, and above the Earth as water vapor,
liquid water, and ice. In fact, water is continually changing its form. The Earth is
pretty much a ―closed system,‖ like a terrarium. That means the Earth neither, as a
whole, gains nor loses much matter, including water. Although some matter, such as
meteors from outer space, are captured by Earth, very little of Earth‘s substances
escape into outer space. This is certainly true about water. This means that the same
water that existed on Earth millions of years ago is still here. Because of water cycle
the same water is continually being recycled all around the globe.
The bar chart (Fig. 1.1) show how water is distributed on the Earth. The left-side bar
shows where the water on Earth exists; about 97% of all water is in the oceans. The
middle bar shows distribution of that 3% of all Earth‘s water that is fresh water. The
majority, about 69%, is locked up in glaciers and icecaps, mainly in Greenland and
Antarctica. The remaining freshwater, almost all of it is below our feet, as ground
water. Of all the freshwater on Earth, only about 0.3% is contained in rivers and lakes-
yet rivers and lakes are not only the water resources we are most familiar with, it is
also where most of the water we use in our everyday lives exists (Gleick, 1996)

2
Fig-1.1 Distribution of Earth’s surface
The pie chart (Fig 1.2) below shows that how much of Earth‘s water is available for
our uses and in what forms does it exist.
Fig-1.2
3
The top pie charts shows that over 99% of all water (oceans, seas, ice, most saline
water and atmospheric water) is not available for our uses. And even of the remaining
fraction of 1%, much of it is out of reach. Considering that most of the water we use in
everyday life comes from rivers (the small dark blue slice in the bottom pie chart), we
generally make use of a tiny portion of the available water supplies. The bottom pie
chart shows that the vast majority of the fresh water available for our uses is stored in
the ground (the large grey slice in the second pie chart).
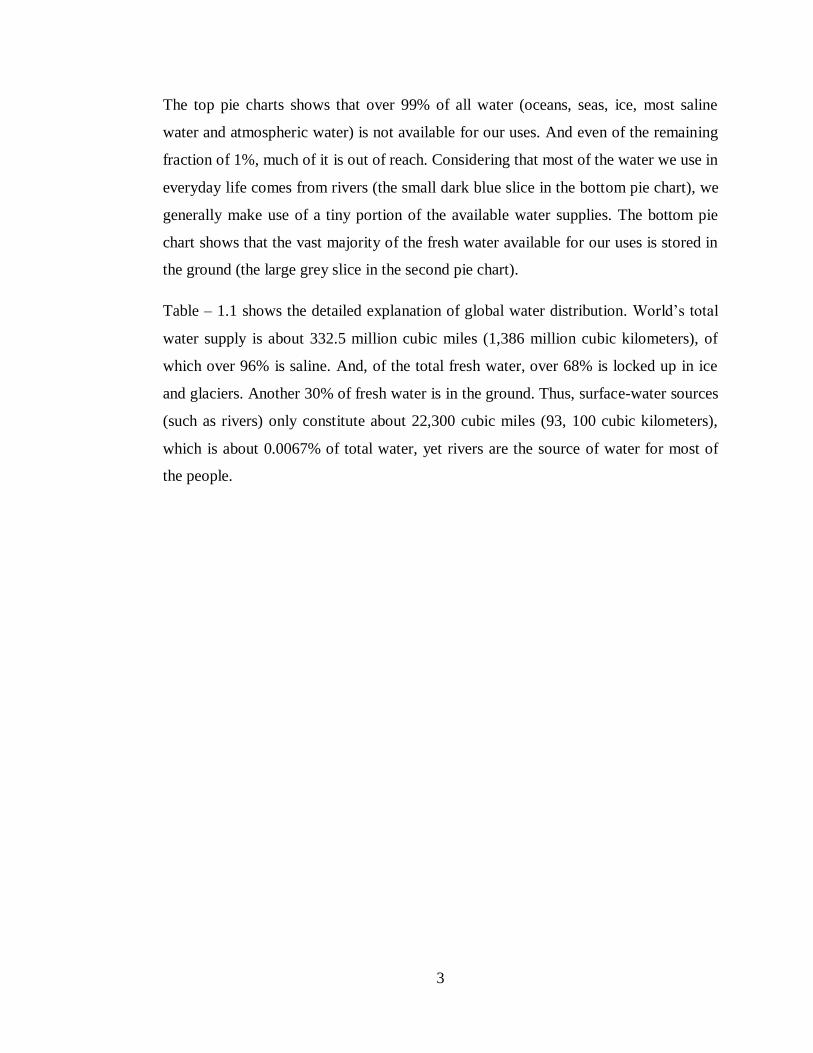
Table – 1.1 shows the detailed explanation of global water distribution. World‘s total
water supply is about 332.5 million cubic miles (1,386 million cubic kilometers), of
which over 96% is saline. And, of the total fresh water, over 68% is locked up in ice
and glaciers. Another 30% of fresh water is in the ground. Thus, surface-water sources
(such as rivers) only constitute about 22,300 cubic miles (93, 100 cubic kilometers),
which is about 0.0067% of total water, yet rivers are the source of water for most of
the people.

4
Table-1.1
One estimate of global water distribution
Water Water volume Water volume in % of % of
Source in cubic miles cubic kilometers fresh total
water water
Oceans seas 321,000,000 1,338,000,000 -- 96.5
and Bays
Ice caps 5,773,000 24,064,000 68.7 1.74
Glaciers and
Permanent
Snow
Ground water 5,614,000 23,400,000 -- 1.7
Fresh 2,526,000 10,530,000 30.1 0.76
Saline 3,088,000 12,870,000 -- 0.94
Soil Moisture 3,959 16,500 0.05 0.001
Ground Ice and 71,970 300,000 0.86 0.022
Permafrost
Lakes 42,320 176,400 -- 0.013
Fresh 21,830 91,000 0.26 0.007
Saline 20,490 85,400 -- 0.006
Atmosphere 3,095 12,900 0.04 0.001
Swamp Water 2,752 11,470 0.03 0.0008
Rivers 509 2,120 0.006 0.0002
Biological 269 1,120 0.003 0.0001
Water
Total 332,500,000 1,386,000,000 -- 100
Source: Gleik, 1997.

5
Types of water (Greenwood, 1997)
Water can appear in three states; it is one of the very few substances to be found
naturally in all three states on earth. Water takes many different forms on Earth: water
vapor and clouds in the sky; seawater and rarely icebergs in the ocean; in facts ,
humans and other animals have developed senses which are, to a degree, able to
evaluate the portability of water, avoiding water that is too salty or putrid. Humans
also tend to prefer cold water to lukewarm; cold water is likely to contain fewer
microbes. The test advertised in spring water or mineral water derives from the
minerals dissolved in it, as pure H2O is tasteless. As such, purity in spring and mineral
water refers to purity from toxins, pollutants, and microbes.
Different names are given to water’s various forms:
According to state
o Solid-ice
o Liquid-water
o Gaseous-water vapour
According to meteorology:
o Hydrometer
o Precipitation
According to occurrence
o Ground water
o Melt water
o Meteoric water
o Connate water
o Fresh water
o Surface water
o Mineral water- containing much mineral
o Brackish water
o Dead water- strange phenomenon which can occur when a
layer of fresh or brackish water rests on the top of denser salt
6
water, without the two layers mixing. It is dangerous for ship
travelling.
o Sea water
o Brine
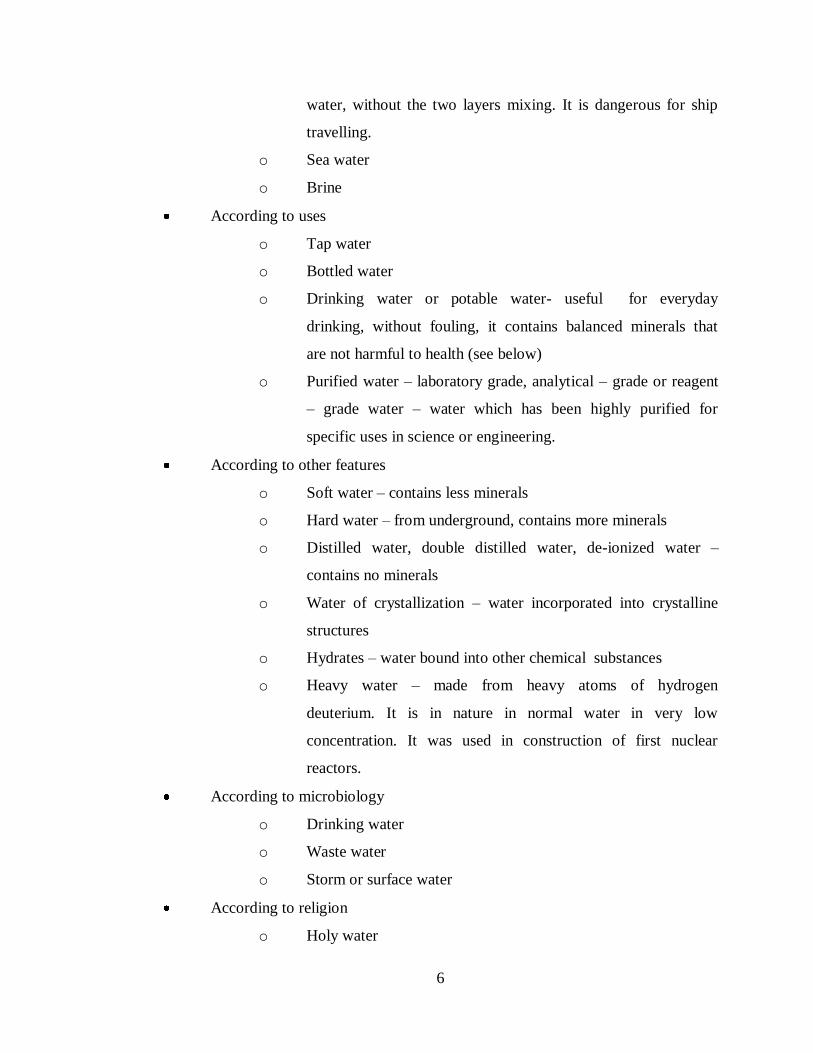
According to uses
o Tap water
o Bottled water
o Drinking water or potable water- useful for everyday
drinking, without fouling, it contains balanced minerals that
are not harmful to health (see below)
o Purified water – laboratory grade, analytical – grade or reagent
– grade water – water which has been highly purified for
specific uses in science or engineering.
According to other features
o Soft water – contains less minerals
o Hard water – from underground, contains more minerals
o Distilled water, double distilled water, de-ionized water –
contains no minerals
o Water of crystallization – water incorporated into crystalline
structures
o Hydrates – water bound into other chemical substances
o Heavy water – made from heavy atoms of hydrogen
deuterium. It is in nature in normal water in very low
concentration. It was used in construction of first nuclear
reactors.
According to microbiology
o Drinking water
o Waste water
o Storm or surface water
According to religion
o Holy water

7
Chemical and physical properties of water:
Fig.-1.3, Water (molecule)
Model of hydrogen bonds between molecules of water
Water is the chemical substance with chemical formula H2O: one molecule of water
has two hydrogen atoms covalently bonded to a single oxygen atom. Some properties
are listed inTable-1.2(Wells, 1984)

8
Table-1.2
Information and properties
Common name Water
IUPAC name oxidane
Alternative names aqua, dihydrogen monoxide,
Hydrogen hydroxide, (more)
Molecular formula H2O
CAS number 7732-18-5
InChl InChl= 1/H2O/h1H2
Molar mass 18.0153 g/mol
Density and phase 0.998 g/cm3 (liquid at 20
°C, 1 atm)
0.917 g/cm3 (solid at 0
°C, 1 atm)
Melting point 0OC (273.15 K) (32
° F)
Boiling point 99.974 °C (373.124 K) (211.95
° F)
Specific – heat 4.184 J/ (g. K) (liquid at 20°C)
Capacity 74.539 J/ (mol. K) (liquid at 25 °C)
The major chemical and physical properties of water are:
• Water is a tasteless, odourless liquid at standard temperature and pressure. The
color of water and ice is, intrinsically, a very light blue hue although water appears
colourless in small quantities. Ice also appears colourless, and water vapor is
essentially invisible as a gas (Braun, 1993).
• Water is transparent, and thus aquatic plants can live within the water because
sunlight can reach them. Only strong UV light is slightly absorbed.
• Since oxygen has a higher electro-negativity than hydrogen, water is a polar
molecule. The oxygen has a slight negative charge while the hydrogen has a slight
positive charge giving the article a strong effective dipole moment. The interactions
between the different dipoles of each molecule cause a net attraction force associated
with water‘s high amount (Debenedetti, 2003).
• Another very important force that causes the water molecules to stick to one
another is the hydrogen bond.

9
• The boiling point of water (and all other liquids) is directly related to the
barometric pressure. For example, on the top of Mt. Everest water boils at about 68°C
(154° F), compared to 100
°C (212
° F) at sea level. Conversely, water deep in the ocean
near geothermal vents can reach temperatures of hundreds of degrees and remain
liquid.
• Water has a high surface tension caused by the weak interactions, (Van Der
Waals Force) between water molecules because it is polarized. The apparent elasticity
caused by surface tension drives the capillary waves.
• Water also has high adhesion properties because of its polar nature.
• Capillary action refers to the tendency of water to move up a narrow tube
against the force of gravity. This property is relied upon by all vascular plants, such as
trees.
• Water is a very strong solvent, referred to as the universal solvent, dissolving
many types of substances. Substances that will mix well and dissolve in water, e.g.
salts, sugars, acids, alkalis and some gases: especially oxygen, carbon dioxide
(carbonation), are known as ―hydrophilic‖ (water-loving) substances, while those that
do not mix well with water (e.g. fats and oils), are known as ―hydrophobic‖ (water-
fearing) substances.
• All the major components in cells (proteins, DNA and polysaccharides) are
also dissolved in water.
• Pure water has a low electrical conductivity, but this increases significantly
upon salvation of a small amount of ionic material such as sodium chloride.
• Water has the second highest specific heat capacity of any known chemical
compound, after ammonia, as well as a high heat of vaporization (40.65 kJ mol¯ĺ
), both
of which are a result of the extensive hydrogen bonding between its molecules .These
two unusual properties allow water to moderate Earth‘s Climate by buffering large
fluctuations in temperature.
• The maximum density of water is at 3.98 0C (39.16 0F). Water becomes even
less dense upon freezing, expanding 9%. This causes an unusual phenomenon: ice
floats upon water and so water organisms can live inside a partly frozen pond because
the water on the bottom has a temperature of around 40C (39
0F) (Fine, 1973).
10
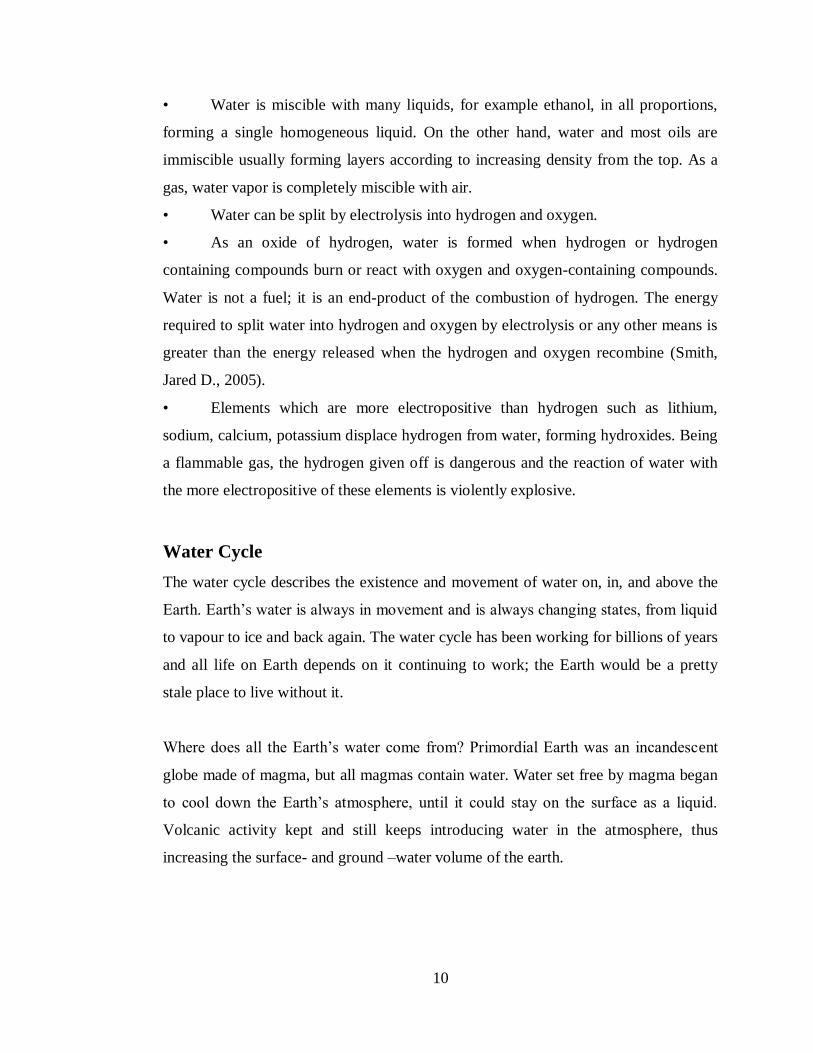
• Water is miscible with many liquids, for example ethanol, in all proportions,
forming a single homogeneous liquid. On the other hand, water and most oils are
immiscible usually forming layers according to increasing density from the top. As a
gas, water vapor is completely miscible with air.
• Water can be split by electrolysis into hydrogen and oxygen.
• As an oxide of hydrogen, water is formed when hydrogen or hydrogen
containing compounds burn or react with oxygen and oxygen-containing compounds.
Water is not a fuel; it is an end-product of the combustion of hydrogen. The energy
required to split water into hydrogen and oxygen by electrolysis or any other means is
greater than the energy released when the hydrogen and oxygen recombine (Smith,
Jared D., 2005).
• Elements which are more electropositive than hydrogen such as lithium,
sodium, calcium, potassium displace hydrogen from water, forming hydroxides. Being
a flammable gas, the hydrogen given off is dangerous and the reaction of water with
the more electropositive of these elements is violently explosive.
Water Cycle
The water cycle describes the existence and movement of water on, in, and above the
Earth. Earth‘s water is always in movement and is always changing states, from liquid
to vapour to ice and back again. The water cycle has been working for billions of years
and all life on Earth depends on it continuing to work; the Earth would be a pretty
stale place to live without it.
Where does all the Earth‘s water come from? Primordial Earth was an incandescent
globe made of magma, but all magmas contain water. Water set free by magma began
to cool down the Earth‘s atmosphere, until it could stay on the surface as a liquid.
Volcanic activity kept and still keeps introducing water in the atmosphere, thus
increasing the surface- and ground –water volume of the earth.
11
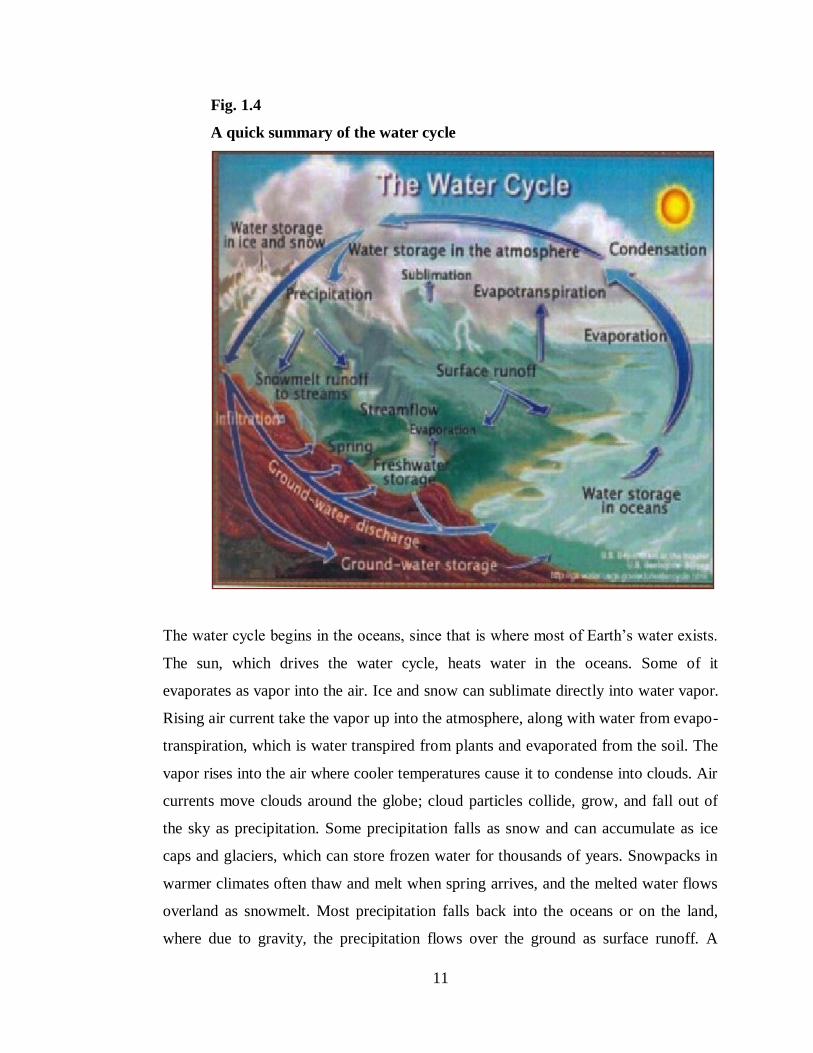
Fig. 1.4
A quick summary of the water cycle
The water cycle begins in the oceans, since that is where most of Earth‘s water exists.
The sun, which drives the water cycle, heats water in the oceans. Some of it
evaporates as vapor into the air. Ice and snow can sublimate directly into water vapor.
Rising air current take the vapor up into the atmosphere, along with water from evapo-
transpiration, which is water transpired from plants and evaporated from the soil. The
vapor rises into the air where cooler temperatures cause it to condense into clouds. Air
currents move clouds around the globe; cloud particles collide, grow, and fall out of
the sky as precipitation. Some precipitation falls as snow and can accumulate as ice
caps and glaciers, which can store frozen water for thousands of years. Snowpacks in
warmer climates often thaw and melt when spring arrives, and the melted water flows
overland as snowmelt. Most precipitation falls back into the oceans or on the land,
where due to gravity, the precipitation flows over the ground as surface runoff. A
12
portion of runoff enters rivers in valleys in the landscape, with stream flow moving
water towards the oceans. Runoff, and ground water see-page, accumulate and are
stored as freshwater in lakes. Not all runoff flows into rivers, though. Much of it soaks
into the ground as infiltration. Some water infiltrates deep into the ground and
replenishes aquifers (saturated subsurface rock), which store huge amounts of fresh
water for long periods of time. Some infiltration stays close to the land surface and can
seep back into surface water-bodies (and the ocean) as ground-water discharge, and
some ground water finds openings in the land surface and emerges as fresh water
springs Over time, though, all of this water keeps moving, some to reenter the ocean,
where the water cycle ―ends‖…oops- I mean, where it ―begins‖ (USGS).
Water quality
The quality of the fresh water is vitally important. We depend on surface and ground
water sources for our drinking water. We also need water to generate energy, to grow
crops, to harvest fish, to run machinery, to carry wastes, to enhance the landscape and
for a great deal more. The principle objective of the country/state should be to supply
clean and potable water to its communities. This not only reduces human suffering,
but also enables economic gains to be made.
We often think of water quality as a matter of taste, clarity and odour, and in terms of
other properties which determine whether water is fit for drinking or not. For other
uses different properties may be important. Most of these properties depend on the
kinds of substances that are dissolved or suspended in the water. Water for most
industrial uses, for instance, must not be corrosive and must not contain dissolved
solids that might precipitate on the surfaces of machinery and equipment.
Pure water is tasteless and odourless. A molecule of water contains only hydrogen and
oxygen atoms. Water is never found in a pure state in nature.
The chemical nature of water continually evolves as it moves through the hydrologic
cycle. Water quality can be measured using chemical and physical measures and/or
13
biological measures. It is necessary to measure ambient water quality, preferably
through time, in order to quantity how water has changed or is changing.
The presence of contaminants and the characteristics of water are used to indicate the
quality of water. These water quality indicators can be categorized as:
Biological: bacteria, algae
Physical: temperature, turbidity and clarity, colour salinity,
suspended solids, dissolved solids
Chemical: pH, dissolved oxygen, biological oxygen demand,
nutrients ( including nitrogen and phosphorus), organic and
inorganic compounds (including toxicants)
Aesthetic: odours, taints, colour, floating matter
Radioactive: alpha, beta and gamma radiation emitters.
Chemical/physical measures involve the scientific measurement of contaminants of
concern, or ‗indicators‘ of contaminants of concern. Contaminants are usually of
concern because they affect aquatic ‗biological health‘ or some other value of a water
body (e.g., visual amenity or human contact-related illness risk). Contaminants and
indicators are often referred to as water quality variables or determinants or
parameters. Most contaminants and indicators are measured as concentrations (an
amount per volume). Exceptions include temperature, clarity, pH, and colour.
Biological measures involve directly measuring aspects of the density and/or
composition of the biological communities that live in rivers, lakes and wetlands, and
using these as indicators of ‗health.‘ This approach is based on the relationship
between chemical/physical water qualities and the health of the biological community,
although care is needed when interpreting results because factors other than water
quality are also important influences (e.g., water flow or level, substrate, riparian
condition, or biological interactions). For this reason, a range of methods is often used
(Snelder, T. H., et al., 2002).

14
Biological measures are particularly useful because the composition of the biological
community reflects the water quality over a period of time, rather than just the single
instant in time represented by a chemical measure.
Since the quality of water affects our lives in many ways. So water must be of good
quality. For most human uses domestic as well as commercial quality of water is as
important as its quantity. It must be substantially free of salinity, plant and animal
wastes and bacterial contamination to be suitable for human consumption.
Water quality may have a great influence on the ability of aquatic plants and animals
to exist and grow in a stream, lake, pond and river. Polluted water can be reason for
the closing of both commercial and sport fishing areas and restricting the recreational
use of water bodies (Rekhow et.al; 1987 and Freeman et.al; 1988).the ability of water
bodies to clean themselves has affected by the sheer quantity of waste generated by
ever increasing population (Ghosh, 1992; Zaheeruddin and Shadab Khusheed, 1998).
With population growth and increased pressure on natural systems many regions are
now subject to water stress about by numerous human activities. Water quality can
have great influence on the ability of aquatic organisms to exist and to grow in a
stream, pond or lake. It is well known that pollution of water causes adverse effect on
plant and animal species. The environmental variability also strongly influences the
population.
Water is essential for life, our spiritual needs, our comfort, our livelihood and our
ecosystem. Everywhere water quality is declining and the water quality stress on
human health and our ecosystem increases. More and more people live in very fragile
environments. The reality of floods and droughts touches increasing numbers and may
live with scarcity.
The availability of good quality water is an indispensable feature for preventing
diseases and improving quality of life (Oluduro and Aderiye, 2007). Natural water
contains some types of impurities whose nature and amount vary with source of water.
Water quality characteristic of aquatic environment arise from a multitude of physical,
chemical and biological interactions (Deuzane, 1979; Dee 1989). The water bodies

15
like river, lakes, dams and estuaries are continuously in dynamic state of change with
respect to the geological age and geochemical characteristics. This is demonstrated by
continuous circulation, transformation and accumulation of energy and matter through
the medium of living - thing and their activities. The dynamic balance in the aquatic
ecosystem is upset by human activities resulting in pollution which is manifested and
unchecked aquatic weeds.
Due to the pressure of increasing population and developing economy all over the
world, the present situation of water quality management is far from satisfactory. To
enhance sustainability of water quality management system, in depth research of the
related barriers and the relevant mitigation approaches is desired. When such studies
are done, they are largely done on a large scale level and are typically taken on by
large government oriented institutions such as the world health organization, the EPA
or the U.N.
Finance and funding is increasingly becoming a barrier to the management of water
sources. Straightly put the more we learn about our water and the more we want to
make it safer which usually costs more money. On a global level a true ―global water
crisis‖ is fast emerging. Although ―global water crisis‘‘ tends to be viewed as a water
quantity problem; water quality is increasingly being acknowledged as a central factor
in the water crisis. The fact that some five million people die every year related to
water borne-diseases. Mostly women and young children were not enough to mobilize
international action about water quality. It is only since United Nations agencies
(WMO, 1997) 1998 meetings of the commission on Sustainable Development, the
General Assembly, and other organizations began looking at the overall contribution
of massively polluted water to the global water crisis that the world has started to take
water quality seriously.
The contribution of water quality to this crisis is mainly through the loss of a wide
variety of beneficial uses including large scale ecological dysfunction and collapse,
loss of economic opportunity and its role in public health and poverty. Water quality is
also intimately linked to the issue of sustainable food production. The water quality
situation in developing countries is highly variable reflecting social, economic and

16
physical factors as well as state of development. And while not all countries are facing
a crisis of water shortage, all have to a greater or lesser extent serious problems
associated with degraded water quality. In some countries these are mainly associated
with rivers, in others it is ground water, and in yet others it is large lakes in many
countries it is all three. Because the range of polluting activities are highly variable
from one country to another and the nature of environmental and socio-economic
impacts are equally variable, there is no ―one-size-fits-all‖ solution.
The key aspects of water quality management are the technical, institutional, legal,
financial and business issues, which should be included in national water policies. We
also examine here the barriers to sustainable capacity development, especially as the
pace of development and scope of water quality problems always grow faster than any
ability to build and sustain in country capacity. Regrettably many countries including
many developed countries entrust data programs to agencies having data-collection as
their primary mandate, with the result that water quality data programs exhibit a high
degree of inertia and for which there are few identified users of the data. The usual
outcome is that these programs become rapidly outdated by failing to shift program
priorities towards modern pollution issues, are not subjected to periodic and critical
technical review are not cost-effective and produce data which are rarely used. Such
programs usually do not produce information that is useful for national planning, for
policy development, for investment targeting or for regulatory purposes. Water quality
monitoring as practiced in most developed countries is based on the premise that with
enough data, a well designed program can answer most type of water quality
management issues.
Water along with land is the most important natural resource gifted to man by nature.
The proper combination of these two primary resources in space and time sets the
upper limit of the population and carrying capacity of the area (Sharma et.al., 1999).
Population also influences the quality and availability of water resources for human
use. Knowing the importance of water for sustenance of life particularly in the areas of
water scarcity like Rajasthan, community management and personification of
indigenous water systems evolved as a part of social life. But the situation has become

17
much different. Lack of community perception, irrational use, widespread negligence
for conservation among various stakeholders, systematic encroachment of water
bodies made them merely a dump yard for domestic and industrial waste.
Most developing countries are ―data poor‖ environments as well as being challenged
by economic restriction. This together with lack of sufficient technical and
institutional capacity and often a poor scientific knowledge base suggests that the
conventional ―western‖ approach to water quality monitoring and management is not
well suited to many if not most developing countries. It is therefore, timely to promote
a new water quality paradigm that is more suitable, affordable, sustainable in
developing countries.
A world Bank Program in Mexico responded to the Mexican government‘s desire to
fundamentally restructure the national water program with the result that water quality
data program and related legal and institutional change was measurably more efficient
and effective and was able to effect a savings of 66% of the amount that the national
agency originally requested to extend its existing programs (Ongley and Barrios,
1997). The solution of this situation is a process now referred to as ―modernization‖ of
water quality programs. This addresses policy institutional, legal and technical
components of water quality programs.
Water Quality and environment-
Millions of people all over the world, particularly in the developing countries are
losing their lives every year from water-borne disease (Dezuane, 1979). The quality of
water is of vital concern for mankind since it is directly linked with human welfare.
Water quality characteristic of aquatic environment arise from a multitude of physical,
chemical and biological interactions (Dezuane, 1979; Dee, 1989). The water bodies
like rivers, lakes, dams and eustuaries are continuously subject to a dynamic state of
change with respect to the geological characteristics. This is demonstrated by
continuous circulation, transformation and accumulation of energy and matter through
the medium of living thing and their activities. The source of any water supply
determines the kinds and amounts of its impurities. Ground water obtained from deep

18
wells usually contains high concentrations of dissolved minerals. This water is usually
clear and colorless due to its filtration through rock and sand. It also may contain
various types of pollution including detergents and industrial wastes. It is now known
that such forms of pollution may travel quite some distance in water. Shallow wells
provide water with varying amounts of mineral impurities. There is also the danger
that water from such sources may become contaminated with human and animal
wastes.
Surface water contains many impurities silt, sand and clay which give them a muddy
or cloudy appearance. Its run-off passes over agricultural land; it may also absorb
chemical wastes and toxic waste from different industries.
Where water flows sluggishly through swamp land, it may acquire objectionable taste,
odour and plant color. During periods of flooding these swamps may discharge their
decayed vegetation, color and micro-organisms into moving streams and rivers. Deep
wells and large lakes alone provide water that is more or less consistent from season to
season. Smaller bodies of water, shallow wells and springs often reflect seasonal-even
daily variations in their mineral content.
When water vapour condenses sufficiently full to earth, it comes into contact with
gases in the surrounding air, carbon dioxide, nitrogen and oxygen. Atmospheric dust
may also contain minute particles of silica, oxides of iron and other materials together
with dust, pollen and some micro-organisms.
In falling, moisture absorbs amounts of the atmospheric gases because these are
partially soluble in water. The colder water dissolves the more of the surrounding
gaseous content. Water dissolves and collects carbon dioxide to produce carbonic acid.
Normally when such water reaches the earth it is slightly acidic, corrosive and
relatively soft. After water reaches the ground, it may pick up additional amount of
carbon dioxide from decaying vegetable matter. It has the opportunity to seep into the
soil and pass through limestone stratum, the acid condition due to the carbon-dioxide
will be neutralized. At the same time the water will get a large amount of mineral

19
content. Carbonic acid reacts with insoluble calcium carbonate to produce soluble
calcium carbonate.
Water, the most vital resource for all kinds of life on this planet is also the resource,
adversely affected both qualitatively and quantitatively by all kinds of human
activities on land, in air or in water. A large number of parameters signifying the
quality of waters in various uses have been proposed. A regular monitoring of some of
them not only prevents diseases and hazards but also checks the water resources from
going further polluted. Measurements of these indicators can be used to determine,
and monitor changes in, water quality, and determine whether the quality of the water
is suitable for the health of the natural environment and the uses for which the water is
required. Some of the water quality parameters are described here.
Colour of water
General description
The colour of water is a subject of both scientific study and popular misconception.
While relatively small quantities of water are observed by humans to be transparent,
pure water has a light blue colour which becomes a deeper blue as the thickness of the
observed sample increases. The blue colour is caused by selective absorption and
scattering of the light spectrum. Impurities dissolved or suspended in water may give
water different colored appearances (Braun, C. L., et al., 1993).
Colour of the water has aesthetic value. Even pure water is not colourless. Colour in
natural is may be due to industrial wastes, suspended matters, phytoplankton, weeds,
etc. colour of water may not be harmful but coloured waters are objected on aesthetic
grounds (WHO, 1997). Coloured water may not be accepted for certain uses in the
industries. Several industries uses artificial colour which come out in their waste. It
has got a pale green-blue tint in large volumes. Colour in drinking-water may be due
to the presence of coloured organic substances usually humic; metals such as iron and
manganese; or highly coloured industrial wastes, of which pulp and paper textile

20
wastes are the most common. The primary importance of colour in drinking-water is
aesthetic but the sensory effects may be regarded as a heath effect.
Experience has shown that consumers whose drinking-water contains aesthetically
displeasing levels of colour may seek alternative, possibly unsafe, sources.
Most people can detect levels of colour above 15 TCU (true colour units) in a glass of
water. The removal of excess colour, prior to chlorination, will reduce the production
of trihalomethanes. Taste due to chlorinated organic is also mitigated. Limiting the
colour will potable water also limits the concentrations of undesirable substances that
are complexed with or absorbed on to humic material. The guideline value
recommended for colour in drinking-water is less than 15 TCU.
Source
The appearance of colour in drinking water is caused by the absorption of certain
wavelengths of normal ―white‖ light, by the presence of coloured substances and by
light scattering caused by suspended particles coloured measured in water that
contains suspended matter if defined as ―apparent colour‖, ―true colour‖ is measured
on water samples from which particulate matter has been removed by centrifugation or
filtration, colour then being due to humic substances in true solution. In general the
true colour of given water sample is substantially less than its apparent colour.
Occurrence
Complaints of coloured water generally approach in number those collectively
concerned with taste and odour. Colour in natural waters is due to mainly organic
matter, primarily humic substances, originating from the decay and aqueous extraction
of vegetation into surface water. Iron and manganese may often be present in ground
water as well as in some surface waters and impart a colour. Another important source
of iron in drinking water is dissolution of iron pipes conveying the water. Iron and
manganese can give rise to red and black water respectively. Copper solubilized from
copper pipes may give rise to blue green discoloration of sanitary ware in addition to a
faint blue colour to the water in extreme cases. Highly coloured waste waters in

21
particular waste from the pulp paper and textile industries may create coloured water
problems.
A colour problem of microbiological origin is the production of ―red water‖, a
phenomenon caused by the oxidation of iron as a result of which the iron precipitates
from solution as the hydroxide and imparts a characteristic reddish colour to the water.
In severe cases distribution lines have been blocked by the action of these ―iron
bacteria‖. Similarly a black discoloration may be imparted to drinking water by the
action of bacteria capable of oxidizing dissolved manganese to its insoluble oxides.
This colour problem occurs more frequently in ground water than in surface water
supplies.
Health aspects
Limits for colour in potable water have traditionally been based on aesthetic
considerations. It has been noted, however that supply to consumers of visibly
coloured water may lead to seek a colourless but possibly unsafe, alternative source of
drinking water. Other health related criteria include the association between colour
and production of some chlorinated organic compound, interference with the water
treatment and increased chlorine consumption. The authors concluded that applying a
safety factor of approximately 100, drinking water containing 2.5 mg of ―humic acid‖
per litre would be safe for human consumption. The organic coloring material in water
stimulates the growth of many aquatic microorganisms. Some of which are directly
responsible for the production of odour in water. Colour can interfere with the
chemical analysis of many constituents of water. Colour due to organic acids may not
be harmful as such but highly coloured waters are objected on aesthetic ground.

22
Taste and odour
Taste
General description
The taste of water is the sensation that results from the interaction between the saliva
and substances dissolved in the water, as perceived by receptors located in the taste
buds. In the assessment of drinking water-quality, the sensation of taste and odour are
complementary, in general, the sense of taste is most useful in detecting inorganic
constituents of drinking-water, while the sense of smell is more useful in detecting
organic constituents. Minimum concentrations of ions, such as sodium, chloride,
calcium, and bicarbonate, are essential to make water tasteless.
The taste and odours are present mainly due to dissolved impurities often organic in
nature. They are supposed to be ‗chemical senses‘ as they depend on the actual contact
with the receptor organ.
The odours may be of natural origin, caused by living and decaying aquatic organisms
and accumulation of gases like ammonia and hydrogen sulphide etc. Many algae also
impart taste and odours to water. Odours of any artificial origin are due to the
discharge of industrial wastes which include many chemicals imparting odour and
taste. Sometimes reagents added to water supply systems may also produce odour and
taste. The chlorine added for disinfection of water reacts sometimes with organic
matter to form chlorophenols which possess a very high sensitivity for taste and
odours. The objectionable taste and odour are sometimes rejected on the ground of
aesthetic value. Some organic substances imparting taste and odours may also be
toxic. The tastes and odours in the water are also not suitable in food, pharmaceuticals
and beverage industries. Besides many chemicals are also capable of imparting a
characteristic taste.

23
Occurrence
High concentrations of colour and turbidity in water often associated with nonspecific
taste problems. The growth rate of microorganisms, some of which may produce bad
tasting metabolites is enhanced by higher temperature as also is the rate of formation
of offensive-tasting corrosion products. Where pH controls the equilibrium
concentration of the neutral and ionized forms of a substance in solution it can notably
influence its taste and odour.
Many of the inorganic substances occuring in water exert an unpleasant taste at
concentrations much lower than those required for acute toxic effects. Limits for such
substances are therefore set at concentrations that reflect levels found to be
objectionable to consumers. Taste thresholds in distilled water for the major cations of
drinking water like calcium, magnesium, sodium and potassium have been reported to
be approximately 100, 30, 100 and 300 mg/l respectively. The uncertainty associated
with these evaluations is largely due to the influence on taste of their associated
anions.
Table 1.3 shows some of the taste producing chemicals with their threshold limits:

24
Table (1.3): Some inorganic chemicals with their threshold limits imparting taste to
the water (Voznaya, 1981).
Concentration, mg/l.
Salt Indefinite, slight
hardly
distinguishable taste
Repulsive taste
NaCl 150 500 Salty
MgCl2 100 400 Bitter
MgSO4 200 500 bitter
CaSO4 70 150 astringent
KCl 350 700 bitter
FeSO4 1.5 5 Chalybeate
MnCl2 2 4 stagnant
FeCl2 0.3 0.5 stagnant
Health aspects
The presence of objectionable tastes in a public water supply may cause consumers to
seek alternative sources of potable water, which may or may not be subject to the
same degree of microbial protection afforded by the rejected supply. The taste of
water unfortunately provides no assurance that such water is free of pathogens or toxic
inorganic chemicals. Fortunately median taste threshold an inorganic substances are
generally much lower than the concentrations that cause adverse health effects.
Short term changes in the normal taste may signal changes in the quality of the raw
water source, deficiencies in the treatment process or chemical corrosion and
biological growths in the distribution system. Special local circumstances may occur
resulting in an unavoidable perceptible taste in the water. In such cases local health
authorities should give priority to disinfection to ensure the control of disease causing
contaminants such as pathogenic bacteria.
25
Odour
General description
The odour of drinking water may be defined as the sensation that is due to the
presence of substances having an appreciable vapour pressure and that simulate the
human sensory organs in the nasal and sinus cavities. The sense of smell will generally
respond to much lower concentrations (a few microorganisms per litre or less) of a
substance than will the sense of taste a few milligrams per litre or more. The odour
intensity of water is usually measured in terms of its threshold odour number (TON),
which is defined as the geometric mean of the dilution ratios with odour-free water,
the odour of which is just detectable by a panel of judges under very carefully
controlled taste conditions.
It is important to specify the temperature at which odour intensity measurement are
made, since odour intensity is related to the vapour pressure of any odour-causing
substance and, hence, will be directly related to the water temperature.
Occurrence
Water odour is predominately due to the presence of organic substances in water.
Objectionable odours in drinking water may be of either biological or industrial origin
and some odours of natural origin may be due indirectly to human activities like the
dumping of raw sewage into the aquatic environment enhances biological growth
which may produce odorous products.
Natural odours tend to be described as earthy, musty, or sour on the one hand or as
fishy, grassy, or cucumber like on the other, involving compounds. Industrially
derived odours often smell like such substances as petroleum or have a medicinal
odour. Typical examples in this category are naphthalene and the chlorinated benzene
and phenols. Ground water tends to have fewer odour problems, although odours are
not restricted to any single type of water or to any particular season of the year.
Odours may also be produced under stagnant water conditions in low-flow sections of
distribution system or in raw or finished water reservoirs. Water purification processes

26
may convert substances with weak odours into substances possessing very intense
odours. The proliferations of nuisance organisms such as iron and sulfur bacteria in
distribution systems may also be a source of odour.
The nonspecific fishy, grassy and musty odours normally associated with biological
growth tend to occur most frequently in warm surface water in the warmer months of
the year.
Health aspects
Odour in potable water is almost invariably indicative of some form of pollution of the
water source or of malfunction during water treatment or distribution. Odours of
biological origin are indicative of increased biological activity, which may include an
increased loading of dangerous pathogens on the system. Odours of industrial origin
are associated with pollution of the source-water with commercial waste products,
some of which may be toxic. Sanitary surveys should include investigations for
potential or existing sources of odour and attempts should always be made to identify
the source of an existing odour problem.
Some chemical contaminants of concern because of their toxic properties may also
cause odour problems. Drinking water should have no observable odour to any
consumer. However owing to the large differences in individual odour sensitivity
within a population a more realistic objective is to provide a water free of
objectionable odour for the large majority of the population. The most direct way of
achieving this objective is through the cooperation of a large consumer panel (e.g. 100
consumers) in a supply area who are asked to make periodic assessments of water
odour and taste in their homes. Participants should indicate their observations on a
category scale (good-not perceptible-mildly objectionable-bad). Laboratory panels
tend to be more critical in assessing water, odour and taste. However laboratory panels
of 10-20 trained persons can also indicate if water is aesthetically acceptable to the
majority of the consumers. If the odour number is measured at room temperature by
the forced choice method using a selected laboratory panel it is recommended that the
27
objective value be less than 1, unless local circumstances demand a disinfection
practice requiring perceptible free chlorine residuals.
Turbidity
Turbidity in water is caused by the substances not present in the form of true solution.
True solutions have a particle size of less than 10-9
m. Any substance having more
than this size will produce turbidity. Turbidity of water is actually the expression of
optical property in which the light is scattered by the particles present in the water.
Turbidity in natural waters is caused by clay, silt and organic matter like
phytoplankton and other microscopic organisms. Turbidity determinations do not
correlate with the actual amount of suspended matter as the scattering of light is highly
depended upon the size, shape and refractive index of the particles.
The major source of turbidity in the open water zone of most lakes is typically
phytoplankton, but closure to shore, particulates may also be clays and silts from shore
line erosion, resuspended bottom sediments and organic detritus from stream and/or
wastewater discharges. Dredging operations, channelization, increased flow rates,
floods or even too many bottom feeding fish (such as carp) may stir up bottom
sediments and increase the cloudiness of the water (ICMR, 1975).
Turbidity is reported by RUSS in nephelometric units (NTUs) which refers to the type
of instrument (turbidimeter or Nephelometer) used for estimating light scattering from
suspended particulate material. Determination of turbidity is an important objectives in
removal of the turbidity by coagulation, filtration etc. in drinking water treatment
plants.
A reduction in turbidity is associated with a reduction in suspended matter and
microbial growth. High concentration of particulate matter can modify light
penetration, cause shallow lakes and bays to fill in faster, and smother benthic habitats
– impacting both organisms and eggs. As particles of silt, clay, and other organic
materials settle to the bottom, they can suffocate newly hatched larvae and fill in
spaces between rocks which could have been used by aquatic organisms as habitat.
28
Fine particulate material also can clog or damage sensitive gill structures, decrease
their resistance to disease, prevent proper egg and larval development, and potentially
interfere with particle feeding activities. If light penetration is reduced significantly,
macrophyte growth may be decreased which would in turn impact the organisms
dependent upon them for food and cover. Reduced photosynthesis can also result in a
lower daytime release of oxygen into the water. Effects on phytoplankton growth are
complex depending on too many factors to generalize (McCoy, W. F., et al., 1986).
Environmental effects
Turbidity makes the water unfit for domestic purposes, food and beverage industries
and many other industrial uses. Turbidity in natural waters restricts light penetration
for photosynthesis. The major effect turbidity has on humans might be simply
aesthetic – people don‘t like the look of dirty water. However, turbidity also adds real
costs to the treatment of surface water supplies used for drinking water since the
turbidity must be virtually eliminated for effective disinfection (usually by chlorine in
a variety of forms) to occur.
Conductivity
Conductivity is the measure of capacity of a substance or solution to conduct electric
current. Conductivity is reciprocal of the resistance. As most of the salts in the water
are present in the ionic forms capable of conducting current, therefore conductivity is
a good and rapid measure of the total dissolved solids. The conductivity of distilled
water ranges between 1 to 5µ mho but the presence of salts and contamination with
waste waters increase the conductivity of the water. Consequently a sudden rise in
conductivity in the water will indicate addition of some pollutant to it. The
conductivity is generally reported in µ mho or mmho. The recent unit of conductivity
has been named as Siemens (S) instead of mho. Conductivity is highly dependent
upon temperature and therefore is reported normally at 25°C to maintain the
comparability of the data from various sources.

29
Conductivity has got no health significance as such. Conductivity however is
important criterion in determining the solubility of water and waste water for
irrigation. Waters having conductivity more than 20 mmho have not been found
suitable for irrigation.
Total Dissolved Solids (TDS)
General description
The total dissolved solids (TDS) in water comprise salts and small amounts of organic
matter. The principle ions contributing to TDS are carbonate, bicarbonate, chloride,
sulphate, nitrate, sodium, potassium, calcium and magnesium. Total dissolved solids
influence other qualities of drinking water such as taste, hardness, corrosion properties
and tendency to incrustation dissolved solids do not contain any gas and colloids. A
high level of TDS elevates the density of water and such medium increases
osmoregulatory stress on aquatic biota (Verma et. al. 1978). Occurrence of small
amount of TDS in dam water is because of various kinds of minerals present in the
water. (Trivedi and Goel 1986).
According to Moss (1980), the total suspended solids (TSS) of most natural water are
lower than the total dissolved solids (TDS). Total dissolved solids are solids in water
that can pass through a filter (usually with a pore size of 0.45 micrometers). TDS is a
measure of the amount of material dissolved in water. This material can include
carbonate, bicarbonate, chloride, sulfate, phosphate, nitrate, calcium, magnesium,
sodium, organic ions, and other ions. A certain level of these ions in water is necessary
for aquatic life (Gyananath, G., et al., 2000)
Occurrence
The total dissolved solids (TDS) in water may originate from natural sources, sewage
effluent discharges, urban runoff, industrial waste discharges. Water in contact with
granite, siliceous sand, well-leached soil, or other relatively insoluble material have
TDS levels of less than 30 mg/l. under arid conditions the TDS of the smaller streams
may increase to levels of 15 mg/litre. Elsewhere the levels in excess of 35 g of TDS

30
per litre have been recorded in briny waters. The use of salt for snow and ice control
on roads during winter weather contaminates both surface and ground water sources,
increasing the TDS of waters noticeably in some countries.
In the polluted water, the concentrations of other substances increase depending upon
the type of pollution. The determination of dissolved solids does not give a clear
picture of the kind of pollution. Concentration of dissolved solids is an important
parameter in drinking water and other water quality standards. They give a particular
taste to the water at higher concentration and also reduced its palatability. However in
case of drinking water the individual concentrations of different substances are more
important rather than the total dissolved solids.
Health aspects
High concentration of dissolve solids near 300 mg/l may also produce distress in cattle
and livestock. Plants are also adversely affected by the higher content of solids in
irrigation water which increase the salinity of the soil. In industries, the use of water
with high amount of dissolved solids may lead to the scaling in boilers, corrosion, and
degraded quality of the product.
There is no evidence deleterious physiological reactions occuring in persons
consuming drinking-water supplies that have TDS levels in excess of 1000 mg/l. the
results of certain epidemiological studies would appear to suggest that TDS in
drinking-water may even have beneficial health effects.
The common dissolved mineral salts are claimed to affect the taste of water. The
effects that many of these minerals have on taste have been discussed in the separate
reviews of these constituents and in section dealings with taste. Bruvold et.al. (1989)
has rated the palatability of drinking-water according to the TDS level thus:

31
TABLE (1.4)
Excellent Less than 300 mg/l.
Good Between 300 and 600 mg/l.
Fair Between 600 and 900 mg/l.
Poor Between 900 and 1200 mg/l.
Unacceptable Greater than 1200 mg/l.
Water with extremely low TDS levels may also be Unacceptable because of its flat,
insipid taste.
Other aspects
Certain compounds of TDS such as chlorides, sulphates, magnesium, calcium, and
carbonates affect corrosion or incrustation in water distribution systems. Total
dissolved solids are not generally removed in conventional water-treatment plants.
Although no deleterious physiological effect has been recorded with total dissolved
solids in water above 1000 mg/l. it was considered that it would as a rule, be
unacceptable to exceed this level, which is recommended as a guideline value.
Similar to TSS, high concentrations of TDS may also reduce water clarity, contribute
to a decrease in photosynthesis, combine with toxic compounds and heavy metals, and
lead to an increase in water temperature (Dhembare, A. J., et al., 1997).
Total Suspended Solids (TSS)
When the suspended particles settle to the bottom of a water body, they become
sediments. The terms ―sediment‖ and ―silt‖ are often used to refer to suspended solids.
Suspended solids consist of an inorganic fraction (silts, clays, etc.) and an organic
fraction (algae, zooplankton, bacteria, and detritus) that are carried along by water as it
runs off the land. The inorganic portion is usually considerably higher than the
organic. Both contribute to turbidity, or cloudiness of the water. Waters with high
sediment loads are very obvious because of their ―muddy‖ appearance. This is

32
especially evident in rivers, where the force of moving water keeps the sediment
particles suspended (Choudri, B. S., et al., 2001).
Environmental Impact:
Suspended solids can clog fish gills, either killing them or reducing their growth rate.
They also reduce light penetration. This reduces the ability of algae to produce food
and oxygen. When the water slows down, as when it enters a reservoir, the suspended
sediment settles out and drops to the bottom, a process called siltation. This causes the
water to clear but as the silt or sediment settles it may change the bottom. The silt may
smother bottom-dwelling organisms, cover breeding areas, and smother eggs.
Indirectly the suspended solids affect other parameters such as temperature and
dissolved oxygen. Because of the greater heat absorbency of the particulate matter, the
surface water becomes warmers and this tends to stabilize the stratification (layering)
in stream pools, embayments, and reservoirs. This, in turn, interferes with mixing,
decreasing the dispersion of oxygen and nutrients to deeper layers.
Suspended solids interfere with effective drinking water treatment. High sediment
loads interfere with coagulation, filtration, and disinfection. More chlorine is required
to effectively disinfect turbid water. They also cause problems for industrial users.
Suspended sediments also interfere with recreational use and aesthetic enjoyment of
water. Poor visibility can be dangerous for swimming and diving. Siltation, or
sediment deposition, eventually may close up channels or fill up the water body
converting it into a wetland. A positive effect of the presence of suspended solids in
water is that toxic chemicals such as pesticides and metals tend to absorb to them or
become complexed with them which make the toxics less available to be absorbed by
living organisms.
pH
pH is the measure of the intensity of acidity or alkalinity and measures the
concentration of hydrogen ions in water. It does not measure total acidity or alkalinity.
In fact the normal acidity or alkalinity depends upon excess of H+ or OH
¯ ions over the
33
other and measured in normality or gram equivalents of acid or alkali. If free H+ are
more than OH¯
ions, the water shall be acidic or alkaline pH is generally measured on
a log scale and equals to negative log10 of hydrogen ion concentration.
pH = ¯ log 10 [H+]
= log10
pH regulates most of the biological processes and biochemical reactions Scuthorpe
(1967) has reported that pH, free CO2 and ammonia are more critical factors in the
survival of aquatic plants and fishes than the oxygen supply. According to Spence
(1967) the pH of a typical eutrophic lake ranges from 7.7 to 9.6. The pH of water may
influence many biological and chemical processes in natural waters (Shreenivasan,
1974; Saad, 1978). Higher pH observed during post monsoon could be ascribed to an
increase in temperature and subsequent evaporation of water coupled with increase
salinity (Zingde et.al. 1987; Upadhaya 1998). This could also be due to removal of
CO2 by photosynthesis through biocarbonate degradation, dilution of sea water by
fresh water influx reduction of salinity and temperature and decomposition of organic
matter as stated by Ragothaman and Patil (1995 and Upadhay 1998)
pH of the aquatic systems is an important indicator of water quality. Unpolluted lakes
normally show a near neutral or slightly alkaline pH (Adakole, et.al ., 2003). Though
normal biological activity is restricted to pH 6 to 8, for natural water, the EEC (1980)
guide limit for waters requiring simple physical treatment and disinfection is 6.5 to
8.5.
Most natural waters are generally alkaline due to presence of sufficient quantities of
carbonates. pH of water gets drastically changed with time due to the exposure to air,
biological activity and fluctuation of temperature. Significant changes in pH occur due
to disposal of industrial wastes, acid and mine drainage etc. in natural waters, pH
changes diurnally and seasonally due to variation in photosynthetic activity which
increases the pH due to consumption of CO2 in the process.
34
Hofman (1977) stated that although pH varies in space and time, little is known about
its influence on aquatic population dynamics. Regarding the effect of pH, Pennak
(1953) opined that, alkaline waters with a pH above 7.0, contain few species with
lager number of individual \, while acidic water contains large number of species but
with few individual
Determination of pH is one of the important objectives in treatment of the wastes. In
anaerobic treatment if the pH goes below 5 due to excess accumulation of acids, the
process is severely affected adversely. Shifting of pH beyond 5to 10 upsets the aerobic
treatment of the wastes. In these circumstances the pH can be adjusted by addition of
suitable acid or alkali to optimize the treatment of the wastes.
Wetzel (1975) reported that the value of pH ranges from 8 to 9 units in Indian waters.
The lower pH during monsoon is due to high turbidity and in summer the high
temperature enhances microbial activity causing excessive production of CO2 and
reduced pH. Khan and Khan (1985) and Narayani (1990) also reported similar results
at Seikha Jheel in Aligarh and lower lake, Bhopal respectively. Ghose and Sharma
(1988) also recorded relatively high pH of water in winter months in their study of
Ganga River attributing high pH to increase primary productivity. Alkalinity and pH
are the factors responsible for determining the amenability of water to biological
treatment (Manivasakam, 1980)
Health aspects
pH has no direct adverse effect on health however; a lower value below 4 will produce
sour taste; and higher value above 8.5, an alkaline taste. Higher values of pH hasten
the scale formation in water heating apparatus and also reduce the germicidal potential
of chlorine. High pH induces the formations of trihalomethanes which are toxic. pH
below 6.5 starts corrosion in pipes, thereby releasing toxic metals such as Zn, Pb, Cd
and Cu etc. In the water supplies, pH is also an important factor in fixing alum dose in
drinking water treatment.
35
Alkalinity
Alkalinity of the water is its capacity to neutralize a strong acid and is characterized
by the presence of all hydroxyl ions capable of combining with the hydrogen ion.
Alkalinity in natural waters is due to free hydroxyl ions and hydrolysis of salts formed
by weak acids and strong bases. When a salt of weak aid and strong base is
hydrolyzed, it forms the weak acid and the strong base. The weak acid is unable to
dissociate more and when the titration is carried out with a strong acid the equilibrium
is shifted to the right and all the salt is hydrolysed. The number of milliequivalents of
acid used in the titration to combine all the hydroxyl ions is called as total alkalinity.
According to Durrani (1993) withdrawal of CO2 from bicarbonates for Photosynthesis
by algae may increase total alkalinity. Total alkalinity may be used as a tool of
measurement of productivity Spence classified the lakes into 3 categories based on
alkalinity.
1) 1 to 15 mg/l is nutrient poor.
2) 16 to 60 mg/l is moderately nutrient rich.
3) Above 60 mg/l is nutrient rich
Most of the alkalinity in natural waters is formed due to dissolution of CO2 in water.
Carbonates and bicarbonates thus formed are dissociated to yield hydroxyl ions.
Carbonates salts produce double the hydroxyl ions than the bicarbonates. Alkalinity is
also produced by the action of water on limestone or chalk. In the natural and polluted
waters, there are many other salts of weak acids such as silicates, phosphates, borates
which cause alkalinity in addition to that of carbonates and bicarbonates sharing the
most part of the total alkalinity. Naturally coloured waters also contain salts of humic
and fulvic acids which also add to the alkalinity of waters.
Impact
Alkalinity in itself is not harmful to human beings; still the water supplies with less
than 100 mg/l are desirable for domestic use. The alkalinity value is also important in

36
calculating the dose of alum and biocides in water. Alkalinity producing substances
such as sodium bicarbonate are added to check corrosion in soft water supplies.
Alkalinity measurements are also important in controlling water and waste water
treatment processes. The ratio of alkalinity to that of alkaline earth metals is a good
parameter determining the suitability of irrigation waters.
Alkalinity is important for fish and aquatic life because it protects or buffers against
rapid pH changes, living-organisms especially aquatic life, function best in a pH range
of 6.0 to 9.0. Alkalinity is a measure of how much acid can be added to a liquid
without causing a large change in pH. Higher alkalinity levels in surface water will
buffer acid rain and other acid wastes and prevent pH changes that are harmful to
aquatic life.
Dissolved Oxygen (DO)
General description
Dissolved oxygen is one of the most important parameter in water quality assessment
and reflects the physical and biological processes prevailing in the water. Its presence
is essential to maintain the higher forms of biological life in the water and the effects
of a waste discharge in a water body are largely determined by the oxygen balance of
the system. Non polluted surface waters are normally saturated with dissolved oxygen.
Oxygen can be rapidly removed from the waters by discharge of the oxygen
demanding wastes. Other in organic reductant such as hydrogen sulphide ammonia
nitrites, ferrous iron and other oxidizable substances also tend to decrease dissolved
oxygen in water.
Dissolved oxygen data are valuable in determining the water quality criteria of an
aquatic system. In the system where the rate of respiration and organic decomposition
are high, the DO values usually remain lower than those of the systems where the rate
of photosynthesis is high. A high pollution load may also decrease the DO values to a
considerable level. Dissolved oxygen (DO) plays an important role in determining the
occurrence and abundance of aquatic communities (Dhanapathi, 2000). Hofman
37
(1977) observed oxygen concentration as to be an important factor in determining
seasonal, horizontal and vertical variations of organisms, while Berzins and Pejler
(1989b) noticed wider range of oxygen is required for the occurrence of aquatic
organisms.
Factors affecting DO
Volume and velocity of water flowing in the water body
In slow, stagnant waters, oxygen only enters the top layer of water, and deeper water
is often low in DO concentration due to decomposition of organic matter by bacteria
that live on or near the bottom of the reservoir.
Dams slow water down, and therefore can affect the DO concentration of water
downstream. If water is released from the top of the reservoir, it can be warmer
because the dam has slowed the water, giving it more time to warm up and lose
oxygen. If dams release water from the bottom of the reservoir, this water will be
cooler, but may be low in DO due to decomposition of organic matter by bacteria
(Thorat, S. R., et al., 2000).
Climate/Season
The colder the water, the more oxygen can be dissolved in the water. Therefore, DO
concentrations at one location are usually higher in the winter than in the summer.
During dry season, water levels decreases and the flow rate of a river slows down. As
the water moves slower, it mixes less with the air, and the DO concentration
decreases. During rainy seasons, oxygen concentrations tend to be higher because the
rain interacts with oxygen in the air as it falls.
More sunlight and warmer temperatures also bring increased activity levels in plant
and animal life; depending on what organisms are present, this may increase or
decrease the DO concentration.

38
The type and number of organisms in the water body
During photosynthesis, plants release oxygen into the water. During respiration, plants
remove oxygen from the water. Bacteria and fungi use oxygen as they decompose
dead organic matter in the stream. The type of organisms present (plant, bacteria,
fungi) affects the DO concentration in a water body. If many plants are present, the
water can be supersaturated with DO during the day, as photosynthesis occurs.
Concentrations are usually highest in the late afternoon, because photosynthesis has
been occurring all day (Bath, K. S., 1998)
Dissolved or suspended solids
Oxygen is more easily dissolved into water with low levels of dissolved or suspended
solids. Waters with high amounts of salt, such as the ocean (which contains about 35
grams of salt for each 1000 grams of water) have low concentrations of DO.
Freshwater lakes, streams, and tap water generally contain much less salt. So DO
concentrations are higher. As the amount of salt in any body of water increases, the
amount of dissolved oxygen decreases. An increase in salt concentration due to
evaporation of water from an ecosystem tends to reduce the dissolved oxygen
available to the ecosystem‘s inhabitants (Bath, K. S., 1998)
Runoff from roads and other paved surfaces can bring salts and sediments into stream
water, increasing the dissolved and suspended solids in the water.
Effects
Low oxygen in water can kill fish and other organisms present in water. Organisms
have specific requirement of oxygen like game fish requires at least 5 mg/l and coarse
fish about 2 mg/l of minimum dissolved oxygen in water. The concentration of oxygen
will also reflect whether the processes undergoing are aerobic or anaerobic. Low
oxygen concentrations are generally associated with heavy contamination by organic
matter. In such conditions oxygen sometimes totally disappears from the water.
Oxygen saturated waters have a pleasant taste while the waters lacking oxygen have
an insipid taste.

39
Water containing dissolved oxygen at below 80% to 85% saturation has been reported
to lead to an increase in the incidence of consumer complaints relating particularly to
colour (resulting from the corrosion of metal pipes) (ISO, 1990).
Biochemical Oxygen Demand (BOD)
General description
BOD is the amount of oxygen utilized by microorganisms in stabilizing the organic
matter. On a average basis, the demand for oxygen is proportional to the amount of
organic waste to be degraded aerobically. Hence, BOD approximates the amount of
oxidizable organic matter present in the solution and the BOD value can be used as a
measure of waste strength. The BOD values are thus very useful in process design and
loading calculations as well as the measure of treatment plant efficiency and operation.
The BOD test is also useful in stream pollution control management and in evaluation
the self purification capacities of streams which serves as a measure to across the
quality of wastes which can be safely assimilated by the stream.
The complete degradation of the organic matter may take as long as 20 to 30 days.
Simple organic compounds like glucose are almost completely oxidized in5 days;
while domestic sewage by only about 65%; and complex organic compounds might be
oxidized only upto 40% in this period. The 20-30 days period is of less significance in
practice therefore the BOD taste has been developed 5 days at 20°C.
Types of microorganisms, pH, presence of toxins, some reduced mineral matter and
nitrification process are the important factors influencing the BOD taste. Based on
BOD classification of aquatic bodies: unpolluted (BOD <1.0 mg/l), moderately
polluted (BOD between 2 to 9 mg/l) and heavily polluted (BOD > 10.0 mg/l)
(modified from Vowel and Connel, 1980; Mara, 1983; Adakole et al., 1998)
BOD is typically divided into two parts- carbonaceous oxygen demand and
nitrogenous oxygen demand. Carbonaceous biochemical oxygen demand (CBOD) is
the result of the breakdown of organic molecules such as cellulose and sugars into
carbon dioxide and water. Nitrogenous oxygen demand is the result of the breakdown
40
of proteins. Proteins contain sugars linked to nitrogen. After the nitrogen is ―broken
off‖ a sugar molecule, it is usually in the form of ammonia, which is readily converted
to nitrate in the environment. The conversion of ammonia to nitrate requires more than
four times the amount of oxygen as the conversion of an equal amount of sugar to
carbon dioxide and water (Chitra., et al., 1997)
Effects
BOD in general gives a qualitative index of the organic substances which are degraded
quickly in a short period of time. BOD values should not be used as equivalent to the
organic load regardless of the presence of non ions of microorganisms. BOD taste
should be restricted to only suitable wastes in management of the treatment plants
however for other kinds of wastes chemical oxygen demand values may be more
appropriate.
Higher values of BOD indicate a higher consumption of oxygen and a higher pollution
load. BOD determines the strength of sewage, effluents and other polluted waters and
provides data on the pollution load in natural waters. If elevated levels of BOD lower
the concentration of dissolved oxygen in a water body, there is a potential for
profound effects on the water body itself, and the resident aquatic life. When the
dissolved oxygen concentration falls below 5 milligrams per liter (mg/l), species
intolerant of low oxygen levels become stressed. The lower is the oxygen
concentration; the stress is greater (Bajpai., et al., 1993).
Nitrate and Nitrite
General description
The U.S. Environmental Protection Agency (EPA) has established a maximum
contaminant level (MCL) of 10 milligram per litre (mg/l) for nitrate as (NO3-N) and a
MCL of 1 mg/l for nitrite as nitrogen (NO2-N) in drinking water.
Colorado Department of Public Health and Environment Water Quality Control
Division (CDPHE-WQCD) regulations state that for domestic water supply, the

41
combined total of nitrite and nitrate shall not exceed 10 mg/l as N, and nitrite
concentration shall not exceed 1 mg/l as N at the point of intake.
Nitrate (NO3) and nitrite (NO 2) are the common forms of nitrogen in the water.
Nitrate is highly soluble (dissolves easily) in water and is stable over a wide range of
environmental conditions. Nitrates feed plankton (microscopic plants and animals that
live in water), aquatic plants, and algae, which are then eaten by fish. Nitrite is
relatively short-lived in water because it is quickly converted to nitrate by bacteria
(Gupta, A.K., 1997).
Nitrate and nitrite are considered together because conversion from one form to the
other occurs in the environment. The health effects of nitrate are generally a
consequence of its ready conversion of nitrite in the body. Concentrations in water are
expressed in mg/l. for nitrate- nitrogen (nitrate-N) and nitrite- nitrogen (nitrite-
nitrogen).
Sources
Nitrates are widely present in substantial quantities in soil, in most waters, and in
plants, including vegetable. Nitrites also occur fairly widely, but generally at very
much lower levels than nitrates. Nitrates are products of oxidation of organic nitrogen
by the bacteria present in soils and in water where sufficient oxygen is present. Nitrites
are formed by incomplete bacteria oxidation of organic nitrogen. One of the principle
uses of nitrate is as a fertilizer; most other nitrogen containing fertilizers will, however
be converted to nitrate in the soil. Nitrates are also used in explosives, as oxidizing
agents in the chemical industry, and as food preservatives. The main use of nitrites is
as food preservatives generally as the sodium or the potassium salt. Some nitrates in
the environment are produced in the soil by fixation of atmospheric nitrogen. Some
nitrates and nitrites are formed when oxides of nitrogen produced by the action of
lightning discharge or via man-made sources are washed out by rain. Nitrates and
some nitrites are also produced in the soil as a result of bacterial decomposition of
organic material, both vegetable and animal. Because nitrates and nitrites are

42
widespread in the environment, they are found in most foods, in the atmosphere and in
many water sources.
The most important source of the nitrate is biological oxidation of organic nitrogenous
substances which come in sewage and industrial wastes or produced indigenously in
the waters. Domestic sewage contains very high amounts of nitrogenous compounds.
Run-off from agricultural fields is also high in nitrate. Atmospheric nitrogen fixed into
nitrates by the nitrogen fixing organisms is also a significant contributor to nitrates in
the waters.
Occurrence in water
Fertilizer use, decayed vegetable and animal matter, domestic effluents, sewage sludge
disposal to land, industrial discharges, and leachates from refuse drums, and
atmospheric washout all contribute to these ions in water sources. Changes in land use
may also give rise to increased nitrate levels. Depending on the situation, these sources
can contaminate streams, rivers, lakes and groundwater especially wells. Contamination may result from a direct or indirect discharge, or it may arise by
percolation over a period of time, sometimes after many years. The levels of nitrates in
polluted water are almost invariably very much higher than the levels of nitrites.
Health aspects
Excessive concentrations of nitrate and/or nitrite can be harmful to humans and
wildlife. Nitrate is of most concern for humans. Nitrate is broken down in our
intestines to become nitrite. The high concentrations of nitrites can also cause ‗blue-
baby‘ disease (Methamoglobinemia) in infants. Nitrates are of prime concern because
of Methamoglobinemia when the concentration of nitrates exceeds 40 mg/l. In this
disease the skin become blue due decreased efficiency of hemoglobin to combine with
oxygen. In cattle, the high concentration of nitrates is reported to cause more mortality
in pigs and calves and abortion in brood animals.
The problem of Methamoglobinemia does not arise in adults. Increased sensitivity
may also occur when infants suffer from gastrointestinal disturbances, which increase
43
the numbers of bacteria that can convert nitrate to nitrite. It is especially serious for
infants, because they lack the enzyme necessary to correct this condition. The nose
and tips of ears can appear blue from lack of oxygen.
High concentration of nitrate and/or nitrite can produce ―brown blood disease‖ in fish.
Nitrite enters the bloodstream through the gills and turns the blood chocolate-brown
colour. Brown blood cannot carry sufficient amounts of oxygen, and affected fish can
suffocate despite adequate oxygen concentration in the water. This accounts for the
gasping behavior often observed in fish with brown blood disease, even when oxygen
levels are relatively high (Mississippi State University, 1998).
Sulphates
General description
The majority of sulphates are soluble in water, the exceptions being the sulphates of
lead, barium and strontium. Dissolved sulphate is considered to be a permanent solute
of water. It may however be reduced to sulfide, volatilized to the air as H2S,
precipitated as an insoluble salt or incorporated in living organisms.
Sulphates are discharged into the aquatic environment in the wastes from many
different industries. Atmospheric sulfur dioxide formed by the combustion of fossil
fuels and emitted by the metallurgical roasting processes may also contribute to the
sulfate content of surface water. Sulfur trioxide produced by the photolytic or catalytic
oxidation of sulfur dioxide, combines with water vapour to form sulfuric acid, which
is precipitated as ―acid rain‖ or snow.
Occurrence
It is a naturally occuring anion in all kinds of natural waters. In arid and semiarid
regions, it is found in particularly higher concentrations due to the accumulation of
soluble salts in solids and shallow aquifers. Biological oxidation of reduced sulphur
species to sulphate also increases its concentration. Rain water has quite high
concentration of sulphate particularly in the areas with high atmospheric pollution.
44
Discharge of industrial wastes and domestic sewage in waters tends to increase its
concentration. Most of the salts of sulphate are soluble in water and as such it is not
precipitated. However, it may undergo transformations to sulphur and hydrogen
sulphide depending upon the redox potential of the water.
Environmental Impact:
Sulphate is poorly absorbed from the human intestine; it slowly penetrates the cellular
membranes of mammals and is rapidly eliminated through the kidneys. The reported
minimum lethal dose of magnesium sulphate in mammals is 200 mg/kg of body
weight. Sulphate doses of 1.0-2.0 g have a cathartic effect on humans, resulting in the
purgation of the alimentary canal. Infants ingesting sulphate equivalent to 21 mg/kg of
body weight per day may also suffer from this effect. Magnesium sulphate at
concentrations above 1000 mg/l acts as a purgative in normal humans, but
concentrations below this are apparently physiologically harmless. Sensitive people
are responsive to magnesium sulphate levels as low as 400 mg/l and new users or
those imbibing occasionally may be affected by concentrations in excess of 700 mg/l.
the human system adapts in the course of time to higher concentrations of sulphate in
drinking water.
Sulfur is an essential plant nutrient. Aquatic organisms utilize sulfur and reduced
concentrations have a detrimental effect on algal growth. The most common form of
sulfur in well-oxygenated waters is sulphate. When sulphate is less than 0.5 mg/l, algal
growth will not occur. On the other hand, sulphate salts can be major contaminants in
natural waters (Shastri., et al., 2001).
Sulphate is an important constituent of hardness with calcium and magnesium.
Sulphate produces an objectionable taste at 300-400 mg/l concentrations. Above 500
mg/l, a bitter taste is produced in the water. At concentrations around 1000 mg/l, it is
laxative (U.S.EPA, 1973). Sulphate with sodium interferes with the normal
functioning of the intestine.
45
Chloride
General description
Chloride is widely distributed in nature, generally in the form of sodium, potassium
and calcium salts. It constitutes approximately 0.05% of the lithosphere. By far the
greatest amount of chloride in the environment is present in the oceans.
The presence of chloride in natural waters can be attributed to dissolution of salt
deposits, contamination resulting from salting of roads to control ice and snow,
discharge of effluents from chemical industries, oil well operations, sewage
discharges, irrigation drainage, contamination from refuse leachates, and seawater
intrusion in coastal areas. Each of these sources may result in local contamination of
both surface water and groundwater. The chloride ion is highly mobile, however and is
eventually transported into closed basins or to the oceans. High chlorides indicate
organic pollution, particularly from domestic sewage (Trivedi et. al. 1990).
Munawar (1970) observed a direct correlation between chloride concentration and
pollution level in fresh water ponds of Hyderabad. Jana (1973); Govindan and
Sundaresan (1979) observed that concentration of higher chloride in the summer
period could be also sewage mixing and increased temperature and evaporation by
water. Chloride is an indication of possible sewage introduction into the water body
(Krenkel, 1974; Drury et.al., 1997).
Sources of chloride
The application of road salt for winter accident prevention represents the single largest
use of salt in British Columbia and serves as the primary anthropogenic source of
chloride to the environment (Evans, M., et al., 2001). Sodium chloride is also widely
used in the production of industrial chemical such as caustic soda (sodium hydroxide),
chlorine, soda ash (sodium carbonate), sodium chlorite, sodium bicarbonate, and
sodium hypochlorite. Potassium chloride is used in the production of fertilizers. In
addition to the salting of highways to control ice and snow, other sources of chloride
to the environment include dissolution of salt deposits, effluents from chemical

46
industries, oil well operations, sewage, irrigation drainage, refuse leachates, and sea
water intrusion in coastal areas (CCME, 1999).
Occurrence
Chloride is generally present at low concentrations in natural surface water. Levels in
unpolluted water are often less than 10 mg/l and may often be less than 1 mg/l. In
foods of plant and animal, origin chloride occurs naturally, generally at levels less than
0.36 mg/g. the addition of salt during processing or cooking and at the table, can
markedly increase the chloride level in food.
Environmental health effects
Chloride is harmless upto 1500 mg/l concentration but produces a salty taste at 250-
500 mg/l level. It can also corrode concrete by extracting calcium in the form of
calcide. Magnesium chloride water generates hydrochloric acid after heating which is
also highly corrosive and creates problems in boilers. Chloride is the most abundant
anion in the human body and contributes significantly, along with its associated
cations, to the osmotic activity of the extracellular fluid; 88% of the chloride in the
body is extracellular. A normal 70 kg human body contains approximately 81.7 g of
chloride and 85 litre of water. It is harmless upto 1500 mg/l concentration but
produces a salty taste at 159-500 mg/l level. It can also corrode concrete by extracting
calcium in the form of calcide. Magnesium chloride water generates hydrochloric acid
after heating, which is also highly corrosive and create problems in boilers.
Food represents the principle source of chloride that is consumed by the humans.
Approximately 0.6 g of chloride per day is ingested in a salt-free diet. Due to the
addition of salt to food, the daily intake of chloride averages 6 g and may range as
high as 12 g. if one assumes that daily water consumption is 1.5 L and that the average
concentration of chloride in drinking water is 10 mg/l, the average daily intake of
chloride from drinking water is approximately 15 mg per person, or only about 0.25%
of the average intake from food (USEPA, 1988).

47
Fluoride
Sources
Fluoride is a fairly common element, representing about 0.3g/kg of the earth‘s crust. It
exists in the form of fluorides in a number of minerals, of which fluorspar, cryolite,
and Fluorapatite of the commonest; many rocks contain fluoride minerals. Fluorides
are used industrially in the production of aluminium and are commonly present in
phosphate fertilizers, bricks, tiles and ceramics; they are also used in metallurgy.
Fluorides are now frequently added to certain pharmaceutical product, including
toothpastes and vitamin supplements. Owing to industrial activity, involving the use of
so many fluorine-containing substances, fluoride contamination of the environment is
ubiquitous. Thus, plants, foodstuffs, and water all contain traces of fluoride.
Occurrence in water
Traces of fluoride occur in many waters and higher concentrations are often associated
with underground sources. In areas that are rich in fluoride-containing minerals, e.g.,
Fluorapatite, well waters may contain up to about 10mg of fluoride per litre or even
more. The highest natural level reported is 2800 mg/l. Most waters contain below 1
mg of fluoride per litre. Occasionally, fluorides may enter a river as a result of
industrial discharges.
Routes of exposure
Drinking water
The levels of fluoride in tap water are very similar to those found in the source water,
except where fluoridation of the supply in practiced in general. Unfluoridated supplies
contain less than 1 mg of fluoride per litre. But, depending on the type and situation of
the source, may very occasionally contain up to 10 mg/l. In most parts of the world
such sources have by now been identified. Where fluoridation of water supplies is
practiced, fluoride concentration is normally within the range 0.6-1.7 mg/l. ambient air
temperature usually being the deciding factor. With a consumption of 2 litres of water
48
per day, between 1.2 and 3.4 mg of fluoride per day could thus be ingested from
drinking water in those areas where fluoridation is practiced. Elsewhere, the daily
exposure will range from a fraction of a milligram to perhaps 20 mg in very
exceptional circumstances.
Metabolism-
Fluoride ingested with water is almost completely absorbed. Fluoride in the diet is not
as fully absorbed as from water but the absorption is still rather high, although in the
case of certain foods only about 25% of the fluorides may be absorbed. Absorbed
Fluoride is distributed rapidly throughout the body. It is retained mainly in the
skeleton and a small proportion is retained in the teeth. The amount of fluoride in bone
increases upto the age of 55 years. At high doses fluoride can interfere with
carbohydrate, lipid, protein, vitamin, enzyme and mineral metabolism. Many of the
symptoms of acute fluoride intoxication are the results of its binding effects with
calcium. Fluoride is excreted primarily in the urine. The excretion is influenced by a
number of factors, including the general health of the person and his previous history
of fluoride exposure, the rate of retention decreases with age and most adults can be
regarded for practical purposes as ―in balance‖. Under this ―steady state‖ condition,
the fluoride present in the body is sequestered in calcified tissues; most of the
remainder is present in plasma and thus available for excretion. Skeletal sequestration
and renal excretion are the two major ways by which the body prevents the
accumulation of toxic amounts of the fluoride iron.
Health effects
Once fluoride is incorporate into teeth, it reduces the solubility of the enamel under
acidic condition and their by protection against dental caries. There is good evidence
to show that the presence of fluoride in water results in a substantial reduction of
dental caries in both children and adults. The incidence of caries decreases as the
concentration of fluoride increases to about 1 mg/l. long term consumption of water
containing 1 mg of fluoride per litre may lead to mottling in patients with long
standing renal disease skeletal fluorosis has been observed in persons when water

49
contains more than 3-6 mg of fluoride per litre depending on intake from other
sources. Intakes of 20-40 mg of fluoride per day over long periods have resulted in
crippling skeletal fluorosis. It has been accepted that 1 mg per litre is a safe level in
relation to the fluoridation of water supplies, and the recommended control limits in
water are around this figure, the exact concentrations depending on the air
temperature.
Chronic ingestion of concentrations much greater than 1.5 mg/l (the WHO guide line
value) is linked with development of dental fluorosis and in extreme cases, skeletal
fluorosis. High doses have also been linked to cancer. Health impacts from long-term
use of fluoride-bearing water have been summarized as:
<0.5 mg/l: dental caries
0.5-1.5 mg/l promotes dental health
1.5-4 mg/l: dental fluorosis
>4 mg/l: dental, skeletal fluorosis
>10 mg/l: crippling fluorosis (Dissanayake, 1991)
Dental fluorosis is by far the most common manifestation of chronic use of high-
fluoride water. As it has greatest impact on growing teeth, children under age 7 are
particularly vulnerable. However, it is important to note that additional factors such as
nutrition are also important in determining the course of disease (Teotia, et al., 1981)
Calcium and vitamin C deficiency are recognized as important exacerbating factors.
Food is an additional source of fluoride.
In high doses, fluoride is acutely toxic to man. Pathological changes include
haemorrhagic gastroenteritis, acute toxic nephritis and various degrees of injury to the
liver and heart muscle. The acute lethal dose is about 5 g as sodium fluoride. In
animals a variety of severe symptoms have been observed as a result of environmental
exposure to fluoride in highly contaminated areas. Chronic effects from high exposure
in man are primarily related to mottling of teeth and fluorosis in which bone structure
is affected.

50
Silica
General description
Silicon is the most abundant element in the earth after oxygen. The term silica refers
to silicon in natural waters, where it is usually represented as H4SiO4 or Si (OH)4 and
silicic acid. Since it is included as a non-ionic species.
Occurrence
Despite it‘s over abundance in nature, it occurs in major quantities in water. This is
due to silica sources being resistant to chemical weathering processes. The solubility
of silica has been found to be more at high pH of high temperature. The concentration
of silica in natural waters is usually between 1 to 3o mg/l. but may reach as high as
100 mg/l. in hot springs.
Silica finds widespread application in glass making, silicates. Abrasives, ceramics,
metal works and petroleum products and hence it may come in the wastewater from
these industries.
Effects
Use of water containing excess silica may form ‗glassy scales‘ in boilers. Silica
concentration is also very important in regulation of growth of diatoms (a kind of
algae with siliceous values.) in fresh and marine waters.
Hardness
General description
Hardness is the property of water which prevents the lather formation with soap and
increases the boiling point of water. Principal cations imparting hardness are calcium
and magnesium however other cations such as strontium, iron and manganese also
contribute to the hardness. The anions responsible for hardness are mainly
bicarbonate, carbonate, sulphate, chloride, nitrate and silicates etc. hardness is called
temporary if it is caused by bicarbonate and carbonate salts of the cations since it can

51
be removed simply by boiling the water. Permanent hardness is caused mainly by
sulphates and chlorides of the metals.
Hardness of water is very important in industrial uses, because it forms scale in heat
exchange equipment, boilers, and pipe lines. Some hardness is needed in plumbing
system to prevent corrosion of pipes (WHO, 2003).
Kannan (1991) classified water on the basis of hardness values in the following
manner.
1) 0 to 60 mg/l ___
soft
2) 61 to 120 mg/l ___
moderately hard.
3) 121 to 160 mg/l ___
hard.
4) Above 160 mg/l ___
very hard.
Sources
Calcium and magnesium are common elements present in many minerals. Among the
commonest sources of calcium and magnesium in water are limestones, including
chalk (calcium carbonate). Calcium and magnesium are present in a great number of
industrial products and they are common constituents of food. A minor contribution to
the total hardness of water is made by such polyvalent ions as zinc, manganese,
aluminium, strontium, barium and iron, dissolved from minerals such as bauxite,
armangite and sphalerite.
Occurrence in water
Although most calcium compound are not easily soluble in pure water, the presence of
carbon dioxide readily increases their solubility and sources of water containing up to
100 mg of calcium per litre are fairly common. Sources containing over 200 mg of
calcium per litre are rare. Many salts containing magnesium are easily soluble and
water sources containing levels of magnesium at concentrations up to 10 mg/litre are

52
common. Water sources rarely contain more than 100 mg/litre and calcium hardness
usually predominates. Thus such anions as hydroxide, bicarbonate and carbonate have
a significant influence and so to a lesser degree do phosphate and silicate; molecular
species of weak acids also contribute.
Health aspects
Hardness has no known adverse effect on health; however some evidence has been
given to indicate its role in heart disease (Peter, 1974). The hard water is also not
suitable for domestic use in washing, cleaning and laundering. The hardness may be
advantageous in certain conditions. It prevents the corrosion in the pipes by forming a
thin layer of scale and reduces the entry of heavy metals from the pipes to the water.
There is some suggestive evidence that drinking extremely hard water might lead to an
increased incidence of urolithiasis. A number of studies in various parts of the world
have demonstrated that there is a highly statistically significant negative association
between water hardness and cardiovascular disease. The results of several studies have
suggested that a variety of other diseases are correlated with the hardness of water.
These include certain nervous system defects, anencephaly, perinatal mortality and
various types of cancer.
Calcium (Ca)
Calcium is one of the most abundant substances of the natural waters. Being present in
high quantities in the rocks, it is leached from there to contaminate the water. The
quantities in natural waters generally vary from 10 to 100 mg/l depending upon the
types of the rocks. Disposal of sewage and industrial wastes are also important sources
of calcium. It has got a high affinity to absorb on the soil particles; therefore, the
cation exchange equilibria and presence of other cations greatly influence its
concentration in waters. Natural softening of the water takes place when water
percolates to aquifers due to the exchange by sodium ions. Concentration of the
calcium is reduced at higher pH due to its precipitation as CaCO3.

53
Calcium is the fifth most abundant natural element. It enters the fresh system through
the weathering of rocks, especially lime stone, and from the soil through seepage,
leaching and runoff. The average concentration of calcium in soil is about 1.37 104
mg/kg (Klein, D. H., 1975). The leaching of calcium from soil has been found to
increase significantly with the acidity of rain water (Overrein, L. N., 1972).
Effects on human health
Calcium is one of the important nutrients required by the organisms. Concentrations
upto 1800 mg/l have been found not to impair any physiological reaction in man (Lehr
et.al, 1980). Calcium phosphate is a supporting substance, and it causes bone tooth
growth, together with vitamin D. calcium is also present in muscle tissue and in the
blood. It is required for cell membrane development and cell division, and it is
partially responsible for muscle contractions and blood clotting. Calcium regulates
membrane activity, it assists nerve impulse transfer and hormone release, stabilizes the
pH of the body, and is an essential part of conception. In order to stimulate these body
functions a daily intake of about 1000mg of calcium is recommended for adults
(Rubenowitz, E., 1999). This may be achieved by daily consuming dairy, grains and
green vegetables. Calcium carbonate works as a stomach acid remedy and may be
applied to resolve digestive failure. Calcium lactate may aid the body during periods
of calcium deficiency, and calcium chloride is a diuretic.
High concentration of calcium is not desirable in washing, laundering and bathing
owing to its suppression of formation of lather with soap. Scale formation in boilers
takes place by high calcium along with magnesium. It coagulates with soap and makes
dirty layers on sinks, tubes etc. Small concentrations of calcium are beneficial in
reducing the corrosion in the pipes due to the formation of a thin layer of scale. It has
also been found to antagonize the toxicity of various substances such as lead, zinc,
aluminium and toxic solutions of sodium, magnesium and potassium chloride.

54
Magnesium (Mg)
Sources
Magnesium occurs in all kinds of natural waters with calcium, but its concentration
remains generally lower than calcium. The principal sources in the natural waters are
various kinds of rocks. Sewage and industrial wastes are also important contributors of
magnesium. The concentration of magnesium depends upon exchange equilibria and
presence of the ions like sodium. A large number of mineral contains magnesium, for
example dolomite (calcium magnesium carbonate; CaMg (CO3)2) and magnesite
(magnesium carbonate; MgCO3). Magnesium is washed from rocks and subsequently
ends up in water. Magnesium has many different purposes and consequently may end
up in water in many different ways. Chemical industries add magnesium to plastics
and other materials as a fire protection measure or as filler. It also ends up in the
environment from fertilizer application and from cattle feed. Magnesium sulphate is
applied in beer breweries, and magnesium hydroxide is applied as a flocculant in
waste water treatment plants. Magnesium is also a mild laxative (Karppanen, H.,
1981). Natural softening of water occurs during percolation through soil by exchange
with sodium ions.
Health aspects
Magnesium is supposed to be non toxic at the concentrations generally mate with in
natural waters. High concentration combined with sulphate acts as laxative to human
beings. Concentrations as high as 500 mg/l impart an unpleasent taste to the water thus
rendering it unpalatable. Magnesium adds to the hardness of the water and with
calcium poses the problem of scale formation in the boilers.
The human body contains about 25g of magnesium, of which 60% is present in the
bones and 40% is present in muscles and other tissues. It is a dietary mineral for
humans, one of the micro elements that are responsible for membrane function, nerve
stimulant transmission, muscle contraction, protein construction and DNA replication
(Dyckner, 1982). Magnesium is an ingredient of many enzymes. Magnesium and

55
calcium often perform the same functions within the human body and are generally
antagonistic.
There are no known cases of magnesium poisoning. At large oral doses magnesium
may cause vomiting and diarrhea. High doses of magnesium in medicine and food
supplements may cause muscle slackening, nerve problems, depressions and
personality changes (Galan, et al., 2002). As was mentioned before, it is unusual to
introduce legal limits for magnesium in drinking water, because there is no scientific
evidence of magnesium toxicity. In other compounds, for example asbestos,
magnesium may be harmful (Chipperfield, 1978)
Sodium (Na)
Sodium is a highly soluble chemical element with the symbol ―Na.‖ It is also one of
the important cations occurring naturally. In water, sodium has no smell but it can be
tasted by most people at concentrations of 200 milligrams per litre (mg/l) or more.
High concentrations of sodium in ground water occur naturally in some areas. An
increase in sodium in groundwater above ambient or natural levels may indicate
pollution from point or non-point sources or salt water intrusion (Schofield, 1985).The
concentration in natural freshwaters is generally lower than the calcium and
magnesium. In natural waters, the major source of sodium is weathering of various
rocks. Many industrial wastes and domestic sewage are rich in sodium and increase its
concentration in natural waters after disposal.
Sodium salts are highly soluble in water and unlike calcium and magnesium there are
no precipitating reaction to reduce its concentrations. Sodium has a tendency to get
absorbed on the clay particles but may effectively be exchanged by calcium and
magnesium. During natural softening of water, sodium is exchanged by Ca++
and
Mg++
thus gets increased in concentration in some ground waters.
56
Sources
All groundwater contains some sodium because most rocks and soil contain sodium
compounds from which sodium is easily dissolved (Kesteloot, et al., 1988). The most
common sources of elevated sodium levels in groundwater are:
• Erosion of salt deposits and sodium bearing rock minerals.
• Naturally occuring brackish water of some aquifers.
• Salt water intrusion into wells in coastal areas.
• Infiltration of surface water contaminated by road salt.
• Irrigation and precipitation leaching through soils high in sodium.
• Groundwater pollution by sewage effluent.
• Infiltration of leachate from landfills of industrial sites.
Environmental Health effects
At lower concentrations there are no adverse effects on the health. According to
national academy of sciences, the higher concentrations of sodium can lead to
cardiovascular diseases and in women toxemia associated with pregnancy. Sodium
may be of concern in the persons having abnormal sodium metabolisms. Besides, high
concentration of sodium associated with chlorides and suphates make the water salty
and renders it unpotable.
Sodium concentration in the irrigation water and soil solution is of considerable
interest. Use of irrigation water containing a high proportion of sodium as compared to
other cations will increase the exchangeable sodium content of the soil. This affects
soil permeability and texture and leads to puddling and reduced rate of water intake.
Such soils become hard to plough and unsuitable for agricultural crop production.
Sodium is a principle chemical in bodily fluids, and it is not considered harmful at
normal levels of intake from combined food and drinking water sources. However

57
increased intake from may be problematic for people with hypertension, heart disease
or kidney problems that require them to follow a low sodium diet (Haring, et al., 1981)
Iron (Fe)
Iron is one of the most abundant elements of the rocks and soil, ranking fourth by
weight. All kinds of waters including ground water have appreciable quantities of iron.
Iron has more solubility at acidic pH, therefore large quantities of iron are leached out
from the soil by acidic waters (e.g. acid mine drainage)
General description
Iron is the fourth most abundant element by weight in the earth‘s crust. In water it
occurs mainly in the divalent and trivalent (ferrous and ferric) states. Both casts iron
and steel pipes are employed for drinking water distribution to the consumer. In the
production of potable water, various salts of iron are used as coagulating agents.
Occurrence
Iron in surface water is generally present in the ferric state. The concentration of iron
in well aerated water is seldom high, but under reducing conditions, which may exist
in some groundwater, lakes or reservoirs, and in the absence of sulphide and
carbonate, high concentrations of soluble ferrous iron may be found. Concentrations of
iron greater than 1 mg/l have been reported to occur in ground water. The presence of
iron in natural waters can be attributed to the dissolutions of rocks and minerals, acid
mine drainage landfill leachates, sewage or iron related industries.
Iron is generally present at low concentrations in the atmosphere as a result of
emissions from the iron and steel industry, thermal power plants and incineration but
few data are available on levels of iron in the atmosphere.
The iron content of foods varies considerably. Cereals appear to be the main dietary
sources of this element, the iron concentration of most other natural foods being less
than 0.020 mg/g. Levels may be somewhat higher in foods fortified with iron or in

58
food cooked in iron utensils. Evidence suggests that the iron content of foodstuffs
decreases during boiling.
Environmental Impact of Iron
Iron is an essential element in human nutrition. It is a vital part of the oxygen
transport mechanism in the blood (haemoglobin) of all vertebrate and some
invertebrate animals. Ferrous Fe++
and ferric Fe+++
ions are the primary forms of
concern in the aquatic environment. Other forms may be in either organic or inorganic
wastewater streams. The ferrous form Fe++
can persist in water void of dissolved
oxygen and usually originates from groundwater or mines that are pumped or drained
(Sharma, et al., 2005). Iron is contained in a number of biologically significant
proteins like haemoglobin and cytochromes and also in many oxidations –reduction
enzymes. Estimates of the minimum daily requirement for iron vary from 7 to 14 mg
depending upon age and sex; pregnant women may require in excess of 15 mg per day
the average daily requirement is considered to be 10 mg. Iron ingestion in large
quantities results in a condition known as haemochromatosis (normal regulatory
mechanisms do not operate effectively) where in tissue damage results from iron
accumulation. Small children have been poisoned following the ingestion of large
quantities of iron tablets.
Iron has got little concern as a health hazard but is still considered as a nuisance in
excessive quantities. Iron in excess of 0.3 mg/l causes staining of clothes and utensils.
The higher concentration of iron is also not suitable for processing of food, beverages,
ice, dyeing, bleaching, and many other items. Water with higher concentration of iron
is used in preparation of tea and coffee interacts with tannins to give a black inky
appearance with a metallic taste. Coffee may even become unpalatable at
concentration of iron more than 1.0 mg/l. potatoes turn black on boiling in such type
water. Iron in higher concentration may also cause vomiting. The limits on iron in
water are based on aesthetic and taste consideration rather than its physiological
effects.

59
Total coliform bacteria
Microbiological analysis involved testing for potability of water by determining MPN
(Most Probable Number) of faecal coliforms. The microbiological examinations are
routinely conducted to ensure the safety of potable water, monitor the water quality for
recreational, industrial and agricultural uses and also to evaluate prospective water
resources for drinking purposes. The coliform bacteria group consists of several
genera of bacteria belonging to the family enterobacteriaceae. These mostly harmless
bacteria live in soil, water and the digestive system of animals. Fecal coliform
bacteria, which belong to this group, are present in large numbers in the feces and
intestinal tracts of humans and other warm-blooded animals, and can enter water
bodies from human and animal waste. If a large number of fecal coliform bacteria
(over 200 colonies/100 millimeters (ml) of water sample) are found in water, it is
possible that pathogenic (disease- or illness-causing) organisms are also present in
water. Fecal coliform by themselves are usually not pathogenic; they are indicator
organisms, which means they may indicate the presence of other pathogenic bacteria
(Anand Chetna, 2006). Pathogens are typically present in such small amounts it is
impractical monitor them directly.
The detection and estimation of these bacteria is a tedious work because of the
presence of very small numbers and complicated techniques, hence another indicator
type of bacteria are routinely monitored to indicate the presence of pathogenic
organisms in water.
Health Effects
Microbial quality of drinking water can change as it travels from the treatment plant to
the extremities of the distribution network. Microbial proliferation also depends on the
transit times, system condition, construction materials, water temperature, disinfectant
residue hydraulic conditions, physical, chemical and microbial characteristics of the
treated water. The microbiological examination of water enjoys a special status in
pollution studies as it is a direct measurement of deleterious effects of pollution on
human health. The micro-organisms in water include several harmless bacteria which
60
are also useful for various human purposes. However, contaminated water may harbour
several bacteria capable of causing diseases such as typhoid, fever, dysentery, diarrhea
and cholera. These organisms commonly called as pathogenic bacteria may be present
in water bodies contaminated by domestic sewage and other pollutants. It is however
customary and also essential to detect their presence in raw and finished drinking
water.
Swimming in waters with high levels of fecal coliform bacteria increases the chance
of developing illness (fever, nausea or stomach cramps) from pathogens entering the
body through mouth, nose, ears, or cuts in the skin. Diseases and illness that can be
contracted in water with high fecal coliform counts include typhoid fever, hepatitis,
gastroenteritis, dysentery and ear infections. Fecal coliform like other bacteria can
usually be killed by boiling water or by treating it with chlorine (Arthur, J. R.,
2000). Washing thoroughly with soap after contact with contaminated water can
also help prevent infections.
Connection between Water and Agriculture-
In the world of water resource management, the industry of agricultural sector is
always noted for the potential problems such as faecal contamination which can lead
to microbial contamination of drinking waters. However a growing concern is also the
use of pesticides. Agriculture is a major user of pesticides. Detailed data on
agricultural pesticide use is available from a variety of sources including the National
Agricultural Statistics Service (NASS), Agricultural Chemical Use data base and the
National Center for Food and Agricultural Policy‘s (NCFAP), National pesticide use
database(CSE,1999). On a national scale, pesticide applications clearly associated
with intensive agriculture. In 1992, the heaviest applications by pounds of pesticides
applied to major agricultural crops occurred in the north-central Mississippi River
Basin and in the south east.
Concentrations of herbicides and insecticides in agricultural streams and in most rivers
in agricultural regions were highest in those areas of the nation with the greatest
agricultural pesticides-herbicides-insecticides use. In most agricultural areas the

61
highest levels of pesticides occur as seasonal pulses usually during spring and
summer-lasting from a few weeks to several months during the following high use
periods. Total pesticide concentrations in streams draining urban areas are generally
lower than in agricultural areas but seasonal pulses last longer and the concentrations
are more dominated by insecticides. Insecticide concentrations were highest in urban
streams. Erosion caused by agriculture is also a major concern for management of
water sources.
Erosion by both water and wind can be severe when bare land is exposed and
unprotected by vegetation. This is particularly true on steep slopes where run-off water
can concentrate and flow straight downhill. All land disturbing activities can cause
erosion problems including forest management, construction, urban areas, highways
and surface mining. Agricultural erosion is major sediment source because of the large
area involved and the repeated land-disturbing effects of cultivation and grazing.
Researchers estimate that sediments carried to the oceans by the world‘s rivers
increased from 10 billion tons per year before the introduction of intensive agriculture
25-50 billion tons per year thereafter. Of the 75 billion tons of soil eroded worldwide
each year, about 2/3 are believed to come from agricultural land.
The physical parameters of water qualities are turbidity, taste or odour to name a few.
But one needs to also take into consideration the nature of physical parameters of the
ecosystems surrounding a water source also understand the physical appearance of
later finished water. One of the best barometers of water is its actual temperature in its
natural ecosystems. Temperature affects sediments and microbial growth among other
source water characteristics.
Most warm surface water is due to the sun, so waterways with dark colored water or
those with dark muddy bottoms absorb heat more. Deep waters usually are colder
than shallow waters simply because they require more time to warm up. Trees
overhanging a lake, shore or riverbank shade the water from sunlight. Some narrow
creeks and streams are almost completely covered with over hanging vegetation
during certain times of the year. The shade prevents water temperature from rising too

62
fast on bright sunny days. Lakes and rivers in cold climates are naturally colder than
those in warm climates. The temperature of waterways varies with seasons. Some
lakes and rivers are fed by cold mountain streams or underground springs. Others are
supplied by rain and surface run off. The temperature of water flowing into a lake,
river or stream helps to determine its temperature. The more volume of water takes to
heat up or cool down. When people dump heated effluents into waterways, the
effluents raise the temperature of the water.
All sorts of physiological changes take place in aquatic organisms when water
temperature changes. The American Public Health Association (APHA) defines
turbidity as ―the optical property of a water sample that causes light to be scattered and
observed rather than transmitted in straight lines through the sample.‖ Lights ability to
pass through water depends on how much suspended material is present. Turbidity
may be caused when light is blocked by large amounts of silt, micro- organisms, plant
fibers, sawdust, wood ashes, chemicals and coal dust. Any substance that makes water
cloudy will cause turbidity. The most frequent causes of turbidity in lakes and rivers
are plankton and soil erosion from logging, mining and dredging operations. Most tap
and well water are not safe for drinking due to heavy industrial and environmental
pollution. Toxic bacteria, chemicals and heavy metals routinely penetrate and pollute
our natural water sources making people sick while exposing them to long term health
consequences such as liver damage, cancer and other serious conditions. We have
reached the point where all sources of our drinking water, including municipal water system, wells, lakes, rivers and even glaciers, contain some levels of contamination.
Even some brands of bottled water have been found to contain high levels of
contaminants in addition to plastics chemical leaching from the bottle.
As rainwater falls through the atmosphere, it collects oxygen gas. This dissolved
oxygen is not the same as the oxygen in the water molecule. Dissolved oxygen is
present in all rain waters and surface supplies due to contact with the atmosphere.
How much dissolved oxygen a water supply will contain? It depends on several
factors.

63
- Under high pressure relatively large quantities of oxygen dissolve in water. When the
pressure is reduced a proportionate weight of the gas escapes from water.
- The amount of minerals in water affects its ability to dissolve oxygen. Distilled water
can absorb more oxygen than well waters with higher mineral content. Obviously sea
water for this some reason holds less dissolved oxygen than fresh water.
Well water usually contain smaller amount of dissolved oxygen than surface supplies.
In deep wells there may be a total absence of the gas. However an article in Science
Magazine, June 11, 1982, states contrary to the prevailing nation that oxygen depleting
reactions in the soil zone and in the aquifer rapidly reduce the dissolved oxygen
content of recharge water to detection limits, 2 to 8 milligrams per liter of dissolved
oxygen is present in water from a variety of deep (100 to 1000 meters) aquifers. Most
of the water samples are several thousand to more than 10,000 years old and some are
80 kilometers from their point of recharge.
We are all familiar with the ―flat‖ taste which water often possesses after it has been
standing in an open container for some time. The taste can be improved simply by
shaking the water in a partially filled bottle. The reintroduced oxygen into the water
will give it a more appealing taste. Despite this desirable feature, dissolved oxygen can
be a source of serious trouble in a household water supply. The fact is that oxygen
causes corrosion. In cold water oxygen normally has little corrosive effect. In contrast
when the water is heated, the oxygen can cause serious corrosion problems.
Most natural water supplies are safer to drink from the stand point inorganic chemical
contaminants. However even though found more rarely and in much smaller quantities
certain inorganic ions can be toxic. These contaminants are listed along with their
maximum allowable levels summary which also includes maximum levels for
radiological ionic contaminants, maximum levels for water turbidity (cloudiness) and
maximum levels for caliform bacteria (which indicates the presence of human or
animal faecal contamination). Turbidity and bacteria are examples of suspended water
contaminants.

64
The suspended particles clouding the water may be due to such inorganic substances
as clay, rock flour, silt, calcium carbonate, silica, iron, manganese, sulphur or
industrial wastes. Again the clouding may be caused by organic substances such as
various micro-organisms, finely divided vegetable or animal matter, grease, fat, oil
and others. Some rivers and streams have water that appears crystal clear with just
trace amounts of turbidity especially at points near their sources. These same moving
waters may contain upwards of 30,000 ppm of turbidity at other points in their course
to the oceans. There are significant fluctuations in the amount of turbidity in a river at
different times in a year.
Heavy rain falls, strong winds and convection currents can greatly increase the turbid
state of both lakes and river. Warm weather and increase in the temperature can also
add to the problem. For with warmer weather micro-organisms and aquatic plants
renew their activity in the water. As they grow and latter decay these plants and
animal forms substantially add to the turbid state of a water. Also they frequently
cause an increase in odour and color problems. Water does reflect blue green light
noticeable in great depth, it should appear colorless as used in home. Infinitely small
microscopic particles add color to the water. Colloidal suspensions and non-colloidal
organic acids as well as neutral salts also affect the color of water. The color in water
is primarily of vegetable origin and is extracted from leaves and aquatic plants. The
bleaching action of sunlight plus the ageing of water gradually dissipates this color
however. All surface water posses some degree of color .Water from deep wells is
practically colourless.
Water of good quality is of basic importance to human physiology and man‘s
continued existence depends very much on its availability (FAO, 1997; Lamikanra,
1999.) The provision of potable water to the rural and urban population is necessary to
health hazards (Nikoladze, 1989; Lemo.2002). Before water can be described as
potable, it has to comply with certain physical, chemical and micro-biological
standards which are designed to ensure that the water is palatable and safe for
drinking. Potable water is defined as water that is free from disease producing micro-

65
organisms and chemical substances deleterious to health (Ihekoronye and Ngoddy;
1985).
Water can be obtained from a number of sources among which are streams, lakes,
rivers, ponds, rain, springs and wells (Linsely, 1979; Kolade, 1982).Unfortunately
clean, pure and safe water only exists briefly in nature and is immediately polluted by
prevailing environmental factors and human activities. Water from most sources is
therefore unfit for immediate consumption without some sort of treatment (Raymond,
1992).
The consequences of water born bacteria and virus infection, polio, hepatitis, cholera,
typhoid, diarrhea, stomach cramps etc. have been well established but nitrate
contamination is just as deadly. Consequent to the realization of the potential health
hazards that may result from contaminated drinking water. Contamination of drinking
water from any source is therefore of primary importance because of the danger and
risk of water born diseases (Fapetu, 2000; Edema et. al; 2001).
The original source of any drinking water is rich in aquatic microbes, some of which
could be dangerous if they enter the human body. Accordingly the treatment of water
for drinking involves stages where microbes are removed or destroyed before the
water gets into houses. After purification the water is subjected to test by
bacteriologist to ensure the safety for human consumption (Fawole and Oso, 2001).
In many developing countries availability of water has become a critical and urgent
problem and it is a matter of great concern to families and communities depending on
non-public water supply system. Conformation with micro-biological standards is of
special interest because of the capacity of water to spread diseases within a large
population. Although the standards vary from place to place the objective anywhere is
to reduce the possibility of spreading water born diseases to the barest minimum in
addition to being pleasant to drink which implies that it must be wholesome and
palatable in all respects (Edema, 2001).
Regular physico-chemical analysis of water at source must be carried out to determine
or check the effectiveness of treatment process. This work is therefore in an attempt to

66
examine the water of Dara dam with standard table of water for conformity to micro-
biological and physico-chemical standards, for treated water samples as well as
examines the different domestic and industrial effluents/waste water, for conformity to
standards for effluent discharges.
Water-scare countries
By 2015 nearly half the world‘s population more than 3 billion people will live in
countries that are ―water-stressed‖- have less than 1,700 cubic meters of water per
capita per year – mostly in Africa ,the Middle East, South Asia, and Northern China.
In the developing world, 80% of water usage goes into agriculture, a proportion that is
not sustainable, and in 2015 a number of developing countries will be unable to
maintain their levels of irrigated agriculture. Overpumping of ground water in many of
the world‘s important grain-growing regions will be an increasing problems; about
1000 tons of water is needed to produce a ton of grain, the water table under some of
the major grain producing areas in Northern China is falling at a rate of five feet per
year, and water tables throughout India are falling an average of 3-10 feet per year.
Measures undertaken to increase water availability and to ease acute water shortage –
using water more efficiently, expanding use of desalinization, developing genetically
modified crops that used less water or more saline water, and importing water – will
not be sufficient to substantially change the outlook for water shortages in 2015. Many
will be expensive; policies to price water more realistically are not likely to be broadly
implemented within the next 15 years, and subsidizing water is politically sensitive for
the many low-income countries short of water because their populations expect cheap
water, (Graz, L., 1998).
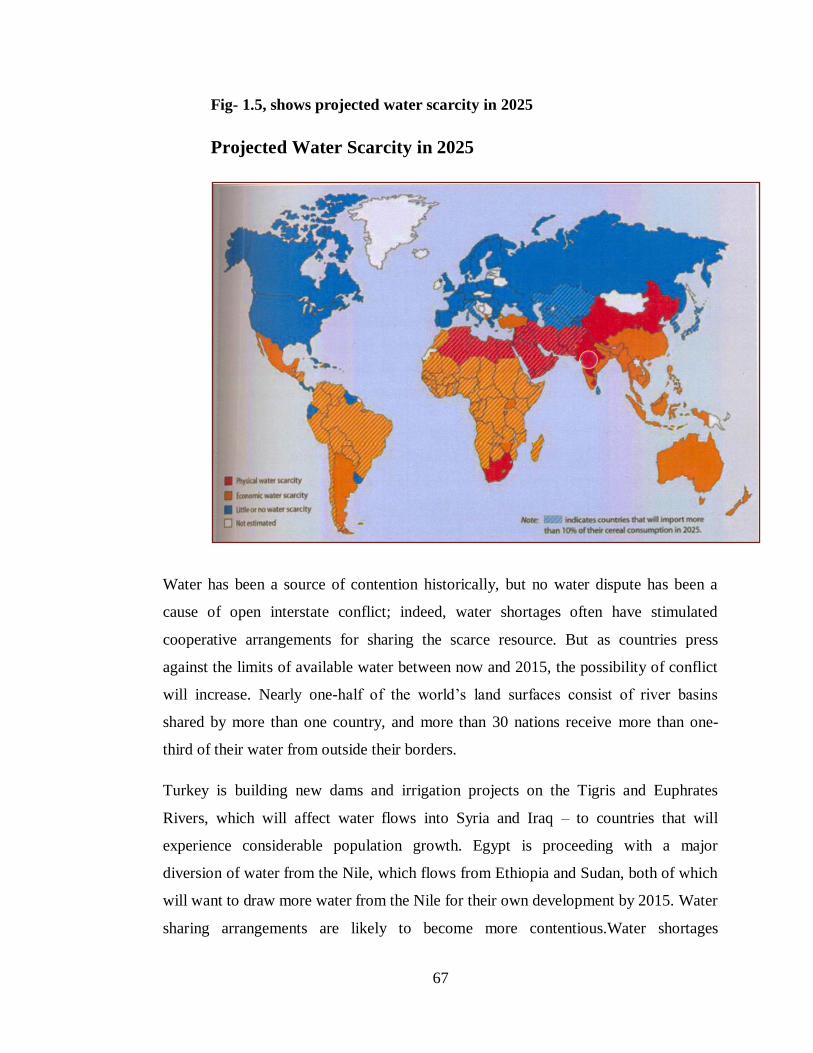
67
Fig- 1.5, shows projected water scarcity in 2025
Projected Water Scarcity in 2025
Water has been a source of contention historically, but no water dispute has been a
cause of open interstate conflict; indeed, water shortages often have stimulated
cooperative arrangements for sharing the scarce resource. But as countries press
against the limits of available water between now and 2015, the possibility of conflict
will increase. Nearly one-half of the world‘s land surfaces consist of river basins
shared by more than one country, and more than 30 nations receive more than one-
third of their water from outside their borders.
Turkey is building new dams and irrigation projects on the Tigris and Euphrates
Rivers, which will affect water flows into Syria and Iraq – to countries that will
experience considerable population growth. Egypt is proceeding with a major
diversion of water from the Nile, which flows from Ethiopia and Sudan, both of which
will want to draw more water from the Nile for their own development by 2015. Water
sharing arrangements are likely to become more contentious.Water shortages
68
occurring in combination with other sources of tension – such as in the Middle East –
will be the most worrisome.
Quantities of renewable fresh water qualified 20 nations in 1990 as water-scarce, 15 of
them with rapidly growing populations. By 2025, between 10 and 15 nations will be
added to this category. Between 1990 and 2025 the number of people living in
countries in which renewable water is scarce resource will rise from 131 million to
somewhere between 817 million under the UN‘s low projection of population growth
and 1.079 billion under the high projection. In this case, the difference between the
high and low projection – 262 million – is precisely twice the number of people living
in waters scarce countries in 1990 (Laurenson, E. M., 1987).
For several countries varying population scenarios could mark the difference between
potentially manageable water stress and outright water scarcity in 2025. In 1990 Peru,
for example, had 1,856 cubic meters of renewable water per person per year. Under
almost any conditions, that figure will plunge, but the rate of population growth could
determine whether Peru crosses into water scarcity or hovers in waters stress with
nearly 1,200 cubic per meters per person in 2025. Similar possibilities face Tanzania,
Zimbabwe and Cyprus. Sri Lanka, Mozambique and Mauritania, the population
trajectory will determine whether the threshold is crossed from relative water
abundance to stress.
Among the countries projected to fall into the water stress category before 2025 is
India (1990 annual per capita water availability: 2,464 cubic meters), currently the
second most populous country in the world with nearly 900 million people. By 2025,
India‘s population is expected to exceed 1.4 billion under the UN‘s medium
projection, and the chronic water scarcity that already plagues many regions of the
country is all but certain to intensify.
China, today‘s most populous nation (1990 annual per capita water availability: 2,427
cubic meters), only narrowly will miss the water stress benchmark in 2025, according
to all three UN projections. In that year, according to the medium scenario, each of
China‘s projected 1.5 billion citizens will have 1,818 cubic meters available. In the

69
North China Plain, however, water shortages are already acute, and demand is
expected to outstrip supply by the turn of the century (L‘vovitch, M. I., 1974).
Oil-rich Arab states—Kuwait, Qatar, Bahrain, Saudi Arabia and the United Arab
Emirates- make up five of the nine countries with the least water per capita. Every
times Saudi Arabians prospect for water, a joke runs, they strike oil. And, in fact, oil is
in some ways as close to a substitute for water as one can find, for it provides an
energy source both for desalination and the pumping of deep aquifers. Many countries
in the Middle East rely heavily on desalination and nonrenewable groundwater
supplies to augment their meager renewable fresh water supplies. And with continuing
high family size in these countries, renewable water will become increasingly scarces.
Populations in the region are currently doubling every two or three decades. It may
appear that the wealth these countries now enjoy will enable them to buy their way out
of any future water shortages. The key point, however, is those wealthy countries as
well as poor ones are now using water unsustainably. Eventually they will have to face
the consequences and place their water management on a sustainable path (Wright,
2002).
Israel and Jordan are high on the list of water-scarce nations, and their placement there
says much about the potential for continued conflict in the Jordan River valley. Israel
probably uses water more efficiently than any other country, yet its demand has
exceeded the sustainable annual yield of its available sources since the mid-1970s.
Israel strictly controls Palestinian use of water in the occupied 5,890-square-kilometer
West Bank, from which it draws 40% of its ground water and more than 25% of its
renewable water supplies. Palestinians, nothing that Jewish settlers use four times as
much water on a per capita basis, charge that deep wells dug for the settlers sap the
yields of their own shallower wells.16 Israel is projected to grow from 4.7 million
people in 1990 to about 8 million in2025.
For Jordan, whose population more than doubled from 1.5 million in 1955 to 4 million
in 1990, increasing scarcity means deteriorating water quality and growing reliance on
ground water when water tables are dropping rapidly. In the summer of 1993, water
shortages were endemic throughout Amman, the country‘s capital, despite ongoing

70
water rationing. Jordan (1990 annual per capita water availability: 327 cubic meters)
already exploits all its available water resources, and its population is projected to
double again before 2015 (Wright, 2002).
A dozen or more African nations also are struggling to balance declining per-capita
water supplies with the demands of rapidly rising populations. Of 20 African countries
that have faced food emergencies in recent years, half are either already stressed by
water shortage or are projected to fall into the stress category by 2025.18 Lacking the
financial resources and technology to improve management of scarce water or gain
access to more renewable supplies, these countries are in desperate need of
improvement in the development and management of renewable fresh water resources.
They include war torn Somalia as well as Algeria, Kenya, Malawi and Rwanda.
Certain countries currently enjoy adequate per capita renewable fresh water resources
but will encounter water scarcity by 2025. Iran, for example, had, 2,025 cubic meters a
year per capita in 1990; by 2025 the figure is projected to be between 776 and 860.
Haiti, with 1,696 cubic meters in 1990, could have anywhere from 761 to 981 per
person in 2025, depending on population growth. Libya, close to scarcity already with
1,017 cubic meters per capita in 1990, is projected to have between 329 and 377 cubic
meters in 2025 (Wright, 2002).
Water requirements of India
Traditionally, India has been an agriculture-based economy. Hence, development of
irrigation to increase agricultural production for making the country self-sustained and
for poverty alleviation has been of crucial importance for the planners. Accordingly,
the irrigation sector was assigned a very high priority in the 5-year plans. Giant
schemes like the Bhakra Nangal, Hirakud, Damodar valley, nagarjunasagar, Rajasthan
Canal project, etc. were taken up to increase irrigation potential and maximize
agricultural production. Long-term planning has to account for the growth of
population. According to national Water Policy 1, the production of food grains has
increased from around 50 million tonnes in the fifties to about 203 million tonnes in
the year 1999-2000. A number of individuals and agencies have estimated the likely
71
population of India by the year 2025, and 2050. According to the estimates adopted by
World Bank 2005, by the year 2025, the population is expected to be 1333 million in
high-growth scenario and 1286 million in low growth scenario. For the year 2050,
high rate of population growth is likely to result in about 1581 million people while
the low growth projections place the number at nearly 1346 million. Keeping in view
the level of consumption, losses in storage and transport, seed requirement, and buffer
stock, the projected food-grain and feed demand for 2025 would be 320 million tonnes
(High-demand scenario) and 308 million tonnes (low-demand scenario). The
requirement of food grains for the year 2050 would be 494 million tonnes (High-
demand scenario) and 420 million tonnes (low-demand scenario). Table- 1.5 provides
details of the population of India and per capita water availability as well as utilizable
surface water for some of the years from 1951 to 2050 (projected). The availability of
water in India shows wide spatial and temporal variations. Also, there are very large
inter annual variations. Hence, the general situation of availability of per capita
availability is much more alarming than what is depicted by the average figures.

72
Table 1.5
Per capita per year availability and utilizable surface water in India (Im3)
Sr.no Year Population (in millions) Per-capita surface water availability Per-capita utilizable surface water
1 1951 361 5410 1911
2 1955 395 4944 1746
3 1991 846 2309 816
4 2001 1027 1902 672
5 2025 (Projected) a. 1286 (low growth) 1519 495
b. 1333 (high growth) 1465
6 2050 (Projected) a. 1346 (low growth) 1451 421
b. 1581 (high growth) 1235
Total annual requirement of water for various sectors has been estimated and its break
up is given Table 1.6.

73
Table-1.6 Annual water requirement for different uses (in Km3)
Year 2010 Year 2025 Year 2050
Use Year 1997-98 Low High % Low High % Low High %
Surface water
Irrigation 318 330 339 48 325 366 45 375 463 39
Domestic 17 23 24 3 30 36 5 48 65 6
Industries 21 26 26 4 47 47 6 57 57 5
Power 7 14 15 2 25 26 3 50 56 5
Inland navigation 7 7 1 10 10 1 15 15 1
Environment- Ecology 5 5 1 10 10 1 20 20 2
Evaporation losses 36 42 42 6 50 50 6 76 76 6
Total 399 447 458 65 497 545 65 641 752 64
Ground water
Irrigation 206 213 218 31 236 245 29 253 344 29
Domestic 13 19 19 2 25 26 3 42 46 4
Industries 9 11 11 1 20 20 2 24 24 2
Power 2 4 4 1 6 7 1 13 14 1
Total 230 247 252 35 287 298 35 332 428 36
Grand total 629 694 710 100 784 843 100 973 1180 100
Total water use
Irrigation 554 543 557 78 561 611 72 628 807 68
Domestic 30 42 43 6 55 62 7 90 111 9
Industries 30 37 37 5 67 67 8 81 81 7
Power 9 18 19 3 31 33 4 63 70 6
Inland navigation 0 7 7 1 10 10 1 15 15 1
Environment – Ecology 0 5 5 1 10 10 1 20 20 2
Evaporation losses 36 42 42 6 50 50 6 76 76 7
Total 629 694 710 100 784 843 100 973 1180 100
Above table shows that the requirement is increasing day by day with increase in
the population but the overall available water in decreasing. Further more
unplanned industrialization and urbanization have increase the pressure on the
water resources both surface and ground. These lead to pollution of the water
bodies in India.

74
Maharashtra’s Water Crisis (PACS Programme 2001-2007)
Although Maharashtra is one of India‘s most developed states, a large part of its
population suffers severe and chronic water scarcity. The problem is not generally
experienced or even realized in upper middle class enclaves of cities like Mumbai
and Pune. However, as you move away from these privileged areas, women walking
or standing in queue to collect water is a familiar sight across the state.
In nearly 70% of the state‘s villages (around 27,600 villages), water is either not
available within 500 metres or is not available 15 metres below the ground. Or it is
not potable (World Bank, Promoting Agricultural Growth in Maharashtra, Volume
1, 2003, henceforth WB-AGM).
Around a fourth of the state‘s rural households do not have secure access to drinking
water (NSSO 1999), and nearly half the rural households in the state do not get safe
drinking water (Human Development Report Maharashtra 2002).
Household surveys for World Bank projects indicate that average time spent in
collecting water by rural households in Maharashtra is two hours a day; using
‗opportunity cost‘ principles that translates to Rs 12 per household per day. During
summer, the time and cost increases as sources dry up. Every year the state
government spends around Rs 100 crore on supplying water on an emergency basis
to severely water-starved villages.
The water problem causes enormous daily hardship to women and, coupled with
poor sanitation facilities, leads to three kinds of health problems: ‗water wash‘
ailments like conjunctivitis, caused by contact with poor quality water; diseases like
dengue caused by water stagnation; and waterborne diseases like diarrhoea, which is
the leading cause of infant deaths. While India‘s Millennium Development Goal
Infant Mortality Rate (IMR) target is 28 per 1,000 by the year 2015, in many
districts of Maharashtra such as Nashik, Jalna, Yavatmal, Buldhana, Chandrapur and
Gadchiroli, the IMR is above 75 per 1,000.

75
Shortage of water directly impacts livelihoods. Although Maharashtra is among
India‘s most urbanized states, around 60% of its population still lives in rural areas.
Even this figure is misleading, for urbanization is heavily skewed towards the
Mumbai region. In western Maharashtra and Vidarbha, around three-fourths of the
population lives in rural areas; in Marathwada, 85% of the population is rural.
Hence, agriculture remains the main source of livelihood in the state. While it
accounts for roughly 55% of overall employment in the state, in rural areas, 80% of
the population is dependent on agriculture, either as cultivators (42%) or labourers
(38%).
There can be no agriculture without water, and adequate access to this resource has
been crippled by various factors in Maharashtra.
Limited irrigation potential
Rainfall in Maharashtra is uneven. While the Sahyadris (Western Ghats) and Konkan
receive heavy rainfall (around 2,000 mm), most of this water, which accounts for
nearly half the total water available in the state, flows into the Arabian Sea; only 5%
of it is used. To the east of the Sahyadris, the rainfall drops drastically to 600 or even
500 mm; it then increases as one moves towards Vidarbha, where rainfall of around
1,400 mm is reported.
Due to this uneven rainfall pattern and geological conditions, the First Irrigation
Commission of Maharashtra, constituted in 1962, estimated that only 30% of the
state‘s total cultivable area can be brought under surface and groundwater irrigation.
Until recent years, successive governments have been lethargic in working towards
realizing even this potential. The percentage of gross irrigated area to gross cropped
area in Maharashtra in 2002-03 was only 16.4, substantially lower than the all-India
ratio of 38.7. The percentage was about the same a decade earlier.
76
Poor surface irrigation
The Maharashtra Water and Irrigation Commission constituted by the Government
of Maharashtra (GOM) in 1995 estimated that out of the state‘s total cultivable land
area of 22.54 million hectares, 8.5 million hectares can be brought under surface
irrigation.
However, at an aggregate investment of Rs 269 trillion since 1950, at current prices
(WB-AGM), the area brought under surface irrigation in Maharashtra is only 3.86
million hectares. Even this achievement is an exaggeration. Only 1.23 million
hectares, or around a third of the potential created, is actually irrigated by canals;
another 0.44 million hectares was irrigated by wells in command areas of irrigation
projects.
Among other reasons, the GOM‘s Report on Benchmarking of Irrigation Projects in
Maharashtra 2003-04 lists the following as causes for poor realization of surface
irrigation potential:
Taking more percentage of crops that require more water like paddy and sugarcane.
Thin and scattered irrigation resulting in low efficiency.
Reduction in storage capacity due to silting.
Poor maintenance of infrastructure due to financial constraints.
Non-participation of beneficiaries.
In recent years, investments in major and medium irrigation structures (excluding
market borrowing by corporations like the Maharashtra Krishna Development
Corporation) account, on average, for about 28% of the state government‘s annual
capital expenditure. However, the investment does not and will not translate into a
proportionate increase in area covered by surface irrigation. There are three main
reasons for this.

77
Firstly, its record of executing irrigation works on time is poor. The GOM‘s
financial position is poor; the situation demands close monitoring of ongoing works
rather than heavy new investments. However, for political reasons, the emphasis is
on inaugurating new projects rather than completing ongoing ones. As a result, funds
are thinly spread and delays are inevitable.
The 2001-02 Comptroller and Auditor General of India (CAG) civil audit report for
Maharashtra noted that, as of March 31, 2002, there were 117 incomplete irrigation
projects in the state, in which around Rs 3,250 crore was blocked. Of these projects,
six had remained incomplete for five to 10 years, two projects had remained
incomplete for 15 to 20 years, and two projects had remained incomplete for over 20
years! The total amount blocked in projects delayed by over five years was around
Rs 140 crore. In the case of 15 projects, involving around Rs 190 crore, details were
not even made available.
CAG civil audit reports listed several bizarre states of incompletion, such as dams
without canals, canals without dams, and dams incomplete even after actual
expenditure incurred was 10 times the estimated expenditure. The worst part was
that in 14 major, 24 medium, and 67 minor irrigation projects work had been
abandoned after an expenditure of around Rs 27 billion, simply because the projects
had become unviable due to cost escalation -- the only people to gain from this
criminal waste of public money were the contractors.
Secondly, irrigation projects are not often designed to extract maximum irrigation
returns. Apart from sheer incompetence at the planning stage, lobbying can play a
big negative role. A classic example is the Jayakwadi project in Phaltan, which is
often considered the pride of Maharashtra. There is no village by that name near the
dam. The project gets its name because it was originally supposed to be located at a
village called Jaykuchiwadi in Majalgaon taluka of Beed. The location to which it
has been shifted is remarkably unsuitable for a dam -- the terrain is flat. As a result,
the dam spans an extraordinary distance of over 10 km; its height above the ground
is just 40 feet. The length of the Majalgaon right bank canal had to be reduced from

78
the originally estimated 148 km to 84 km. Accordingly, the potential area to be
brought under irrigation was reduced by half.
Thirdly, irrigation projects are meeting rising demand for water from residential and
industrial sectors. In most of the major and medium irrigation projects, water
reserved for domestic and industrial use varies from between 15% and 25%. In years
of poor rainfall, this goes up to 50%. In 2003-04, out of the total water made
available from irrigation projects, 31% was used for non-irrigation purposes -- to
meet drinking water demand in cities and the needs of industries.
Significantly, while agriculture is directly related to life and livelihood of the
majority of the state‘s population, allocation of water resources to agriculture is
accorded third priority in the GOM‘s Maharashtra State Water Policy (2003), PACS
Programme (2001-2007), below the allocation for industrial and commercial use.
This prioritization calls into question the sense of using the term ‗irrigation‘ in
connection with these projects. It also reflects the government‘s interest in
strengthening the agriculture sector vis-à-vis the industrial sector.
The spectre of drought
Due to inherent geographical factors, aggravated by skewed irrigation policies, about
84% of the total cultivated area in Maharashtra is directly and entirely dependent on
the monsoons. The odds are heavily stacked against many of these farmers. Around
a third of the state receives scanty and erratic rainfall and hence is drought-prone.
Three GOM committees have, at different times, estimated the number of drought-
prone talukas (tehsils) in the state and arrived at different figures, using different
criteria like quantum of rainfall, soil moisture content, and gap between two
consecutive rains.
Most recently, in July 2007, in the process of constituting a ‗dushkal mahamandal‘,
or ‗drought corporation‘, the GOM listed 166 of the state‘s 355 talukas as ‗drought-
prone‘ and hence eligible for whatever assistance the mahamandal might offer.
79
The list includes all 13 talukas of Ahmednagar, all 11 talukas of Solapur, and 13 of
the 14 talukas in Nashik. There are no talukas from Bhandara and Gondia in
Vidarbha and Thane, Raigad, Ratnagiri and Sindhudurg from Konkan in the list.
Much political heat was generated by the listing. The GOM had earlier proposed a
list of only 90 talukas. After discussions during the 2006-07 budget session of the
state assembly, the list was expanded. Ironically, the debate over the listing preceded
the constitution of the mahamandal; till September 2007, there was no
announcement about what the mahamandal would or wouldn‘t do.
The political controversy overshadows a basic fact: a contiguous region, covering
parts of western Maharashtra, much of Marathwada, and parts of Vidarbha, and
extending to southern Madhya Pradesh and Gujarat and northern Karnataka, is prone
to drought. Every year, some or the other part of this region is affected by severe
water scarcity. GOM figures for scarcity-affected villages over a 20-year period
(between 1960 and 1982) show that the number of villages affected in a year varies
from around 600 to over 14,000, out of a total of around 40,000 villages. In the
historic 1972-73 drought, nearly 30,000 villages were affected.
Further, severe drought is experienced over large parts of the state every three to four
years. Most recently, drought affected 11 districts of the state from 2000 onwards; in
2003-04, 71 talukas were declared to be affected by ‗severe drought‘ (Table 1.7).

80
Table-1.7
Severely drought-affected Talukas in Maharashtra (2003-04)
Source: GOM, Revenue and Forests Department, Revised Memorandum to the
Government of India on Drought Relief and Mitigation in Maharashtra (2003-04)
As ascertained and reported by the GOM, drought had the following impacts:
In 6,742 villages, the paisewari (estimation of crop output) was less than 50% of
the normal amount. Most of the villages were in Ahmednagar, Solapur,
Osmanabad and Beed.
District Talukas
Solapur Barshi,Karmala,Madha, Malshiras,Mangalvedha,
Mohol,Pandharpur,Uttar Solapur,
Sangola, Dakshin Solapur, Akkalkot
Sangli Jat,Kavatemahankal,Tasgaon, Miraj,
Khanapur,Atpadi, Kadegaon
Pune Baramati, Daund, Indapur, Purandar, Shirur
Satara Maan, Khatav, Khandala, Phaltan, Koregaon
Ahmednagar Sangamner,Kopargaon,Shrirampur, Akola,Pathardi,
Parner,Shrigonda,Ahmednagar,Rahata,
Jamkhed, Shevgaon, Rahuri, Nevasa,Karjat
Nashik Yevala, Sinner, Nandgaon, Chandvad, Devla,Malegaon
Beed Parli, Kaij, Ashti, Patoda, Beed, Shirur, Wadvani
Osmanabad Osmanabad,Tuljapur,Umarga, Lohara,
Kalamb,Vashi, Bhum, Paranda
Aurangabad Vaijapur, Gangapur
Latur Latur, Renapur, Ausa, Nilanga
Jalna Ambad, Ghansawangi

81
The kharif crop was estimated to be 50% of normal yields.
There was an overall drop in the states per hectare productivity of all major crop
categories. Thus, while food grain productivity was expected to be 1,058 kg per
hectare in 2002-03, it was actually 797 kg/ha.
Households above the poverty line were also affected, even people from relatively
affluent families were working in Employment Guarantee Scheme (EGS) relief
works. In November 2003, 3.50 lakh people chose to work under the EGS in the 11
affected districts. While the GOM spends Rs 650 to Rs 700 crore on the EGS in a
‗normal year‘, it expected to spend Rs 1,600 crore in 2003-04, till June 2004.
While the government deployed 238 tankers across the state in November 2002, to
supply drinking water, in November 2003 it deployed 1,616 tankers.
Till November 2003, the government had opened 400 cattle camps in drought-
affected districts to feed 3.8 lakh animals.
The GOM added that the measures it had taken did not ―reveal the endemic
vulnerability, which has been part of the landscape‖. The situation on the ground
was ―far too grim to be captured by the statistics‖.
Civil society response
It was in response to this grim situation, which has not yet been addressed by a long-term
drought mitigation policy, that a network of civil society organizations working in
Maharashtra formed a drought forum called Dushkal Hatavu Manus Jagavu (DHMJ).
While the forum‘s immediate priorities were ascertaining the multi-faced impacts of
drought, and mobilizing government relief, it also has the long-term vision of eradicating
drought. This is not an impossible dream. While what is known as meteorological drought,
characterized by low rainfall, is an unalterable reality, there is great scope for minimizing
the impact of meteorological drought.
Further, if rural poverty in Maharashtra is to be addressed, equitable and rational use of
water and appropriate agriculture practices have to become the main item on the agenda of
82
state policy.
The policy will have to include several innovative and bold measures, which can be
implemented only with true people‘s involvement. Civil society organizations (CSOs) and
networks like the DHMJ can provide the necessary bridge between people and the
government.
Uncertainty of supplies-
Timing, locations and reliability are important dimensions of the potential value of
supplies. Because of the spatial and temporal variations in the distribution of water,
national and long term annual averages of precipitation and run off are poor indicators
for practical purposes of available supplies and potential problems. Precipitation
generally declines as one move from east to west. Average annual precipitation ranges
from less than one inch in some desert areas in south-west to more than 60 inches in
parts of the south-east. Underline the regional averages are large seasonal and annual
variations that can result in droughts and floods. In the absence of flow regulation and
storage the ratio of the maximum to minimum stream flow within a year may exceed
500 to 1. Natural climatic variability results in inter annual fluctuations.
Almost any region lacking adequate storage is likely to encounter both periods when
supplies are relatively plenty full or even excessive as well as periods of shortages.
Water resource issues tend to be local or regional in nature: abundant supply in one
area is of no help to water deficit areas unless there are facilities to transport supplies
among regions. Water flows naturally within hydrologic basins and can be moved
between basins where transfer facilities have been constructed. But water is too
expensive relative to its marginal value to transport large distances out of these
existing channels in response to climate induced changes in supply or demand.
Thus large seasonal, annual, inter-annual and regional variations in precipitation and
run off expose major challenges for planners and down to earth risks for water users
and occupants of the flood plains. Human efforts to alter the hydrologic cycle date
back to ancient times. Primitive societies tried to bring rain through prayer, rain
dances, human and animal sacrifices and other rituals. Cloud seeding (dropping silver
83
iodide crystals or dry ice into selected clouds to stimulate ice crystal formation and
induce precipitation) represents today a more recent and more scientific, but still
uncertain attempt to influence rainfall. Although it is questionable whether any of
these intentional efforts have succeeded insignificantly modifying the rainfall, human
activities are inadvertently altering the climate.
Changes in land use and land cover can affect atmospheric circulation and the
movement of moisture locally. Evaporation from neighboring states which depends
land use, can be the source as much as 1/3 of the precipitation of in land areas. The
anthropogenic increase in the atmospheric concentration of carbon dioxide and other
green house gases is expected to increase the average global surface temperature. Such
a change would also affect precipitation patterns, evapotranspiration rates, the timing
and magnitude of runoff, the frequency and intensity of storms as well as the demand
for water. But the magnitude and even the nature of these impacts on the supply and
demand for water in specific regions are largely unknown.
One of the major problems confronting India and other countries is the inadequate
availability of potable water to meet the diverse needs of all living beings. Various
causative factors such as the mismanagement of watershed areas, overexploitation of
surface water, unplanned use of ground water, land based pollution and other maritime
activities leading to marine pollution have become global concern. That water is vital
to the survival of all forms of life and should be considered as scared wealth bestowed
generously on the planet has been explicitly stated in Indian scriptures.
The relationship between components of the biotic and abiotic or non-living world
forms the basis of understanding the principles of ecology. The conservation and
sustainable use of living natural resources has been recognized as the key to success of
future development programmes. The wealth of natural resources forms the basis of
the development of a society based on the principle of equity.
The exploding population growth however is showing a sign of decline; otherwise
with every newborn child per capita demand on all natural resources, which are often
finite, will continue to create a scenario of extreme scarcity and stressed ecology.
84
Currently 605 million people or nearly 15% of global population face water scarcity. It
is predicted that depending on future rates of population growth between 2.4 and 3
.2
billion people may be living in either water scarce of water stressed condition by 2025
(Population Action International Report 2000).
The water demand in India has witnessed trans-border negotiations between
Bangladesh-India (Ganga) and Pakistan-India (Indus).
Inter-state dispute originating out of water demand for agriculture- the single largest
consumer sector-has taken serious shape between Karnataka and Tamil Nadu
(Cauvery) and Punjab and Haryana in.
Lack of available fresh water for drinking and other domestic uses become worse than
it often appears because much of such demand is being met from deep aquifers that are
not being recharged by natural water cycle. Denial of access to safe drinking water
even in urban areas of India has led to a turnover of Rs. 3000 crores annually in
private sector sponsored sale of bottled drinking water. ―High rate of population
growth can only exacerbate the declining availability of renewable freshwater.‖
‗Water Resources‘ is becoming one of the most discussed topic in natural resource
management system. The World with less than three percent of water called ‗fresh‘
largely locked up in polar ice-caps and mountain glaciers are facing a great crisis in
the 21st century. The virtual reality is that only one percent of fresh water is available
and while water resource availability faces a crisis, the demand trebled between 1950-
1990. By 2025 the demand of water will exceed the available supply by more than 50
%.
The crisis in fresh water resources seems to be a worldwide phenomenon. With more
than 9 billion people in the world, meeting per capita demand with the present
infrastructure and to run the delivery system becomes critical when available resources
in the surface flowing rivers get grossly polluted, be it in India or in Poland.
Water pollution from domestic and industrial sectors have drawn international
attention; river clean-up programmes are regularly planned (Cas in Thames in U.K,
85
Danube in Europe, Ganga-Yamuna in India). Simultaneously large lake system like
Aral Sea in Central Asia or Clilika in Orissa, India, face newer crisis due to bad
management policy of the government in power. To meet the ever increasing demand
of fresh water, ground water becomes the next target. Aquifer depletion soon became
critical, be it in Beijing in China or in Calcutta in India or in USA.
In the national water policy of India, water is recognized as a source ―One and
indivisible: rainfall, river water, surface, ponds and lakes and ground water are all part
of one system‖. It is also recognized as a ―precious national asset‖.
The water resources estimated in 1993 show availability of the surface water and
replenishable ground water at 1869 billion cubic metres of which only 60 % can be put
to use; this amounts to 690 billion cubic metres from surface water and 432 billion
cubic metres from ground water. However, ‗availability remains highly uneven in both
space and time‘ varying between 100 mm rainfall in Western Rajasthan to 10,000 mm
in Cherrapunji in Meghalaya.
India receives 3 trillion cubic metre of water which is among the largest in the world
for country of comparable size (khushoo1986). Surface flow takes place through 14
major rivers (Brahmani, Brahmaputra, Cauvery, Ganga, Godavari, Indus, Krishna,
Mahanadi, Mahi, Narmada, Periar, Sabarmati, Subarnarekha and Tapi). Between these
14 rivers, 83 % of the drainage basin is shared which accounts for 85 % of the surface
flow catering to 80 % of the total population of the country. Besides there are 44
medium and 55 minor rivers. It is noteworthy that only 4 out of 14 major rivers are
perennial (Brahmaputra, Gaga, Mahanadi, and Brahmani). The ground water reserves
vary in different geographic regions of the country and show a differential abstraction
and recharging rates; of the water users, agriculture sector including for livestock
consume nearly 79.6 %, followed by power sector (13
.7%), the rest being used by
domestic (3.5%) and industrial sector (3
.2%); little over 25% of the water is returned
as waste water to the surface system. Of the 22 major and medium rivers, 13 are now
―grossly polluted‘ (MoEF, 1997)

86
A National River Action Plan Was formulated on the lines of the Ganga Action Plan;
it has now been renamed as National River Conservation Plan (NRCP) in July 1995
and central Ganga Authority (CGA) changed into NRCA. NRCP is to be completed in
March 2005 at a cast of RS. 772.05 crores covering 18 rivers in 10 states, along 46
towns. NRCP essentially addresses to the cleanup programme from pollution load
contributed by sewer outfall.
Obviously irrigation is considered vital for food security but ―water security‖ is
equally important in development process. Originally canal irrigation was restricted to
low rainfall areas but it has been extended to medium and high rainfall areas
(Bhumbla 1984). The irrigation projects are largely connected with Multipurpose
River Valley Projects with objectives to supply water for irrigation, hydel power and
help in flood control. (40 million ha. out of 329 Mha. of India is flood-prone and 8
Mha. per year is affected by flood). The faulty policy of human rehabilitation and
resettlement drew maximum flak from the civil society; often ecological cost vis-à-vis
projected benefit is not considered. It is recorded that in recent years, out of 412 river
valley projects appraised or reappraised, 100 were cleared and 214 were rejected, the
rest being sent for more clarification. Meeting irrigation demand alone can never meet
the object of integrated water resource management in a sustainable manner. A
national commission for Integrated Water Resource Development Plan (IWRDP) was
constituted by Government of India. The report was published in 1999 but much of the
issues and concern raised and expressed seem to remain on paper. Voices of protests
are still heard mainly against social injustice but ecological costs of the projects are
hardly put to focus (that applies even in Narmada Project).
Irrigation, Power and Industry apart, most serious concern about water crisis revolves
around the issue of ‗safe drinking water‘. The government statistics while providing
impressive figures remain silent on the issue of ―duration of safe drinking water
supply‖ The process of certifying about potability of so called safe water, the apparent
contradiction between the claims of covering more urban / rural population under
―safe umbrella‖ and increasing trend of mortality and morbidity due to water – borne
diseases remain unresolved. A look can clarify the matter further: 1991 census data

87
shows that 81.38% of total urban population and 55
.54% of the total rural population
in India have access to ―safe drinking water‖. A 20years data analysis by Centre for
Science and Environment (Report 5, 1999) shows a significant rise in mortality; data
for gastro enteric disease also shows an upward trend. So how safe is safe water?
Coming back of the issue of irrigation, available data indicates that between 1950-51
and 1992-93 canal irrigation has increased from 8.3 million ha. coverage to 17
.1
million ha. While tank irrigation remain nearly static at 3.6 Mha. (1950-51) to 3.3
Mha. (1992-93); well irrigation increased more than 4 times from 6.0 Mha. to 26.5
Mha. Total get irrigated area increased from 41,86Mha. in 1985-86 to 51.45Mha. in
1993-94. The total investment and data per ha. of irrigation by canal or by other
system is not available. Similarly while the total number of large dams increased from
42 in 1950 to 4291 in 1994, the investment and realistic return from such dam projects
is not available; What is however available is the investment made during 1st plan to
8th
five year plan on major and medium river valley projects; the total stands at Rs.
52,606.25 crores which in 1996-97 constant price comes to Rs. 132,897.52 crores.
(CSE, 1999).The continued investment in Multipurpose River Valley Projects
obviously demand a realistic benefit-cost analysis, including ecological and social cost
of such projects. Khushoo (1986) demanded a moratorium on new projects till a total
review of the past projects is done.
Efforts to understand the extend of the problem and find out a more acceptable
solution are noteworthy. A World Commission on Dams (WCD) was initiated in 1997
but it actually began its work in May 1998; the findings of the reports can be
summarized –
Water facts
• Agriculture accounts for 67% of the fresh water use, industry uses 19%
municipal and domestic uses account for 9% (Bandopadhyay, 2002).
• By the end of the20th
century there were 45,000 large dams in over 150
countries. (Large Dam is a dam with the height of 15m or more from the

88
foundation; if the dams are 5 _15m high but have reservoir capacity of more
than three million cubic metres, they are also called large dams).
• Dams contribute to 12% _
16% world food production.
• Hydel power provides 19% of the world‘s total electricity supply
• Flood affected lives of 65 million people between 1972-1996, more than
any other types of disaster.
Cost effectiveness-
• Large dam Projects often incur substantial capital cost overrun more than
half of 250 projects evaluated by WCD show average over run by 50%.
• At current rate fees are rarely sufficient to recover capital and recurrent
cost for water supply system.
• Multipurpose river valley projects often show under performance.
Integrated flood management is better than flood control.
• Integrated flood management is better than flood control.
Ecological cost-
• Dams have fragmented 60% of the world‘s rivers.
• Dams may affect flood plain agriculture, fisheries, pasture and forests
vital for community livelihood as seen in Africa.
• 60% of ecological impacts indentified were unanticipated. Good site
selection and better dam design may minimize impact.
• Prevent upstream-downstream migration of species.
• Good site selection and better dam design may minimize impact.
Economic appraisal techniques remain poor and used in only 20% of the
projects.

89
Social impact-
• More than 80 million people have been affected by dams. 75% of who
are in India and China.
• Project affected people never get a chance to participate in planning and
implementation phase of Dam projects.
• Social costs are hardly projected as also the environmental cost, thereby
real economic efficiency and profitability of these projects remain
unknown.
• Most affected communities are rural dwellers, subsistence farmers, ethnic
minorities, women and indigenous people
The WCD report apart international community‘s continue to debate on the fresh
water crisis. The international conference on Freshwater in Bonn (3_7th
December,
2001), Germany was attended by 118 countries, 47 international organizations
including UN and EU and 73 organizations from the civil society. A total of 1500
people participated in the meet.
Limitations -
Many hundreds of books and movies have peered into the future to imagine a world
that is overrun by environmental disasters. Only a few movies delve into a much more
real future problem for our world, the availability of water. It cannot be denied that
humanity is approaching a self generated environmental crisis. The perception of the
crisis in which we find ourselves has appeared in models developed for ―Global
2000‖. The ultimate downfall of human civilization under the cumulative effects of
population increase, resources depletion and degradation of the environment is
imminent and almost unavoidable- a view that appears to be contradicted by the
evidence: life expectancy increases almost everywhere instead of decreasing and costs
of basic foods and raw materials are not increasing.
90
Statistics accumulated over some years now show clearly deterioration in global
resources. Every scientist has seen the statistics on energy consumption on air, soil and
water pollution on increase of green house gases in the atmosphere, on ozone
depletion in the upper part of the atmosphere and ozone accumulation in the lower
part. And they know from model calculations of atmospheric chemistry that the ozone
hole increases ultra-violet radiation and from the results of general circulation models
one expects global warming and a rise of sea level. Something must be done and must
be done on large scale. However one great problem of the crisis is that decisions must
be made today before the need has become generally apparent to prevent adverse
effects that are projected to occur in a more or less distant future. There is wide spread
agreement that humanity should start securing and improving its water resources in
order to adequately deal with the other environmental problems that may arise.
2/3 amount of water is quickly evaporated and transpired back to the atmosphere, the
remaining 1/3 flows into the lakes, rivers, ground water reservoirs and eventually to
the ocean. These flows provide a potential renewable supply of 1,400 bgd which is
nearly 15 times current daily consumptive use. The quantity of water is withdrawn
from environment but not returned to a usable water source.
Moreover much larger quantities of fresh water are stored in the surface and ground
water reservoirs. Reservoirs behind dams can store about 280,000 billion gallons,
even large quantities are stored in lakes and water stored in sand, gravel and soil that
are saturated with water and sufficiently permeable to produce water in useful
quantities within 2,500 feet of the earth‘s surface is at least 100 times the reservoir
capacity. These stocks are equivalent to more than 50 years renewable supply. Despite
of the apparent global and national abundance and the renewability of the resource,
water adequacy has emerged as one of the nation‘s primary resource issues. For many
of the developing countries of the world the problem is a critical one.
In this country concerns about the availability of fresh water to meet the demands of
the growing and increasingly affluent population while sustaining a healthy natural
environment are based on several factors:

91
- The high cost of developing additional surface water supplies.
- The vulnerability of the resource and the problems of restoring and protecting
valued surface and ground water resources.
- The importance of reliable supplies of high quality water for human and
environmental health and economic development.
- The shortcomings of our institutions for allocating scare supplies in response
to changing supply and demand conditions.
Health and social impacts of water quality problems
Pollution of environmental resources such as water imposes a cost on society. The
costs of water pollution would depend for what purpose that specific water is being
use. For example, in the case of saline water used for industrial purpose, one needs to
consider the cost incurred on desalinating the water. In case of diseases occuring due
to the contamination, one needs to consider the health costs directly due to the
affliction such as Fluorosis. These include both the treatment cost and also the
opportunity cost in terms of lost wages. The canvas therefore is quite wide and one
needs to define the boundaries clearly when defining the costs of pollution. One
attempt of nationwide assessment of the cost of water pollution has been made by
Maria (2003).
A study of the socioeconomic impact of Fluorosis was conducted by IWMI-Tata
Programme in 25 villages of North Gujarat by surveying a total number of 28, 425
respondents (Shah T., et.al., 2004). Of these surveyed people, nearly 36% people were
affected by Dental Fluorosis (DF) and 16% were suffering from at least one of the
symptoms of Fluorosis. Amongst 4590 people who were severely affected persons,
14% or 643 cannot walk properly and more than 64% cannot sit-up and bend forward
properly. Only 4% of the total population and about 23% of the afflicted persons took
medical treatment; rest 77% either could not afford or did not believe in medication to
cure their pain. The severity of Fluorosis disease was observed to be the highest in the
people above 60 years. About 70% of the severely afflicted people were from the

92
monthly income group of Rs. 500 to Rs. 3500 with an average cost (medicinal + wage
loss) of Rs. 5,500 per person per year. Higher income group people could escape the
ill-effects of poor quality ground water and that these effects are distributed
inequitably within society.
Consumption of water with high salinity causes kidney stones, blood pressure and
several skin diseases. A joint study has been taken by International Water
Management Institute, Anand (IWMI) on Social Impact of High Incidence of Kidney
Stone In Coastal Villages in Junagadh district. It is observed that 6 to 7 percent people
is suffering from kidney stone in the selected 5 villages in the coastal area of Mangrol
taluka in Junagadh district.
The river Tapi is one of the major river flowing wasteward through the states of
Madhya Pradesh, Maharashtra and Gujarat, and draining into the Gulf of Khambat of
Arabian Sea. In terms of catchment area, it is the ninth largest among the fourteen
major river basins in our country. The river Tapi Basin is predominantly and
agricultural region of Madhya Pradesh and industries are centered in East Nimar
(Khandwa) district. The middle and lower reaches of the Tapi Basin in Jalgaon
(Maharashtra) and Surat (Gujarat) are fairly industrialized. There are several large and
medium scale industrial units besides large number of small scale units. The important
urban centers in the basin are Burhanpur in Madhya Pradesh; Akola, Bhusawal,
Jalgaon, Malegaon and Dhule in Maharashtra; and Surat in Gujarat.
Dam-
A dam is a barrier that impounds water or streams. Dams generally serve the primary
purpose of retaining water, while other structures such as flood gates known as dikes
are used to manage or prevent water flow into specific land regions. Hydro power and
hydro electricity are often used in consumption with dams to provide electricity for
millions of consumers. It can also be used to collect water or for storage of water
which can be evenly distributed between different locations.
Dams are an inextricable element of our society and are built for a multitude of
reasons like irrigation, power generation, drinking water supply and flood control at
93
increasing cost (Collier et. al., 1998). A reservoir is also referred to as man-made lake.
It is an artificial water body formed as a result of damming a river. Various studies had
been done on changes brought about in abiotic and biotic factors of parent river as a
result of damming, however responses of rivers and river ecosystem to dams are
complex and varied as they depend on local sediment supplies, geomorphic constraint,
climate, dam structure and operation and key attributes of the biota. Therefore one-
size-fits all prescriptions cannot substitute for local knowledge in developing
prescriptions for dam structure and operation to protect local biodiversity (Power
et.al., 1996). India has more than 1500 large dams.
There is no report yet on the hydrobiology of Dara dam resulting from construction of
Dara dam. This work aims at highlighting modifications they may have occurred in
environmental parameters and biotic factors of Dara dam.
Out of 142 million hectors of yet sown area in the country India, about 49.7 million
hector land is irrigated. The remaining 92.3 hector land is still rain fed. 50 % of
irrigation in the country is provided through ground water resources. Due to persistent
and planned efforts of the Ministry Of Water Resources, the irrigation potential has
improved steadily over years.
Apart from flood control, multipurpose projects have manifold utilities. Some of them
for storage of water for irrigation, hydro electricity generation, afforest ion of
surrounding areas to control environmental pollution and induce rains. Stored water
runs through canals to irrigate maximum possible areas. Manmade lakes or reservoirs
are used for pisciculture. Also man-made lakes promote tourism.
Important Dams in India
Hirakud Dam:
The Hirakud dam was built in 1957 in Orrisa. The Hirakud project comprises of 3
major dams – Hirakud dam, Tikarpara dam and Naraj dam on Mahanadi River.
Hirakud Dam is the longest and one of the largest reservoirs of the world. Built on

94
River Mahanadi, the engineering marvel is a source of power generation in the
country. Along with power generation, the largest artificial lake in Asia provides
irrigation to the region. The reservoir is spread over an area of 746 sq. km that has a
shore line of over 640 km. On their visit to the location, tourists can take a 21 km
drive on the dyke. One of the highlighting features of this site is sighting a beautiful
reservoir from the top of the rotating minarets. Among these minarets, Gandhi Minar
on the north and Nehru Minar provide a magnificent view of the expanse of water.
Furthermore, Hirakud Dam is a major site for birdwatching.
Damodar Project:
The Damodar project, India‘s first multipurpose river valley project, was set up on 7
July, 1948 for the development of Damodar valley spread in Bihar and West Bengal.
Damodar project is made up of 4 storage dams at Tilaiya, Konar, Maithon and Panchet
Hills on Damodar river, Roopnarayan river and Hooghly river.
Damodar Valley Project is the first multipurpose river valley project of independent
India. This project is handled by Damodar Valley Corporation. It was launched on
Damodar River. The plan of this project was based on Tenesse Valley Authority of
United States of America. This project benefits two states that are Bihar and West
Bengal. It is 692 metres long and 11.6 metres high barrage that was constructed across
Damodar River. The right and the left bank canal that are starting off from this barrage
are mainly used for irrigation and navigation purposes.
Bhakhra-Nangal Project:
The Bhakhra-Nangal project is the largest multipurpose project in India. This project
largely meets the irrigation and power needs of the northern region. It was built on
Satluj River in Punjab.
The Bhakra Nangal Dam is the largest dam in Asia and is located across Sutlej River
at the border of Punjab and Himachal Pradesh. Length of dam is 518.25 ms and
breadth is 304.84 ms. It is the biggest multi-purpose project in India. Its construction
was started in 1948 and it was completed in 1968. This is also known as the Highest

95
Gravity Dam in the world. It was dedicated to India by Jawaharlal Nehru in year
1963.
The main purpose behind its construction was to provide irrigation to the states of
Punjab and Himachal Pradesh. The other purpose was to controll the flood in
monsoon.
It is used to provide hydro electricity to Himachal Pradesh, Delhi, Punjab and
Haryana.
This dam serves as an important tourist attraction of Himachal Pradesh. There are
many rest house around it which accomodates a large number of tourists who visits
this Dam. It is also known for its reservoir Gobind Sagar Reservoir which have
capacity to store around 9340 million cu meters of water.
Rihand Project:
The Rihand project completed in 1966, serves the entire eastern and south-eastern
region of Uttar Pradesh and Bihar. It was built on Remand River.This is the largest
multi-purpose project of Uttar Pradesh. It involves the construction of a 934 m long
and 91 m high (from stream bed 167 m) straight gravity concrete dam across the river
Rihand (a Tributary of the Son river) near village Pipri in Sonbhadra district.
The water so impounded is collected in Govind Ballabh Pant Sagar reservoir which
spreads over an area of 130 sq. km. (466 sq. km when full) and collects 10,608 m cu m
of water. To let down the floods of the Rihand entering the reservoir, the dam is
provided with a spill-way of 190 m.
Power House-Downstream of the dam on the right side of spill-way has a power house
with installed capacity of 300 mw (6 units of 50 mw each). The power is transmitted
through 829 km of 132 km transmission line and 383 km of 66 km transmission line.

96
It is connected with the U P. power grid and the Obra hydel power station of 99 mw
which utilises tail-race waters of the Rihand turbines and with the Obra thermal power
station of 25 mw.
The Kanpur thermal power station has also been connected with the Rihand (installed
capacity 64 mw). The power is utilised in eastern part of Uttar Pradesh in an area
stretching from Bahraich, Kanpur in the west to Ballia in the east.
This power is utilized in cement tyre and tube (Naini), fertilizers (at Allahabad and
Gorakhpur), aluminium (at Mirzapur), caustic soda, chlorine, porcelain, paper and
board, plastic and electrical industries. It is also utilised in running electric trains and
energizing tubewells in eastern and central Uttar Pradesh.
Irrigation-the water collected in the Govind Ballabh Pant Sagar reservoir is diverted to
the Son canal which irrigates about 2.5 lakh hectares of the agricultural land in
Champaran, Darbhanga and Muzaffarpur districts of Bihar.
Other Benefits-Development of fisheries, tourism, water sports, navigatiom, control of
floods, afforestation (in Rewa region), and checking soil erosion are other benefits
arising out of the project.
The Rihand project has been completed in 1966 with total cost of 375 million rupees.
The project is facing problem of water scarcity due to insufficient rainfall in the
Rihand catchment area, and silting of the reservoir.
Tungabhadra project:
The Tungabhadra project built in 1956 is about 4.8 km away from Hospet in Bellary
district. It has 3 main canals – Hydrabad canal, H.L. canal and K.C. canal built on
Tungabhadra River and Krishna River in Karnataka and Andhra Pradesh.
Tungabhadra is a tributary of the Krishna river which originates from the Sahyadri
hills of Chikmagalur (1892 m) and flowing through Shimoga, Dharwad, Bellary and
Raichur districts of Karnataka it joins the Krishna river near Kurnool city.

97
In its upper reaches the annual rainfall is 425 cm which goes down to 50 cm in its
lower reaches. The command area of the river is characterised by frequent floods and
droughts. Tungabhadra project is a joint undertaking of the Governments of Karnataka
and Andhra Pradesh to harness the river water for irrigation, power generation, and
flood control and drought mitigation.
Tungabhadra Dam-it is a 2,441 m long and 49.39 m high dam across the Tungabhadra
River at Mallapuram (5 km away from Hospet) in Bellary district of Karnataka. It has
been built by cement and granite. Left of it two barrages have been constructed (one
earthen and another of stone and surkhi). The reservoir spreads over 378 sq. km. of
area with storage capacity of 4 lakh hectares.
Power houses-three power houses have been constructed under the project. First of
these lies on the left side at Munirabad (Karnataka) with installed capacity of 27 mw.
The second power house at Hospet has eight generating units of 9 m w each (total
capacity 72 mw). Third power house has been built near Hampi along the canal with
installed capacity of 27 mw. This total 126 mw of electricity is utilised in irrigation
and development of small and cottage industries.
Canal Systems-three canal systems originate from the Tungabhadra barrage, (a) The
Left Bank Canal is called Tungabhadra Canal. It is 340 km long and irrigates about
3.32 lakh hectares of land in Raichur and Mahbubnagar districts; (b) Tungabhadra
Low Level Canal originates from the right side of the dam. It is 347 km long and
irrigates about 60,000 ha of land in Bellary and Kurnool districts; (c) Tungabhadra
High Level Canal with 196 km length provides irrigation to 1.82 lakh hectares of land
in Bellary and Anantapur districts. Tungabhadra project is mainly an irrigation project
which has helped in augmenting the area under cotton, groundnut, rice, sugarcane,
jowar and other crops.
Jayakwadi project:
Jayakwadi project is multipurpose project, was built in 1965-1976. Mainly to irrigate
land for agriculture in drought prone of Marathwada region of Maharashtra state. Also
98
provide water for drinking and industrial usage to nearby towns and villages and to the
municipalities and industrial areas of Aurangabad and Jalna. It is the largest irrigation
project in Aurangabad, Maharashtra. It irrigates cultivable areas of 2, 37, 452 hector in
the districts of Aurangabad, Jalna, Beed and Parbhani while its total command area is
2, 63, 858 hector. Its installed power generating capacity is 12 megawatts. The
Jaikawadi project is one of the largest irrigation projects in the Indian state of
Maharashtra. It is a multipurpose project. Its water is used mainly to irrigate
agricultural land in the drought-prone Marathwada region of Maharashtra. It also
provides water for drinking and industrial usage to nearby towns and villages and to
the municipalities and industrial areas of Aurangabad and Jalna. The surrounding area
of the dam has a garden and a bird sanctuary. It is located on Godavari river at the site
of Jayakawadi village in Paithan taluka of Aurangabad district in Maharashtra state,
India. Foundation was laid by late Prime minister Lal Bahadur Shastri on 18 October
1965. Inaugurated by late Prime Minister Indira Gandhi on 24 February 1976.
Multipurpose project, mainly to irrigate land for agriculture in the drought prone of
Marathwada region of Maharashtra state. Also to provide water for drinking and
industrial usage to nearby towns and villages and to the municipalities and industrial
areas of Aurangabad and Jalna.The chief engineer of this project was Mr. A.A.A.
Siddiqui. The 80% of water of dam is meant for irrigation, 5-7% for drinking water
and the rest for industrial purposes.[1]
Sardar Sarovar Project:
Sardar Sarovar Project is a multipurpose project amongst Gujarat, Madhya Pradesh,
Maharashtra and Rajasthan. It is 138.68 mtr.long concrete dam across Narmada River
near village Navagaon in Gujarat state. It irrigates 17.92 lacks ha. Of land in Gujarat
state and 0.75 lack ha.in Rajasthan state by means of 460 km. long right bank canal. It
generates 1450 M.watt of hydro-electric power.
The Sardar Sarovar Dam is a gravity dam on the Narmada River near Navagam,
Gujarat in India. It is the largest dam and part of the Narmada Valley Project, a large
hydraulic engineering project involving the construction of a series of large irrigation
99
and hydroelectric multi-purpose dams on the Narmada River. The project took form in
1979 as part of a development scheme to increase irrigation and produce
hydroelectricity.
It is the 30th largest dams planned on river Narmada, Sardar Sarovar Dam (SSD) is
the largest structure to be built. It has a proposed final height of 163 m (535 ft) from
foundation.[2]
The project will irrigate more than 18,000 km2 (6,900 sq mi), most of it
in drought prone areas of Kutch and Saurashtra. The dam's main power plant houses
six 200 MW Francis pump-turbines to generate electricity and afford a pumped-
storage capability. Additionally, a power plant on the intake for the main canal
contains five 50 MW Kaplan turbine-generators. The total installed capacity of the
power facilities is 1,450 MW. Critics maintain that its negative environmental impacts
outweigh its benefits. It has created discord between its government planners and the
citizens group Narmada Bachao Andolan.
The benefits of the dam as listed in the Judgement of Supreme Court of India in 2000
were:
"The argument in favour of the Sardar Sarovar Project is that the benefits are so large
that they substantially outweigh the costs of the immediate human and environmental
disruption. Without the dam, the long term costs for people would be much greater
and lack of an income source for future generations would put increasing pressure on
the environment. If the waters of the Narmada river continuous to flow to the sea
unused there appears to be no alternative to escalating human deprivation, particularly
in the dry areas of Gujarat.
The project has the potential to feed as many as 20 million people, provide domestic
and industrial water for about 30 million, employ about 1 million, and provide
valuable peak electric power in an area with high unmet power demand (farm pumps
often get only a few hours power per day). In addition, recent research shows
substantial economic multiplier effects (investment and employment triggered by
development) from irrigation development. Set against the futures of about 70,000
100
project affected people, even without the multiplier effect, the ratio of beneficiaries to
affected persons is well over 100:1."[11]
Types of dam
Masonary Dams:-
Arch dam: In the arch dam, stability is obtained by a combination of arch and gravity
action. If the upstream face is vertical the entire weight of the dam must be carried to
the foundation by gravity while the distribution of the normal hydrostatic pressure
between vertical cantilever and arch action will depend upon the stiffness of the dam
in a vertical and horizontal direction.
For this type of dam, firm reliable supports at the abutements are more important. The
most desirable place for an arch dam is a narrow canyon with steep side walls
composed of sound rock. The safety of an arc dam is dependent on the strength of the
side wall abutements as well as the character of the rock should be carefully inspected.
Two types of single – arch dams are in use, namely the constant-angle and the
constant-radius dam. In constant-radius type the channels grows narrower towards the
bottom of the dam. The central angle subtended by the face of the dam becomes
smaller. A constant angle dam is also known as a variable radius dam, the subtended
angle is kept a constant and the variation in distance between the abutements at
various levels is taken care of varying the radii.
Double-curvature or thin shell dam: In this type the method of construction minimizes
the amount of concrete necessary for construction but transmits large loads to the
foundation and abutments
Multiple-arc dam: it consists of a number of single-arch dams with concrete buttresses
as the supporting abutements. The multiple arch dam requires good rock foundation
because the buttress loads are heavy.

101
Idukki Arch dam is situated across Periyar river in Idukki district, Kerala. It is the
world‘s second arch dam. The dam has a capacity of 780 MW. The power house of the
Idukki Hydro-electric Project which is at Moolamattam is a major tourist attraction.
Gravity Dams:-
In a gravity dam, stability is secured by making it of such a size and shape that it will
resist overturning, sliding and crushing at the toe. For this type of dam, impervious
foundations with high bearing strength are essential. Gravity dams can prove to be a
better alternative to other types of dams. Since the fear of flood is a strong motivator
in many regions gravity dams are being built in some instances where an arch dam
would have been more economical.
Gravity dams are classified as ―solid‖ or ―hollow‖. This is called ―zoning‖. The core
of the dam is zoned depending on the availability of locally available materials,
foundation conditions and the material attributes. Solid form is the more widely used
of the two; though the hollow dam is frequently more economical to construct. Gravity
dams can also be classified as ―overflow‖ (spillway) and ―non-overflow.
Embankment dams:-
These dams are made from compacted earth and have two main types; rock fill and
earth fill dams.
Rock-fill dams: These dams are embankments of compacted free-draining granular
earth with an impervious zone. The earth utilized often contains a large percentage of
large particles hence the term rock-fill. The impervious zone may be on the upstream
face and made up of masonary, concrete, plastic membrane, steel sheet piles, timber or
other material. Rock fill dams are resistant to damage from earthquakes. However
inadequate quality control during construction can lead to poor compaction and sand
in the embankment which can lead to liquefaction of the rock-fill during an
earthquake. Srisailam Dam is located on the Krishna river and is constructed in the
Nallamala Hills in a gorge that sits approximately 300 meters above sea level. The
dam is one of the 12 largest in the country in terms of hydro-electric power production

102
but was specifically built in order to provide irrigation for the districts of Kurnool and
Cuddapah- both of which are prone to severe droughts.
Earthen Dams (Earth-fill dams): Earth fill dams, also called earthen, rolled-earth or
simply earth dams, are constructed as a simple embankment of well compacted earth.
A homogenous rolled-earth dam is entirely constructed of one type of material but
may contain a drain layer to collect seep water. A zoned-earth dam has distinct parts
or zones of dissimilar material, typically a locally plentiful shell with a watertight clay
core. Modern zoned-earth embankments employ filter and drain zones to collect and
remove seep water and preserve the integrity of the downstream shell zone.
Because earthen dams can be constructed from materials found on site or nearby, they
can be very cost effective in regions where the cost of producing or bringing in
concrete would be prohibitive.
Common purposes-
Power generation: hydroelectric power is major source of electricity in the
world. Many countries that have rivers with adequate water flow, that can be dammed
for power generation purpose. For example, Jayakwadi project in Aurangabad
Maharashtra. Its installed power generating capacity is 12megawatts.
Water supply; many urban areas of the world are supplied with water
abstracted from rivers pent up behind low dams. Other major sources include deep
upland reservoirs contained by high dams across deep valleys.
Stabilize water flow/ irrigation; dams are often used to control and stabilize
water flow often for agricultural purposes and irrigation.
Flood prevention; some dams are created with flood control in mind.
Land reclamation; Dams are used to prevent ingress of water to an area that
would otherwise be submerged allowing it‘s reclamation for human use.
Water diversion; A typically small dam used to divert water for irrigation,
power generation or other uses with usually no other function. Occasionally, they are
used to divert water to drainage or other reservoir to increase flow there and improve
water use in that particular area.

103
Recreation and aquatic beauty; dams built for any of the above purposes may
find themselves displaced by time of their original uses. Nevertheless the local
community may have come to enjoy the reservoir for recreational and aesthetic
reasons. Often the reservoir will be placid and surrounded by greenery, and convey
to visitors a natural sense of rest and relaxation.
Location-
One of the best places for building a dam is a narrow part of a deep river valley. The
valley sides can then act as natural walls. The primary function of the dam‘s structure
is to fill the gap in the natural reservoir line left by the stream channel. The sites are
usually those where the gap becomes the minimum for the required storage capacity.
The most economical arrangement is often composite structure such as a masonary
dam flanked by earth embankments. The current use of the land to be flooded should
be dispensable.
Impact assessment-
Impact is assessed in several ways ; the benefits to human society arising from the
dam (agriculture, water damage prevention and power),harm or benefits to nature and
wild life ( especially fish and rare species ), impact on the ecology of an area whether
the change to water flow and levels will increase or decrease stability, and disruption
to human lives.
Environmental impacts of dams-
Dams affect many ecological aspects of a river. Rivers depend on the constant
disturbance of a certain tolerance. Dam‘s slow water exiting a turbine usually contains
very little suspended sediment, which can lead to scouring of river beds and loss of
riverbanks. Wood and garbage accumulated because of a dam. A large dam can cause
the loss of entire ecosphere including endangered and undiscovered species in the area
and the replacement of the original environment by a new inland lake. Depending
upon the circumstances a dam can either reduce or increase the net production of
greenhouse gases.

104
According to the World Commition on Dam report when the reservoir is relatively
large no prior clearing of forest in the flooded area was undertaken, greenhouse gas
emissions from the reservoirs could be higher than those of a conventional oil-fired
thermal generation plant. A decrease can occur if the dam is used in place of
traditional power generation, since electricity produced from hydroelectric generation
does not give rise to any flue gas emissions from fossil fuel combustion (including
sulfur dioxide, nitric oxide, carbon monoxide, dust and mercury from coal). Large lake
formed behind dams have been indicated as contributing to earthquakes, due to
changes in loading and the height of the water table.
Human Social Impact-
The impact on human society is also significant. The dam required a few hundred
kilometer long area for hydropower generation. Its construction required the loss of
over a million people‘s homes and their mass relocation, the loss of many valuable
archaeological and cultural sites as well as significant ecological change. It is
estimated that to date, 40-80 million people worldwide have been physically displaced
from their homes as a result of dam construction.
Economics-
Construction of a hydroelectric plant requires a long lead-time for site studies,
hydrological studies and environmental impact assessment and is large scale project
by comparison to traditional power generation based upon fossil fuels. Hydro-electric
generation can be vulnerable to major changes in the climate, including variation of
rainfall, ground and surface water levels, and glacial melt, causing additional
expenditure for the extra capacity to ensure sufficient power is available in low water
years. Once completed, if it is well designed and maintained, a hydro-electric power
source is usually comparatively cheap and reliable. It has no fuel and low escape risk,
and as an alternative energy source it is cheaper than both nuclear and wind power. It
is more easily regulated to store water as needed and generate high power levels on
demand compared to wind power, although dams have expectancies while renewable
energies do not.

105
The main purpose of analyzing physico-chemical parameters of water is to determine
its nutrient and water quality status. Water contains dissolved and suspended materials
in various proportions. It‘s physical and chemical characteristics differ along with its
biological characteristics.
Now the need for conservation of water bodies particularly for fresh water wetlands, is
being realized everywhere on the globe. In the Ramsar Convention (2002), it was
emphasized that wet lands should be the starting point for integrated water
management strategies, since they are the source of fresh water, maintains the health
of water course and water bodies, subsequently supply water to meet the human needs
and are a key to future water security. There are three sub-systems namely ecological,
social and economic which are essential elements to be defined in a sustainable
development practice (Jorgensen, 1994)
Lakes and rivers are a very important part of our natural heritage. They have been
widely utilized by mankind over the centuries to the extent that very few, if any are
now in a natural condition. The rate of industralization and consequently urbanization
has exacerbated its effect on the environment (Javed, 1999; Asonye et.al., 2007).
Availability of safe and reliable source of water is an essential prerequisite for
sustained development. Water quality assessment is of immense importance to
practices involving the use of water bodies.