Water resources management in the Pyrenees …Water resources management in the Pyrenees under...
27
Water resources management in the Pyrenees under environmental change Facts and forthcoming conditions University of Geneva Instituto Pirenaico de Ecología, C.S.I.C. [email protected] www.ipe.csic.es J. Ignacio López Moreno; J. María García-Ruiz and Martin Beniston
Transcript of Water resources management in the Pyrenees …Water resources management in the Pyrenees under...

Water resources management in the Pyrenees underenvironmental change
Facts and forthcoming conditions
University of GenevaInstituto Pirenaico de Ecología, [email protected]
J. Ignacio López Moreno; J. María García-Ruiz and Martin Beniston

Ebro river basin
Ebro river basin:
Area
85.534 Km2
Annual runoff
13408 hm3year-1
Pyrenees: 10.289Km2 (12%) 6204 hm3year-1 (46.2%)
Pyrenees
Importance of Pyrenees in runoff generation

Importance of Pyrenees in runoff generation
1900 1920 1940 1960 1980 2000
0
500
1000
1500
2000
2500
3000
3500
La Peña
TrempCamarasa
BarasonaTerradets Escales
Canelles
Yesa
Santa Ana
El GradoBúbal
MedianoLanuza
Year
Stor
age
capa
city
(hm
-3)
Importance of Pyrenees in runoff generation
1900 1920 1940 1960 1980 2000
0
500
1000
1500
2000
2500
3000
3500
La Peña
TrempCamarasa
BarasonaTerradets Escales
Canelles
Yesa
Santa Ana
El GradoBúbal
MedianoLanuza
Year
Stor
age
capa
city
(hm
-3)

Importance of Pyrenees in runoff generation
Pyrenean reservoirs divert 1947 hm3
yr-1 to irrigate 29.5748 ha, the 38% ofthe irrigated area in the Ebro basin

The 62% of the hydropower productionof the basin is produced in Pyrenees
Importance of Pyrenees in runoff generation

1957 2002
Land use change
Recent environmental changes can be modifying the hydrological response

Recent environmental changes can be modifying the hydrological response
August, 1912 August, 1998
Land use change

Climatic change
1903 2005
Recent environmental changes can be modyfying the hydrological response

Potential evapotranspiration and precipitation
Precipitation
-1.00
-0.75
-0.50
-0.250.00
0.25
0.50
0.75
1.00
Jan Feb Mar Apr May Jun Jul Aug Sep Oct Nov Dec
Spe
arm
an´s
rho
Potential evapotranspiration
-1.00
-0.75
-0.50
-0.25
0.00
0.25
0.50
0.75
1.00
Jan Feb Mar Apr May Jun Jul Aug Sep Oct Nov Dec
Spe
arm
an´s
rho
Climatic water balance
-1.00
-0.75
-0.50
-0.25
0.00
0.25
0.50
0.75
1.00
Jan Feb Mar Apr May Jun Jul Aug Sep Oct Nov Dec
Spe
arm
an´s
rho
(Precipitation – Potential evapotranspiration)
Trend statistically significant at 95%
Monthly trends (1950-2000): regional series

Trends in snow accumulation
-4
-2
0
2
4
1950 1960 1970 1980 1990 2000
-4
-2
0
2
4
Water year
Snow
dep
th (-
)Sn
ow d
epth
(-)
March
May
Spearman´s rho: *-0.28
Spearman´s rho: *-0.31

Observed temporal evolution of discharges
In all Pyrenean gauging stations a significant decrease on annual runoff has been detected
Esca river, SigüesA
nnua
l run
off
(Hm
3 )
0
200
400
600
800Veral river, Zuriza
Annu
al ru
noff
(Hm
3 )
0
20
40
60
80
100
120Veral river, Biniés
Annu
al ru
noff
(Hm
3 )
0
50
100
150
200
250
Aragón river, Jaca
Annu
al ru
noff
(Hm
3 )
0
100
200
300
400
500Aragón river, Yesa
Annu
al ru
noff
(Hm
3 )
0
300
600
900
1200
1500
1800Ara river, Torla
Annu
al ru
noff
(Hm
3 )
0
100
200
300
400
500
Cinca river, Lafortunada
Annu
al ru
noff
l (H
m3 )
0
200
400
600
800
1000Ésera river, Graus
Annu
al ru
noff
(Hm
3 )
0
200
400
600
800
1000
1200
1400
Ara river, Boltaña
Annu
al ru
noff
(Hm
3 )
0
200
400
600
800
1000
1200
Río Cinqueta en Molino de Gistaín
Water Year1950 1960 1970 1980 1990 2000
Annu
al ru
noff
(Hm
3 )
0
50
100
150
200
250
300Río N. de Tor en Caldas de Bohí
Water Year1950 1960 1970 1980 1990 2000
Annu
al ru
noffl
(Hm
3 )
0
20
40
60
80
100Río N. Ribagorzana en Pont de Suert
Water year1950 1960 1970 1980 1990 2000
Annu
al ru
noffl
(Hm
3 )
0
200
400
600
800

Water year
1950 1960 1970 1980 1990 2000
Valo
res
esta
ndar
izad
os
-4
-2
0
2
4
Precipitation:april-june
Spearman´s rho:-0.06
Water year
1950 1960 1970 1980 1990 2000
Valo
res
esta
ndar
izad
os
-4
-2
0
2
4
6
Runoff:April-june
Spearman´s rho:** -0.45
Observed trend of spring runoffDecrease of spring discharges
Gauging station Spearman´srho
Veral en Zuriza -.357(*)Veral Binies -.408(**)Aragón Subordan en Javierregay -.559(**)Esca Sigüés -.348(*)Aragón Jaca -.499(**)Aragón Cola de Embalse -.614(**)Ara en Boltaña -0.19Ara Torla -0.22Cinca Escalona -.320(*)Cinca La Fortunada -.353(*)Cinqueta Molino Gistain -0.29EseraEriste -0.28Esera Graus -.403(**)Isabena Capella -.326(*)N Tor Caldes de Boi -.593(**)N Ribagorzana Ginaste -.495(**)N Ribagorz Pont de S. -.400(**)Regional series **-0.45
(*) Correlation is significant at 95%
(**) Correlation is significant at 99%

Monthly trends (1950-2000): regional seriesAre the observed changes in the climatic variables enough for explaining the intense decrease in runoff ?
Runoff
-1.00
-0.75
-0.50
-0.25
0.00
0.25
0.50
0.75
1.00
Jan Feb Mar Apr May Jun Jul Aug Sep Oct Nov Dec
Spe
arm
an´s
rho
Precipitation
-1.00
-0.75
-0.50
-0.250.00
0.25
0.50
0.75
1.00
Jan Feb Mar Apr May Jun Jul Aug Sep Oct Nov Dec
Spe
arm
an´s
rho
Potential evapotranspiration
-1.00
-0.75
-0.50
-0.25
0.00
0.25
0.50
0.75
1.00
Jan Feb Mar Apr May Jun Jul Aug Sep Oct Nov Dec
Spe
arm
an´s
rho

Res
idua
ls (-
)
-2
-1
0
1
2
Predicted discharge from rainfall and ETo
Residuals
Water year
1960 1970 1980 1990 2000
Dis
char
ge (-
)
-3
-2
-1
0
1
2
3
Observed discharge
Obs disch = 0.53 precipitation – 0.25 EToExplained a 62% of the observed discharge
Climate-runoff relationships

Res
idua
ls (-
)
-2
-1
0
1
2
Predicted discharge from rainfall and ETo
Residuals
Water year
1960 1970 1980 1990 2000
Dis
char
ge (-
)
-3
-2
-1
0
1
2
3
Observed discharge
Obs disch = 0.53 rainfall – 0.25 EToExplained a 62% of the observed discharge
(km2) Forest Shrub Meadows Crops Rock TOTAL
Abandoned fields 258 113 29 0 0
LAND COVER
64%64%
7%7%28%28%
(km2) Forest Shrub Meadows Crops Rock TOTAL
Abandoned fields 258 113 29 0 0
LAND COVER
64%64%
7%7%28%28%Abandoned fields ~30% of the Pyrenean surface
Data from the Upper Aragón river basin

How do the observed hydrological changes affect to the management of thePyrenean reservoirs?

How do the observed hydrological changes affect to the management of the reservoirs?
Run
off (
hm3 )
0
50
100
150
200
250
Apo
rtaci
ón (h
m3 )
0
20
40
60
80
100
120
140
160
Month
Oct Nov Dec Jan Feb Mar Apr May Jun Jul Aug Sep
Apo
rtaci
ón (h
m3 )
0
50
100
150
200
250
Month
Oct Nov Dec Jan Feb Mar Apr May Jun Jul Aug Sep
Run
off (
hm3 )
0
20
40
60
80
100
120
Mediano Barasona
Escales Tremp
1959-1979 1980-1999
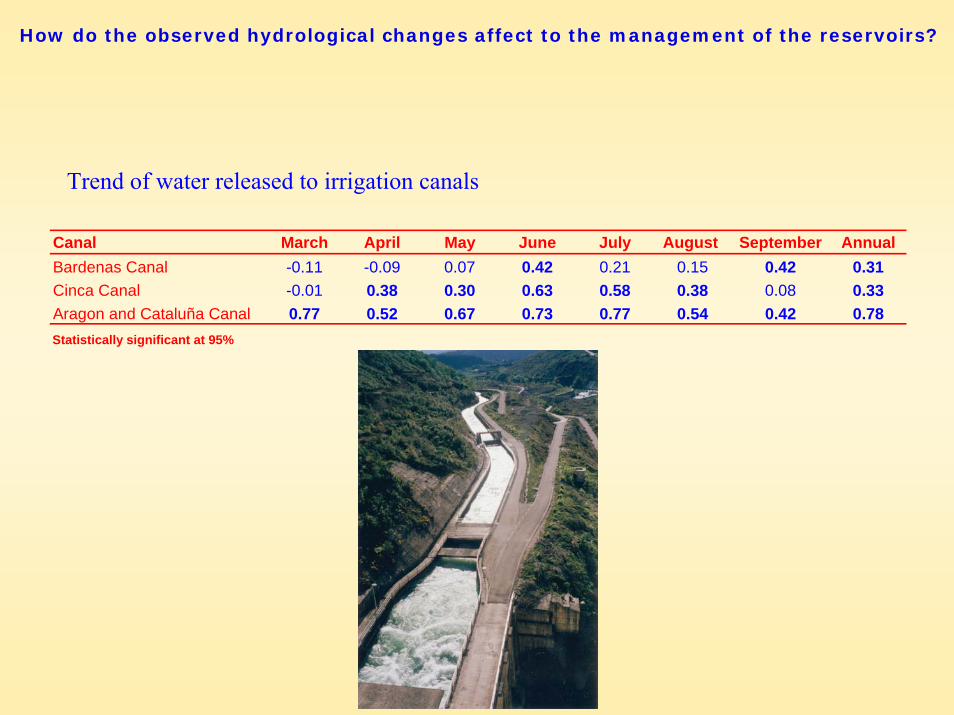
Trend of water released to irrigation canals
Canal March April May June July August September AnnualBardenas Canal -0.11 -0.09 0.07 0.42 0.21 0.15 0.42 0.31Cinca Canal -0.01 0.38 0.30 0.63 0.58 0.38 0.08 0.33Aragon and Cataluña Canal 0.77 0.52 0.67 0.73 0.77 0.54 0.42 0.78Statistically significant at 95%
How do the observed hydrological changes affect to the management of the reservoirs?

Trend of discharges downstream of the damsReservoir Oct Nov Dec Jan Feb Mar Apr May Jun Jul Aug Sep AnnualYesa -0.74 -0.66 -0.39 -0.37 -0.57 -0.76 -0.58 -0.36 -0.59 -0.78 -0.83 -0.67 -0.75El Grado -0.56 -0.54 -0.04 -0.05 0.16 -0.39 -0.62 -0.21 -0.57 -0.57 -0.57 -0.66 -0.63Barasona -0.07 -0.30 -0.45 -0.23 -0.42 -0.53 -0.38 -0.25 -0.53 -0.53 -0.22 -0.04 -0.57Statistically significant at 95%
How do the observed hydrological changes affect to the management of the reservoirs?

Storage Outflow Inflow
Group1
Oct Nov Dec Jan Feb Mar Apr May Jun Jul Aug Sep
Wat
er s
tora
ge (h
m3 )
0
100
200
300
400
500
Dis
char
ge (m
3 s-1)
0
50
100
150
200
Group 2
Oct Nov Dec Jan Feb Mar Apr May Jun Jul Aug Sep
Wat
er s
tora
ge (h
m3 )
0
100
200
300
400
500D
isch
arge
(m3 s-1
)
0
50
100
150
200
The case of Yesa reservoir

Storage Outflow Inflow
Group1
Oct Nov Dec Jan Feb Mar Apr May Jun Jul Aug Sep
Wat
er s
tora
ge (h
m3 )
0
100
200
300
400
500
Dis
char
ge (m
3 s-1)
0
50
100
150
200
Group 2
Oct Nov Dec Jan Feb Mar Apr May Jun Jul Aug Sep
Wat
er s
tora
ge (h
m3 )
0
100
200
300
400
500
Dis
char
ge (m
3 s-1)
0
50
100
150
200
The case of Yesa reservoir
Year
1959
1960
1961
1962
1963
1964
1965
1966
1967
1968
1969
1970
1971
1972
1973
1974
1975
1976
1977
1978
1979
1980
1981
1982
1983
1984
1985
1986
1987
1988
1989
1990
1991
1992
1993
1994
1995
1996
1997
1998
1999
Group 1 Group 2

Expected change on annual climatic water balance (mm): 1960/1990 → 2070/2100
Ensembled 6 RCMs
B2 SCENARIOMean change: -244 mm
A2 SCENARIOMean change: -336 mm

Expected change on surface with positive annual climatic water balance (mm):1960/1990 → 2070/2100
Ensembled 6 RCMs
1960-1990(63.975km2)
2070-2100B2 (39.900 km-2)
2070-2100A2 (32.625 km-2)

Expected change on winter precipitation (mm): 1960/1990 → 2070/2100
Ensembled 6 RCMs
B2 SCENARIOMean change: -1.9 mm
A2 SCENARIOMean change: 4.3 mm

Expected change on winter temperature (mm): 1960/1990 → 2070/2100
Ensembled 6 RCMs
B2 SCENARIOMean change: 1.55ºC
A2 SCENARIOMean change: 2.57ºC

Conditions predicted by RCMs for the end of the XXI th century indicates that problems ofwater scarcity could become worse.
Climatic conditions and land-use changes occurred in the last decades lead to a lower capacityof runoff generation of the Pyrenean catchments.Probably the capacity of adapatation of the management of water resources for supplying anincreasing water demand is close to unsustainable levels
Moreover, in Pyrenees there are large areas where revegation processes could continue
Conclusions

Conclusions
Adaptation measurements to face up to a more than previsible future water shortages are requiredi) to favour technologies focussed on water saving and optimisationii) to select the direction of the economical developmentiii) to understand the importance of land management on water resources generation