Water Resources Data, Oregon, Water Year 2004- … COLUMBIA RIVER 14020520 Umatilla Pilot Rock...
28
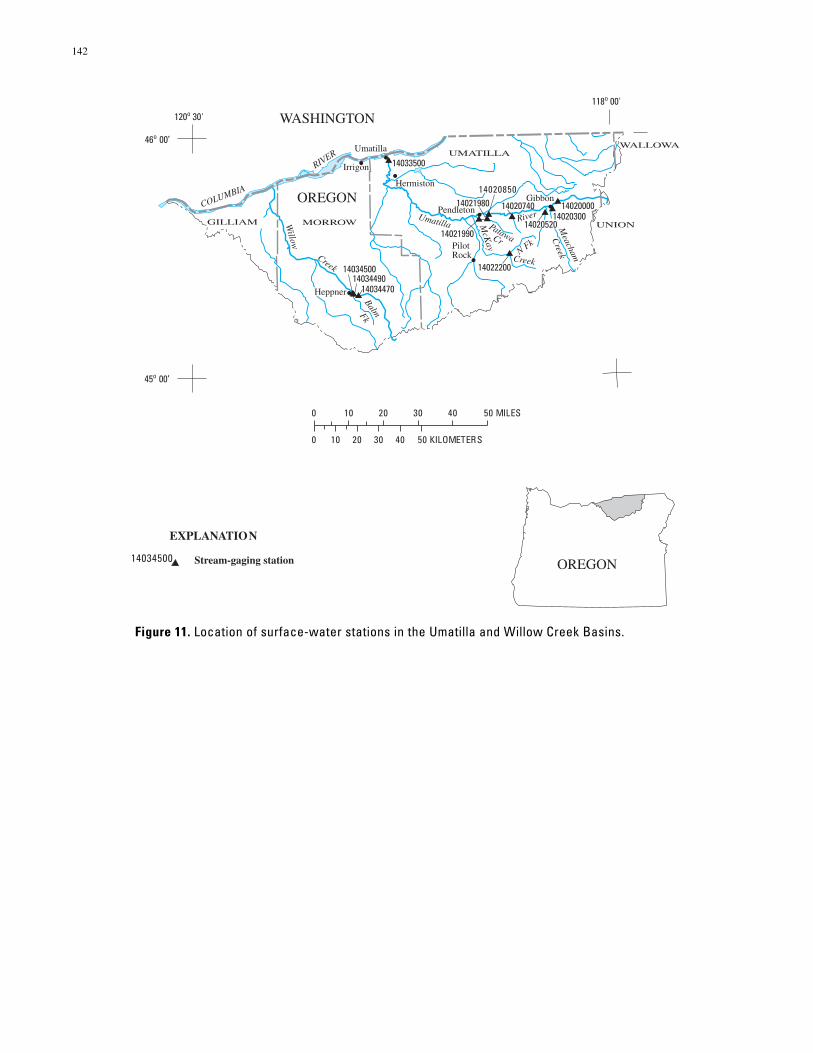
14034470 14033500 14020000 14020740 14034500 14034490 14022200 14020850 14021980 14020300 Willow Creek River Umatilla Balm McKay Patawa Cr Fk Creek Creek N Fk Meacham COLUMBIA RIVER 14020520 Umatilla Pilot Rock Heppner Gibbon Hermiston Pendleton Irrigon GILLIAM MORROW UMATILLA UNION WALLOWA 14021990 118 o 00' 120 o 30' 0 10 20 30 40 0 10 20 30 40 50 KILOMETER S 50 MILES OREGON Stream-gaging station 14034500 EXPLANATION 45 o 00’ 46 o 00’ OREGON WASHINGTON 142 Figure 11. Location of surface-water stations in the Umatilla and Willow Creek Basins.
Transcript of Water Resources Data, Oregon, Water Year 2004- … COLUMBIA RIVER 14020520 Umatilla Pilot Rock...
14034470
14033500
1402000014020740
1403450014034490
14022200
1402085014021980
14020300
Willow
Creek
RiverUmatilla
Balm
McK
ay
PatawaCr
Fk
Creek
CreekN Fk
Meacham
COLUMBIA
RIVER
14020520
Umatilla
PilotRock
Heppner
Gibbon
Hermiston
Pendleton
Irrigon
GILLIAM MORROW
UMATILLA
UNION
WALLOWA
14021990
118o 00'
120o 30'
0 10 20 30 40
0 10 20 30 40 50 KILOMETERS
50 MILES
OREGONStream-gaging station14034500
EXPLANATION
45o 00’
46o 00’
OREGON
WASHINGTON
142
Figure 11. Location of surface-water stations in the Umatilla and Willow Creek Basins.

EXPLANATION
14020740 Stream-gaging station
RM 2.1 River mile
Stream—Arrow shows direction of flow
RM289.0C O L U M B I A R I V E R
UM
AT
IL
LA
RI
VE
R
14033500RM 2.1
RM52.0
McKay CreekMcKay
Reservoir
StorageBegan 1927
N.
Fk.
McK
ay
Cre
ek
14022200RM 0.5
RM53.8
Tutuilla Creek
Pa
taw
a C
reek
14021980
RM56.7
Wildhorse Creek
14020850
14021990
Mission Creek
Cottonwood Creek
Moonshine Creek 14020740
Coonskin Creek
Buckaroo Creek
RM78.7
Squaw Creek
RM80.9
Meacham Creek14020300
RM 1.4
14020520RM 2.2
14020000RM 83.1
143
Figure 12. Schematic diagram showing gaging stations in the Umatilla River Basin.

144
U.S. Geo
UMATILLA RIVER BASIN
14020000 UMATILLA RIVER ABOVE MEACHAM CREEK, NEAR GIBBON, OR
LOCATION.--Lat 45°43'11", long 118°19'20", in SE 1⁄4 SW 1⁄4 sec.21, T.3 N., R.36 E., Umatilla County, Hydrologic Unit 17070103, Umatilla Indian Reservation, on right bank 0.8 mi downstream from Ryan Creek, 2.2 mi upstream from Meacham Creek, 2.5 mi northeast of Gibbon, and at mile 83.1.
DRAINAGE AREA.--131 mi2.
PERIOD OF RECORD.--April 1933 to current year.
REVISED RECORDS.--WSP 1935: 1946-48(M), 1950(M), 1953(M), 1956-59(M), drainage area.
GAGE.--Water-stage recorder. Datum of gage is 1,854.81 ft above NGVD of 1929. Prior to June 27, 1939, at site 1 mi downstream at datum 43.94 ft lower.
REMARKS.--Records good except for estimated daily discharges, which are poor. No regulation or diversion upstream from station. Continuous water-quality records for the period June 1959 to September 1980 have been collected at this location. U.S. Geological Survey satellite telemeter at station.
AVERAGE DISCHARGE.--71 years (water years 1934-2004), 227 ft3/s, 23.54 in/yr, 164,400 acre-ft/yr.
EXTREMES FOR PERIOD OF RECORD.--Maximum discharge, 6,220 ft3/s Nov. 28, 1995, gage height, 9.40 ft (high-water mark), from rating curve extended above 3,500 ft3/s; maximum gage height, 9.50 ft Jan. 29, 1965; minimum discharge, 16 ft3/s Nov. 9, 1965, momentary regulation from unknown source.
EXTREMES FOR CURRENT YEAR.--Peak discharges greater than base discharge of 1,400 ft3/s and maximum (*):
Date TimeDischarge
(ft3/s)Gage height
(ft) Date TimeDischarge
(ft3/s)Gage height
(ft)
Jan. 29 1045 *1,980 *6.19 May 28 1915 1,770 5.96
Minimum discharge, 41 ft3/s, Oct. 1-6, 8, Aug. 20-22.
DISCHARGE, CUBIC FEET PER SECOND WATER YEAR OCTOBER 2003 TO SEPTEMBER 2004
DAILY MEAN VALUES
DAY OCT NOV DEC JAN FEB MAR APR MAY JUN JUL AUG SEP
1 42 48 217 e105 566 278 532 616 603 93 49 502 42 48 214 e115 406 253 422 654 476 88 49 513 43 49 193 e96 321 235 403 689 390 85 53 524 42 49 177 e54 279 258 473 674 325 82 51 515 42 48 158 e48 246 287 581 622 290 80 50 49
6 42 48 206 e72 232 306 568 544 276 77 50 497 42 48 226 e84 220 293 607 491 249 75 53 488 42 48 199 e96 203 347 611 465 343 74 50 489 43 48 171 e110 191 605 587 423 367 73 48 47
10 42 54 153 283 183 766 570 401 760 71 46 47
11 43 71 138 305 179 629 567 438 842 68 46 4812 50 58 145 301 179 559 610 800 610 68 45 5213 46 53 374 271 178 615 673 776 465 66 45 5514 47 51 583 213 175 542 648 616 369 64 44 5715 50 51 362 205 174 557 613 516 308 63 44 58
16 53 67 266 271 203 543 502 628 272 61 44 6217 49 80 216 308 318 628 463 572 241 61 45 5618 47 65 188 279 444 751 435 635 218 62 45 5519 46 65 175 234 476 778 406 708 197 65 44 5420 46 67 176 204 414 585 430 703 180 64 43 54
21 45 64 186 182 361 507 478 667 165 60 43 5322 45 61 191 166 318 597 554 615 152 57 53 5223 45 59 186 182 306 773 602 927 141 56 81 5124 45 61 191 396 337 770 574 1,180 131 55 62 5025 45 60 206 273 347 618 541 915 122 55 80 49
26 45 62 200 216 348 595 557 862 115 53 74 5027 46 60 182 190 369 536 657 1,140 109 52 64 5028 48 63 168 391 335 460 737 1,600 104 52 57 4929 56 259 151 1,850 303 452 627 1,510 99 51 54 4930 51 267 e92 1,590 --- 666 598 1,090 96 50 51 4931 49 --- e96 907 --- 708 --- 795 --- 49 50 ---
TOTAL 1,419 2,132 6,386 9,997 8,611 16,497 16,626 23,272 9,015 2,030 1,613 1,545MEAN 45.8 71.1 206 322 297 532 554 751 300 65.5 52.0 51.5MAX 56 267 583 1,850 566 778 737 1,600 842 93 81 62MIN 42 48 92 48 174 235 403 401 96 49 43 47AC-FT 2,810 4,230 12,670 19,830 17,080 32,720 32,980 46,160 17,880 4,030 3,200 3,060CFSM 0.35 0.54 1.57 2.46 2.27 4.06 4.23 5.73 2.29 0.50 0.40 0.39IN. 0.40 0.61 1.81 2.84 2.45 4.68 4.72 6.61 2.56 0.58 0.46 0.44
STATISTICS OF MONTHLY MEAN DATA FOR WATER YEARS 1934 - 2004, BY WATER YEAR (WY)
MEAN 57.1 127 233 264 328 398 539 444 184 63.9 47.0 46.7MAX 169 405 716 656 1,074 989 885 1,135 591 110 63.4 81.6(WY) (1952) (1948) (1976) (1965) (1996) (1972) (1974) (1948) (1974) (1948) (1975) (1959)MIN 39.1 40.2 44.4 45.7 71.8 189 162 67.0 49.4 39.5 36.9 34.9(WY) (1936) (1936) (1966) (1937) (1977) (1955) (1941) (1934) (1992) (1934) (1939) (1935)
logical Survey Water Resources Data—Oregon, Water year 2004, Volume 1: Surface Water, p. 144–146.
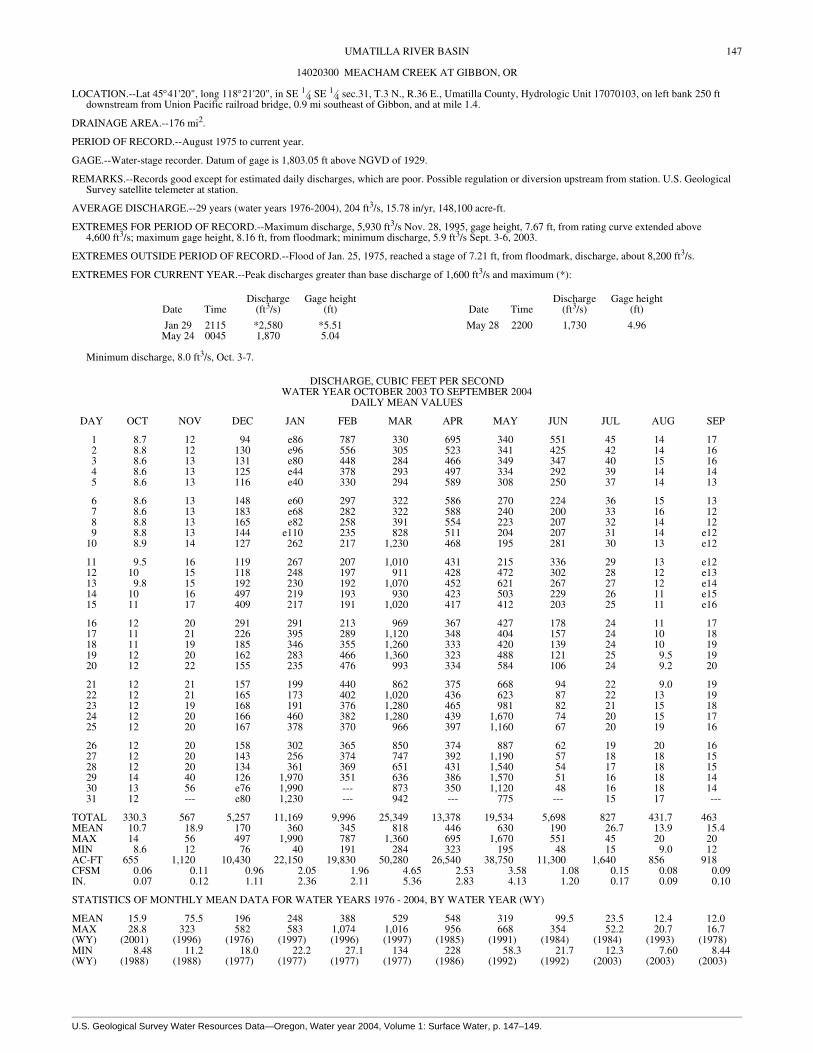
145UMATILLA RIVER BASIN
14020000 UMATILLA RIVER ABOVE MEACHAM CREEK, NEAR GIBBON, OR—Continued
SUMMARY STATISTICS FOR 2003 CALENDAR YEAR FOR 2004 WATER YEAR WATER YEARS 1934 - 2004
ANNUAL TOTAL 81,777 99,143ANNUAL MEAN 224 271 227HIGHEST ANNUAL MEAN 415 1974LOWEST ANNUAL MEAN 114 1977HIGHEST DAILY MEAN 1,780 Jan 31 1,850 Jan 29 5,130 Dec 12, 1946LOWEST DAILY MEAN 35 Aug 16 42 Oct 1 28 Jan 9, 1937ANNUAL SEVEN-DAY MINIMUM 35 Aug 14 42 Oct 1 31 Sep 26, 1935ANNUAL RUNOFF (AC-FT) 162,200 196,700 164,400ANNUAL RUNOFF (CFSM) 1.71 2.07 1.73ANNUAL RUNOFF (INCHES) 23.22 28.15 23.5410 PERCENT EXCEEDS 549 628 55050 PERCENT EXCEEDS 106 176 11890 PERCENT EXCEEDS 39 47 44
e Estimated

""TThhiiss ppaaggee ccoonnttaaiinnss cchhaarrttss ggrraapphhiiccaallllyy ppoorrttrraayyiinngg tthhee ttaabbuullaarrddaattaa ccoonnttaaiinneedd oonntthhee 2004 Water Year
Annual Minimum 7-Day Average Streamflow
0102030405060
4391
1491
8491
5591
2691
9691
6791
3891
0991
7991
4002
SSttrree
aammffll oo
ww ((cc
ffss))
Daily Mean Discharge
10
100
1,000
10,000
SSttrree
aammfflloo
ww ((cc
ffss))
0200400600800
1,0001,200
Oct Nov Dec Jan Feb Mar Apr May Jun Jul Aug Sep
SSttrree
aammff lloo
ww ((cc
ffss))
nneesstt ppaaggee.. SSkkiipp ttoo tthhee nneexxtt ppaaggee ttoo ggoo ddiirreeccttllyy ttoo tthhee ttaabbuullaarr ddaattaa.. .. ..""
Annual Peak Streamflow
0
2,000
4,000
6,000
8,000
3391
0491
7491
4591
1691
8691
5791
2891
9891
6991
3002
SSttrree
aammffll oo
ww ((cc
ffss))
14020000 UMATILLA RIVER ABOVE MEACHAM CREEK, NR GIBBON, OR43Latitude: 45
oLongitude: 118 19
o' '11" 20"
Drainage Area: 131 square milesDatum: 1,854.81 feetHydrologic Unit Code: 17070103
Umatilla County
Monthly StatisticsMonthly Mean of Current Water Year
UMATILLA RIVER BASIN
Annual Mean Streamflow
0100200300400500
4391
1491
8491
5591
2691
9691
6791
3891
0991
7991
4002
SS ttrr ee
aammffll oo
ww (( cc
ff ss))
Max, Mean, and Min Monthly Mean for 1934 2004 _
Oct Nov Dec Jan Feb Mar Apr May Jun Jul Aug Sep
147
U.S. Geo
UMATILLA RIVER BASIN
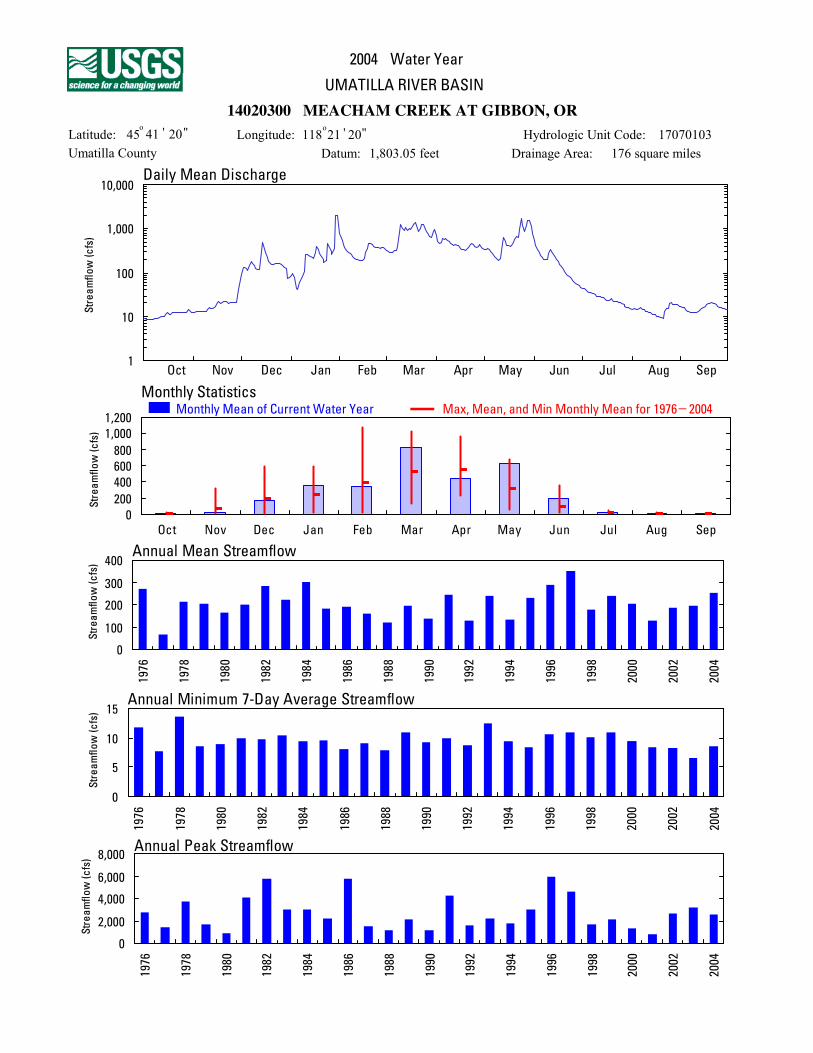
14020300 MEACHAM CREEK AT GIBBON, OR
LOCATION.--Lat 45°41'20", long 118°21'20", in SE 1⁄4 SE 1⁄4 sec.31, T.3 N., R.36 E., Umatilla County, Hydrologic Unit 17070103, on left bank 250 ft downstream from Union Pacific railroad bridge, 0.9 mi southeast of Gibbon, and at mile 1.4.
DRAINAGE AREA.--176 mi2.
PERIOD OF RECORD.--August 1975 to current year.
GAGE.--Water-stage recorder. Datum of gage is 1,803.05 ft above NGVD of 1929.
REMARKS.--Records good except for estimated daily discharges, which are poor. Possible regulation or diversion upstream from station. U.S. Geological Survey satellite telemeter at station.
AVERAGE DISCHARGE.--29 years (water years 1976-2004), 204 ft3/s, 15.78 in/yr, 148,100 acre-ft.
EXTREMES FOR PERIOD OF RECORD.--Maximum discharge, 5,930 ft3/s Nov. 28, 1995, gage height, 7.67 ft, from rating curve extended above 4,600 ft3/s; maximum gage height, 8.16 ft, from floodmark; minimum discharge, 5.9 ft3/s Sept. 3-6, 2003.
EXTREMES OUTSIDE PERIOD OF RECORD.--Flood of Jan. 25, 1975, reached a stage of 7.21 ft, from floodmark, discharge, about 8,200 ft3/s.
EXTREMES FOR CURRENT YEAR.--Peak discharges greater than base discharge of 1,600 ft3/s and maximum (*):
Date TimeDischarge
(ft3/s)Gage height
(ft) Date TimeDischarge
(ft3/s)Gage height
(ft)
Jan 29 2115 *2,580 *5.51 May 28 2200 1,730 4.96May 24 0045 1,870 5.04
Minimum discharge, 8.0 ft3/s, Oct. 3-7.
DISCHARGE, CUBIC FEET PER SECOND WATER YEAR OCTOBER 2003 TO SEPTEMBER 2004
DAILY MEAN VALUES
DAY OCT NOV DEC JAN FEB MAR APR MAY JUN JUL AUG SEP
1 8.7 12 94 e86 787 330 695 340 551 45 14 172 8.8 12 130 e96 556 305 523 341 425 42 14 163 8.6 13 131 e80 448 284 466 349 347 40 15 164 8.6 13 125 e44 378 293 497 334 292 39 14 145 8.6 13 116 e40 330 294 589 308 250 37 14 13
6 8.6 13 148 e60 297 322 586 270 224 36 15 137 8.6 13 183 e68 282 322 588 240 200 33 16 128 8.8 13 165 e82 258 391 554 223 207 32 14 129 8.8 13 144 e110 235 828 511 204 207 31 14 e12
10 8.9 14 127 262 217 1,230 468 195 281 30 13 e12
11 9.5 16 119 267 207 1,010 431 215 336 29 13 e1212 10 15 118 248 197 911 428 472 302 28 12 e1313 9.8 15 192 230 192 1,070 452 621 267 27 12 e1414 10 16 497 219 193 930 423 503 229 26 11 e1515 11 17 409 217 191 1,020 417 412 203 25 11 e16
16 12 20 291 291 213 969 367 427 178 24 11 1717 11 21 226 395 289 1,120 348 404 157 24 10 1818 11 19 185 346 355 1,260 333 420 139 24 10 1919 12 20 162 283 466 1,360 323 488 121 25 9.5 1920 12 22 155 235 476 993 334 584 106 24 9.2 20
21 12 21 157 199 440 862 375 668 94 22 9.0 1922 12 21 165 173 402 1,020 436 623 87 22 13 1923 12 19 168 191 376 1,280 465 981 82 21 15 1824 12 20 166 460 382 1,280 439 1,670 74 20 15 1725 12 20 167 378 370 966 397 1,160 67 20 19 16
26 12 20 158 302 365 850 374 887 62 19 20 1627 12 20 143 256 374 747 392 1,190 57 18 18 1528 12 20 134 361 369 651 431 1,540 54 17 18 1529 14 40 126 1,970 351 636 386 1,570 51 16 18 1430 13 56 e76 1,990 --- 873 350 1,120 48 16 18 1431 12 --- e80 1,230 --- 942 --- 775 --- 15 17 ---
TOTAL 330.3 567 5,257 11,169 9,996 25,349 13,378 19,534 5,698 827 431.7 463MEAN 10.7 18.9 170 360 345 818 446 630 190 26.7 13.9 15.4MAX 14 56 497 1,990 787 1,360 695 1,670 551 45 20 20MIN 8.6 12 76 40 191 284 323 195 48 15 9.0 12AC-FT 655 1,120 10,430 22,150 19,830 50,280 26,540 38,750 11,300 1,640 856 918CFSM 0.06 0.11 0.96 2.05 1.96 4.65 2.53 3.58 1.08 0.15 0.08 0.09IN. 0.07 0.12 1.11 2.36 2.11 5.36 2.83 4.13 1.20 0.17 0.09 0.10
STATISTICS OF MONTHLY MEAN DATA FOR WATER YEARS 1976 - 2004, BY WATER YEAR (WY)
MEAN 15.9 75.5 196 248 388 529 548 319 99.5 23.5 12.4 12.0MAX 28.8 323 582 583 1,074 1,016 956 668 354 52.2 20.7 16.7(WY) (2001) (1996) (1976) (1997) (1996) (1997) (1985) (1991) (1984) (1984) (1993) (1978)MIN 8.48 11.2 18.0 22.2 27.1 134 228 58.3 21.7 12.3 7.60 8.44(WY) (1988) (1988) (1977) (1977) (1977) (1977) (1986) (1992) (1992) (2003) (2003) (2003)
logical Survey Water Resources Data—Oregon, Water year 2004, Volume 1: Surface Water, p. 147–149.

148 UMATILLA RIVER BASIN
14020300 MEACHAM CREEK AT GIBBON, OR—Continued
SUMMARY STATISTICS FOR 2003 CALENDAR YEAR FOR 2004 WATER YEAR WATER YEARS 1976 - 2004
ANNUAL TOTAL 76,490.4 93,000.0ANNUAL MEAN 210 254 204HIGHEST ANNUAL MEAN 352 1997LOWEST ANNUAL MEAN 66.2 1977HIGHEST DAILY MEAN 2,270 Jan 31 1,990 Jan 30 4,820 Feb 8, 1996LOWEST DAILY MEAN 6.4 Sep 4 8.6 Oct 3 6.4 Sep 4, 2003ANNUAL SEVEN-DAY MINIMUM 6.5 Aug 31 8.6 Oct 1 6.5 Aug 31, 2003ANNUAL RUNOFF (AC-FT) 151,700 184,500 148,100ANNUAL RUNOFF (CFSM) 1.19 1.44 1.16ANNUAL RUNOFF (INCHES) 16.17 19.66 15.7810 PERCENT EXCEEDS 603 656 55650 PERCENT EXCEEDS 74 128 7190 PERCENT EXCEEDS 8.4 12 11
e Estimated
""TThhiiss ppaaggee ccoonnttaaiinnss cchhaarrttss ggrraapphhiiccaallllyy ppoorrttrraayyiinngg tthhee ttaabbuullaarrddaattaa ccoonnttaaiinneedd oonntthhee 2004 Water Year
Annual Minimum 7-Day Average Streamflow
0
5
10
15
6791
8791
0891
2891
4891
6891
8891
0991
2991
4991
6991
8991
0002
2002
4002
SSttrree
aammffll oo
ww ((cc
ffss))
Daily Mean Discharge
1
10
100
1,000
10,000
SSttrree
aammfflloo
ww ((cc
ffss))
0200400600800
1,0001,200
Oct Nov Dec Jan Feb Mar Apr May Jun Jul Aug Sep
SSttrree
aammff lloo
ww ((cc
ffss))
nneesstt ppaaggee.. SSkkiipp ttoo tthhee nneexxtt ppaaggee ttoo ggoo ddiirreeccttllyy ttoo tthhee ttaabbuullaarr ddaattaa.. .. ..""
Annual Peak Streamflow
0
2,000
4,000
6,000
8,000
6791
8791
0891
2891
4891
6891
8891
0991
2991
4991
6991
8991
0002
2002
4002
SSttrree
aammffll oo
ww ((cc
ffss))
14020300 MEACHAM CREEK AT GIBBON, OR41Latitude: 45
oLongitude: 118 21
o' '20" 20"
Drainage Area: 176 square milesDatum: 1,803.05 feetHydrologic Unit Code: 17070103
Umatilla County
Monthly StatisticsMonthly Mean of Current Water Year
UMATILLA RIVER BASIN
Annual Mean Streamflow
0
100
200
300
400
6791
8791
0891
2891
4891
6891
8891
0991
2991
4991
6991
8991
0002
2002
4002
SS ttrr ee
aammffll oo
ww (( cc
ff ss))
Max, Mean, and Min Monthly Mean for 1976 2004 _
Oct Nov Dec Jan Feb Mar Apr May Jun Jul Aug Sep

150
U.S. Geo
UMATILLA RIVER BASIN
14020520 SQUAW CREEK NEAR GIBBON, OR
LOCATION.--Lat 45°40'22", long 118°24'00", in NW 1⁄4 NE 1⁄4 sec.11, T.2 N., R.35 E., Umatilla County, Hydrologic Unit 17070103, on right bank, 2 mi southwest of townsite of Gibbon, and at mile 2.2.
DRAINAGE AREA.--32.6 mi2.
PERIOD OF RECORD.--October 1998 to current year.
GAGE.--Water-stage recorder. Elevation of gage is 1,850 ft above NGVD of 1929, from topographic map.
REMARKS.--Records poor. No regulation or diversion upstream from station.
AVERAGE DISCHARGE.--6 years (water years 1999-2004), 30.1 ft3/s, 12.53 in/yr, 21,780 acre-ft/yr.
EXTREMES FOR PERIOD OF RECORD.--Maximum discharge, 1,600 ft3/s Jan. 29, 2004, gage height, 3.89 ft, from rating curve extended above 750 ft3/s; minimum discharge, 0.48 ft3/s Aug. 21, 30, 31, Sept. 1, 3-6 2003.
EXTREMES FOR CURRENT YEAR.--Peak discharges greater than base discharge of 370 ft3/s and maximum (*):
Date TimeDischarge
(ft3/s)Gage height
(ft) Date TimeDischarge
(ft3/s)Gage height
(ft)
Jan 29 0745 *1,600 *3.89 No other peak above base discharge.
Minimum discharge, 0.64 ft3/s, Aug. 19-21.
DISCHARGE, CUBIC FEET PER SECOND WATER YEAR OCTOBER 2003 TO SEPTEMBER 2004
DAILY MEAN VALUES
DAY OCT NOV DEC JAN FEB MAR APR MAY JUN JUL AUG SEP
1 0.85 2.9 30 19 107 49 35 28 70 3.8 1.1 1.22 0.88 2.8 27 18 82 45 29 25 51 3.5 1.1 1.23 0.89 2.9 23 18 66 43 26 21 38 3.3 1.2 1.24 0.90 2.9 20 e14 57 45 24 19 30 3.2 1.2 1.25 0.90 2.8 18 e11 51 53 24 16 25 3.0 1.1 1.1
6 0.89 2.7 27 e12 48 81 23 14 23 2.9 1.2 1.17 0.98 2.7 31 e13 47 84 21 13 20 2.7 1.4 1.08 1.0 2.8 28 14 44 106 19 11 22 2.6 1.2 0.989 1.2 2.9 26 65 41 138 17 10 23 2.4 1.1 0.97
10 1.2 3.2 23 101 38 134 15 11 52 2.3 1.0 0.89
11 1.3 4.3 20 78 36 107 14 16 63 2.2 0.99 0.9612 1.5 3.6 21 61 34 97 13 48 54 2.1 0.94 1.213 1.4 3.4 104 50 32 98 12 51 45 2.0 0.90 1.514 1.6 3.3 140 45 29 87 12 43 37 1.9 0.90 1.715 1.8 3.3 82 41 28 89 17 36 30 1.8 0.94 1.5
16 1.9 4.7 57 62 38 84 16 37 25 1.7 0.88 1.717 1.8 4.9 41 65 98 86 17 33 21 1.7 0.89 1.818 1.6 4.2 34 52 122 87 18 54 18 1.8 0.93 1.719 1.6 5.2 29 43 111 84 18 84 15 2.0 0.83 1.520 1.6 5.4 26 35 92 65 24 93 13 2.1 0.78 1.5
21 1.6 4.7 26 30 79 56 36 98 11 1.8 0.76 1.422 1.6 4.5 26 26 67 55 70 87 9.6 1.6 1.2 1.323 1.8 4.2 25 32 59 59 78 130 8.5 1.5 1.4 1.324 1.9 4.7 27 182 59 56 62 179 7.6 1.5 1.5 1.325 1.9 4.7 30 134 58 49 50 128 6.6 1.4 2.0 1.2
26 1.9 4.9 30 94 58 45 41 109 5.9 1.4 1.7 1.127 1.9 4.9 27 73 57 43 34 131 5.4 1.3 1.4 1.128 2.3 4.9 25 160 55 40 35 230 5.0 1.3 1.2 1.129 3.2 26 23 933 52 39 34 207 4.7 1.3 1.3 1.030 2.9 33 20 277 --- 43 31 135 4.2 1.3 1.3 1.031 2.9 --- 19 149 --- 42 --- 98 --- 1.2 1.2 ---
TOTAL 49.69 167.4 1,085 2,907 1,745 2,189 865 2,195 743.5 64.6 35.54 37.70MEAN 1.60 5.58 35.0 93.8 60.2 70.6 28.8 70.8 24.8 2.08 1.15 1.26MAX 3.2 33 140 933 122 138 78 230 70 3.8 2.0 1.8MIN 0.85 2.7 18 11 28 39 12 10 4.2 1.2 0.76 0.89AC-FT 99 332 2,150 5,770 3,460 4,340 1,720 4,350 1,470 128 70 75CFSM 0.05 0.17 1.07 2.88 1.85 2.17 0.88 2.17 0.76 0.06 0.04 0.04IN. 0.06 0.19 1.24 3.32 1.99 2.50 0.99 2.50 0.85 0.07 0.04 0.04
STATISTICS OF MONTHLY MEAN DATA FOR WATER YEARS 1999 - 2004, BY WATER YEAR (WY)
MEAN 2.77 12.8 41.3 56.6 66.9 95.4 50.4 24.6 8.06 1.42 0.96 1.16MAX 7.55 20.5 88.9 93.8 98.5 144 85.1 70.8 24.8 2.08 1.15 1.91(WY) (2001) (1999) (1999) (2004) (2003) (2000) (2002) (2004) (2004) (2004) (2004) (2000)MIN 1.14 2.16 3.80 17.2 24.9 57.3 28.8 8.14 2.62 1.04 0.71 0.83(WY) (2000) (2003) (2003) (2001) (2001) (2001) (2004) (2002) (2001) (2002) (2003) (2003)
logical Survey Water Resources Data—Oregon, Water year 2004, Volume 1: Surface Water, p. 150–152.

151UMATILLA RIVER BASIN
14020520 SQUAW CREEK NEAR GIBBON, OR—Continued
SUMMARY STATISTICS FOR 2003 CALENDAR YEAR FOR 2004 WATER YEAR WATER YEARS 1999 - 2004
ANNUAL TOTAL 12,688.69 12,084.43ANNUAL MEAN 34.8 33.0 30.1HIGHEST ANNUAL MEAN 35.5 2000LOWEST ANNUAL MEAN 19.0 2001HIGHEST DAILY MEAN 385 Jan 30 933 Jan 29 933 Jan 29, 2004LOWEST DAILY MEAN 0.58 Aug 21 0.76 Aug 21 0.58 Aug 21, 2003ANNUAL SEVEN-DAY MINIMUM 0.60 Aug 31 0.86 Aug 15 0.60 Aug 31, 2003ANNUAL RUNOFF (AC-FT) 25,170 23,970 21,780ANNUAL RUNOFF (CFSM) 1.07 1.01 0.922ANNUAL RUNOFF (INCHES) 14.48 13.79 12.5310 PERCENT EXCEEDS 106 86 8450 PERCENT EXCEEDS 9.3 17 9.590 PERCENT EXCEEDS 0.78 1.2 0.96
e Estimated

""TThhiiss ppaaggee ccoonnttaaiinnss cchhaarrttss ggrraapphhiiccaallllyy ppoorrttrraayyiinngg tthhee ttaabbuullaarrddaattaa ccoonnttaaiinneedd oonntthhee2004 Water Year
Annual Mean Streamflow
0
10
20
30
40
9991
0002
1002
2002
3002
4002
SSttrree
aammffll oo
ww(( cc
ffss))
Annual Minimum 7-Day Average Streamflow
00.20.40.60.81.0
9991
0002
1002
2002
3002
4002
SSttrree
aammfflloo
ww((cc
ffss))
Daily Mean Discharge
0
1
10
100
1,000
SSttrree
aammfflloo
ww((cc
ffss))
0
50
100
150
200
Oct Nov Dec Jan Feb Mar Apr May Jun Jul Aug Sep
SSttrree
aammfflloo
ww((cc
ffss))
nneesstt ppaaggee.. SSkkiipp ttoo tthhee nneexxtt ppaaggee ttoo ggoo ddiirreeccttllyy ttoo tthhee ttaabbuullaarr ddaattaa.. .. ..""
Annual Peak Streamflow
0
500
1,000
1,500
2,000
9991
0002
1002
2002
3002
4002
SSttrree
aammfflloo
ww((cc
ffss))
14020520 SQUAW CREEK NEAR GIBBON, OR40Latitude: 45
oLongitude: 118 24
o' '22" 00"
Drainage Area: 32.6 square milesDatum: 1,850 feetHydrologic Unit Code: 17070103
Umatilla County
Monthly StatisticsMonthly Mean of Current Water Year
UMATILLA RIVER BASIN
Max, Mean, and Min Monthly Mean for 1999 2004 _
Oct Nov Dec Jan Feb Mar Apr May Jun Jul Aug Sep
153
U.S. Geo
UMATILLA RIVER BASIN
14020740 MOONSHINE CREEK NEAR MISSION, OR
LOCATION.--Lat 45°39'37", long 118°33'55", in NW 1⁄4 NE 1⁄4 sec.16, T.2 N., R.34 E., Umatilla County, Hydrologic Unit 17070103, Umatilla Indian Reservation, on left bank, 60 ft upstream from county road crossing, 5.7 mi east of Mission, and at mile 1.1.
DRAINAGE AREA.--4.62 mi2.
PERIOD OF RECORD.--October 1991 to December 2003 (discontinued).
REVISED RECORDS.--WDR OR-93-1: 1992(M); WDR OR-94-1: 1993.
GAGE.--Water-stage recorder. Elevation of gage is 1,600 ft above NGVD of 1929, from topographic map.
REMARKS.--No estimated daily discharges. Records poor. No known regulation.
AVERAGE DISCHARGE.--12 years (water years 1992-2003), 3.05 ft3/s, 2,210 acre-ft per year.
EXTREMES FOR PERIOD OF RECORD.--Maximum discharge, 247 ft3/s Feb. 7, 1996, gage height, 6.67 ft, from rating curve extended above 75 ft3/s; no flow part of or all of each day Oct. 1-14, 1992, Sept. 6-10, 1993, Oct. 2, 15-19, 1993.
DISCHARGE, CUBIC FEET PER SECOND WATER YEAR OCTOBER 2003 TO SEPTEMBER 2004
DAILY MEAN VALUES
DAY OCT NOV DEC JAN FEB MAR APR MAY JUN JUL AUG SEP
1 0.14 0.36 0.50 --- --- --- --- --- --- --- --- ---2 0.14 0.36 0.50 --- --- --- --- --- --- --- --- ---3 0.14 0.36 0.50 --- --- --- --- --- --- --- --- ---4 0.14 0.32 0.50 --- --- --- --- --- --- --- --- ---5 0.15 0.32 0.50 --- --- --- --- --- --- --- --- ---
6 0.15 0.32 0.55 --- --- --- --- --- --- --- --- ---7 0.17 0.32 0.55 --- --- --- --- --- --- --- --- ---8 0.17 0.32 0.52 --- --- --- --- --- --- --- --- ---9 0.16 0.32 0.53 --- --- --- --- --- --- --- --- ---
10 0.17 0.33 0.78 --- --- --- --- --- --- --- --- ---
11 0.17 0.32 1.1 --- --- --- --- --- --- --- --- ---12 0.19 0.32 2.3 --- --- --- --- --- --- --- --- ---13 0.19 0.32 8.7 --- --- --- --- --- --- --- --- ---14 0.21 0.32 13 --- --- --- --- --- --- --- --- ---15 0.22 0.33 6.5 --- --- --- --- --- --- --- --- ---
16 0.22 0.40 4.7 --- --- --- --- --- --- --- --- ---17 0.22 0.45 3.5 --- --- --- --- --- --- --- --- ---18 0.22 0.45 2.9 --- --- --- --- --- --- --- --- ---19 0.22 0.48 2.4 --- --- --- --- --- --- --- --- ---20 0.22 0.45 2.1 --- --- --- --- --- --- --- --- ---
21 0.22 0.45 1.9 --- --- --- --- --- --- --- --- ---22 0.25 0.45 1.9 --- --- --- --- --- --- --- --- ---23 0.27 0.45 1.8 --- --- --- --- --- --- --- --- ---24 0.30 0.49 2.7 --- --- --- --- --- --- --- --- ---25 0.33 0.50 4.7 --- --- --- --- --- --- --- --- ---
26 0.32 0.48 4.7 --- --- --- --- --- --- --- --- ---27 0.32 0.45 3.7 --- --- --- --- --- --- --- --- ---28 0.33 0.45 3.2 --- --- --- --- --- --- --- --- ---29 0.36 0.55 2.9 --- --- --- --- --- --- --- --- ---30 0.36 0.50 2.5 --- --- --- --- --- --- --- --- ---31 0.36 --- 2.3 --- --- --- --- --- --- --- --- ---
TOTAL 7.03 11.94 84.93 --- --- --- --- --- --- --- --- ---MEAN 0.23 0.40 2.74 --- --- --- --- --- --- --- --- ---MAX 0.36 0.55 13 --- --- --- --- --- --- --- --- ---MIN 0.14 0.32 0.50 --- --- --- --- --- --- --- --- ---AC-FT 14 24 168 --- --- --- --- --- --- --- --- ---
CAL YR2003 TOTAL 1,078.96 MEAN 2.96 MAX 44 MIN 0.12 AC-FT 2140
logical Survey Water Resources Data—Oregon, Water year 2004, Volume 1: Surface Water, p. 153–153.

154
U.S. Geo
UMATILLA RIVER BASIN
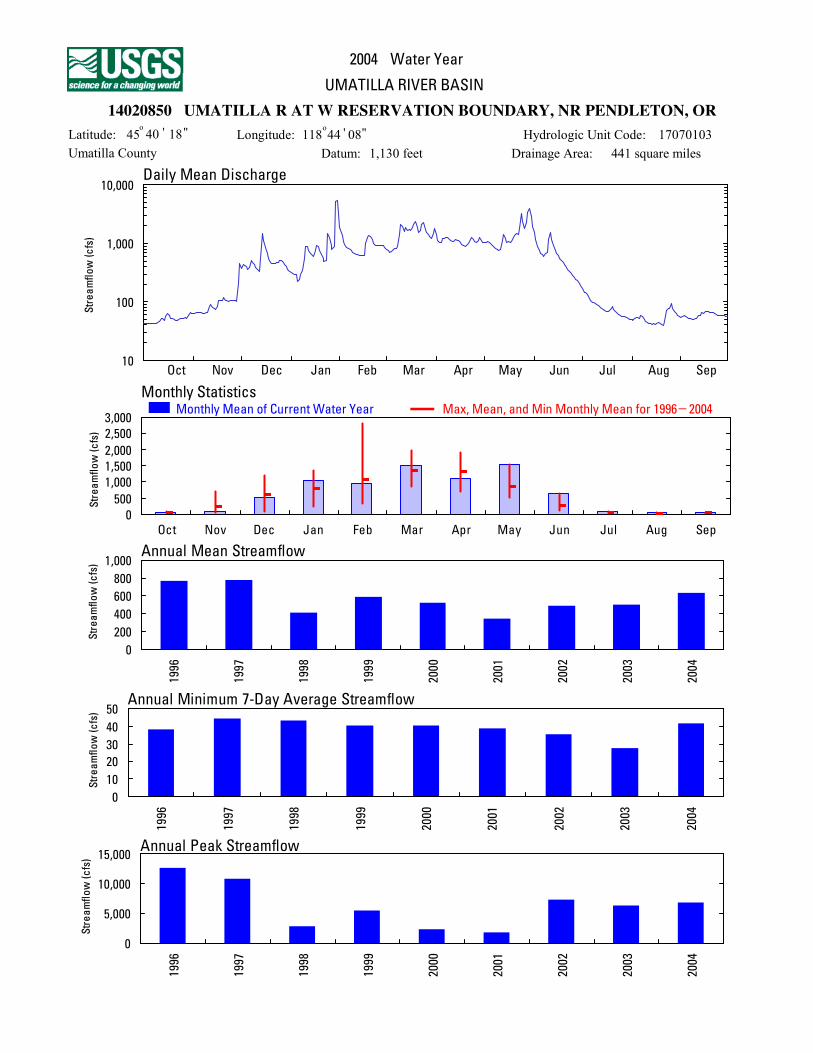
14020850 UMATILLA RIVER AT WEST RESERVATION BOUNDARY, NEAR PENDLETON, OR
LOCATION.--Lat 45°40'18", long 118°44'08", in NE 1⁄4 NW 1⁄4 sec.7, T.2 N., R.33 E., Umatilla County, Hydrologic Unit 17070103, on left bank, 0.5 mi east of west line of boundary for Umatilla Indian Reservarion, 1.6 mi upstream from Wildhorse Creek, 2.5 mi east of Post Office in Pendleton, and at mile 58.3.
DRAINAGE AREA.--440.8 mi2.
PERIOD OF RECORD.--October 1995 to current year.
GAGE.--Water-stage recorder. Elevation of gage is 1,130 ft above NGVD of 1929, from topographic map.
REMARKS.--Records fair. No known regulation. Many diversions for irrigation upstream from station. U.S. Geological Survey satellite telemeter at station.
AVERAGE DISCHARGE.--9 years (water years 1996-2004), 559 ft3/s, 404,900 acre-ft.
EXTREMES FOR PERIOD OF RECORD.--Maximum discharge, 12,700 ft3/s Feb. 9, 1996, gage height, 11.64 ft; minimum discharge, 25 ft3/s Aug. 19, 2003.
EXTREMES FOR CURRENT YEAR.--Peak discharges greater than base discharge of 3,000 ft3/s and maximum (*):
Date TimeDischarge
(ft3/s)Gage height
(ft) Date TimeDischarge
(ft3/s)Gage height
(ft)
Jan 29 1400 *6,880 *8.94 May 29 0415 4,350 7.38May 24 0515 3,560 6,90
Minimum discharge, 39 ft3/s, Aug. 20-22.
DISCHARGE, CUBIC FEET PER SECOND WATER YEAR OCTOBER 2003 TO SEPTEMBER 2004
DAILY MEAN VALUES
DAY OCT NOV DEC JAN FEB MAR APR MAY JUN JUL AUG SEP
1 43 62 384 321 1,890 793 1,410 1,030 1,520 e170 49 542 43 62 438 313 1,360 751 1,140 1,040 1,160 e150 48 563 43 64 423 299 1,100 717 1,030 1,070 903 e140 51 574 43 64 403 293 944 720 1,050 1,050 768 e130 54 565 42 64 357 223 865 764 1,210 1,000 684 e120 53 54
6 42 64 398 246 808 819 1,230 928 646 e110 52 527 42 63 517 294 790 827 1,260 855 594 98 58 518 43 62 484 351 752 887 1,240 818 674 95 55 509 43 64 438 553 708 1,410 1,170 781 705 92 50 49
10 44 66 392 876 677 2,140 1,120 749 1,170 88 46 51
11 45 83 356 877 655 1,950 1,090 776 1,530 84 44 5112 52 88 339 767 641 1,620 1,090 1,130 1,180 80 43 5813 51 79 564 676 630 1,880 1,160 1,430 915 76 42 5914 48 75 1,480 633 624 1,690 1,140 1,210 769 73 41 6615 56 74 1,140 606 619 1,720 1,130 1,040 681 70 43 63
16 62 83 850 748 636 1,650 1,020 1,080 615 68 41 6817 57 110 672 932 999 1,840 954 1,060 559 68 42 6818 52 108 551 883 1,280 2,130 920 1,090 511 71 44 6919 51 104 479 758 1,390 2,400 893 1,280 472 77 42 6620 50 115 450 658 1,320 1,840 908 1,390 434 81 40 66
21 48 109 450 565 1,160 1,530 986 1,460 399 72 39 6522 48 103 467 495 1,000 1,680 1,160 1,410 366 66 46 6323 49 100 470 510 932 2,130 1,250 1,770 337 63 71 6024 51 102 478 1,450 934 2,230 1,190 3,240 312 61 75 5925 52 103 511 1,270 939 1,730 1,100 2,330 288 58 77 58
26 52 103 510 931 916 1,550 1,060 1,800 266 56 92 5827 53 103 470 789 925 1,420 1,110 2,230 250 56 76 5828 51 101 440 885 912 1,290 1,240 3,410 e238 55 67 5729 58 208 412 5,250 840 1,210 1,130 3,980 e210 53 62 5530 64 450 364 5,320 --- 1,450 1,050 2,840 e190 52 58 5531 62 --- 334 3,200 --- 1,770 --- 1,960 --- 50 55 ---
TOTAL 1,540 3,036 16,021 31,972 27,246 46,538 33,441 47,237 19,346 2,583 1,656 1,752MEAN 49.7 101 517 1,031 940 1,501 1,115 1,524 645 83.3 53.4 58.4MAX 64 450 1,480 5,320 1,890 2,400 1,410 3,980 1,530 170 92 69MIN 42 62 334 223 619 717 893 749 190 50 39 49AC-FT 3,050 6,020 31,780 63,420 54,040 92,310 66,330 93,690 38,370 5,120 3,280 3,480
STATISTICS OF MONTHLY MEAN DATA FOR WATER YEARS 1996 - 2004, BY WATER YEAR (WY)
MEAN 63.0 255 608 805 1,062 1,344 1,304 863 278 66.9 43.1 47.3MAX 101 717 1,186 1,360 2,801 1,971 1,898 1,524 645 83.3 53.4 58.4(WY) (2001) (1996) (1997) (1997) (1996) (1997) (2002) (2004) (2004) (2004) (2004) (2004)MIN 47.2 61.0 83.5 246 339 871 693 517 117 38.6 30.3 40.2(WY) (2003) (2003) (2003) (2001) (2001) (2001) (1998) (2000) (2001) (2003) (2003) (2001)
logical Survey Water Resources Data—Oregon, Water year 2004, Volume 1: Surface Water, p. 154–156.
155UMATILLA RIVER BASIN
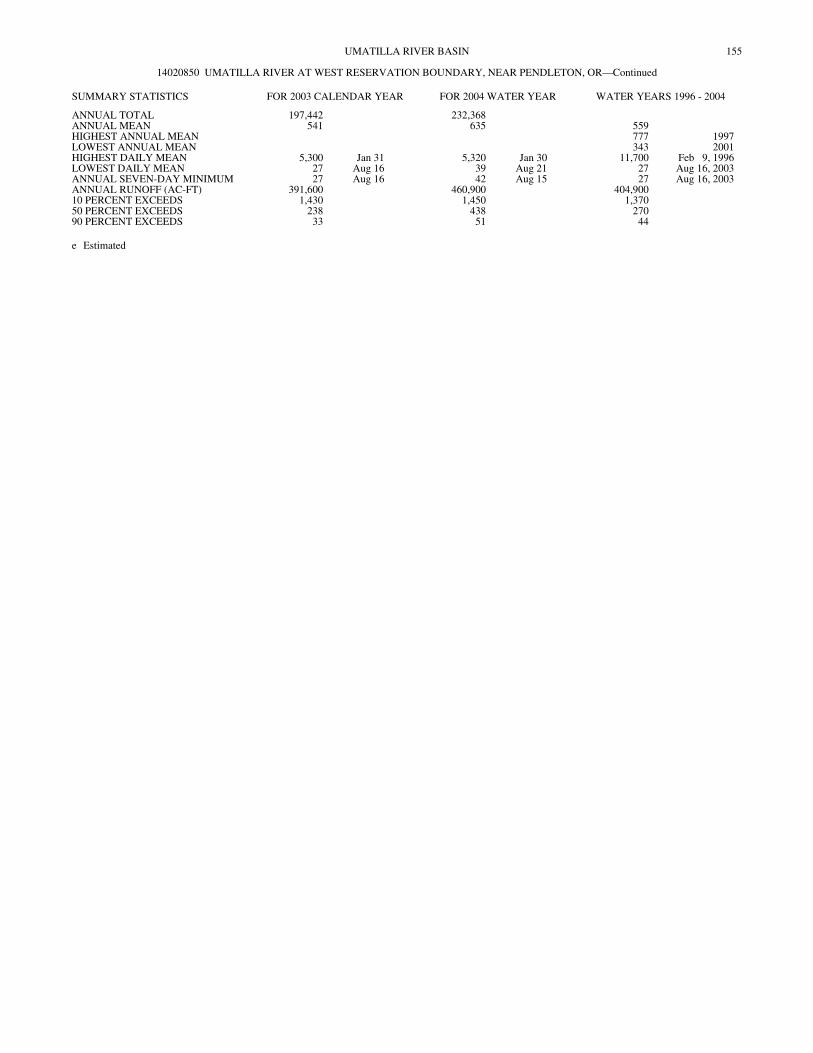
14020850 UMATILLA RIVER AT WEST RESERVATION BOUNDARY, NEAR PENDLETON, OR—Continued
SUMMARY STATISTICS FOR 2003 CALENDAR YEAR FOR 2004 WATER YEAR WATER YEARS 1996 - 2004
ANNUAL TOTAL 197,442 232,368ANNUAL MEAN 541 635 559HIGHEST ANNUAL MEAN 777 1997LOWEST ANNUAL MEAN 343 2001HIGHEST DAILY MEAN 5,300 Jan 31 5,320 Jan 30 11,700 Feb 9, 1996LOWEST DAILY MEAN 27 Aug 16 39 Aug 21 27 Aug 16, 2003ANNUAL SEVEN-DAY MINIMUM 27 Aug 16 42 Aug 15 27 Aug 16, 2003ANNUAL RUNOFF (AC-FT) 391,600 460,900 404,90010 PERCENT EXCEEDS 1,430 1,450 1,37050 PERCENT EXCEEDS 238 438 27090 PERCENT EXCEEDS 33 51 44
e Estimated
""TThhiiss ppaaggee ccoonnttaaiinnss cchhaarrttss ggrraapphhiiccaallllyy ppoorrttrraayyiinngg tthhee ttaabbuullaarrddaattaa ccoonnttaaiinneedd oonntthhee 2004 Water Year
Annual Minimum 7-Day Average Streamflow
01020304050
6991
7991
8991
9991
0002
1002
2002
3002
4002
SSttrree
aammffll oo
ww ((cc
ffss))
Daily Mean Discharge
10
100
1,000
10,000
SSttrree
aammfflloo
ww ((cc
ffss))
0500
1,0001,5002,0002,5003,000
Oct Nov Dec Jan Feb Mar Apr May Jun Jul Aug Sep
SSttrree
aammff lloo
ww ((cc
ffss))
nneesstt ppaaggee.. SSkkiipp ttoo tthhee nneexxtt ppaaggee ttoo ggoo ddiirreeccttllyy ttoo tthhee ttaabbuullaarr ddaattaa.. .. ..""
Annual Peak Streamflow
0
5,000
10,000
15,000
6991
7991
8991
9991
0002
1002
2002
3002
4002
SSttrree
aammffll oo
ww ((cc
ffss))
14020850 UMATILLA R AT W RESERVATION BOUNDARY, NR PENDLETON, OR40Latitude: 45
oLongitude: 118 44
o' '18" 08"
Drainage Area: 441 square milesDatum: 1,130 feetHydrologic Unit Code: 17070103
Umatilla County
Monthly StatisticsMonthly Mean of Current Water Year
UMATILLA RIVER BASIN
Annual Mean Streamflow
0200400600800
1,000
6991
7991
8991
9991
0002
1002
2002
3002
4002
SS ttrr ee
aammffll oo
ww (( cc
ff ss))
Max, Mean, and Min Monthly Mean for 1996 2004 _
Oct Nov Dec Jan Feb Mar Apr May Jun Jul Aug Sep

157
U.S. Geo
UMATILLA RIVER BASIN
14021980 PATAWA CREEK AT WEST RESERVATION BOUNDARY, NEAR PENDLETON, OR
LOCATION.--Lat 45°39'11", long 118°44'39", in NW 1⁄4 SW 1⁄4 sec. 18, T.2 N., R.33 E., Umatilla County, Hydrologic Unit 17070103, Umatilla Indian Reservation, on right bank, at downstream side of county road crossing, 2 mi southwest of Pendleton City Hall, and at mile 2.9.
DRAINAGE AREA.--30 mi2, excludes about 1 mi2 in upper basin where water has been diverted directly to the Umatilla River.
PERIOD OF RECORD.--December 1973 to April 1975 (discharge measurements only), October 1991 to December 2003 (discontinued).
REVISED RECORDS.--WDR OR-94-1: 1993 (M).
GAGE.--Water-stage recorder. Elevation of gage is 1,220 ft above NGVD of 1929, from topographic map.
REMARKS.--No estimated daily discharges. Records poor. No known regulation.
AVERAGE DISCHARGE.--12 years (water years 1992-2003), 5.16 ft3/s, 3,740 acre-ft/yr.
EXTREMES FOR PERIOD OF RECORD.--Maximum discharge 378 ft3/s Feb. 7, 1996, gage height, 7.94 ft; minimum discharge, 0.01 ft3/s July 22, 23, 27, 28, July 30 to Aug. 1, 1999.
EXTREMES FOR CURRENT YEAR.--Maximum discharge, 1.4 ft3/s Nov. 9, gage height, 3.76 ft; minimum discharge, 0.04 ft3/s Dec. 31.
DISCHARGE, CUBIC FEET PER SECOND WATER YEAR OCTOBER 2003 TO SEPTEMBER 2004
DAILY MEAN VALUES
DAY OCT NOV DEC JAN FEB MAR APR MAY JUN JUL AUG SEP
1 0.12 0.93 0.25 --- --- --- --- --- --- --- --- ---2 0.10 1.0 0.18 --- --- --- --- --- --- --- --- ---3 0.10 1.0 0.13 --- --- --- --- --- --- --- --- ---4 0.11 0.78 0.14 --- --- --- --- --- --- --- --- ---5 0.11 0.70 0.13 --- --- --- --- --- --- --- --- ---
6 0.12 0.64 0.13 --- --- --- --- --- --- --- --- ---7 0.09 0.59 0.12 --- --- --- --- --- --- --- --- ---8 0.08 0.57 0.12 --- --- --- --- --- --- --- --- ---9 0.08 0.80 0.09 --- --- --- --- --- --- --- --- ---
10 0.09 0.69 0.10 --- --- --- --- --- --- --- --- ---
11 0.13 0.44 0.06 --- --- --- --- --- --- --- --- ---12 0.13 0.47 0.09 --- --- --- --- --- --- --- --- ---13 0.14 0.42 0.11 --- --- --- --- --- --- --- --- ---14 0.17 0.44 0.14 --- --- --- --- --- --- --- --- ---15 0.23 0.47 0.10 --- --- --- --- --- --- --- --- ---
16 0.26 0.49 0.09 --- --- --- --- --- --- --- --- ---17 0.26 0.50 0.10 --- --- --- --- --- --- --- --- ---18 0.25 0.44 0.09 --- --- --- --- --- --- --- --- ---19 0.27 0.45 0.12 --- --- --- --- --- --- --- --- ---20 0.28 0.40 0.13 --- --- --- --- --- --- --- --- ---
21 0.25 0.35 0.12 --- --- --- --- --- --- --- --- ---22 0.27 0.36 0.13 --- --- --- --- --- --- --- --- ---23 0.22 0.38 0.14 --- --- --- --- --- --- --- --- ---24 0.17 0.73 0.19 --- --- --- --- --- --- --- --- ---25 0.24 0.34 0.21 --- --- --- --- --- --- --- --- ---
26 0.41 0.09 0.16 --- --- --- --- --- --- --- --- ---27 0.35 0.09 0.06 --- --- --- --- --- --- --- --- ---28 0.45 0.07 0.05 --- --- --- --- --- --- --- --- ---29 0.82 0.10 0.05 --- --- --- --- --- --- --- --- ---30 0.86 0.16 0.05 --- --- --- --- --- --- --- --- ---31 0.89 --- 0.06 --- --- --- --- --- --- --- --- ---
TOTAL 8.05 14.89 3.64 --- --- --- --- --- --- --- --- ---MEAN 0.26 0.50 0.12 --- --- --- --- --- --- --- --- ---MAX 0.89 1.0 0.25 --- --- --- --- --- --- --- --- ---MIN 0.08 0.07 0.05 --- --- --- --- --- --- --- --- ---AC-FT 16 30 7.2 --- --- --- --- --- --- --- --- ---CFSM 0.01 0.02 0.00 --- --- --- --- --- --- --- --- ---IN. 0.01 0.02 0.00 --- --- --- --- --- --- --- --- ---
CAL YR2003 TOTAL 1,432.00 MEAN 3.92 MAX 142 MIN 0.05 AC-FT 2840 CFSM 0.13 IN. 1.78
logical Survey Water Resources Data—Oregon, Water year 2004, Volume 1: Surface Water, p. 157–157.

158
U.S. Geo
UMATILLA RIVER BASIN
14021990 TUTUILLA CREEK AT PENDLETON, OR
LOCATION.--Lat 45°39'33", long 118°47'53", in NE 1⁄4 NW 1⁄4 sec.15, T.2 N., R.32 E., Umatilla County, Hydrologic Unit 17070103, on left bank, 265 ft upstream from Tutuilla Creek Road bridge, and at mile 0.95.
DRAINAGE AREA.--60.27 mi2, approximately.
PERIOD OF RECORD.--January to September 2004.
GAGE.--Water-stage recorder and crest-stage gage. Elevation of gage is 1,090 ft above NGVD of 1929, from topographic map.
REMARKS.--Records good except for estimated daily discharges, which are fair. No known regulation.
EXTREMES FOR CURRENT YEAR.--Maximum recorded discharge, 225 ft3/s June 10, gage height, 8.44 ft, but may have been higher during period of estimated record; minimum discharge, 0.14 ft3/s Sept. 11.
DISCHARGE, CUBIC FEET PER SECOND WATER YEAR OCTOBER 2003 TO SEPTEMBER 2004
DAILY MEAN VALUES
DAY OCT NOV DEC JAN FEB MAR APR MAY JUN JUL AUG SEP
1 --- --- --- e2.0 e20 e7.0 1.8 3.0 19 1.2 0.40 0.362 --- --- --- e2.2 e16 e6.8 1.7 2.6 13 1.1 0.56 0.373 --- --- --- e2.4 e12 e6.2 1.7 2.3 10 1.1 0.57 0.354 --- --- --- e2.0 e10 e6.6 1.7 2.1 7.8 1.0 0.56 0.355 --- --- --- e2.6 e9.0 e7.0 1.6 2.0 6.4 1.1 0.56 0.32
6 --- --- --- e2.0 e8.0 e12 1.5 1.9 6.2 0.96 0.61 0.357 --- --- --- e1.8 e8.0 e14 1.4 1.8 6.1 0.95 0.58 0.378 --- --- --- e2.0 e6.6 e18 1.4 1.7 9.1 0.94 0.54 0.339 --- --- --- e10 e5.4 e22 1.4 1.6 11 0.94 0.40 0.22
10 --- --- --- e22 e4.6 e20 1.4 1.6 89 0.91 0.36 0.24
11 --- --- --- e14 e4.0 e12 1.4 1.7 64 0.81 0.42 0.2612 --- --- --- e12 e3.8 e9.0 1.5 2.2 39 0.75 0.45 0.2613 --- --- --- e10 e3.4 e8.4 1.5 2.5 26 0.71 0.35 0.3914 --- --- --- e8.6 e3.2 e6.6 1.5 1.9 18 0.67 0.34 0.3615 --- --- --- e7.4 e3.0 e6.2 2.0 1.7 13 0.63 0.32 0.34
16 --- --- --- e10 e5.0 5.2 1.8 1.8 9.5 0.64 0.32 0.3617 --- --- --- e12 e10 4.7 1.7 1.8 7.2 0.66 0.23 0.3618 --- --- --- e9.4 e20 4.4 1.7 3.4 5.5 0.66 0.25 0.4019 --- --- --- e7.0 e18 3.7 1.9 6.7 4.3 0.76 0.30 0.3520 --- --- --- e5.6 e14 3.5 1.9 6.0 3.6 0.65 0.25 0.36
21 --- --- --- e4.4 e12 3.2 4.0 7.8 2.9 0.62 0.23 0.3422 --- --- --- e3.4 e10 3.1 11 7.9 2.4 0.61 0.89 0.3423 --- --- --- e5.0 e8.0 2.8 11 21 2.1 0.60 0.48 0.3324 --- --- --- e30 e8.0 2.7 9.0 48 1.9 0.61 0.53 0.3225 --- --- --- e18 e8.0 2.5 7.3 29 1.6 0.64 0.95 0.33
26 --- --- --- e10 e7.6 2.4 5.9 24 1.6 0.63 0.48 0.3227 --- --- --- e7.0 e7.6 2.2 4.9 29 1.5 0.63 0.46 0.2328 --- --- --- e12 e7.4 2.1 4.3 60 1.4 0.46 0.44 0.2129 --- --- --- e220 e7.4 2.1 4.2 58 1.3 0.43 0.41 0.2430 --- --- --- e60 --- 2.0 3.5 40 1.3 0.41 0.39 0.2431 --- --- --- e30 --- 1.9 --- 27 --- 0.40 0.38 ---
TOTAL --- --- --- 544.8 260.0 210.3 97.6 402.0 385.7 23.18 14.01 9.60MEAN --- --- --- 17.6 8.97 6.78 3.25 13.0 12.9 0.75 0.45 0.32MAX --- --- --- 220 20 22 11 60 89 1.2 0.95 0.40MIN --- --- --- 1.8 3.0 1.9 1.4 1.6 1.3 0.40 0.23 0.21AC-FT --- --- --- 1,080 516 417 194 797 765 46 28 19
e Estimated
logical Survey Water Resources Data—Oregon, Water year 2004, Volume 1: Surface Water, p. 158–158.

159
U.S. Geo
UMATILLA RIVER BASIN
14022200 NORTH FORK MCKAY CREEK NEAR PILOT ROCK, OR
LOCATION.--Lat 45°30'24", long 118°36'57", in NE 1⁄4 SE 1⁄4 sec.1, T.1 S., R.33 E., Umatilla County, Hydrologic Unit 17070103, Umatilla Indian Reservation, on left bank 10 mi northeast of Pilot Rock and at mile 0.5.
DRAINAGE AREA.--48.6 mi2.
PERIOD OF RECORD.--May 1973 to December 2003 (discontinued).
GAGE.--Water-stage recorder. Elevation of gage is 1,870 ft above NGVD of 1929, from topographic map.
REMARKS.--No estimated daily discharges. Records good. No regulation. Minor diversion upstream from station.
AVERAGE DISCHARGE.--30 years (water years 1974-2003), 42.8 ft3/s, 31,010 acre-ft/yr.
EXTREMES FOR PERIOD OF RECORD.--Maximum discharge, 1,980 ft3/s Jan. 25, 1975, gage height, 8.48 ft, from floodmark, from rating curve extended above 150 ft3/s on basis of slope-area measurement of peak flow; minimum discharge, 0.22 ft3/s June 26, 1985 (result of temporary construction upstream).
DISCHARGE, CUBIC FEET PER SECOND WATER YEAR OCTOBER 2003 TO SEPTEMBER 2004
DAILY MEAN VALUES
DAY OCT NOV DEC JAN FEB MAR APR MAY JUN JUL AUG SEP
1 0.89 2.0 28 --- --- --- --- --- --- --- --- ---2 0.91 2.0 25 --- --- --- --- --- --- --- --- ---3 0.92 2.0 23 --- --- --- --- --- --- --- --- ---4 0.95 2.0 21 --- --- --- --- --- --- --- --- ---5 0.95 2.0 19 --- --- --- --- --- --- --- --- ---
6 0.95 2.0 29 --- --- --- --- --- --- --- --- ---7 0.96 2.0 35 --- --- --- --- --- --- --- --- ---8 1.0 2.0 33 --- --- --- --- --- --- --- --- ---9 1.0 2.0 31 --- --- --- --- --- --- --- --- ---
10 1.0 2.1 29 --- --- --- --- --- --- --- --- ---
11 1.1 2.2 27 --- --- --- --- --- --- --- --- ---12 1.4 2.2 36 --- --- --- --- --- --- --- --- ---13 1.2 2.2 124 --- --- --- --- --- --- --- --- ---14 1.3 2.2 135 --- --- --- --- --- --- --- --- ---15 1.4 2.2 87 --- --- --- --- --- --- --- --- ---
16 1.6 2.8 69 --- --- --- --- --- --- --- --- ---17 1.3 2.6 55 --- --- --- --- --- --- --- --- ---18 1.2 2.5 50 --- --- --- --- --- --- --- --- ---19 1.2 2.7 44 --- --- --- --- --- --- --- --- ---20 1.2 3.1 40 --- --- --- --- --- --- --- --- ---
21 1.2 3.2 39 --- --- --- --- --- --- --- --- ---22 1.1 3.2 38 --- --- --- --- --- --- --- --- ---23 1.2 3.0 36 --- --- --- --- --- --- --- --- ---24 1.3 3.1 33 --- --- --- --- --- --- --- --- ---25 1.4 3.1 35 --- --- --- --- --- --- --- --- ---
26 1.4 3.2 34 --- --- --- --- --- --- --- --- ---27 1.4 3.2 31 --- --- --- --- --- --- --- --- ---28 1.6 3.1 31 --- --- --- --- --- --- --- --- ---29 1.7 25 30 --- --- --- --- --- --- --- --- ---30 2.0 28 28 --- --- --- --- --- --- --- --- ---31 2.0 --- 28 --- --- --- --- --- --- --- --- ---
TOTAL 38.73 122.9 1,303 --- --- --- --- --- --- --- --- ---MEAN 1.25 4.10 42.0 --- --- --- --- --- --- --- --- ---MAX 2.0 28 135 --- --- --- --- --- --- --- --- ---MIN 0.89 2.0 19 --- --- --- --- --- --- --- --- ---AC-FT 77 244 2,580 --- --- --- --- --- --- --- --- ---
CAL YR2003 TOTAL 17,667.90 MEAN 48.4 MAX 599 MIN 0.46 AC-FT 35040
logical Survey Water Resources Data—Oregon, Water year 2004, Volume 1: Surface Water, p. 159–159.

160
U.S. Geo
UMATILLA RIVER BASIN
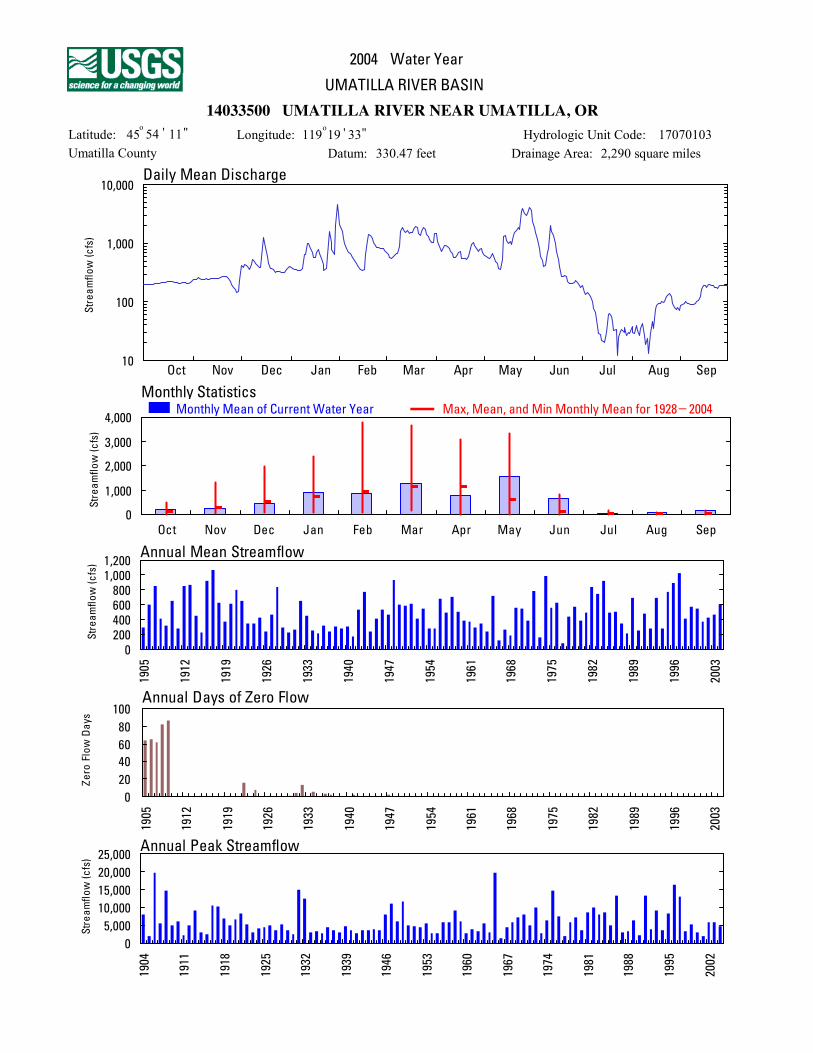
14033500 UMATILLA RIVER NEAR UMATILLA, OR
LOCATION.--Lat 45°54'11", long 119°19'33", in SW 1⁄4 NW 1⁄4 sec.21, T.5 N., R.28 E., Umatilla County, Hydrologic Unit 17070103, on left bank, 1.2 mi southeast of Umatilla, 1.6 mi downstream from West Extension main canal of Umatilla project, and at mile 2.1.
DRAINAGE AREA.--2,290 mi2, approximately.
PERIOD OF RECORD.--October 1903 to current year.
REVISED RECORDS.--WSP 794: Drainage area. WSP 1398: 1909, 1911, 1914, 1928, 1935.
GAGE.--Water-stage recorder. Datum of gage is 330.47 ft above NGVD of 1929. Oct. 21, 1903, to Jan. 25, 1931, nonrecording gage.
REMARKS.--No estimated daily discharges. Records fair. Some regulation since 1927 by McKay Reservoir. Many diversions upstream from station for irrigation of lands upstream and downstream from station; Brownell Canal diverts downstream from station. Diversions since 1908 to Cold Springs Reservoir, an off-channel reservoir, capacity, 52,380 acre-ft. Continuous water-quality records for the period October 1962 to September 1969 have been collected at this location. U.S. Bureau of Reclamation satellite telemeter at station.
AVERAGE DISCHARGE.--77 years (water years 1928-2004), 477 ft3/s, 345,900 acre-ft/yr. Water years prior to 1928 not included in computation of average discharge owing to increased regulation and diversion since 1927.
EXTREMES FOR PERIOD OF RECORD.--Maximum discharge, 19,800 ft3/s Jan. 30, 1965, gage height, 10.75 ft; no flow at times.
EXTREMES FOR CURRENT YEAR.--Peak discharges greater than base discharge of 3,100 ft3/s and maximum (*):
Date TimeDischarge
(ft3/s)Gage height
(ft) Date TimeDischarge
(ft3/s)Gage height
(ft)
Jan 30 0715 *4,650 *5.77 May 29 1300 4,210 5.59May 24 1545 4,400 5.67
Minimum discharge, 7.8 ft3/s, Aug. 12.
DISCHARGE, CUBIC FEET PER SECOND WATER YEAR OCTOBER 2003 TO SEPTEMBER 2004
DAILY MEAN VALUES
DAY OCT NOV DEC JAN FEB MAR APR MAY JUN JUL AUG SEP
1 201 246 427 398 2,110 708 1,470 622 1,850 189 38 842 200 246 392 378 1,570 646 1,100 599 1,510 148 30 893 199 247 439 366 1,220 585 875 579 1,170 134 29 924 200 263 423 356 1,000 558 725 557 831 140 39 995 200 254 403 350 832 589 787 587 608 138 32 91
6 203 250 367 350 698 630 916 690 508 121 27 947 203 249 434 355 680 685 935 554 414 101 35 888 211 250 540 379 637 682 906 488 422 75 42 889 211 251 505 660 574 888 829 450 691 64 27 90
10 213 249 456 656 519 1,610 746 384 832 50 19 92
11 208 249 423 995 465 1,860 670 362 1,980 29 24 10112 217 254 387 982 417 1,600 587 531 1,620 28 13 10413 217 259 392 813 384 1,540 579 1,340 1,350 22 29 12214 219 256 872 696 363 1,630 650 1,370 1,010 21 46 16015 222 255 1,280 578 351 1,480 700 1,110 719 20 35 194
16 231 254 860 568 363 1,520 724 998 534 30 74 19117 231 253 599 717 660 1,520 561 1,080 400 61 84 18218 225 268 452 776 1,140 1,730 562 945 280 63 91 20119 223 271 383 667 1,400 1,920 563 1,360 272 55 91 19920 219 271 371 556 1,390 1,850 541 1,510 288 45 99 192
21 217 276 356 446 1,210 1,460 612 1,680 271 32 97 18622 217 273 322 352 1,060 1,370 828 1,860 225 34 101 18323 211 254 336 372 926 1,610 976 1,750 213 12 123 18224 212 228 337 628 847 1,860 1,040 3,540 210 25 129 17325 215 202 336 1,590 868 1,720 933 3,870 211 31 139 192
26 218 179 325 1,020 838 1,430 819 3,280 217 34 124 19727 218 160 326 776 811 1,310 727 3,000 234 30 92 19528 214 150 328 649 809 1,170 784 3,280 217 36 78 19329 211 154 359 2,020 771 1,030 823 4,090 188 27 72 19330 217 240 371 4,530 --- 1,050 701 3,640 183 30 79 19331 231 --- 411 3,250 --- 1,470 --- 2,380 --- 29 71 ---
TOTAL 6,634 7,211 14,212 27,229 24,913 39,711 23,669 48,486 19,458 1,854 2,009 4,440MEAN 214 240 458 878 859 1,281 789 1,564 649 59.8 64.8 148MAX 231 276 1,280 4,530 2,110 1,920 1,470 4,090 1,980 189 139 201MIN 199 150 322 350 351 558 541 362 183 12 13 84AC-FT 13,160 14,300 28,190 54,010 49,410 78,770 46,950 96,170 38,590 3,680 3,980 8,810
STATISTICS OF MONTHLY MEAN DATA FOR WATER YEARS 1928 - 2004, BY WATER YEAR (WY)
MEAN 111 271 539 720 957 1,162 1,155 617 137 22.3 24.4 47.1MAX 481 1,302 1,948 2,366 3,786 3,678 3,056 3,362 805 149 95.0 153(WY) (1928) (1928) (1974) (1965) (1996) (1972) (1958) (1948) (1950) (1942) (1993) (1998)MIN 4.18 40.2 70.8 89.3 86.7 154 4.56 1.55 1.33 0.81 1.04 0.59(WY) (1978) (1932) (1988) (1930) (1977) (1977) (1968) (1977) (1979) (1985) (1985) (1987)
logical Survey Water Resources Data—Oregon, Water year 2004, Volume 1: Surface Water, p. 160–162.

161UMATILLA RIVER BASIN
14033500 UMATILLA RIVER NEAR UMATILLA, OR—Continued
SUMMARY STATISTICS FOR 2003 CALENDAR YEAR FOR 2004 WATER YEAR WATER YEARS 1928 - 2004
ANNUAL TOTAL 182,469.1 219,826ANNUAL MEAN 500 601 477HIGHEST ANNUAL MEAN 1,026 1997LOWEST ANNUAL MEAN 77.5 1977HIGHEST DAILY MEAN 4,650 Jan 31 4,530 Jan 30 15,600 Jan 30, 1965LOWEST DAILY MEAN 1.3 Jul 29 12 Jul 23 0.00 Apr 20, 1930ANNUAL SEVEN-DAY MINIMUM 1.6 Jul 20 27 Aug 6 0.00 Oct 18, 1931ANNUAL RUNOFF (AC-FT) 361,900 436,000 345,90010 PERCENT EXCEEDS 1,260 1,470 1,33050 PERCENT EXCEEDS 257 363 16090 PERCENT EXCEEDS 12 62 6.2
""TThhiiss ppaaggee ccoonnttaaiinnss cchhaarrttss ggrraapphhiiccaallllyy ppoorrttrraayyiinngg tthhee ttaabbuullaarrddaattaa ccoonnttaaiinneedd oonntthhee2004 Water Year
Annual Days of Zero Flow
020406080
100
5091
2191
9191
6291
3391
0491
7491
4591
1691
8691
5791
2891
9891
6991
3002
Zero
Flow
Day
s
Annual Mean Streamflow
0200400600800
1,0001,200
5091
2191
9191
6291
3391
0491
7491
4591
1691
8691
5791
2891
9891
6991
3002
Stre
amfl o
w( c
fs)
Daily Mean Discharge
10
100
1,000
10,000
Stre
amflo
w(c
fs)
0
1,000
2,000
3,000
4,000
Oct Nov Dec Jan Feb Mar Apr May Jun Jul Aug Sep
Stre
amflo
w(c
fs)
nneesstt ppaaggee.. SSkkiipp ttoo tthhee nneexxtt ppaaggee ttoo ggoo ddiirreeccttllyy ttoo tthhee ttaabbuullaarr ddaattaa.. .. ..""
Annual Peak Streamflow
05,000
10,00015,00020,00025,000
4091
1191
8191
5291
2391
9391
6491
3591
0691
7691
4791
1891
8891
5991
2002
Stre
amflo
w(c
fs)
14033500 UMATILLA RIVER NEAR UMATILLA, OR54Latitude: 45
oLongitude: 119 19
o' '11" 33"
Drainage Area: 2,290 square milesDatum: 330.47 feetHydrologic Unit Code: 17070103
Umatilla County
Monthly StatisticsMonthly Mean of Current Water Year
UMATILLA RIVER BASIN
Max, Mean, and Min Monthly Mean for 1928 2004 _
Oct Nov Dec Jan Feb Mar Apr May Jun Jul Aug Sep
163
U.S. Geo
WILLOW CREEK BASIN
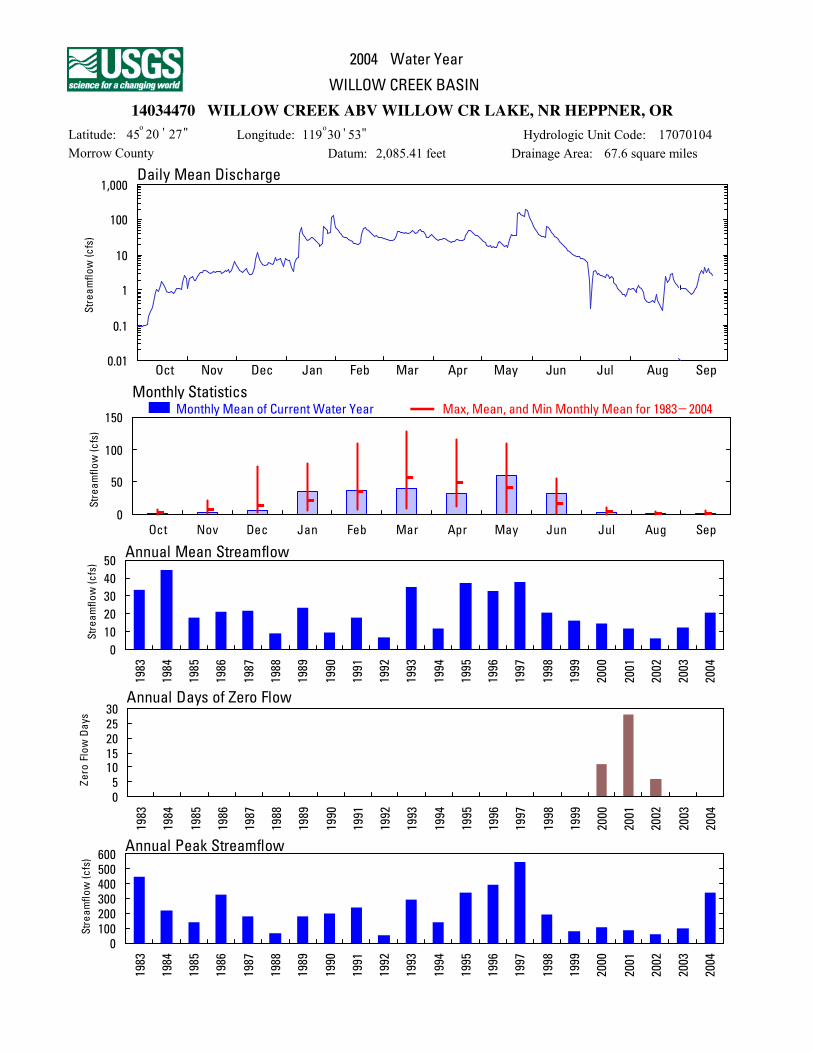
14034470 WILLOW CREEK ABOVE WILLOW CREEK LAKE, NEAR HEPPNER, OR
LOCATION.--Lat 45°20'27", long 119°30'53", in NE 1⁄4 NE 1⁄4 sec.1, T.3 S., R.26 E., Morrow County, Hydrologic Unit 17070104, on right bank 1.5 mi southeast of Heppner, 1.7 mi upstream from Willow Creek dam, and at mile 54.1.
DRAINAGE AREA.--67.6 mi2.
PERIOD OF RECORD.--October 1982 to current year.
GAGE.--Water-stage recorder and crest-stage gage. Datum of gage is 2,085.41 ft above NGVD of 1929 (levels by Corps of Engineers).
REMARKS.--Records fair except for estimated daily discharges, which are poor. Many diversions for irrigation upstream from station. Part of flow of Ditch Creek (John Day River basin) is diverted to Willow Creek upstream from station. Chemical analysis May 1985 to September 1987.
AVERAGE DISCHARGE.--22 years (water years 1983-2004), 20.9 ft3/s, 15,150 acre-ft/yr.
EXTREMES FOR PERIOD OF RECORD.--Maximum discharge, 544 ft3/s Feb. 1, 1997, gage height, 9.60 ft, from crest-stage gage; minimum discharge, no flow several days in August 2000, Aug. 27 to Oct. 7, 2001, and may have been no flow during period of no gage-height record July 31 to Sept. 14, 1988.
EXTREMES FOR CURRENT YEAR.--Peak discharges greater than base discharge of 140 ft3/s and maximum (*):
Date TimeDischarge
(ft3/s)Gage height
(ft) Date TimeDischarge
(ft3/s)Gage height
(ft)
Jan 30 unkn 275 a8.15 May 28 unkn *341 *a8.53
Minimum discharge, 0.08 ft3/s, Oct. 4. a From crest-stage gage.
DISCHARGE, CUBIC FEET PER SECOND WATER YEAR OCTOBER 2003 TO SEPTEMBER 2004
DAILY MEAN VALUES
DAY OCT NOV DEC JAN FEB MAR APR MAY JUN JUL AUG SEP
1 0.09 1.2 5.3 7.8 60 30 35 28 80 8.3 1.0 1.12 0.10 2.3 4.3 7.3 50 29 32 25 63 8.0 1.1 1.13 0.09 2.4 3.8 7.1 43 28 29 23 53 7.7 1.2 1.24 0.09 2.5 3.4 4.6 39 28 27 19 45 7.3 0.91 1.15 0.10 1.9 3.3 3.6 34 27 28 17 39 6.3 1.0 1.0
6 0.10 1.9 3.8 5.8 32 26 29 18 36 2.0 1.3 0.987 0.11 2.6 4.3 8.3 31 25 29 16 35 0.29 1.2 0.798 0.17 3.1 3.4 8.7 29 28 30 17 35 2.1 1.1 0.739 0.24 3.2 3.0 40 27 37 28 17 32 3.4 0.85 0.83
10 0.32 3.2 2.9 62 26 46 26 17 66 3.6 0.58 1.1
11 0.45 3.6 3.0 41 24 46 24 22 60 2.9 0.47 1.212 0.86 3.6 4.6 33 22 44 23 25 51 3.0 0.44 2.113 0.98 3.4 7.7 29 22 44 25 22 44 2.7 0.44 2.914 0.95 3.3 12 27 21 42 24 19 39 2.7 0.47 3.715 1.3 3.1 7.7 28 21 44 29 17 35 2.6 0.53 3.1
16 1.8 3.4 6.5 32 24 40 27 19 31 2.3 0.44 4.517 1.5 3.6 5.7 31 39 43 26 16 28 2.8 0.73 3.318 1.1 3.3 5.2 28 57 43 26 28 25 2.8 0.51 4.119 0.95 3.4 5.0 26 60 50 26 40 22 2.2 0.37 3.320 0.90 3.5 5.6 24 54 47 28 37 19 2.5 0.29 3.0
21 0.81 3.4 6.4 21 49 42 35 36 17 2.2 0.25 2.622 0.92 3.1 6.0 18 44 44 43 35 16 1.7 1.1 2.323 0.80 3.2 5.6 22 40 51 51 e150 14 1.4 2.5 2.124 0.90 3.8 6.0 63 37 52 50 e160 13 1.2 1.7 2.025 1.1 3.4 8.4 58 35 48 45 e145 11 0.98 2.1 1.8
26 1.1 4.0 7.2 49 36 48 41 132 11 0.86 2.9 1.727 1.1 3.3 7.6 42 33 39 37 121 10 0.75 3.0 1.628 1.0 3.7 7.9 43 32 32 37 e200 9.5 0.72 2.0 1.529 1.7 5.5 6.8 e120 32 33 35 e190 9.5 0.66 1.6 1.430 2.6 6.6 4.7 e130 --- 36 30 e120 9.3 0.72 1.3 1.431 2.2 --- 8.0 e85 --- 39 --- 101 --- 1.2 1.3 ---
TOTAL 26.43 98.5 175.1 1,105.2 1,053 1,211 955 1,832 958.3 87.88 34.68 59.53MEAN 0.85 3.28 5.65 35.7 36.3 39.1 31.8 59.1 31.9 2.83 1.12 1.98MAX 2.6 6.6 12 130 60 52 51 200 80 8.3 3.0 4.5MIN 0.09 1.2 2.9 3.6 21 25 23 16 9.3 0.29 0.25 0.73AC-FT 52 195 347 2,190 2,090 2,400 1,890 3,630 1,900 174 69 118
STATISTICS OF MONTHLY MEAN DATA FOR WATER YEARS 1983 - 2004, BY WATER YEAR (WY)
MEAN 3.03 7.42 14.4 21.6 35.6 56.7 48.5 41.0 17.0 3.88 1.34 1.44MAX 7.10 21.2 72.8 78.2 109 128 116 110 55.4 11.2 3.99 6.13(WY) (1983) (1987) (1997) (1997) (1996) (1993) (1984) (1995) (1984) (1993) (1997) (1984)MIN 0.20 1.45 3.15 6.68 7.52 9.81 11.9 2.73 1.60 0.51 0.01 0.00(WY) (1989) (2003) (2002) (1990) (1994) (1988) (1992) (1992) (1992) (2003) (1988) (2001)
logical Survey Water Resources Data—Oregon, Water year 2004, Volume 1: Surface Water, p. 163–165.

164 WILLOW CREEK BASIN
14034470 WILLOW CREEK ABOVE WILLOW CREEK LAKE, NEAR HEPPNER, OR—Continued
SUMMARY STATISTICS FOR 2003 CALENDAR YEAR FOR 2004 WATER YEAR WATER YEARS 1983 - 2004
ANNUAL TOTAL 4,651.16 7,596.62ANNUAL MEAN 12.7 20.8 20.9HIGHEST ANNUAL MEAN 44.3 1984LOWEST ANNUAL MEAN 6.13 2002HIGHEST DAILY MEAN 83 Mar 16 200 May 28 450 Feb 1, 1997LOWEST DAILY MEAN 0.01 Aug 4 0.09 Oct 1 0.00 Aug 11, 2000ANNUAL SEVEN-DAY MINIMUM 0.03 Jul 31 0.10 Oct 1 0.00 Aug 11, 2000ANNUAL RUNOFF (AC-FT) 9,230 15,070 15,15010 PERCENT EXCEEDS 41 46 5750 PERCENT EXCEEDS 4.8 7.8 8.090 PERCENT EXCEEDS 0.08 0.89 0.63
e Estimated
""TThhiiss ppaaggee ccoonnttaaiinnss cchhaarrttss ggrraapphhiiccaallllyy ppoorrttrraayyiinngg tthhee ttaabbuullaarrddaattaa ccoonnttaaiinneedd oonntthhee2004 Water Year
Annual Days of Zero Flow
05
1015202530
3891
4891
5891
6891
7891
8891
98 91
0991
1991
2 991
3991
4 99 1
5991
6991
7991
8991
9991
0002
1002
2002
3002
4002
Zero
Flow
Day
s
Annual Mean Streamflow
01020304050
3891
4891
5891
6891
7891
8891
9891
0991
1991
2991
3991
4991
5991
6991
7991
8991
9991
0002
1002
2002
3002
4002
Stre
amfl o
w( c
fs)
Daily Mean Discharge
0.01
0.1
1
10
100
1,000
Stre
amflo
w(c
fs)
0
50
100
150
Oct Nov Dec Jan Feb Mar Apr May Jun Jul Aug Sep
Stre
amflo
w(c
fs)
nneesstt ppaaggee.. SSkkiipp ttoo tthhee nneexxtt ppaaggee ttoo ggoo ddiirreeccttllyy ttoo tthhee ttaabbuullaarr ddaattaa.. .. ..""
Annual Peak Streamflow
0100200300400500600
3891
4891
5891
6891
7891
8891
9891
0991
1991
2991
3991
4991
5991
6991
7991
8991
9991
0002
1002
2002
3002
4002
Stre
amf lo
w(c
fs)
14034470 WILLOW CREEK ABV WILLOW CR LAKE, NR HEPPNER, OR20Latitude: 45
oLongitude: 119 30
o' '27" 53"
Drainage Area: 67.6 square milesDatum: 2,085.41 feetHydrologic Unit Code: 17070104
Morrow County
Monthly StatisticsMonthly Mean of Current Water Year
WILLOW CREEK BASIN
Max, Mean, and Min Monthly Mean for 1983 2004 _
Oct Nov Dec Jan Feb Mar Apr May Jun Jul Aug Sep

166
U.S. Geo
WILLOW CREEK BASIN
14034490 WILLOW CREEK LAKE AT HEPPNER, OR
LOCATION.--Lat 45°20'50", long 119°32'37", in NW 1⁄4 SE 1⁄4 sec.35, T.2 S., R.26 E., Morrow County, Hydrologic Unit 17070104, U.S. Corps of Engineers land, on top left side of spillway on dam on Willow Creek, 2,000 ft upstream from Court Street bridge and at mile 52.4.
DRAINAGE AREA.--96.6 mi2.
PERIOD OF RECORD.--February 1983 to current year.
GAGE.--Water-stage recorder. Datum of gage is NGVD of 1929 (levels by Corps of Engineers). Prior to Dec. 22, 1983, nonrecording gage at nearby site at present datum. U.S. Geological Survey satellite telemeter at station.
REMARKS.--Lake is formed behind roller-compacted, concrete dam; storage began Feb. 16, 1983. Capacity, 14,020 acre-ft between elevations 2,000.0 ft, sill of outlet gates, and 2,113.5 ft, crest of spillway. Average minimum lake elevation 2,047.0 ft, storing 2,540 acre-ft. Dead storage, 73 acre-ft below elevation 2,000.0 ft. Reservoir used for flood control. Figures given herein represent total contents. U.S. Geological Survey satellite telemeter at station.
COOPERATION.--Capacity table furnished by Corps of Engineers.
EXTREMES FOR PERIOD OF RECORD.--Maximum contents, 7,340 acre-ft May 8, 1995, elevation, 2,083.06 ft; no usable contents at times.
EXTREMES FOR CURRENT YEAR.--Maximum contents, 6,940 acre-ft May 26, elevation, 2,080.72 ft; minimum contents, 3,790 acre-ft Nov. 18, elevation, 2,058.67 ft.
Capacity Table (elevation, in feet and contents, in acre-feet)
2,050 2,840 2,060 3,950 2,070 5,280 2,080 6,8202,055 3,370 2,065 4,590 2,075 6,020
CORRECTION.--The published change in contents for calendar years 1999-2001 and water years 2000-2002 were in error. The correct values are listed below in acre-feet:
WTR YR 1999 AC-FT‡ --- WTR YR 2,000 AC-FT‡ -60 WTR YR 2001 AC-FT‡ -70 WTR YR 2002 AC-FT‡ -810
CAL YR 1999 AC-FT‡ -190 CAL YR 2,000 AC-FT‡ +50 CAL YR 2001 AC-FT‡ -130 CAL YR 2002 AC-FT‡ ---
‡ Change in contents, in acre-feet.
ELEVATION ABOVE NGVD 1929, FEET WATER YEAR OCTOBER 2003 TO SEPTEMBER 2004
DAILY OBSERVATION AT 2400 HOURS
DAY OCT NOV DEC JAN FEB MAR APR MAY JUN JUL AUG SEP
1 2,060.66 2,059.20 2,058.78 2,060.27 2,064.32 2,063.07 2,072.11 2,075.95 2,077.79 2,077.44 2,075.15 2,068.882 2,060.59 2,059.17 2,058.81 2,060.34 2,063.95 2,063.34 2,072.29 2,075.95 2,077.53 2,077.44 2,074.91 2,068.743 2,060.52 2,059.14 2,058.79 2,060.39 2,063.47 2,063.62 2,072.49 2,076.07 2,077.31 2,077.43 2,074.67 2,068.654 2,060.46 2,059.10 2,058.78 2,060.42 2,063.29 2,063.87 2,072.67 2,076.16 2,077.08 2,077.41 2,074.45 2,068.545 2,060.40 2,059.07 2,058.82 2,060.40 2,063.25 2,064.11 2,072.86 2,076.24 2,076.77 2,077.39 2,074.23 2,068.45
6 2,060.33 2,059.03 2,058.82 2,060.42 2,063.19 2,064.34 2,073.06 2,076.33 2,076.44 2,077.30 2,074.01 2,068.367 2,060.27 2,059.01 2,058.85 2,060.46 2,063.10 2,064.54 2,073.25 2,076.40 2,076.23 2,077.18 2,073.79 2,068.268 2,060.20 2,058.98 2,058.85 2,060.52 2,062.98 2,064.78 2,073.46 2,076.48 2,076.18 2,077.13 2,073.59 2,068.179 2,060.12 2,058.97 2,058.85 2,060.88 2,062.89 2,065.16 2,073.66 2,076.57 2,076.30 2,077.09 2,073.39 2,068.08
10 2,060.06 2,058.96 2,058.87 2,060.79 2,062.89 2,065.69 2,073.83 2,076.65 2,076.86 2,077.06 2,073.19 2,067.99
11 2,060.01 2,058.94 2,058.87 2,060.55 2,062.89 2,066.21 2,073.97 2,076.63 2,077.31 2,077.02 2,072.98 2,067.9212 2,059.95 2,058.92 2,058.94 2,060.29 2,062.86 2,066.68 2,074.09 2,076.60 2,077.63 2,076.98 2,072.77 2,067.8313 2,059.90 2,058.90 2,059.06 2,060.39 2,062.83 2,067.16 2,074.29 2,076.53 2,077.85 2,076.94 2,072.57 2,067.7814 2,059.85 2,058.89 2,059.19 2,060.72 2,062.78 2,067.59 2,074.53 2,076.48 2,078.01 2,076.89 2,072.36 2,067.7315 2,059.81 2,058.87 2,059.27 2,061.07 2,062.72 2,068.03 2,074.88 2,076.44 2,078.13 2,076.83 2,072.16 2,067.67
16 2,059.77 2,058.86 2,059.31 2,061.46 2,062.87 2,068.37 2,075.16 2,076.40 2,078.20 2,076.78 2,071.96 2,067.6517 2,059.73 2,058.85 2,059.36 2,061.84 2,062.99 2,068.63 2,075.42 2,076.37 2,078.22 2,076.74 2,071.75 2,067.6518 2,059.67 2,058.85 2,059.39 2,062.18 2,063.28 2,068.88 2,075.67 2,076.55 2,078.20 2,076.69 2,071.55 2,067.6219 2,059.62 2,058.82 2,059.42 2,062.48 2,063.62 2,069.25 2,075.94 2,076.79 2,078.15 2,076.64 2,071.33 2,067.5920 2,059.58 2,058.81 2,059.47 2,062.74 2,063.88 2,069.56 2,076.21 2,076.65 2,078.08 2,076.59 2,071.13 2,067.56
21 2,059.53 2,058.79 2,059.53 2,062.97 2,064.03 2,069.80 2,076.41 2,076.48 2,077.97 2,076.52 2,070.92 2,067.5322 2,059.47 2,058.77 2,059.59 2,063.02 2,064.08 2,070.07 2,076.60 2,076.35 2,077.84 2,076.41 2,070.77 2,067.5023 2,059.41 2,058.76 2,059.67 2,063.09 2,064.05 2,070.40 2,076.68 2,077.67 2,077.69 2,076.32 2,070.58 2,067.4924 2,059.35 2,058.75 2,059.68 2,063.34 2,063.92 2,070.77 2,076.69 2,079.74 2,077.57 2,076.22 2,070.39 2,067.4825 2,059.30 2,058.74 2,059.76 2,063.10 2,063.81 2,071.08 2,076.66 2,080.54 2,077.55 2,076.09 2,070.20 2,067.47
26 2,059.26 2,058.72 2,059.83 2,062.80 2,063.66 2,071.39 2,076.57 2,080.52 2,077.50 2,075.99 2,070.03 2,067.4627 2,059.20 2,058.69 2,059.91 2,062.69 2,063.46 2,071.53 2,076.44 2,080.00 2,077.47 2,075.88 2,069.85 2,067.4528 2,059.18 2,058.70 2,060.02 2,062.74 2,063.27 2,071.59 2,076.39 2,079.67 2,077.43 2,075.77 2,069.67 2,067.4429 2,059.20 2,058.72 2,060.10 2,063.71 2,063.06 2,071.66 2,076.30 2,079.37 2,077.44 2,075.66 2,069.48 2,067.4130 2,059.20 2,058.75 2,060.11 2,064.46 --- 2,071.82 2,076.14 2,078.87 2,077.45 2,075.54 2,069.28 2,067.3931 2,059.20 --- 2,060.19 2,064.52 --- 2,072.00 --- 2,078.15 --- 2,075.37 2,069.10 ---
MAX 2,060.66 2,059.20 2,060.19 2,064.52 2,064.32 2,072.00 2,076.69 2,080.54 2,078.22 2,077.44 2,075.15 2,068.88MIN 2,059.18 2,058.69 2,058.78 2,060.27 2,062.72 2,063.07 2,072.11 2,075.95 2,076.18 2,075.37 2,069.10 2,067.39 (†) 3,860 3,800 3,980 4,520 4,330 5,560 6,190 6,510 6,400 6,070 5,150 4,910 (‡) -180 -60 +180 +540 -190 +1,230 +630 +320 -110 -330 -920 -240
CAL YR 2003 MAX 2,077.00 MIN 2058.69 AC-FT -380WTR YR 2004 MAX 2,080.54 MIN 2058.69 AC-FT +870
† Contents, in acre-fee, at 2400, on last day of month. ‡ Change in contents, in acre-feet.
logical Survey Water Resources Data—Oregon, Water year 2004, Volume 1: Surface Water, p. 166–166.
167
U.S. Geo
WILLOW CREEK BASIN
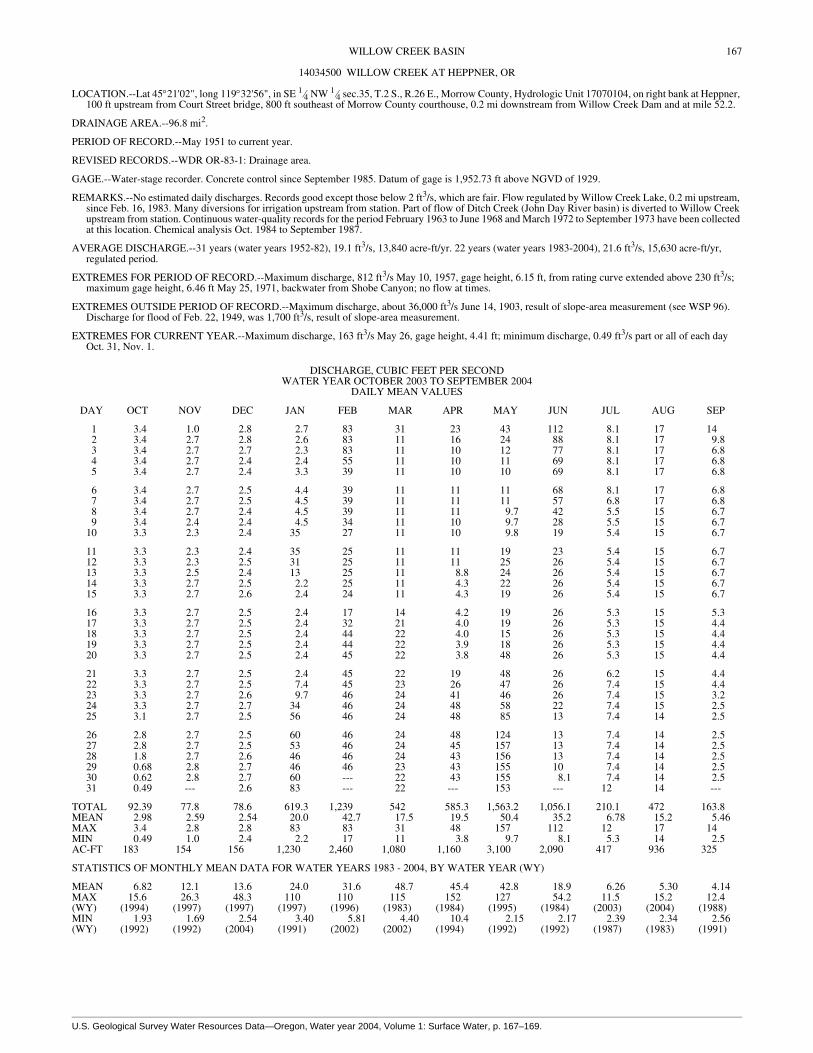
14034500 WILLOW CREEK AT HEPPNER, OR
LOCATION.--Lat 45°21'02", long 119°32'56", in SE 1⁄4 NW 1⁄4 sec.35, T.2 S., R.26 E., Morrow County, Hydrologic Unit 17070104, on right bank at Heppner, 100 ft upstream from Court Street bridge, 800 ft southeast of Morrow County courthouse, 0.2 mi downstream from Willow Creek Dam and at mile 52.2.
DRAINAGE AREA.--96.8 mi2.
PERIOD OF RECORD.--May 1951 to current year.
REVISED RECORDS.--WDR OR-83-1: Drainage area.
GAGE.--Water-stage recorder. Concrete control since September 1985. Datum of gage is 1,952.73 ft above NGVD of 1929.
REMARKS.--No estimated daily discharges. Records good except those below 2 ft3/s, which are fair. Flow regulated by Willow Creek Lake, 0.2 mi upstream, since Feb. 16, 1983. Many diversions for irrigation upstream from station. Part of flow of Ditch Creek (John Day River basin) is diverted to Willow Creek upstream from station. Continuous water-quality records for the period February 1963 to June 1968 and March 1972 to September 1973 have been collected at this location. Chemical analysis Oct. 1984 to September 1987.
AVERAGE DISCHARGE.--31 years (water years 1952-82), 19.1 ft3/s, 13,840 acre-ft/yr. 22 years (water years 1983-2004), 21.6 ft3/s, 15,630 acre-ft/yr, regulated period.
EXTREMES FOR PERIOD OF RECORD.--Maximum discharge, 812 ft3/s May 10, 1957, gage height, 6.15 ft, from rating curve extended above 230 ft3/s; maximum gage height, 6.46 ft May 25, 1971, backwater from Shobe Canyon; no flow at times.
EXTREMES OUTSIDE PERIOD OF RECORD.--Maximum discharge, about 36,000 ft3/s June 14, 1903, result of slope-area measurement (see WSP 96). Discharge for flood of Feb. 22, 1949, was 1,700 ft3/s, result of slope-area measurement.
EXTREMES FOR CURRENT YEAR.--Maximum discharge, 163 ft3/s May 26, gage height, 4.41 ft; minimum discharge, 0.49 ft3/s part or all of each day Oct. 31, Nov. 1.
DISCHARGE, CUBIC FEET PER SECOND WATER YEAR OCTOBER 2003 TO SEPTEMBER 2004
DAILY MEAN VALUES
DAY OCT NOV DEC JAN FEB MAR APR MAY JUN JUL AUG SEP
1 3.4 1.0 2.8 2.7 83 31 23 43 112 8.1 17 142 3.4 2.7 2.8 2.6 83 11 16 24 88 8.1 17 9.83 3.4 2.7 2.7 2.3 83 11 10 12 77 8.1 17 6.84 3.4 2.7 2.4 2.4 55 11 10 11 69 8.1 17 6.85 3.4 2.7 2.4 3.3 39 11 10 10 69 8.1 17 6.8
6 3.4 2.7 2.5 4.4 39 11 11 11 68 8.1 17 6.87 3.4 2.7 2.5 4.5 39 11 11 11 57 6.8 17 6.88 3.4 2.7 2.4 4.5 39 11 11 9.7 42 5.5 15 6.79 3.4 2.4 2.4 4.5 34 11 10 9.7 28 5.5 15 6.7
10 3.3 2.3 2.4 35 27 11 10 9.8 19 5.4 15 6.7
11 3.3 2.3 2.4 35 25 11 11 19 23 5.4 15 6.712 3.3 2.3 2.5 31 25 11 11 25 26 5.4 15 6.713 3.3 2.5 2.4 13 25 11 8.8 24 26 5.4 15 6.714 3.3 2.7 2.5 2.2 25 11 4.3 22 26 5.4 15 6.715 3.3 2.7 2.6 2.4 24 11 4.3 19 26 5.4 15 6.7
16 3.3 2.7 2.5 2.4 17 14 4.2 19 26 5.3 15 5.317 3.3 2.7 2.5 2.4 32 21 4.0 19 26 5.3 15 4.418 3.3 2.7 2.5 2.4 44 22 4.0 15 26 5.3 15 4.419 3.3 2.7 2.5 2.4 44 22 3.9 18 26 5.3 15 4.420 3.3 2.7 2.5 2.4 45 22 3.8 48 26 5.3 15 4.4
21 3.3 2.7 2.5 2.4 45 22 19 48 26 6.2 15 4.422 3.3 2.7 2.5 7.4 45 23 26 47 26 7.4 15 4.423 3.3 2.7 2.6 9.7 46 24 41 46 26 7.4 15 3.224 3.3 2.7 2.7 34 46 24 48 58 22 7.4 15 2.525 3.1 2.7 2.5 56 46 24 48 85 13 7.4 14 2.5
26 2.8 2.7 2.5 60 46 24 48 124 13 7.4 14 2.527 2.8 2.7 2.5 53 46 24 45 157 13 7.4 14 2.528 1.8 2.7 2.6 46 46 24 43 156 13 7.4 14 2.529 0.68 2.8 2.7 46 46 23 43 155 10 7.4 14 2.530 0.62 2.8 2.7 60 --- 22 43 155 8.1 7.4 14 2.531 0.49 --- 2.6 83 --- 22 --- 153 --- 12 14 ---
TOTAL 92.39 77.8 78.6 619.3 1,239 542 585.3 1,563.2 1,056.1 210.1 472 163.8MEAN 2.98 2.59 2.54 20.0 42.7 17.5 19.5 50.4 35.2 6.78 15.2 5.46MAX 3.4 2.8 2.8 83 83 31 48 157 112 12 17 14MIN 0.49 1.0 2.4 2.2 17 11 3.8 9.7 8.1 5.3 14 2.5AC-FT 183 154 156 1,230 2,460 1,080 1,160 3,100 2,090 417 936 325
STATISTICS OF MONTHLY MEAN DATA FOR WATER YEARS 1983 - 2004, BY WATER YEAR (WY)
MEAN 6.82 12.1 13.6 24.0 31.6 48.7 45.4 42.8 18.9 6.26 5.30 4.14MAX 15.6 26.3 48.3 110 110 115 152 127 54.2 11.5 15.2 12.4(WY) (1994) (1997) (1997) (1997) (1996) (1983) (1984) (1995) (1984) (2003) (2004) (1988)MIN 1.93 1.69 2.54 3.40 5.81 4.40 10.4 2.15 2.17 2.39 2.34 2.56(WY) (1992) (1992) (2004) (1991) (2002) (2002) (1994) (1992) (1992) (1987) (1983) (1991)
logical Survey Water Resources Data—Oregon, Water year 2004, Volume 1: Surface Water, p. 167–169.

168 WILLOW CREEK BASIN
14034500 WILLOW CREEK AT HEPPNER, OR—Continued
SUMMARY STATISTICS FOR 2003 CALENDAR YEAR FOR 2004 WATER YEAR WATER YEARS 1983 - 2004
ANNUAL TOTAL 4,092.29 6,699.59ANNUAL MEAN 11.2 18.3 21.6HIGHEST ANNUAL MEAN 45.5 1984LOWEST ANNUAL MEAN 5.99 2002HIGHEST DAILY MEAN 54 Feb 1 157 May 27 306 May 6, 1983LOWEST DAILY MEAN 0.49 Oct 31 0.49 Oct 31 0.48 Aug 4, 1983ANNUAL SEVEN-DAY MINIMUM 1.4 Oct 28 1.4 Oct 28 1.3 Aug 1, 1983ANNUAL RUNOFF (AC-FT) 8,120 13,290 15,63010 PERCENT EXCEEDS 28 46 5250 PERCENT EXCEEDS 5.4 10 9.290 PERCENT EXCEEDS 2.7 2.5 2.8

""TThhiiss ppaaggee ccoonnttaaiinnss cchhaarrttss ggrraapphhiiccaallllyy ppoorrttrraayyiinngg tthhee ttaabbuullaarrddaattaa ccoonnttaaiinneedd oonntthhee2004 Water Year
Annual Days of Zero Flow
Zero
Flow
Day
s
Daily Mean Discharge
0
1
10
100
1,000
Stre
amflo
w(c
fs)
0
50
100
150
200
Oct Nov Dec Jan Feb Mar Apr May Jun Jul Aug Sep
Stre
amflo
w(c
fs)
nneesstt ppaaggee.. SSkkiipp ttoo tthhee nneexxtt ppaaggee ttoo ggoo ddiirreeccttllyy ttoo tthhee ttaabbuullaarr ddaattaa.. .. ..""
Annual Peak Streamflow
Stre
amflo
w(c
fs)
14034500 WILLOW CREEK AT HEPPNER, OR21Latitude: 45
oLongitude: 119 32
o' '02" 56"
Drainage Area: 96.8 square milesDatum: 1,952.73 feet
Hydrologic Unit Code: 17070104Morrow County
Monthly StatisticsMonthly Mean of Current Water Year
WILLOW CREEK BASIN
Annual Mean Streamflow
01020304050
2591
9591
6691
3791
0891
7891
4991
1002
Str e
amflo
w(c
fs)
Max, Mean, and Min Monthly Mean for 1983 2004 _
Oct Nov Dec Jan Feb Mar Apr May Jun Jul Aug Sep
10
100
1,000
10,000
100,000
3091
0191
719 1
4 29 1
1391
8391
5491
2 591
9591
6691
37 91
0891
7891
4991
1002
0102030405060
2591
9591
6691
3 791
0 891
7891
49 91
1002