WATER RESOURCES ASSESSMENT OF … RESOURCES ASSESSMENT OF GODAVARI RIVER BASIN, INDIA ... It is...
16
WATER RESOURCES ASSESSMENT OF GODAVARI RIVER BASIN, INDIA Vaibhav Garg 1 , Ishwar R. Dhumal 2 , Bhaskar R. Nikam 1 , Praveen K. Thakur 1 , S.P. Aggarwal 1 , S.K. Srivastav 1 and A. Senthil Kumar 1 1 Indian Institute of Remote Sensing, 4, Kalidas Road, Dehradun - 248 001, Uttarakhand, India Email: [email protected] 2 Post-Graduate Student, Department of Geography Savitribai Phule Pune University, Ganeshkhind, Pune - 411 007, Maharashtra, India Email: [email protected] KEY WORDS: hydrology, water resources assessment, hydrological model, variable infiltration capacity, water balance ABSTRACT: The Godavari River, rising in the district of Nasik is an important river especially in the state of Maharashtra. The upstream of the basin (Marathwada Region) experience periodic droughts in last decades. Frequent occurrence of these events indicates a shift in the hydrological response of the basin. In this constantly changing environment, the availability and distribution of water will vary in space and time. In order to develop and rationally manage the water resources, an assessment of the quantity and quality of water is necessary. In the present study, a physically based distributed variable infiltration capacity (VIC) hydrological model was used to simulate Godavari River basin hydrologically. An analysis has been carried out to study the impact of changing climate on water balance component for present scenario. To achieve this goal, VIC model was run in water balance mode to estimate the water balance components, runoff, evapotranspiration, baseflow and soil moisture. As the model works at grid scale, in the present analysis, the entire Godavari River basin was transformed in 5 x 5 km grid (10914 run grids). The input files namely meteorological forcing, vegetation parameters and soil parameters, required by VIC model were derived using remote sensing based products and other ancillary data. For topographic parameters like elevation and slope, the GTOPO Hydro 1K digital elevation model at 1 km resolution was used. The soil information were gathered from National Bureau of Soil Survey and Land Use Planning. However, the land use land cover (LULC) data has been procured from ISRO Geosphere Biosphere programme LULC project for year 2005. As per the assessment of LULC data, major part (59.57%) of the basin is covered with agricultural land. The model was forced with meteorological data on daily rainfall, daily maximum temperature, daily minimum temperature and wind speed of Indian Meteorological Department for long term duration. The VIC model performance was found good and a close agreement between the observed and simulated discharge at Bhadrachalam outlet was observed with the coefficient of correlation of 0.947. Other components of water balance like runoff, baseflow, evapotranspiration (ET) and rainfall also varies as the sub-grid distribution of discharge changes. Overall, the mentioned components are highly dependent on the amount of rainfall received over the Godavari basin. As VIC model works on grid basis and compatible with global circulation models, it can be utilised for future climate change impact studies and assessment of future water resources of the basin. Such studies will help planner and manager to draw policies accordingly. 1. INTRODUCTION In this constantly changing environment and uneven distribution of rainfall amount, the availability and distribution of water will vary in space and time. In order to develop and rationally manage the water resources, a quantity and quality assessment of water is necessary. The international Glossary of Hydrology defines Water Resources Assessment (WRA) as the “determination of sources, extent, dependability and quality of water resources for their utilization and control”. In reference to evaluate the dynamics of the water resource related to human impacts or demand, WRA can be used as a water resources evaluation tool. “Water resources assessment aims to measure quantity and quality of the water in a system, including data collection, data validation, and water accounting techniques, using both ground and remote sensing”. Climate change will affect water resources through its impact on the quantity, variability, timing, form, and intensity of precipitation. The assessment of hydrologic responses to climate change is required in watershed management and planning to protect water resources and environmental quality. Additional effects of global climate change that have important implications for water resources include increased evaporation rates, a higher proportion of precipitation received as rain, earlier and shorter runoff seasons, increased water temperatures, and decreased water quality in both inland and coastal areas all over the world. The data is essential and requires high accuracy for systematic WRA of a basin. But practically, it is not possible to obtain the ground observed data as required for the assessment. The advantage of satellite derived data is its
Transcript of WATER RESOURCES ASSESSMENT OF … RESOURCES ASSESSMENT OF GODAVARI RIVER BASIN, INDIA ... It is...
WATER RESOURCES ASSESSMENT OF GODAVARI RIVER BASIN, INDIA
Vaibhav Garg1, Ishwar R. Dhumal
2, Bhaskar R. Nikam
1, Praveen K. Thakur
1, S.P. Aggarwal
1, S.K. Srivastav
1 and A.
Senthil Kumar1
1Indian Institute of Remote Sensing, 4, Kalidas Road, Dehradun - 248 001, Uttarakhand, India
Email: [email protected] 2Post-Graduate Student, Department of Geography Savitribai Phule Pune University, Ganeshkhind, Pune - 411 007,
Maharashtra, India
Email: [email protected]
KEY WORDS: hydrology, water resources assessment, hydrological model, variable infiltration capacity, water
balance
ABSTRACT: The Godavari River, rising in the district of Nasik is an important river especially in the state of
Maharashtra. The upstream of the basin (Marathwada Region) experience periodic droughts in last decades. Frequent
occurrence of these events indicates a shift in the hydrological response of the basin. In this constantly changing
environment, the availability and distribution of water will vary in space and time. In order to develop and rationally
manage the water resources, an assessment of the quantity and quality of water is necessary. In the present study, a
physically based distributed variable infiltration capacity (VIC) hydrological model was used to simulate Godavari
River basin hydrologically. An analysis has been carried out to study the impact of changing climate on water balance
component for present scenario. To achieve this goal, VIC model was run in water balance mode to estimate the water
balance components, runoff, evapotranspiration, baseflow and soil moisture. As the model works at grid scale, in the
present analysis, the entire Godavari River basin was transformed in 5 x 5 km grid (10914 run grids). The input files
namely meteorological forcing, vegetation parameters and soil parameters, required by VIC model were derived using
remote sensing based products and other ancillary data. For topographic parameters like elevation and slope, the
GTOPO Hydro 1K digital elevation model at 1 km resolution was used. The soil information were gathered from
National Bureau of Soil Survey and Land Use Planning. However, the land use land cover (LULC) data has been
procured from ISRO Geosphere Biosphere programme LULC project for year 2005. As per the assessment of LULC
data, major part (59.57%) of the basin is covered with agricultural land. The model was forced with meteorological
data on daily rainfall, daily maximum temperature, daily minimum temperature and wind speed of Indian
Meteorological Department for long term duration. The VIC model performance was found good and a close
agreement between the observed and simulated discharge at Bhadrachalam outlet was observed with the coefficient of
correlation of 0.947. Other components of water balance like runoff, baseflow, evapotranspiration (ET) and rainfall
also varies as the sub-grid distribution of discharge changes. Overall, the mentioned components are highly dependent
on the amount of rainfall received over the Godavari basin. As VIC model works on grid basis and compatible with
global circulation models, it can be utilised for future climate change impact studies and assessment of future water
resources of the basin. Such studies will help planner and manager to draw policies accordingly.
1. INTRODUCTION In this constantly changing environment and uneven distribution of rainfall amount, the availability and
distribution of water will vary in space and time. In order to develop and rationally manage the water resources, a
quantity and quality assessment of water is necessary. The international Glossary of Hydrology defines Water
Resources Assessment (WRA) as the “determination of sources, extent, dependability and quality of water
resources for their utilization and control”. In reference to evaluate the dynamics of the water resource related to
human impacts or demand, WRA can be used as a water resources evaluation tool. “Water resources assessment
aims to measure quantity and quality of the water in a system, including data collection, data validation, and water
accounting techniques, using both ground and remote sensing”. Climate change will affect water resources
through its impact on the quantity, variability, timing, form, and intensity of precipitation. The assessment of
hydrologic responses to climate change is required in watershed management and planning to protect water
resources and environmental quality. Additional effects of global climate change that have important implications
for water resources include increased evaporation rates, a higher proportion of precipitation received as rain,
earlier and shorter runoff seasons, increased water temperatures, and decreased water quality in both inland and
coastal areas all over the world.
The data is essential and requires high accuracy for systematic WRA of a basin. But practically, it is not possible
to obtain the ground observed data as required for the assessment. The advantage of satellite derived data is its
consistency in terms of temporal and spatial extent. Another advantage of the data obtained from remote sensing is
that it can be easily incorporated into the distributed hydrological models. This helps in achieving more accurate
estimates of the Water balance components.
Remote sensing has shown great promise for providing an abundance of data and information that were lacking
with the in-situ observations. It has also been a valuable tool in many hydrologic modelling applications due to its
capability of providing unrestricted collection of information with wide spatial coverage and temporal repeat. The
raw data acquired from satellites when processed using various image processing procedures provide useful and
viable information for successfully estimating various hydro-meteorological and land surface parameters such as
surface temperature, precipitation, evapotranspiration (ET), soil moisture, albedo, land use and land cover
(LULC), leaf area index, elevation, slope, flow direction, etc. derived from satellite data. A number of other
variables relevant to the derivation of energy and moisture fluxes at the land surface can be obtained from remote
sensing applications (Entekhabi et al., 1999). A geographic information system (GIS) is a system for turning large
volumes of spatial data into useful information (Tomlinson, 1972). Remote sensing has held a great deal of
promise for hydrology, mainly because of the potential to observe areas and entire basins rather than merely points
(Dadhwal, 2010).
The application of remotely sensed data is most advantageous in those hydrological analysis exercises where the
data is inadequate due to lack of accessibility to remote regions or the existing techniques do not provide sufficient
or satisfactory information. Spatially distributed Hydrological models such as variable infiltration capacity(VIC)
model takes into consideration the heterogeneity over a vast catchment area for which they require huge amount of
high resolution geographical and temporal data to simulate the water balance of the area effectively. The use of
remote sensing and GIS equips hydrologists with state of the art and cost efficient technology to work efficiently
with spatially and temporally varying complex hydrological processes. GIS has evolved as highly sophisticated
data management system to put together and store the voluminous data typically required for hydrological studies.
GIS helps in generating various hydrological properties from digital elevation model (DEM) such as drainage
network, flow direction map, flow accumulation map, aspect map, stream order, delineation of basin boundary,
etc. Information about hydrologic conditions is of critical importance to real-world applications such as
agricultural production, water resource management, flood prediction, water supply, weather and climate
forecasting, and environmental preservation. The dynamic water resource assessment at the basin/ region level is
the need of hour. Knowledge of available water in the basin will create awareness of utilizing the water efficiently
and to improve the sustainability of the ecosystem. Not all hydrological components of water balance equation can
easily be estimated using available hydrological models. However, remote sensing can give better assessment of
such parameters. It is essential to use both the approach in conjunction for the assessment of water resources at
basin level.
Over these many years, the LULC and the climate have changed to a remarkable extent. WRA which was done
statistically earlier can now be done using sophisticated hydrological model. The world of hydrological modelling
has boomed up such that model like VIC considers the sub-grid variability to calculate the water balance grid wise.
Remote sensing data can easily be incorporated into the model to get more precise results. This methodology of
using remote sensing data and hydrological modelling will definitely help in accomplishing more accurate water
resource assessment. This study uses water balance approach to assess the water resources. The Godavari basin is
chosen for the study based on the drought condition in the basin. The main focus of the study is to assess water
resources in the Upper Godavari Basin as it is drought affected since last decade. Also Godavari is an important
river of Southern India region. The present WRA may enable us to study the impact of climate changes on the
availability of the water resources in future. Change in temperature affects the precipitation, runoff, ET, baseflow,
water discharge (Water Balance Components) of the water resource assessment unit. Hence, study of the effect of
climate changes on hydrology of the unit is important. The influence of climate change can be determined by
comparing the outputs obtained from hydrological models or the satellite data and observed ground data like
discharge at an outlet of the basin.
2. STUDY AREA
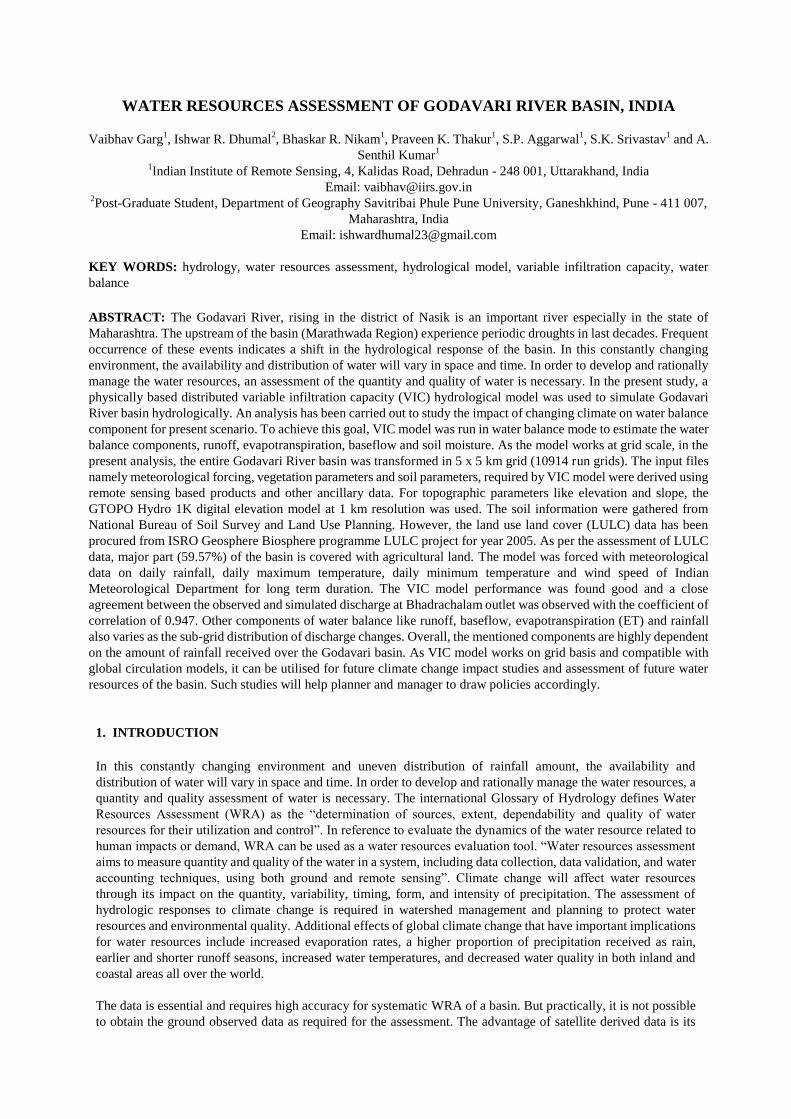
2.1 Location and Physiography The Godavari basin falls in the Deccan Plateau of Southern India lying between 73˚24’ to 83˚4’ East longitudes
and 16˚19’ to 22˚34’ North latitudes. It extends over an area of 312812.00 km2. The basin bounded on the north by
the Mahadeo Hills, the Satmala Hills, on the north-west by the Ajanta Range, on the west by the North Sahyadri
Range of the Western Ghats, on the east and south-east by the Eastern Ghats and on the south by Balaghat Range.
The interior part of the basin lies in Maharashtra Plateau, the greater part of which is at an elevation of 300-600 m
sloping eastward. The eastern part of the basin is majorly covered by the Dandakaranya Range with the Eastern
Ghats forming the eastern part of the eastern boundary of the peninsula. (CWC and NRSC, 2014).
Figure 1. Location of Godavari Basin and mosaic of Landsat 5 FCC of the region
The Godavari is the second largest basin and accounts of nearly 9.5% of the total geographical area of India. It
extends over states of Maharashtra (48.7%), Andhra Pradesh, Telangana (23.7%), Chhattisgarh (12.4%), and
Odisha (5.7%) in addition to smaller parts in Madhya Pradesh (7.8%), Karnataka (1.4%), and Union territory of
Puducherry (0.01%). The geographical setting of the basin is shown in Figure 1. The core components of the water
network include the river Godavari, the largest of the peninsular river and its principal tributaries finally draining
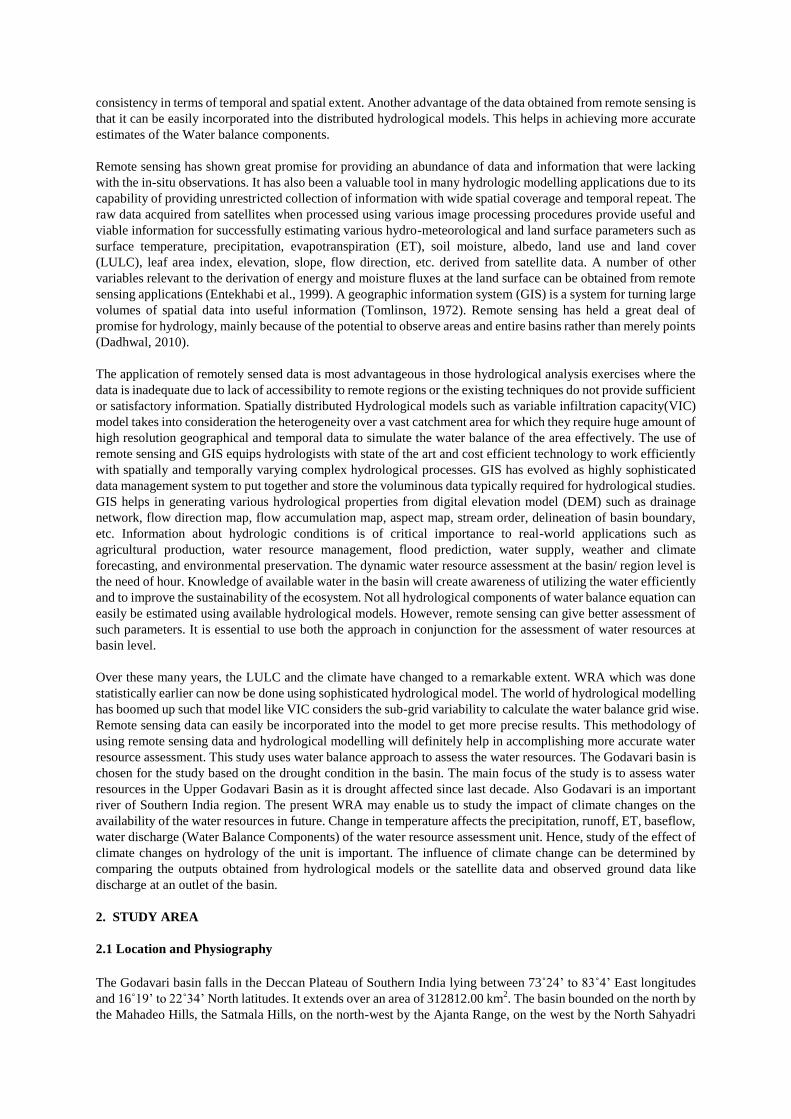
into the Bay of Bengal. The river Godavari rises at an elevation of 1067 m in the Western Ghats near the Triambak
hills in the Nasik district of Maharashtra. The digital elevation map of the basin is shown in Figure 2. The
Godavari receives the waters from the Darna, the Pravara and the Manjra on its right bank whereas from the
Kadwa, the Purna, the Pranhita, the Indravati and the Sabari on its left bank. The drainage map of the basin derived
through hydro-processing of DEM is shown in Figure 3. The Godavari basin receives major part of rainfall during
the south-west monsoon season (months). The delta of the Godavari is gradually extending into the sea and
consists of a wide belt of river borne alluvium.
Figure 2. Elevation Zone Map of the Basin
Figure 3. Drainage Map of Godavari Basin
2.2 Climate
The basin being fairly large, climatic contrasts particularly the variations in the amount of rainfall are obvious.
South-west monsoon sets in by July and ends by September receiving maximum part of its annual rainfall during
it. The monsoon entering through the west and south-west coast of the basin meets the Sahyadri Range sweeps
across the interior of the peninsula. The crest zone of Sahyadri about 25 km wide is the belt of heaviest rainfall in
the Maharashtra region. Regions falling in the rain shadow area of the Sahyadri receive scanty rainfall. The
rainfall, fairly heavy though irregular and unevenly distributed, is mostly caused by the south-west monsoon.
Annual rainfall of the basin varies from 755 mm to 1531mm with an average of 1096.92 mm (Source: IMD). It is
found that the rainfall varies temporally and spatially across the basin. In Godavari basin, the high rainfall zone in
the Western Ghats varies from 1000 to 3000 mm. There is a belt some distance east of the Western Ghats
experiencing less than 600 mm annual rainfall. After this area the rainfall again gradually increases towards the
east coast. However, around 2733 blocks of 22 districts (3-Andhra Pradesh, 2-Madhya Pradesh, 2-Chhattisgarh,
1-Karnatka, and 14-Maharashtra) falling in the basin is drought prone (Source: Drought Prone Areas Program,
DPAP. MoRD, 2002). With a limited latitudinal extent and not so very pronounced vertical range of altitude, the
temperature conditions do not change significantly. The Godavari basin has a tropical climate and the evaporation
losses vary from 1800 to 2440 mm over different parts of the basin (CWC, 1999). The weather in the basin is cold
from mid-October to mid-February and the western and the north-eastern part being colder than the rest of the
basin. The weather is comparatively hotter in the western most parts of the basin in comparison to the Central,
northern and eastern region. Annual maximum temperature varies from 31 °C to 33.5 °C (1969-2004). Maximum
and minimum temperature in the basin gradually increases as we move from west to east. During the last 36 years
the average annual minimum and maximum temperature is 20.53 °C and 32.85 °C, respectively in the basin.
2.3 Others
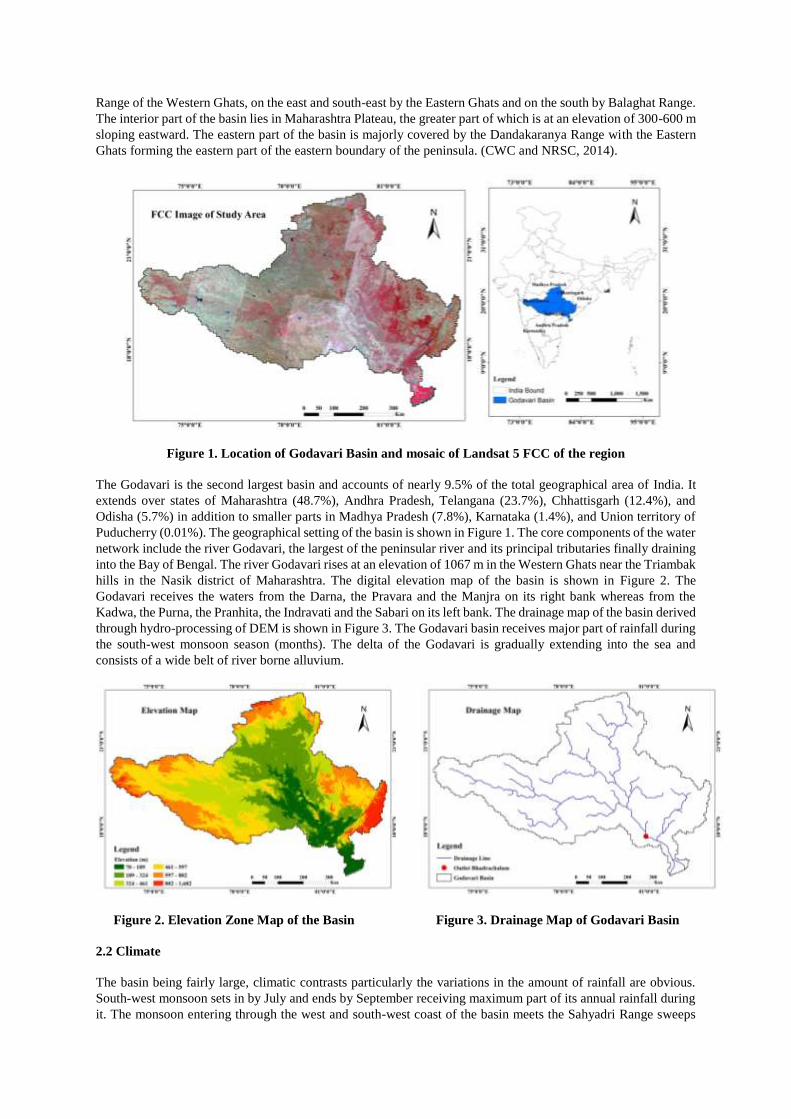
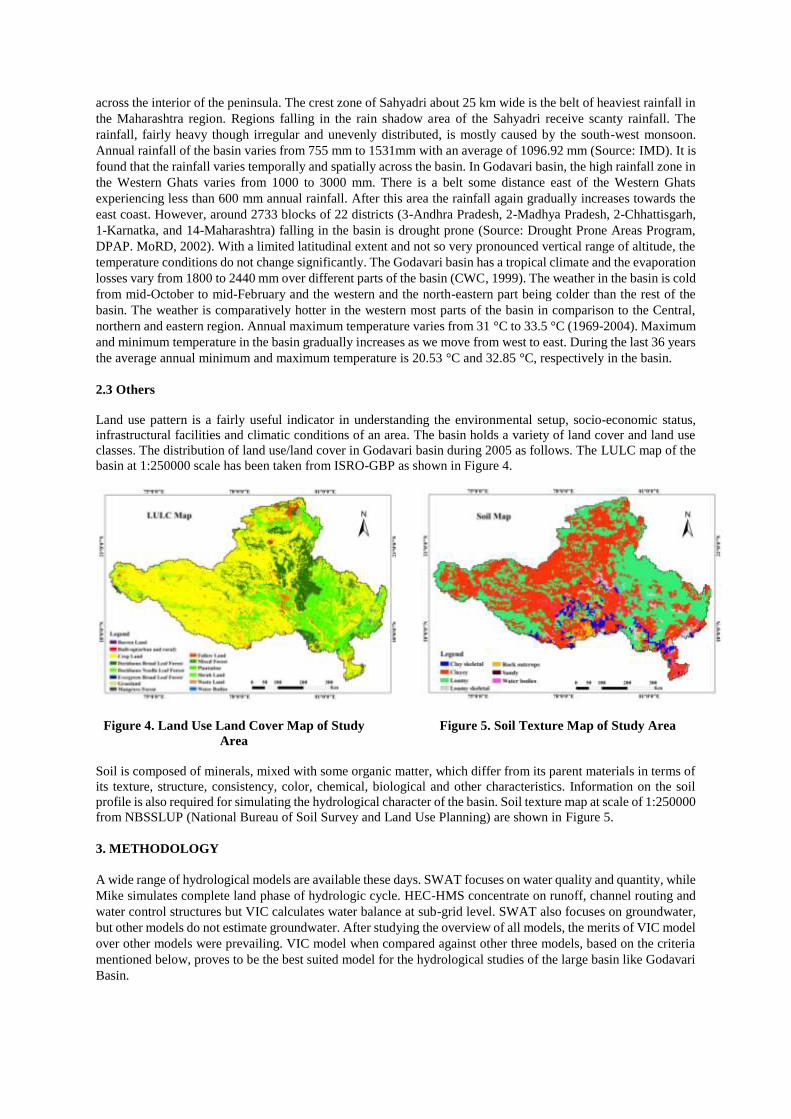
Land use pattern is a fairly useful indicator in understanding the environmental setup, socio-economic status,
infrastructural facilities and climatic conditions of an area. The basin holds a variety of land cover and land use
classes. The distribution of land use/land cover in Godavari basin during 2005 as follows. The LULC map of the
basin at 1:250000 scale has been taken from ISRO-GBP as shown in Figure 4.
Figure 4. Land Use Land Cover Map of Study
Area
Figure 5. Soil Texture Map of Study Area
Soil is composed of minerals, mixed with some organic matter, which differ from its parent materials in terms of
its texture, structure, consistency, color, chemical, biological and other characteristics. Information on the soil
profile is also required for simulating the hydrological character of the basin. Soil texture map at scale of 1:250000
from NBSSLUP (National Bureau of Soil Survey and Land Use Planning) are shown in Figure 5.
3. METHODOLOGY
A wide range of hydrological models are available these days. SWAT focuses on water quality and quantity, while
Mike simulates complete land phase of hydrologic cycle. HEC-HMS concentrate on runoff, channel routing and
water control structures but VIC calculates water balance at sub-grid level. SWAT also focuses on groundwater,
but other models do not estimate groundwater. After studying the overview of all models, the merits of VIC model
over other models were prevailing. VIC model when compared against other three models, based on the criteria
mentioned below, proves to be the best suited model for the hydrological studies of the large basin like Godavari
Basin.

Table 1. Hydrologic Model Specifications (Source: Becker s et al. 2009)
Model HEC-HMS SWAT MIKE VIC
Main Advantage Focus on runoff,
channel routing and
water control
structure
Focus on water quantity
and quality and
representation of
groundwater
Simulates
complete land
phase of
hydrologic cycle
Subgrid
Variability,
Macroscale
model,
large-scale
effects
Main Disadvantage Suitable only for
events not for
long-term
hydrological
simulations
Snow process
representation requires
improvement
Simplified
representation of
forest cover; high
purchase cost
Large grid size,
does not
consider Urban
class in LULC
Runoff Empirical Empirical Physical Physical
Baseflow/
Groundwater
Empirical Empirical Physical Physical
Watershed Scale Small to large Small to large Small to large Medium to large
Climatic Regime Rain or Snow Rain or Snow Rain or Snow Rain or Snow /
mixed
Snow/Glacial Melt Yes Yes Yes Yes
Outputs FH, AY, PF, LF,
SW, ET, WB, SM,
IF, OF, SF, GF, RO.
FH, AY, PF, LF, SW,
ET, WB, SM, IF, WT,
OF, SF, GF, RO, SE,
NF, WQ
FH, AY, PF, LF,
SW, ET, WB,
SM, IF, WT, OF,
SF, GF, RO,
WQ.
FH, AY, PF, LF,
SW, ET, WB,
SM, IF, OF, SF,
GF, RO.
FH = Full hydrograph, AY = Annual yield, PF = Peak flow, LF = Low flow, SW = Snow water equivalent, ET =
Evapotranspiration, WB = Water balance, SM = Soil moisture, IF = Infiltration, WT = Water table, OF =
Overland flow, SF = Shallow subsurface flow, GF = Groundwater flow, RO = Basin total runoff, SE = Sediment
soil erosion, NF = Nutrient fluxes, WQ = Water quality.
As compared to other land surface models, VIC’s distinguishing hydrologic feature are (Gao et al., 2009):
VIC explicitly represents effects of multiple vegetation covers on water and energy budgets and
simultaneously solves full surface energy and water balance giving multiple outputs.
It represents of sub-grid variability in soil moisture storage capacity as a spatial probability distribution,
to which surface runoff is related (Zhao et al., 1980).
It incorporates the representation of sub-grid variability of precipitation with the representation of spatial
variability of infiltration to simulate energy and water budgets (e.g. energy fluxes, runoff, and soil
moisture).
It includes both the saturation and infiltration excess runoff processes in a model grid cell with a
consideration of the sub-grid scale soil heterogeneity (Liang and Xie, 2001).
The further details of the VIC model can be found at Liang et al., (1994); Lohmann et al. (1996); Abdulla et al.
(1996); Wood et al. (1997); Lohmann (1998a); Lohmann (1998b); Lettenmair (2001); Liang et al. (2004);
Aggarwal et al. (2013).
Finally, the daily hydrological simulation of Godavari basin has been carried out using the three soil layered VIC
(VIC-3L) hydrological model to study its hydrological regime adapting the methodology shown in Figure 6. The
basin has been transformed to 5 x 5 km scale grid as shown in Figure 7. Masking of basin and grid map was done
to identify the active grids to be used as an input for the model. Total number of grids formed were 25350 out of
which 10911 grid were on landmass and considered as active/run grids. The details of the model requirements and
data used is presented in the subsequent section.

Figure 6. Flow Chart of the Methodology
3.1. Hydrological Model Parameterisation
As VIC requires land surface characteristics such as soil data, topography and vegetation parameters, the four
major input files: soil parameter, vegetation parameter, vegetation library and forcing files were prepared for each
grid. The soil parameter file used by VIC describes the unique soil properties for each grid cell in the model
domain. It is the main file that identifies the grid cells to be simulated based on their latitudes and longitudes and to
find the forcing files for the particular grid. In the present analysis, soil texture information and bulk densities
were derived from the National Bureau of Soil Survey and Land Use Planning (NBSS&LUP) digitized soil map as
shown in Figure 5. The soil texture class with highest reoccurrence within a grid has been designated as soil
texture class for that particular grid. The assigning of particular soil texture class based on majority of
reoccurrence within a grid shall not make huge difference in the results of macro-scale VIC model. It was found
that generally sand, loam, clay, clay skeletal and loamy skeletal soils were present in the basin as shown in Figure
5.
The parameters such as porosity, saturated soil potential, saturated hydraulic conductivity and the exponent for
each texture class under unsaturated flow condition were calculated for each grid using pedo-transfer functions
suggested by Cosby et al. (1984). The parameters such as thickness of each soil layer, d i; the exponent of the
infiltration capacity curve, binf; and the three parameters in the baseflow scheme: Dsmax is the maximum baseflow
velocity in mm/day, Ds is the fraction of maximum baseflow velocity, and Ws is the fraction of maximum soil
moisture content of the third soil layer at which non-linear baseflow occurs; were used to calibrate the model. The
specific soil characteristics (e.g., field capacity, wilting point, and saturated hydraulic conductivity) for each grid

were obtained from algorithms developed by Cosby et al. (1984), Rawls et al. (1998), and Reynolds et al. (2000)
for each grid. The topograpic parameters namely elevation and slope were derived from GTopo30 (1 km
resolution) digital elevation model (http://edc.usgs.gov/products/elevation/gtopo30/gtopo30.html) as shown in
Figure 2.
Figure 7. Grid Map of Godavari Basin
The vegetation parameter and vegetation library files were prepared from LULC maps developed under
ISRO-GBP LULC project for the year 2005 at a 1:250,000 scale. From this data, the land cover types and their
fraction of the grid cell occupied by each are identified, as described by Maurer et al. (2001ab) in the model
domain. Leaf area index (LAI) is the important characteristic of the land cover that affects the VIC model
hydrological simulation. The monthly mean LAI corresponding to each vegetation class has been picked from the
Moderate Resolution Imaging Spectroradiometer (MODIS) data product on LAI
(http://ladsweb.nascom.nasa.gov/data/search.html). The LAI values for a particular LULC class will change
seasonally, hence, intra-annual variations in vegetation characteristics have been incorporated at monthly time
scale using monthly LAI for respective classes. Rooting depth for each LULC class is also specified, which
enables, shorter crops and grasses draw moisture from the upper soil layers, and tree roots from the deeper soil
layer. The additional parameters including roughness length and displacement height (in m), architectural
resistance (in s/m), and minimum stomatal resistance (in s/m) for each vegetation tile were assembled based on
Global Land Data Assimilation System database (http://ldas.gsfc.nasa.gov/gldas/GLDASmapveg.php). The
vegetative composition (from any land-cover classification scheme) correspond to each grid cell is described in
vegetation parameter file which uses the same grid cell numbering as the soil file. This file cross-indexes each
vegetation tile to the classes listed in the vegetation library
(http://www.hydro.washington.edu/Lettenmaier/Models/VIC/).
Initially, the VIC-3L model was forced with observed surface meteorological data which include daily
precipitation, daily minimum temperature, daily maximum temperature and daily wind speed for 2 years (2008 -
2009) at daily time step for calibration against observed average discharge available at India Water Resources
Information System (IndiaWRIS) for outlet at Bhadrachalam. Later, the calibrated model was forced with same
meteorological parameters for period (2010 – 2012) with vegetation parameter files of each 2005 under
consideration. The forcing file for each year has been prepared using Indian Meteorological Department (IMD)
gridded data (Rajeevan et al., 2005) on rainfall (0.25˚ x 0.25˚) and temperature (1˚ x 1˚).
3.2 Calibration and Validation of Model Outputs
Many of the parameters for VIC model are based on satellite observations or geological surveys, some of them are
either so heterogeneous in space that in situ measurements cannot capture the large-scale "effective" values, or are
more conceptual (such as soil layer boundaries) and do not correspond to actual physically-observable quantities.
For these parameters, we either must make assumptions about their values or calibrate them (find optimal values
for them) that minimize the differences between model output and observations. VIC model and routing model are
two parts of one larger modelling framework. Both models contain parameters that require either calibration or a
priori estimates of their values. The total set of calibration parameters from the two models can be quite large, so
by making educated guesses about some of them we reduce the number of parameters to calibrate. The most
common observation to use for calibration is streamflow. To use streamflow to calibrate VIC model parameters,
we must convert VIC's simulated runoff and baseflow into simulated discharge using the routing model
(presumably using reasonable estimates for the routing model parameters). It is also possible to calibrate the
model to match other observations such as in situ measurements of soil moisture, ET, or satellite observations of
soil moisture, inundation. For these, obviously the routing model need not be executed.
Although the VIC model contains many parameters, it is more appropriate to adjust some of these parameters
during calibration than others. Often the distinction is based on the degree to which the parameter values can
actually be measured or observed. The parameters most often adjusted during calibration of the VIC model
include, binf, Ds, Ws, Dsmax and soil depth. Definition of those parameters is given below:
Ds (value is >0 to 1), the fraction of Dsmax where non-linear (rapidly increasing) baseflow begins. With
a higher value of Ds, the baseflow will be higher at lower water content in lowest soil layer
Dsmax (value is >0 to ~30, depends on hydraulic conductivity), the maximum baseflow that can occur
from the lowest soil layer (in mm/day)
Ws (value is >0 to 1), the fraction of the maximum soil moisture (of the lowest soil layer) where
non-linear baseflow occurs. This is analogous to Ds. A higher value of Ws will raise the water content
required for rapidly increasing, non-linear baseflow, which will tend to delay runoff peaks
binf(value is >0 to ~0.4), this parameter defines the shape of the variable infiltration capacity curve. It
describes the amount of available infiltration capacity as a function of relative saturated grid cell area. A
higher value of binf gives lower infiltration and yields higher surface runoff.
Soil depth (of each layer) (typically value is 0.1 to 1.5 meters), soil depth effects many model variables.
In general, for runoff considerations, thicker soil depths slow down (baseflow dominated) seasonal peak
flows and increase the loss due to evapotranspiration.
Soil parameter file describes the characteristics of each soil layer for each grid cell which also include
grid cell information. The soil parameter file information can be referred to
http://www.hydro.washington.edu/Lettenmaier/Models/VIC/Documentation/SoilParam.shtml
In this study, calibration was done taking into account above mentioned factors’ effect on water balance
components. 5 parameters were changed several times for period 2008-2010, and model was run again to see the
changes. After each model run expected parameters: discharge was checked. Process was repeated till the values
very close to the observed.
4. RESULTS AND DISCUSSION
In this study a methodology consisting of preparation of inputs and running the hydrologic model with calibration
and validation was adopted to generate water balance components of Godavari basin for years 2010-2012.
Executed in water balance mode, the VIC model estimates the water balance components. As we all know that the
climate conditions are changing with time, the effect of change in meteorology on water balance components is
studied. To study the effect of climate change on hydrology of the Godavari basin, the model was setup with 4
meteorological forcing like maximum and minimum temperature, precipitation and wind speed. The model was
forced with 3 years data on these parameter (2010-2012).
4.1 Model Calibration
The estimated discharge at the outlet near Bhadrachalam was calibrated against observed discharge data available
at India WRIS for period 2008-2010. Trial and error calibration method is being used and the calibrated values of
binf, Ds, Ws are shown in Table 2.
Table 2. VIC Calibration parameters, their range and calibrated value
Parameter Range/ Value Calibrated Value
Ds >0 to 1 0.3
Ws >0 to 1 0.9
binf 0 to ~0.4 0.3
Selected parameters are systematically adjusted to achieve an acceptable match between observed and calculated
discharge values. In the present study, correlation coefficient has been chosen as calibration criteria as shown in
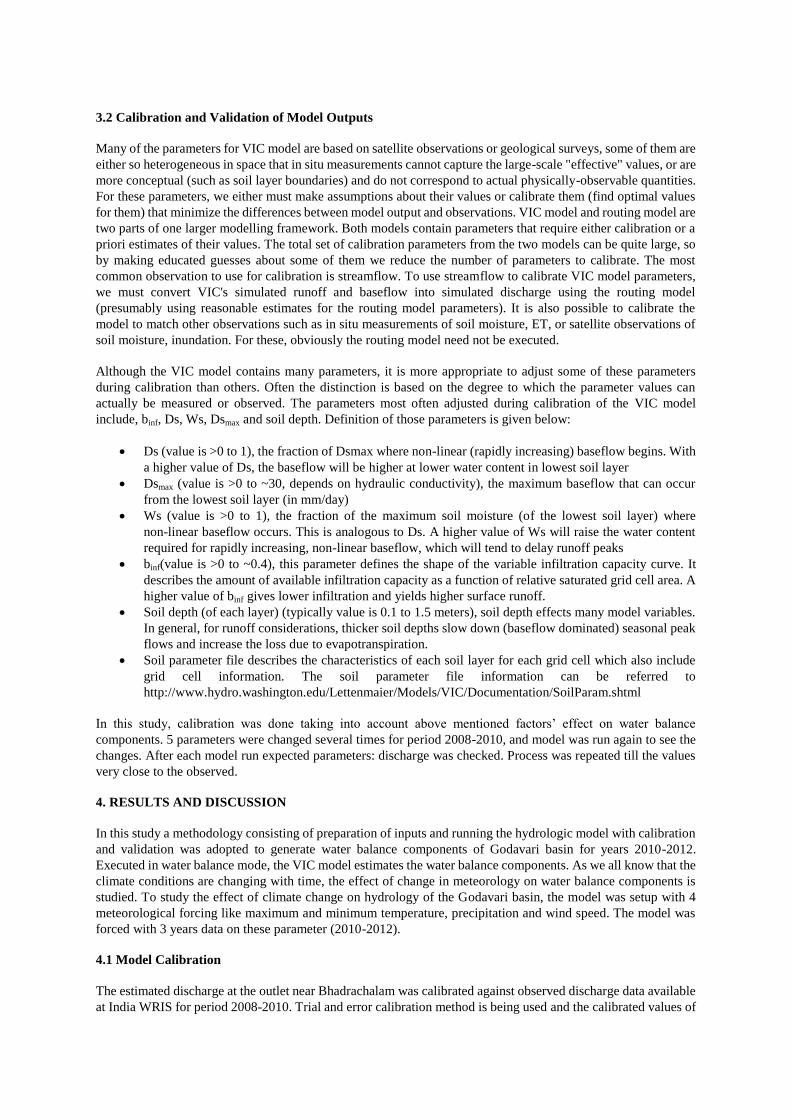
Figures 8 & 9.
Figure 8. Discharge comparisons with observed and simulated
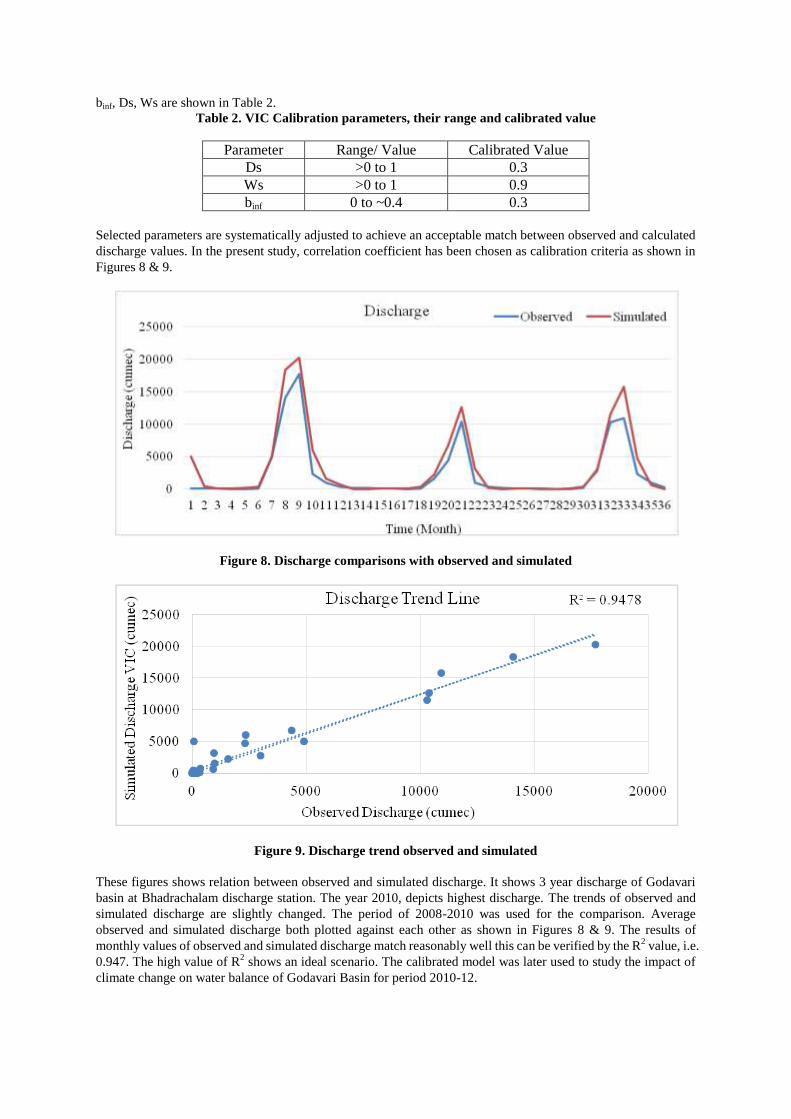
Figure 9. Discharge trend observed and simulated
These figures shows relation between observed and simulated discharge. It shows 3 year discharge of Godavari
basin at Bhadrachalam discharge station. The year 2010, depicts highest discharge. The trends of observed and
simulated discharge are slightly changed. The period of 2008-2010 was used for the comparison. Average
observed and simulated discharge both plotted against each other as shown in Figures 8 & 9. The results of
monthly values of observed and simulated discharge match reasonably well this can be verified by the R2 value, i.e.
0.947. The high value of R2 shows an ideal scenario. The calibrated model was later used to study the impact of
climate change on water balance of Godavari Basin for period 2010-12.

4.2 Impact of Climate Change on Water Balance Components
Rainfall is the most important factor that influences all water balance of discharge, runoff, baseflow and ET. The
basin average monthly rainfall values for the year of 2010, 2011 and 2012 are given in Figure 10a. The graph
clearly shows that the Godavari basin received less rainfall in 2011 creating drought like conditions. The year
2010 recorded highest amount of rainfall over the complete basin followed by rainfall in 2012. These values are
highly correlated to discharge. So, it is easy to say that change in rainfall has a direct influence on discharge and
other water balance components. The total rainfall in year 2010, 2011 and 2012 was 1390.28 mm, 911.31mm and
1109.59 mm, respectively.
(a)
(b)

(c)
(d)
Figure 10. Average Estimated Rainfall, Runoff, Baseflow and Evapotranspiration for period 2010-2012
The trend of runoff as a water balance component is highly dependable on the amount of rainfall received over the
entire river basin. The average runoff value for the year of 2010, 2011 and 2012 is as given in Figure 10b. The yearly
trend shows that, as the average rainfall value was high in 2010, the runoff values are also high for the entire year.
Similarly, for 2011, the rainfall recorded was minimum resulting in lesser runoff values. For the year 2012, the runoff
recorded is greater than that of the year 2011. This is mainly because the average rainfall recorded was higher. The
total runoff from the basin in year 2010, 2011 and 2012 was 418.23 mm, 200.71mm and 296.55 mm, respectively.
It has been observed that rainfall plays a governing role in influencing water balance components. This trend is again
visible while studying baseflow for the years 2010, 2011 and 2012 (see Figure 10c). The overall behaviour depicts
that 2010 has the highest distribution of baseflow as the rainfall recorded for that year was high. As rainfall values
drop for the year 2011, the distribution of baseflow also decreases. For the year 2012, as the rainfall increases the
baseflow also shows an increase in distribution. This clearly suggests that rainfall and baseflow are correlated values
with positive influence. The total baseflow in years 2010, 2011 and 2012 was found to be 194.54 mm, 63.55 mm and
109.67mm, respectively.
Evapotranspiration is influenced by 2 factors, rainfall and wind speed. The values of ET are always higher than that of
runoff. The trend shown in Figure 10d, shows that for the year 2010, the distribution was highest over the basin. As
rainfall decreases for the year 2011, ET distribution also lessens. The distribution pattern increases over the basin as
rainfall recorded increases for the year 2012. It should be noted that the factor of wind speed is computed by VIC
model and that is considered for the prediction and calculation of ET. Due to more rainfall in year 2010 the soil is

considered to be more saturated as compared to 2011 and 2012. That is why more runoff, baseflow, and ET were
observed in year 2010. The total estimated ET in year 2010, 2011 and 2012 was 834.36 mm, 678.68 mm and 695.21
mm, respectively.
Further Analysis has been done to study the spatial variation in all these water balance components. Figure 11 a-c
shows distribution of rainfall for the years 2010, 2011 and 2012 respectively. Grid wise trend clearly shows that the
upper Godavari basin has less rainfall distribution as compared to lower basin. The total rainfall recorded in the
Godavari basin was low, however, the rainfall recorded in the lower basin was slightly higher. This trend may be an
effect of coastal disturbances in the region in the year 2011.
(a)
(b)
(c)
Figure 11. Total Rainfall for period 2010-2012
(a)
(b)
(c)
Figure 12. Total Runoff for period 2010-2012
Figure 12 a-c shows distribution of runoff for the years 2010, 2011 and 2012 respectively. Runoff value depends on
the amount of rainfall. The trend shows that the runoff distribution is uneven over the entire basin with higher values

tending to fall in the lower basin. This trend cannot justify the behaviour over the entire gridded Godavari basin.
Figure 13 a-c shows distribution of ET for the years 2010, 2011 and 2012, respectively. Figure 13a shows lower
amounts of ET while Figure 13b&c shows mixed distribution of ET amount. As in year 2011, the rainfall was very
low, whether makes root zone of the vegetation dry, which further intern reduces transpiration. So, the less ET has
been observed in year 2011 as compared to 2010 and 2011.
(a)
(b)
(c)
Figure 13. Total ET for year 2010-2012
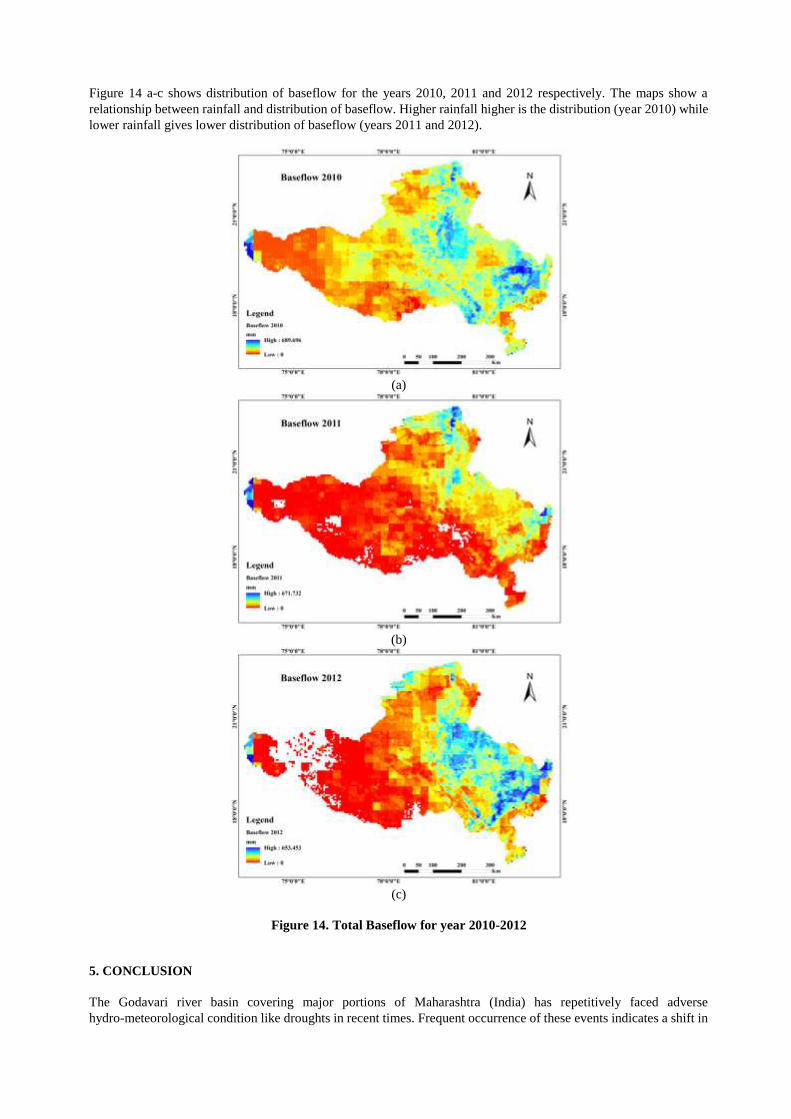
Figure 14 a-c shows distribution of baseflow for the years 2010, 2011 and 2012 respectively. The maps show a
relationship between rainfall and distribution of baseflow. Higher rainfall higher is the distribution (year 2010) while
lower rainfall gives lower distribution of baseflow (years 2011 and 2012).
(a)
(b)
(c)
Figure 14. Total Baseflow for year 2010-2012
5. CONCLUSION
The Godavari river basin covering major portions of Maharashtra (India) has repetitively faced adverse
hydro-meteorological condition like droughts in recent times. Frequent occurrence of these events indicates a shift in

hydrological response of the basin.
VIC model was designed as the model with highest precision. Main advantages of VIC over other models were that it
simulates on sub-grid basis, it considers the non-linear baseflow, and it takes into account the LULC at a sub-grid
level. VIC is distributed macroscale model. Also VIC calculates water balance at sub-grid level and estimates the
water balance of the grid as a sum of all sub-grids. The VIC model was setup at 5 km×5 km grid for entire Godavari
basin. It was found that 10911 grids fall in the Godavari basin. The topographic parameter were derived from GTopo
DEM. The soil map for soil properties was taken from NBSSLUP, where as LULC map has be taken from ISRO GBP.
Then the model was run for meteorological forcing for period 2010-2012 at daily time step. The variation in water
balance components was studied under different climatic conditions. These factors prove that the output of calibrated
and observed values of water balance components obtained from VIC are better. The output clearly suggests and
verifies that the water balance component of discharge holds true for the observed and calibrated stages with R2 near
to unity (R2=0.947).
Other components of water balance like runoff, baseflow, ET and rainfall also varies as the sub-grid distribution of
discharge changes. Overall, the mentioned components are highly dependent on the amount of rainfall received over
the Godavari basin. The distribution of the water balance components for the year 2010, 2011 and 2012 suggest that
the upper Godavari basin has draught like condition due to irregular and less rainfall pattern. The scenario is not the
same for regions falling in the lower basin. The average rainfall value, though high is not distributed evenly over the
entire basin. The lower basin received higher rainfall as compared to upper basin resulting in higher average rainfall
amount. The total rainfall, runoff, baseflow and ET in the years 2010, 2011 and 2012 were estimated as 1390.28 mm,
911.31mm, 1109.59 mm; 418.23 mm, 200.71 mm, 296.55 mm; 194.54 mm, 63.55 mm, 109.67mm; and 834.36 mm,
678.68 mm, 695.21 mm, respectively.
The future prediction over the region may have a similar trend as observed in current scenario. The amount of rainfall
will have an important verdict in either over or underestimation of water balance components. A study can be carried
out for the future prediction of these components on the basis of predicted meteorological models.
6. REFERENCES
Aggarwal, S.P., Garg, V., Gupta, P.K., Nikam, B.R., Thakur, P.K. and Roy P.S. (2013). Runoff potential assessment
over Indian landmass: A macro-scale hydrological modeling approach. Current Science, 104(7), pp. 950-959.
Abdulla, F.A., Lettenmaier, D.P., Wood, E.F. et al. 1996. Application of a macroscale hydrologic model to estimate
the water balance of the Arkansas-Red river basin. J Geophys Res. 101(D3), pp. 7449-7459.
Beckers, J., Smerdon, B. and Wilson, M. 2009. Review of hydrologic models for forest management and climate
change applications in British Columbia and Alberta. Forum for Research and Extension in Natural Resources
Society (FORREX) Series 25, Kamloops, British Columbia, Canada [electronic resource].
Cosby, B.J., Hornberger, G.M., Clapp, R.B. et al. 1984. A statistical exploration of the relationships of soil moisture
characteristics to the physical properties of soils. Water Resour Res. 20(6), pp. 682-690.
CWC 2009. Integrated Hydrological Data Book (Non-Classified River Basins). Hydrological Data Directorate,
Information System Organisation, Water Planning, Projects Wing, Central Water Commission, Govt. of India, New
Delhi.
CWC and NRSC 2014. Godavari Basin Report Version 2.0. Ministry of Water Resources, Government of India.
Dadhwal, V.K., Aggarwal, S.P. and Misra, N. 2010. Hydrological Simulation of Mahanadi River Basin and Impact of
Landuse/Landcover Change on Surface Runoff Using A Macro Scale Hydrological Model. In proceedings of ISPRS
TC VII Symposium - 100 years ISPRS (Wagner W and Szekely B (eds.)). Vienna, Austria, July 5 - 7, ISPRS,
XXXVIII(7B), pp. 165 - 170.
Gao, Z., Xhang, Z. and Zhang, X. 2009. Responses of water yield to changes in vegetation at a temporal scale. Front.
Forestry China 4(1), pp. 53–59.
Lettenmaier, D.P. 2001. Macroscale Hydrology: Challenges and Opportunities. In Present and Future of Modeling
Global Environmental Change: Toward Integrated Modeling (Matsuno T and Kida H (eds.)). TERRAPUB, Tokyo,
Japan, pp. 111-136.
Liang, X. and Xie, Z.H. 2003. Important factors in land-atmosphere interactions: surface runoff generations and
interactions between surface and groundwater. Global Planet Change 38(1-2), pp. 101-114.
Liang, X., Guo, J. and Leung, L.R. 2004. Assessment of the effects of spatial resolutions on daily water flux
simulations. Journal of Hydrology 298(1-4), pp. 287-310.

Liang, X., Lattenmaier, D.P., Wood, E.F. et al. 1994. A simple hydrologically based model of land surface, water, and
energy flux for general circulation models. J. Geophys. Res. 99(D7), pp. 14,415-14,428.
Lohmann, D., Nolte-Holube, R. and Raschke, E. 1996. A large scale horizontal routing model to be coupled to land
surface parameterization schemes. Tellus 48A, pp. 708-721.
Lohmann, D., Raschke, E., Nijssen, B. et al. 1998a. Regional scale hydrology: I. Formulation of the VIC-2L model
coupled to a routing model. Hydrological Sciences Journal 43(1), pp. 131-141.
Lohmann, D., Raschke, E., Nijssen, B. et al. 1998b. Regional scale hydrology: II. Application of the VIC-2L model to
the Weser river, Germany. Hydrological Sciences Journal 43(1), pp. 143-158.
Rajeevan, M., Bhate, J., Kale, J.D. et al. 2005 Development of a high resolution Daily gridded rainfall data for the
Indian region. Met. Monograph Climatology No. 22/2005, National Climate Center, India Meteorological
Department, Pune.
Rawls, W.J., Gimenez, D. and Grossman, R. 1998. Use of soil texture, bulk density, and slope of the water retention
curve to predict saturated hydraulic conductivity. Transactions of the ASABE 41(4), pp. 983-988.
Reynolds, C.A., Jackson, T.J. and Rawls, W.J. 2000. Estimating soil water-holding capacities by linking the Food and
Agriculture Organization soil map of the world with global pedon databases and continuous pedotransfer functions.
Water Resour Res. 36(12), pp. 3653-3662.
Wood, E.F., Lettenmaier, D., Liang, X. et al. 1997. Hydrological modeling of continental-scale basins. Annu Rev
Earth Planet Sci. 25, pp. 279-300.
Zha,o R-J., Zhang, Y.L., Fang, L.R. et al. 1980. The Xinanjiang model. Hydrological Forecasting Proceedings Oxford
Symposium, IAHS, International Association of Hydrological Sciences Press, Wallingford, UK (1980), pp. 351–356.