Water resources
51
Our Water Resources
-
Upload
prathyush-premshankar -
Category
Technology
-
view
109 -
download
0
Transcript of Water resources

Our Water Resources

Resources and ManThe Malthusian trapThe kinds of resources– renewable resources– Nonrenewable resources– Potential ly renewable resources
The nature of exhaustibility
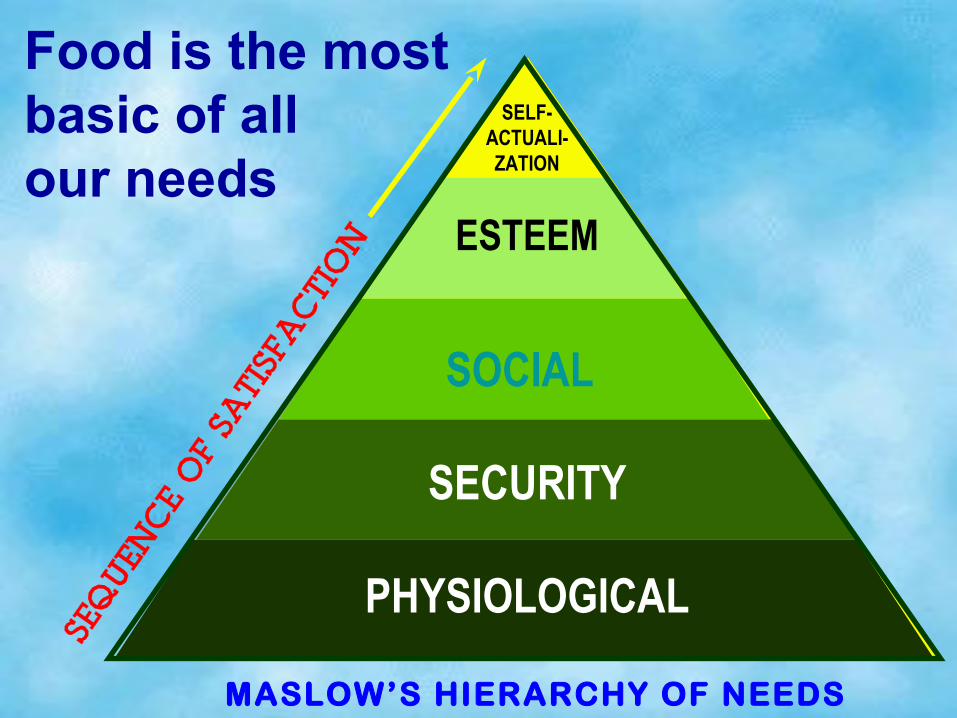
SELF-ACTUALI-ZATION
SOCIAL
SECURITY
PHYSIOLOGICAL
ESTEEM
Food is the most basic of allour needs
MASLOW’S HIERARCHY OF NEEDS

Thomas Malthus
increases in geometric increases in geometric progression, the progression, the resources to sustain this resources to sustain this growth do not. Thus, if growth do not. Thus, if population grows too population grows too much faster than food much faster than food production, this growth production, this growth is checked by famine, is checked by famine, disease, and war.disease, and war.
Thomas Malthus (1766-1834)Thomas Malthus (1766-1834)InIn “An Essay on the Principles of “An Essay on the Principles of Population”Population”, , published in 1798,published in 1798, Thomas Thomas Malthus argued that while populationMalthus argued that while population

This should ordinarily signal disaster. Take the case of wolves and moose at Isle Royale National Park, Lake Superior, for instance.
3000
4000
5000
1000
2000
1900 1920 198019601940 2000
50
3040
20100
The sustainable levels forIsle Royale inhabitants
Wo
l f po
pu
latio
nM
oo
se p
op
ula
tio
n
18000
15
30
45
1850 1900 1950 2000Source: A. Maddison, Monitoring the World Economy 1820-1992 (OECD, Paris, 1995).
Economy
Population
Re
lati
ve t
o t
he
1820
leve
l
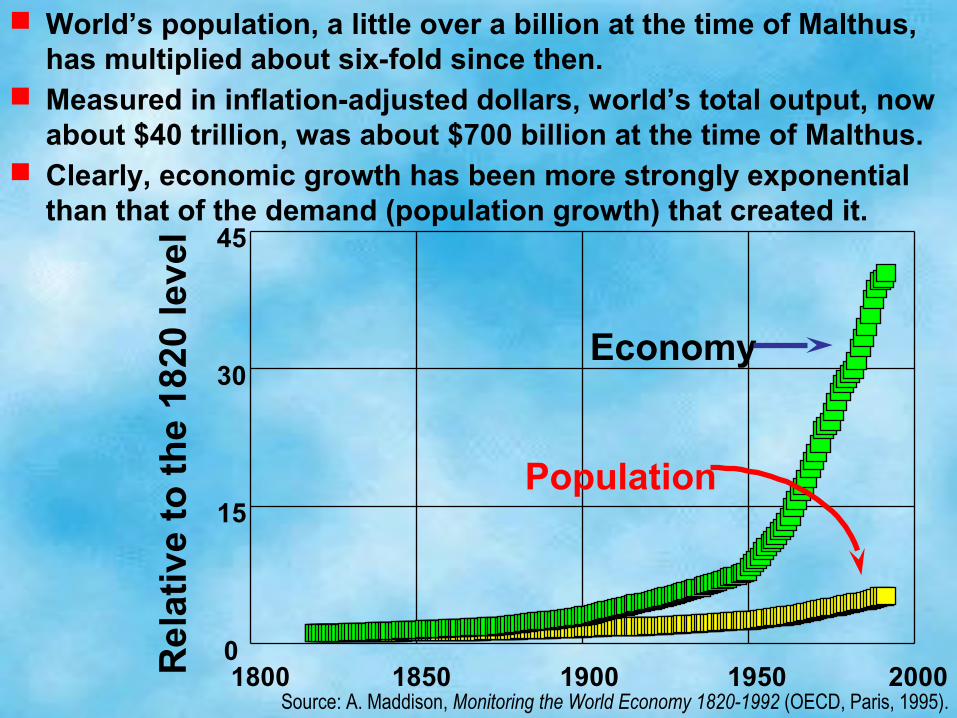
World’s population, a little over a billion at the time of Malthus, has multiplied about six-fold since then.
Measured in inflation-adjusted dollars, world’s total output, now about $40 trillion, was about $700 billion at the time of Malthus.
Clearly, economic growth has been more strongly exponential than that of the demand (population growth) that created it.
0
2
4
6
1950 1960 1970 1980 1990 2000
Valu
es r
ela
tiv
e t
o 1
95
0
Gross World Product
World Grain Production
World Population
0
2
4
61 2 3
World Grain OutputG
ros
s W
orl
d P
rod
uc
t
0
1
2
3
Wo
rld P
op
ulatio
n
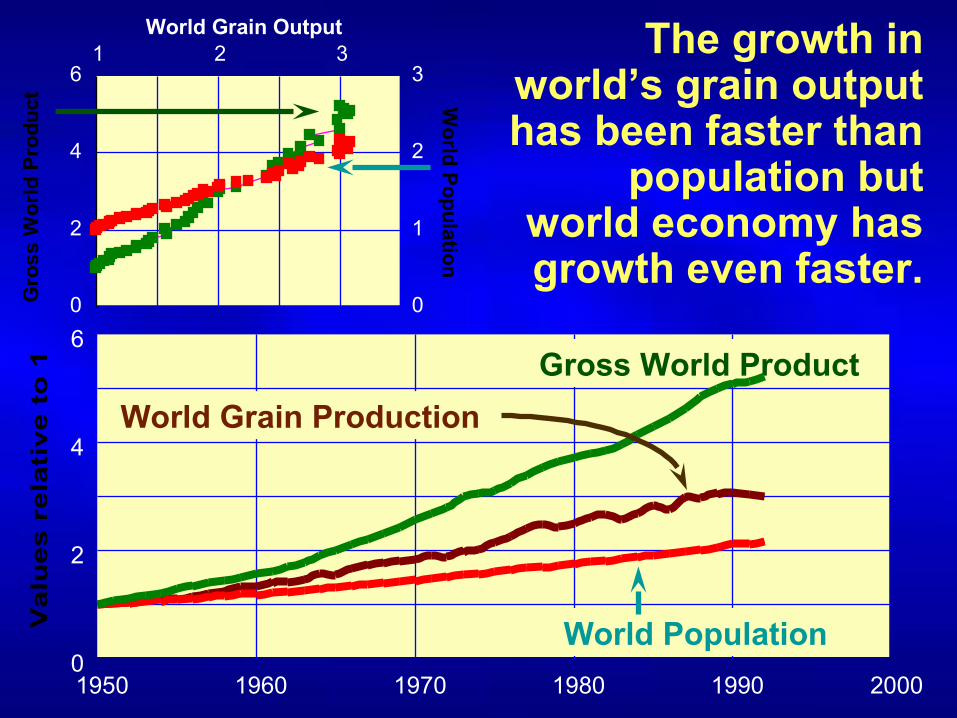
The growth in world’s grain output has been faster than
population but world economy has growth even faster.

Adam Smith (1723-1790),Adam Smith (1723-1790),
Wealth of NationsWealth of Nations (1776), (1776), that every individual in that every individual in pursuing his or her own pursuing his or her own good is led, as if by an good is led, as if by an invisible hand, to invisible hand, to achieve the best good achieve the best good for all. Therefore any for all. Therefore any interference with free interference with free competition by the competition by the government is almost government is almost certain to be injurious.certain to be injurious.
the British philosopher and economist, the British philosopher and economist, argued, in his celebrated treatise argued, in his celebrated treatise An An Inquiry into the Nature and Causes of theInquiry into the Nature and Causes of the

First Green Revolution in this century took place in developed countries
during 1950-70.
First Green Revolution
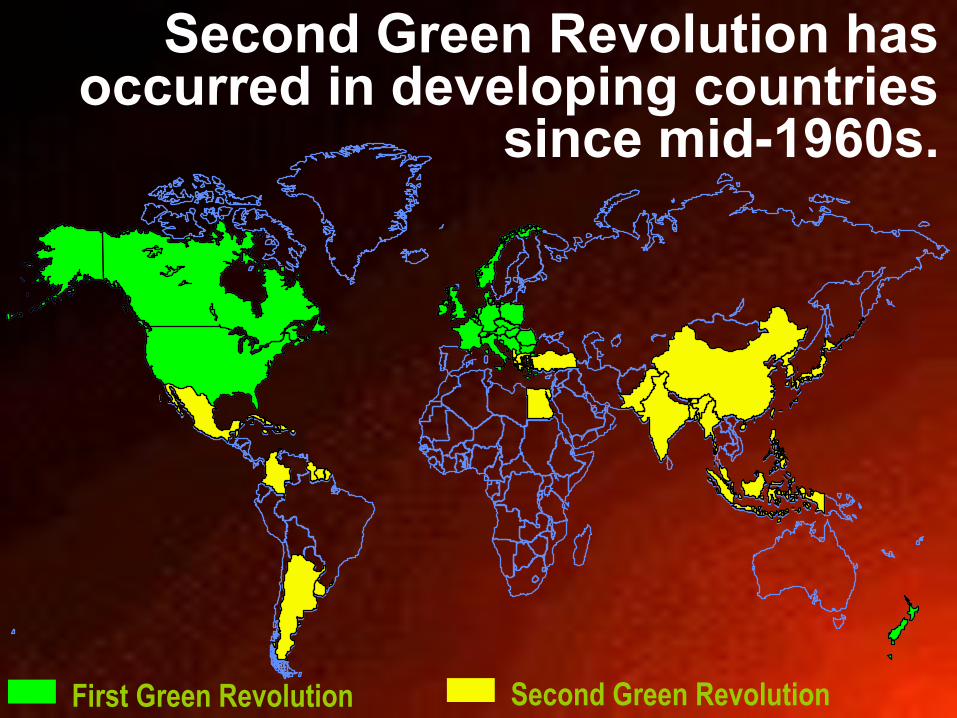
Second Green Revolution has occurred in developing countries
since mid-1960s.
Second Green RevolutionFirst Green Revolution

0.5
1.0
1.5
2.0
1940 1960 1980 2000
100
200
300
400 Pe
r Ca
pita
Gra
in A
va
ilab
ility (k
g p
er y
ea
r) W
orld
Gra
in P
rodu
ctio
n (b
illio
n to
ns p
er y
ear)
Despite the tremendous strides in world grain pro-duction, per capita grain availability has remained unchanged since the mid-1970s*.
*Lester R. Brown: “Facing the Prospect of Food Scarcity” in STATE OF THE WORLD 1997 (Worldwatch Institute, 1997)

Currently,the annual food production
world-wide, including grains,
poultry, seafood and meat,
is about 4 bil l ion tons per year, orabout 4½ lbs per person per day.

from ~1500 lbs per year in America, to
But per capita food consumption varies, worldwide,
~1000 lbs per yearin Mediterranean/Middle East region, and
about 500 lbs per year in India and South Asia.

Being largelystenohumid as well asstenothermal,agriculturalcrops imposea rather restrictedrange of climatic conditions. Farmland therefore tends to be in short supply.
Mea
n A
nnua
l Tem
pera
ture
(C
) o
0
15
30
Mean annual precipitation (cm)
0 400
Tropical Forest
Des
ert G
rass
land
Arctic and alpinetreeless areas
100 200 300
Farmland
Coniferous Forest(green year-round)
Deciduous Forest(seasonal loss of leaves)

Oceans (71%)
Land(29%)
Most of theEarthiscoveredby water
“...water, water, every wherenor any drop to drink!”
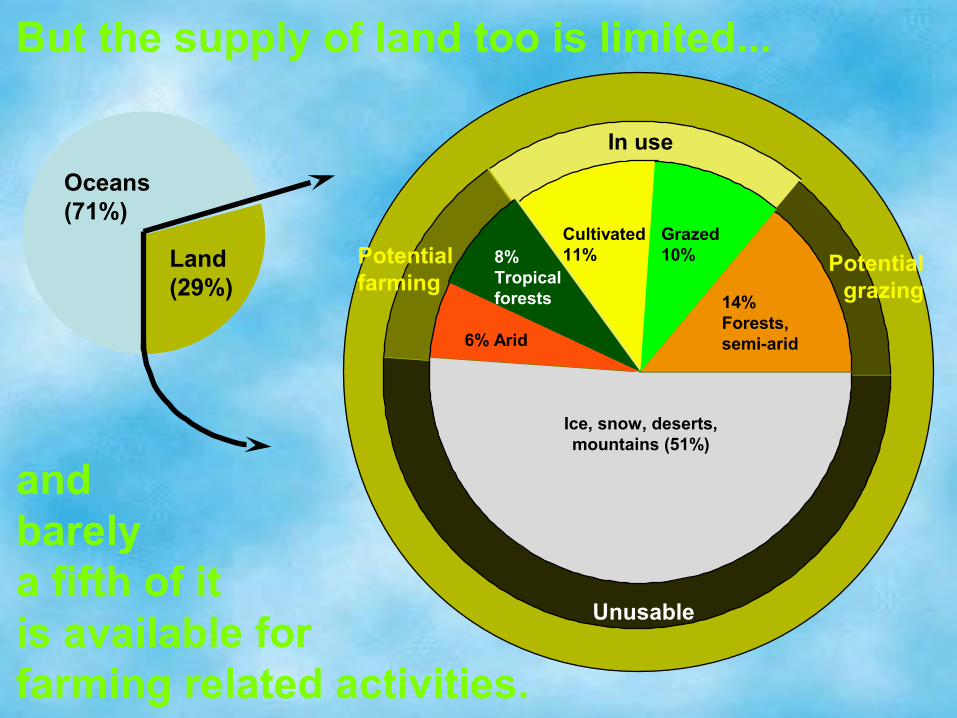
In use
Potentialfarming
Unusable
Potentialgrazing
Cultivated11%
Grazed10%
14%Forests, semi-arid6% Arid
Ice, snow, deserts,mountains (51%)
8%Tropicalforests
Oceans (71%)
Land(29%)
andbarely a fifth of itis available forfarming related activities.
But the supply of land too is limited...

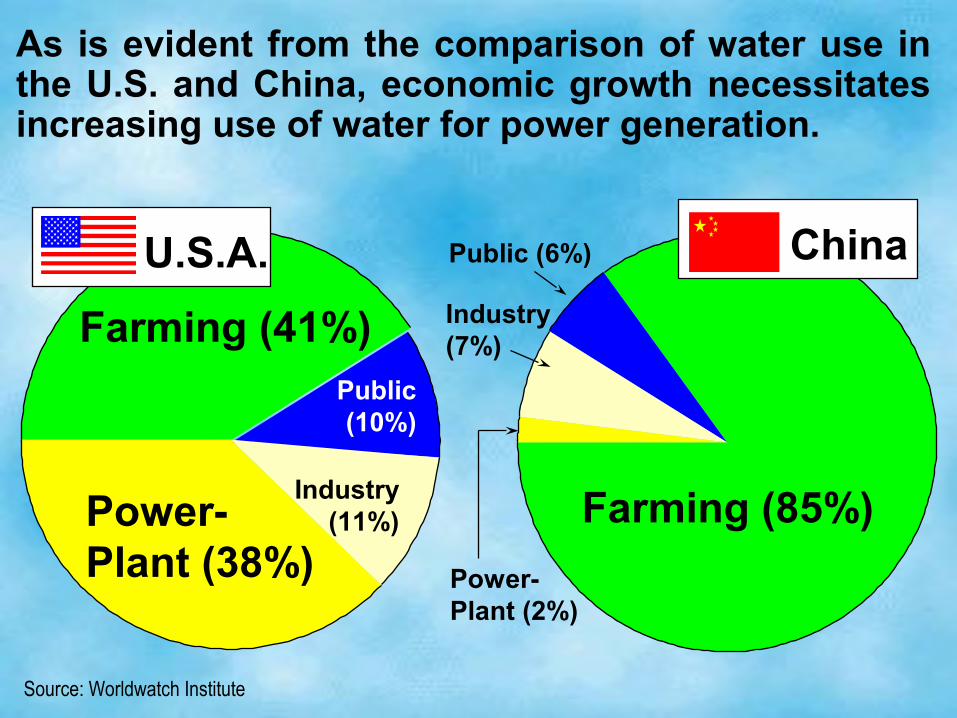
Economic growth exacerbates the demand for water, e.g.,
• with economic growth at 7-10% per year, poultry consumption is rising at the rate of 15% per year in India, Indonesia and China − the water demands of this nontraditional industry are only likely to grow;
• we need about 250,000 gallons of water to produce a ton of corn, 375,000 gallons to produce a ton of wheat, 1,000,000 gallons to produce a ton of rice, and 7,500,000 of water to produce a ton of beef.

Farming (41%)Public(10%)
Industry(11%)Power-
Plant (38%)Farming (85%)
Public (6%)
Industry(7%)
Power-Plant (2%)
U.S.A. China
•to which we should also add industry’s needs.
Source: Worldwatch Institute
this comparison of U.S. and China shows how economic growth necessitates increased use of
water for nonagricultural purposes.

How much How much water do water do we have?we have?

http://ww2010.atmos.uiuc.edu/(Gh)/guides/mtr/hyd/smry.rxml
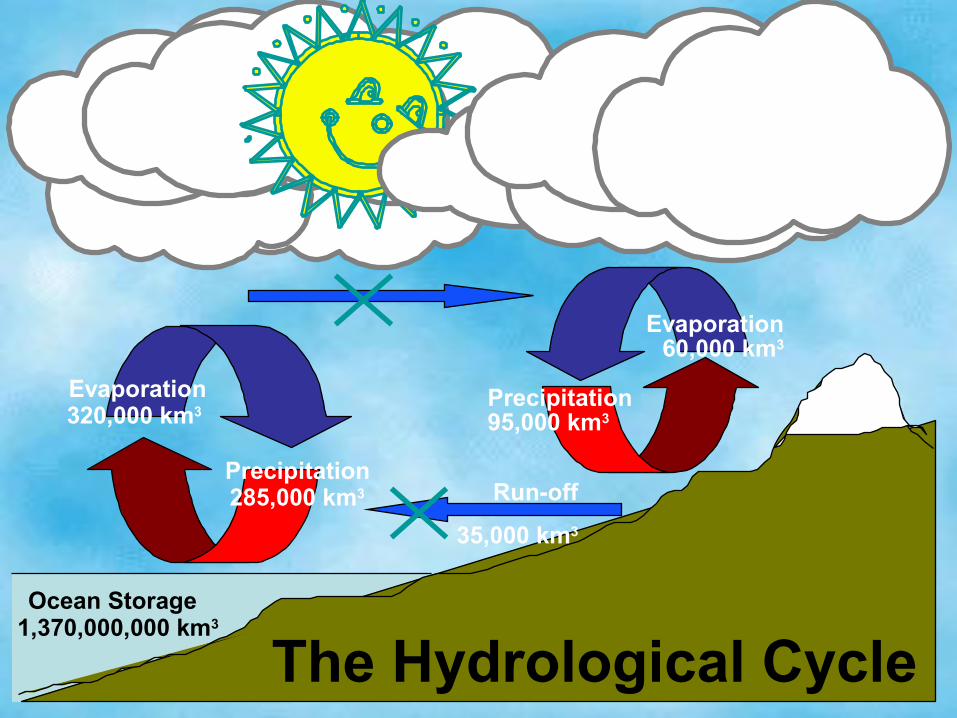
The hydrological cycleIgnoring such long-term effects as the changes in atmospheric storage conditions, run-off filling the ocean basins etc., hydro-logicalcycle ismerelythe re-cycling of waterbetweenland andoceans.

How much water in the hydrosphere?Conventional estimate assumesa total groundwater storage of about 1,700 quadrillion gallons. This gives the estimate of hydrosphere’s total water content as 3.5x10²⁰ gallons.
Oceans (97%)
Ice (1.2%)
Underground water (0.5%)Surface water (0.02%)
Atmosphericmoisture (0.001%)

An alternate assumption is that pores in sediments contain about 80,000 quadrillion gallons of groundwater (almost 50 times the conventional estimate). This yields an estimate of about 4x10²⁰ gallons of water in the entire hydroshere.
Oceans (80%)
Ground-water (19%)
Groundwater (19%)
Ice (1%)Surface water (0.002%)
Atmosphere(0.001%)
Farming (41%)Public(10%)
Industry(11%)Power-
Plant (38%)Farming (85%)
Public (6%)
Industry(7%)
Power-Plant (2%)
U.S.A. China
As is evident from the comparison of water use in the U.S. and China, economic growth necessitates increasing use of water for power generation.
Source: Worldwatch Institute
0.6
0.3
- 0.3
0.0
- 0.61900 1950 2000
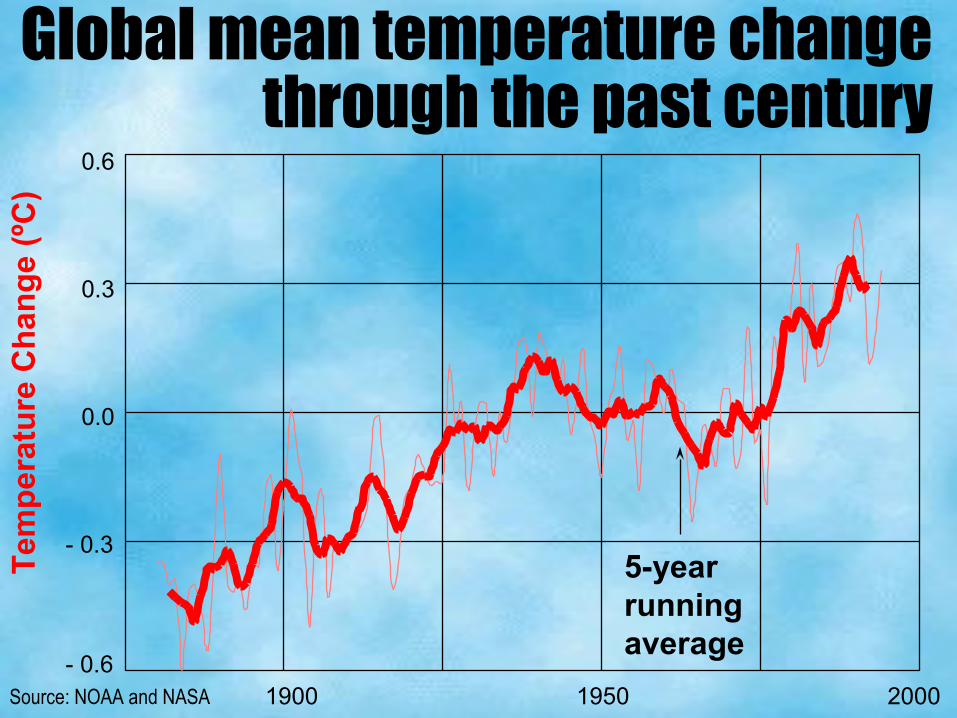
Global mean temperature change through the past century
Source: NOAA and NASA
5-yearrunningaverage
Tem
pe
ratu
re C
ha
ng
e (
ºC)
Se
a l
ev
el
rela
tiv
e t
o 1
95
1-7
0 (
cm
)
8
0
4
-12
-8
-4
1900 20001950
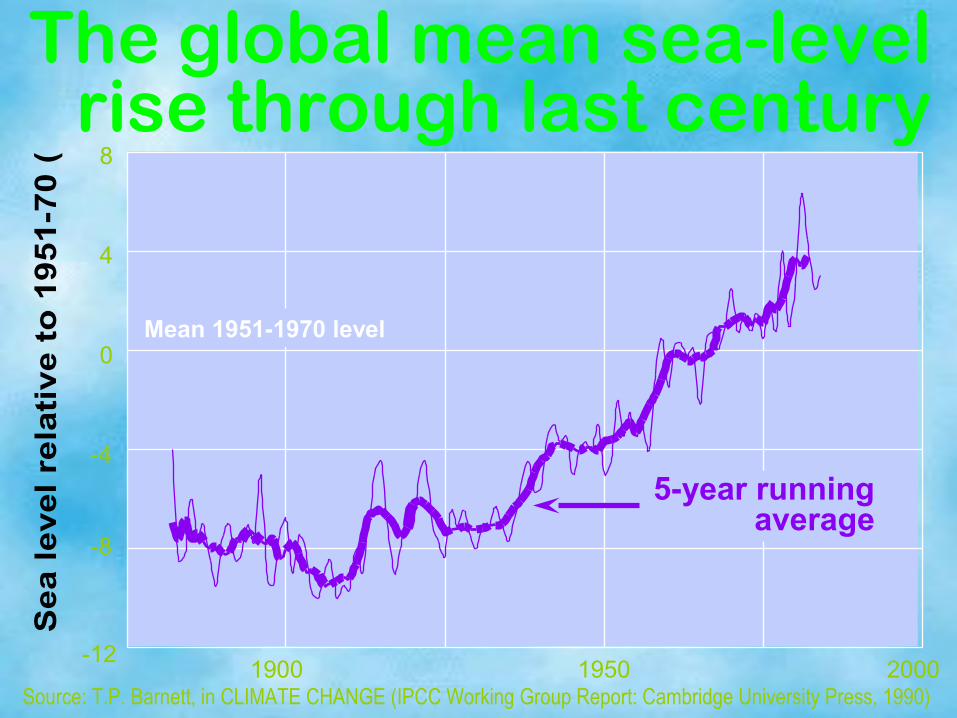
5-yearrunningaverage
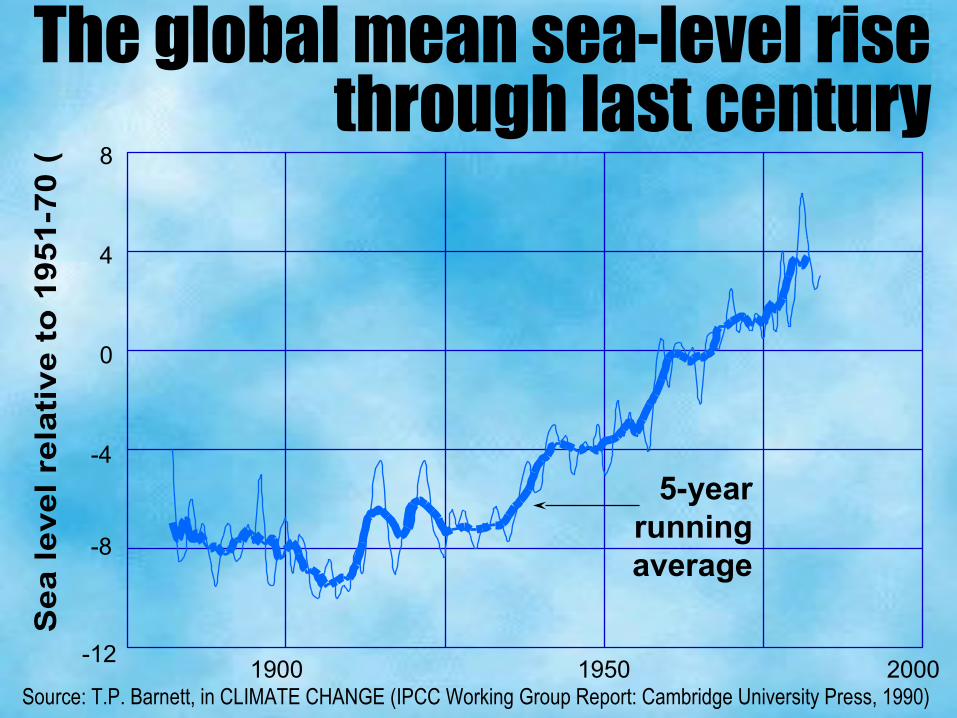
The global mean sea-level rise through last century
Source: T.P. Barnett, in CLIMATE CHANGE (IPCC Working Group Report: Cambridge University Press, 1990)

Steric height (dynamic cm
)
Distance off California coast (km)500 400 300 200 100 0
100
95
90
85
80
1985-91
1950-56
0
100
200
300
400
500
0 0.3 0.6 0.9 1.2∆T (oC)
Dep
th (m
)The 1950-91 hydrographic data off California coast show that
sea surface waters (0-100m) became~0.8oC warmer in the 35-year period between 1950-56 and 1985-91; which
raised the sea level sur-face by 3.1+0.7 cm.
Note: Warming by 1oC the top 100 m of ocean with 15oC temperature and 3.4% salinity should raise the sea level by ~2.2 cm.
Source: D. Roemmich, SCIENCE: v. 257, p.373-375 (July 17, 1992).

80
85
90
95
100
0100200300400500
Distance off California coast (km)
Ster
ic he
ight (
dyna
mic c
m)
Dean Roemmich: Ocean warming and sea level rise along the southwest U.S. coast [Science: 257 ( 373-375), 1992]
1985-1991
1950-1956
Sea surface off California has risen by about 2 cm, on average, between 1950 and 1991

OceansPore water in the
sedimentsIce-caps, glaciers
Rivers, lakesAtmospheric
moisture
Total hydrosphere
Total mass(trillion tons)
1,370,000
330,00020,000
300
13
1,720,313
Share of thehydrosphere
80%
18.8%1.2%0.02%
0.0008%
100%
Considering all sediments*
Total mass(trillion tons)
1,370,000
7,00020,000
300
13
1,397,313
Share of thehydrosphere
97%
0.5%1.4%0.02%
0.0009%
100%
Conventional estimates
The availability of water too is a limiting factor. An average human needs about 300,000 gallons of water annually, including 250,000 gallons for growing food. Indeed, nations with under 150,000 gallons of annual per capita water supply face severe limits to their growth.
Mass of the present hydrosphere
*Karl K. Turekian: GLOBAL ENVIRONMENTAL CHANGE (Prentice Hall, 1996)


Seafood is an important source of animal protein worldwide,
nonetheless.

World fish harvest: Note that Indian Ocean has the least yield.
Area(106 km2)
Volume(106 km3)
Pacific OceanAtlantic Ocean
Indian Ocean
707.6323.6291.0
165.282.473.4
An
nu
al f
ish
ha
rve
st (
mill
ion
to
ns
)
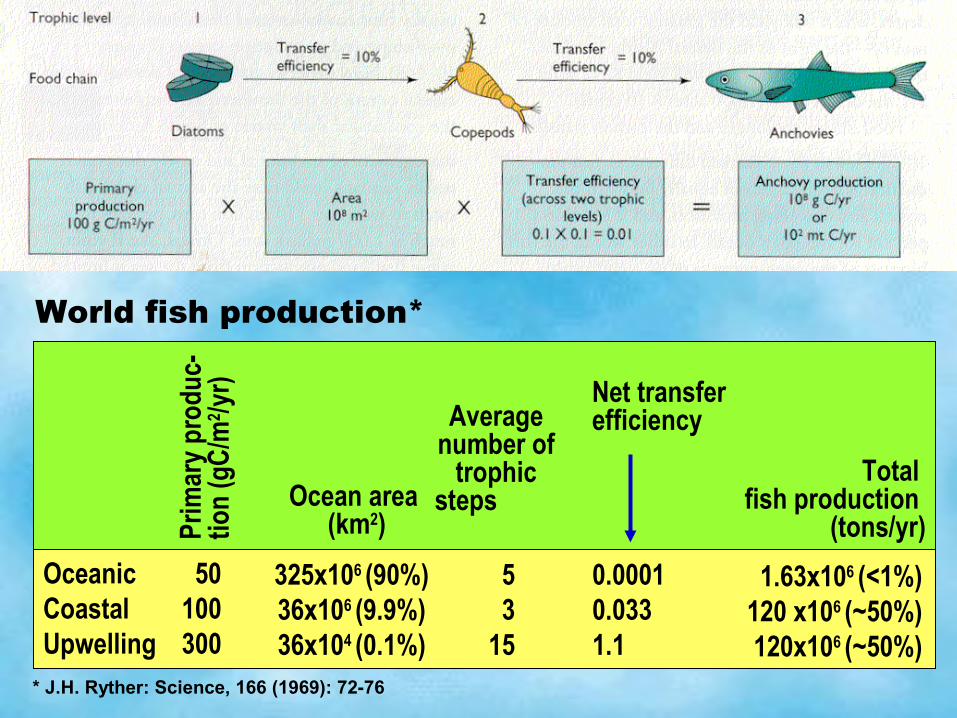
Ocean area (km2)Pr
imar
y pr
oduc
-tio
n (g
C/m
2 /yr)
Average number of
trophic steps
Net transfer efficiency
Total fish production
(tons/yr)
OceanicCoastalUpwelling
325x106 (90%)36x106 (9.9%)36x104 (0.1%)
50100300
53
15
0.00010.0331.1
1.63x10⁶ (<1%)120 x106 (~50%)120x106 (~50%)
World fish production*
* J.H. Ryther: Science, 166 (1969): 72-76

Even the maximum
possible yield from
world’s oceans
can hardly suffice.

Annual fish harvests of the leading
nations.

Seafood is already a major source of animal protein in the Asian diet.

That Climate Thing
•Global warming and its consequences
•The anthropogenic contributions
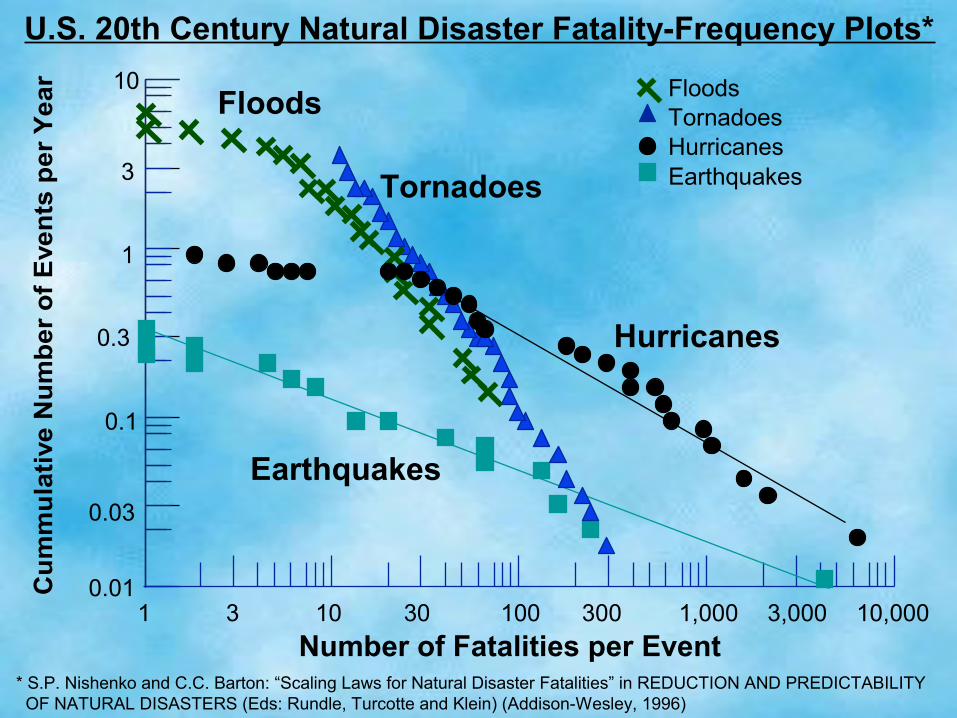
Number of Fatalities per Event
3 30 300 3,000
3
0.3
0.03
Tornadoes
FloodsTornadoesHurricanesEarthquakes
Cu
mm
ula
tive
Nu
mb
er
of
Eve
nts
pe
r Y
ea
r
0.1
1
10
0.011 10 100 1,000 10,000
Floods
Hurricanes
Earthquakes
U.S. 20th Century Natural Disaster Fatality-Frequency Plots*
* S.P. Nishenko and C.C. Barton: “Scaling Laws for Natural Disaster Fatalities” in REDUCTION AND PREDICTABILITY OF NATURAL DISASTERS (Eds: Rundle, Turcotte and Klein) (Addison-Wesley, 1996)

* International Federation of Red Cross and Red Crescent Societies (The Economist, Sept 6, 1997)
High wind: 21%
Earthquake: 8%
Flood: 19%
Other naturaldisasters: 21%
Volcanoes: 1%
Drought & Famine: 6%Landslides: 3%
Man-madedisasters: 34%
Disasters*by type: 1971-96
Total: 8,219,000

Tem
pera
ture
Ch
an
ge (
C)
o
0.6
0.3
- 0.3
0.0
- 0.61900 1950 2000
Global mean temperature change through last century
Source: Thomas Karl and C. Bruce Baker: GLOBAL WARMING UPDATE (NCDC-NOAA, 1994)
5-year runningaverage
1950-60 Mean level
Se
a l
ev
el
rela
tiv
e t
o 1
95
1-7
0 (
cm
)
8
0
4
-12
-8
-4
1900 20001950
5-year runningaverage
The global mean sea-level rise through last century
Source: T.P. Barnett, in CLIMATE CHANGE (IPCC Working Group Report: Cambridge University Press, 1990)
Mean 1951-1970 level

T (
C)
-0.8
-0.4
0
0.4
0.8
800 1000 1200 1400 1600 1800
∆o
2000
Little Ice Age
Winter conditions in Eastern Europe through the past millenium, based on manuscript records*
* J. Imbrie & K.P. Imbrie: ICE AGES (Enslow Publishers, 1979)

Steric height (dynamic cm
)
Distance off California coast (km)500 400 300 200 100 0
100
95
90
85
80
1985-91
1950-56
0
100
200
300
400
500
0 0.3 0.6 0.9 1.2∆T (oC)
Dep
th (m
)The 1950-91 hydrographic data off California coast show that
the sea surface waters (0-100m) became ~0.8oC warmer in the 35-year period between 1950-56 and 1985-91; which
raised the sea level sur-face by 3.1+0.7 cm.
Note: Warming by 1oC the top 100 m of ocean with 15oC temperature and 3.4% salinity should raise the sea level by ~2.2 cm.
Source: D. Roemmich, SCIENCE: v. 257, p.373-375 (July 17, 1992).
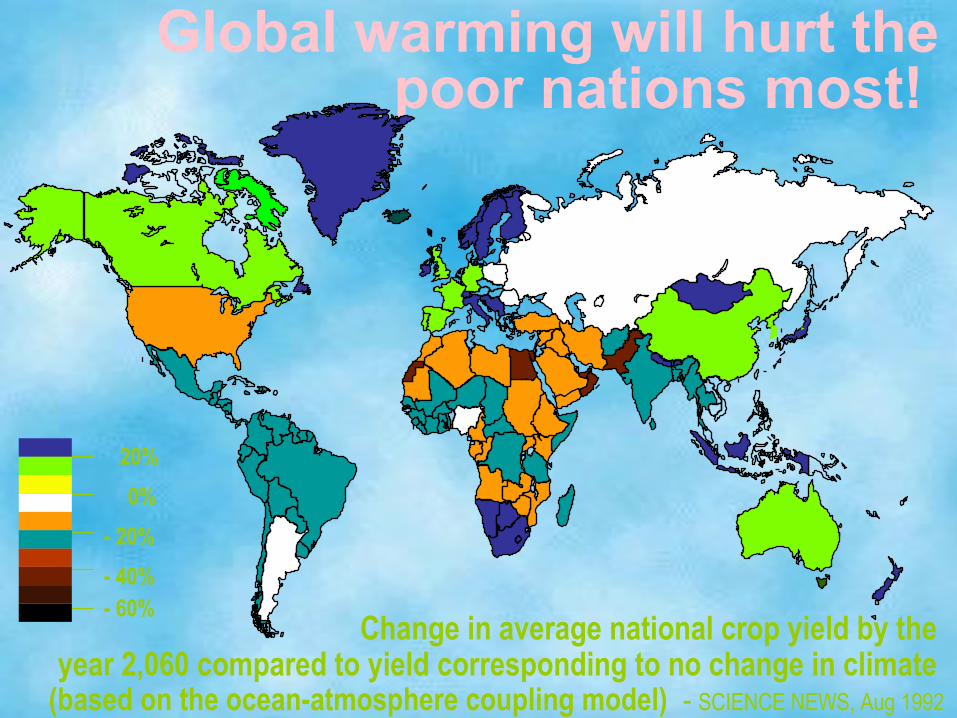
20%
0%
- 60%
- 20%
- 40%
Global warming will hurt the poor nations most!
Change in average national crop yield by the year 2,060 compared to yield corresponding to no change in climate
(based on the ocean-atmosphere coupling model) - SCIENCE NEWS, Aug 1992
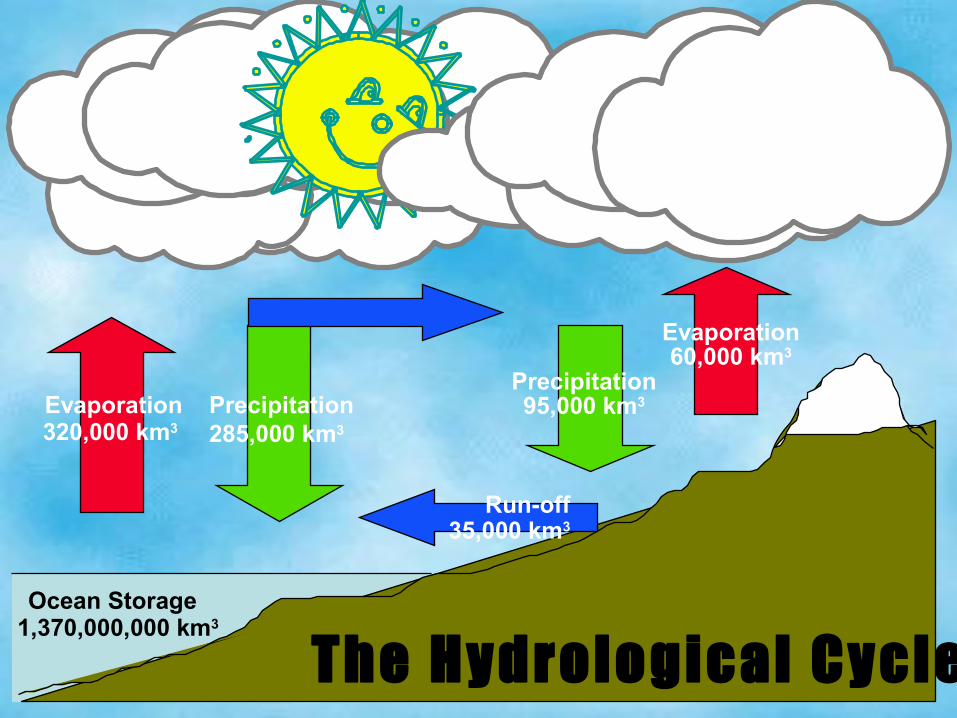
Ocean Storage1,370,000,000 km3
The Hydrological Cycle
Precipitation285,000 km3
Evaporation320,000 km3
Precipitation95,000 km3
Evaporation60,000 km3
Run-off35,000 km3
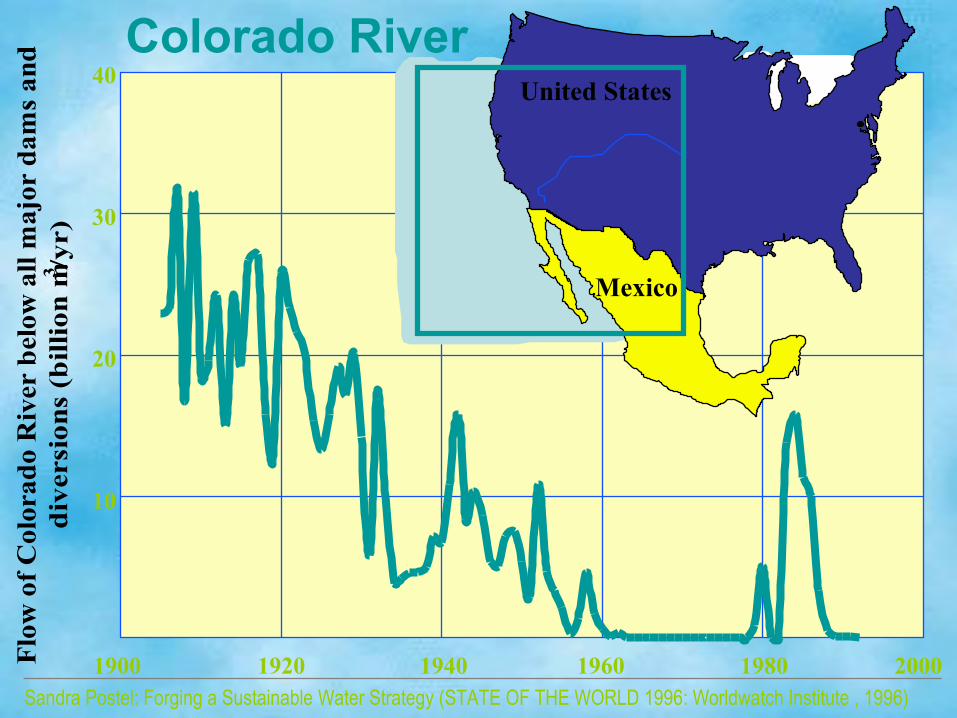
Flo
w o
f C
olor
ado
Riv
er b
elow
all
maj
or d
ams
and
d
iver
sio
ns
(bil
lio
n m
/yr)
3
40
30
10
20
20001900 1920 1940 19801960Sandra Postel: Forging a Sustainable Water Strategy (STATE OF THE WORLD 1996: Worldwatch Institute , 1996)
Colorado River
Mexico
United States

Str
ea
m F
low
in
to A
ral S
ea
(b
illio
n m
/ye
ar)
3Drying of the Aral Sea
Sandra Postel: Forging a Sustainable Water Strategy (STATE OF THE WORLD 1996: Worldwatch Institute , 1996)
1940 2000198019600
80
20
40
60
Aral Sea
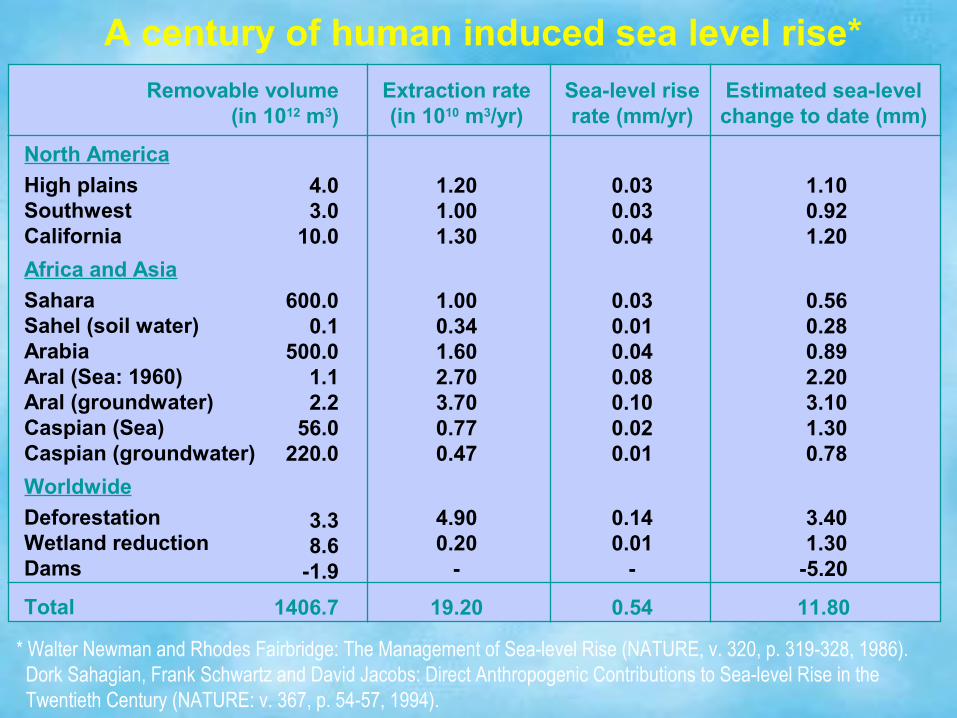
Removable volume(in 1012 m3)
4.03.0
10.0
600.00.1
500.01.12.2
56.0220.0
3.38.6
-1.9
1406.7
North America
High plainsSouthwestCalifornia
Africa and Asia
SaharaSahel (soil water)ArabiaAral (Sea: 1960)Aral (groundwater)Caspian (Sea)Caspian (groundwater)
Worldwide
DeforestationWetland reductionDams
Total
Extraction rate(in 1010 m3/yr)
1.201.001.30
1.000.341.602.703.700.770.47
4.900.20
-
19.20
Sea-level riserate (mm/yr)
0.030.030.04
0.030.010.040.080.100.020.01
0.140.01
-
0.54
Estimated sea-levelchange to date (mm)
1.10 0.92 1.20
0.56 0.28 0.89 2.20 3.10 1.30 0.78
3.40 1.30-5.20
11.80
A century of human induced sea level rise*
* Walter Newman and Rhodes Fairbridge: The Management of Sea-level Rise (NATURE, v. 320, p. 319-328, 1986). Dork Sahagian, Frank Schwartz and David Jacobs: Direct Anthropogenic Contributions to Sea-level Rise in the Twentieth Century (NATURE: v. 367, p. 54-57, 1994).
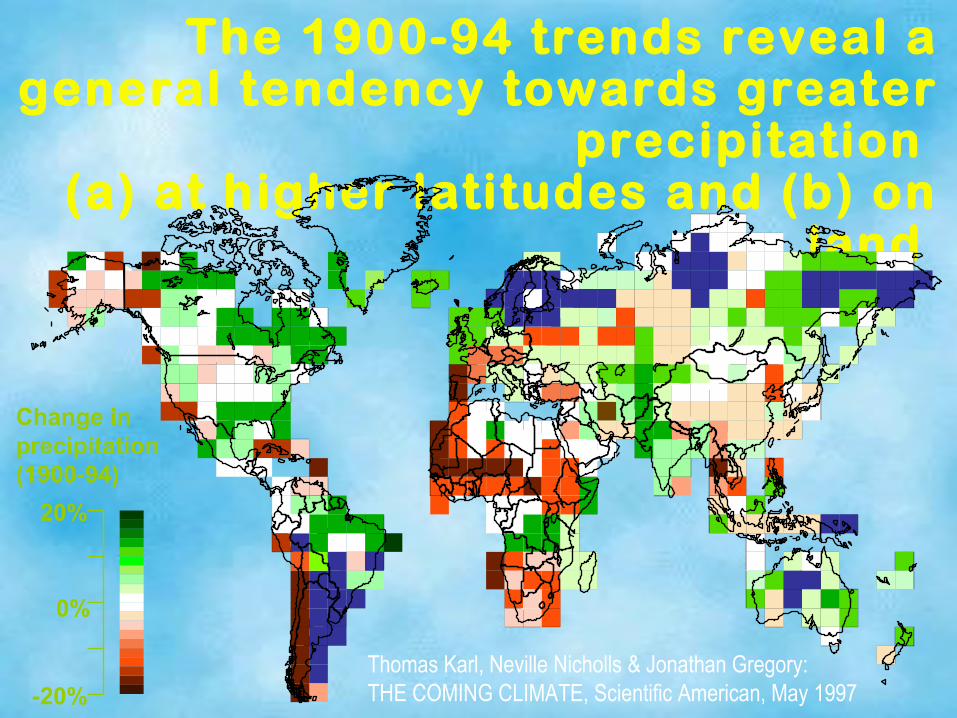
20%
0%
-20%
Change inprecipitation (1900-94)
Thomas Karl, Neville Nicholls & Jonathan Gregory:THE COMING CLIMATE, Scientific American, May 1997
The 1900-94 trends reveal a general tendency towards greater
precipitation (a) at higher latitudes and (b) on
land
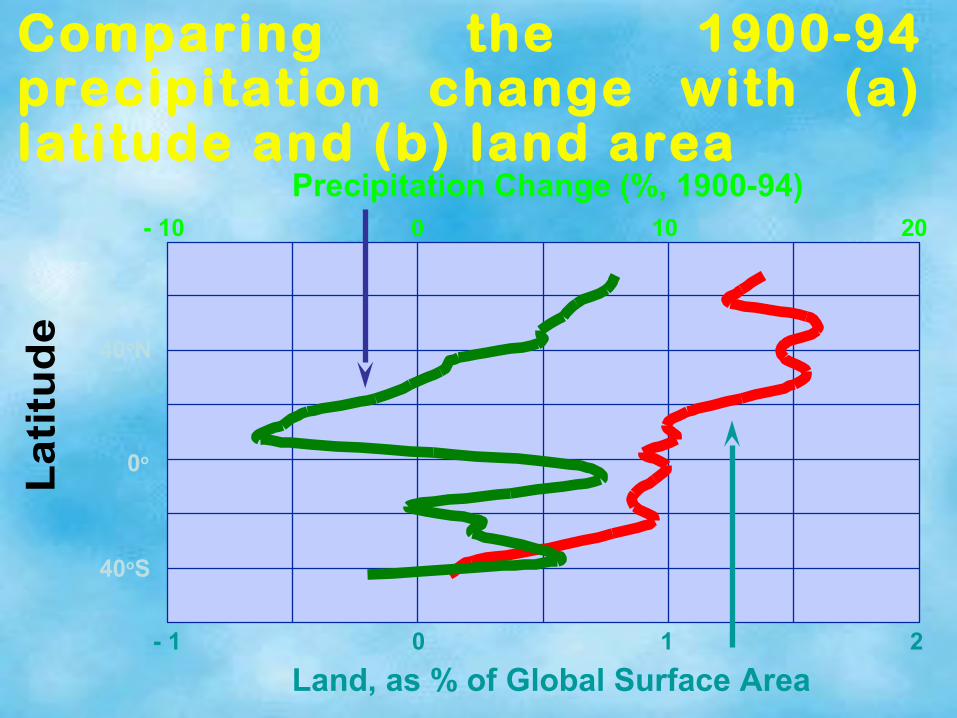
La
titu
de
40oS
0o
40oN
0
- 10 20100
Precipitation Change (%, 1900-94)
- 1 21
Land, as % of Global Surface Area
Comparing the 1900-94 precipitation change with (a) latitude and (b) land area
Ocean Storage1,370,000,000 km3
The Hydrological Cycle
Evaporation320,000 km3
Precipitation285,000 km3
Evaporation60,000 km3
Precipitation95,000 km3
Run-off
35,000 km3

In summaryIn summary,,• Human ingenuity has defied the Human ingenuity has defied the
“Malthusian Trap”, that “Malthusian Trap”, that the power of the power of population exceeds that of the earth.population exceeds that of the earth.
• This has resulted in modifying the most This has resulted in modifying the most basic of nature’s processes - the basic of nature’s processes - the hydrological cycle.hydrological cycle.
• Perhaps technology defies the Gandhian Perhaps technology defies the Gandhian dictum, that “nature has enough for our dictum, that “nature has enough for our need, but not for our greed”.need, but not for our greed”.