Water Quality Unit - The River Mile
11
1 The River Mile Water Quality Lesson # 3 Water Quality: Turbidity & Conductivity Developed by the Lake Roosevelt Forum to support “The River Mile” National Park Service Program Lake Roosevelt National Park Service U.S. Department of the Interior Lake Roosevelt National Recreation Area
Transcript of Water Quality Unit - The River Mile

Water Quality in the Upper Columbia River & Lake Roosevelt
1
The River Mile Water Quality
Lesson # 3
Water Quality: Turbidity & Conductivity
Developed by the Lake Roosevelt Forum to support “The River Mile” National Park Service Program
Lake Roosevelt National Park Service
U.S. Department of the Interior
Lake Roosevelt
National Recreation Area

Water Quality in the Upper Columbia River & Lake Roosevelt
2
Suggested duration: [90 minutes to
optional multi day]
LESSON # 3 Water Quality: Turbidity & Conductivity
Inquiry Question: How do suspended & dissolved substances impact water quality? What role does runoff play in changing turbidity & conductivity?
Inquiry Process: Scientific observation
Standards: PS2 & ES2
INTRODUCTION: Turbidity measures the cloudiness caused by the presence of suspended solids, such as clay and silt particles from erosion or runoff, re-suspended bottom sediments & microscopic organisms in the water. The greater the amount of total suspended solids in the water (not to be confused with total dissolved solids), the murkier water appears and the higher the measured turbidity. Turbidity can greatly affect water quality in many ways. Some examples include reducing the amount of light available for plant growth, damaging sensitive gill structures in fish and aquatic organisms, as well as increasing their susceptibility to disease, and preventing proper egg and larval development. Conductivity and Total Dissolved Solids - Conductivity is a measure of how well water can transmit an electrical current. In the Lake Roosevelt watershed, conductivity is primarily used to determine the mineralization of water (commonly called total dissolved solids). Information from the amount of total dissolved solids can be used to determine changes in water at different times of the year and can also be used to determine certain physiological effects on plants and animals.
STUDENT WORK AND ASSESSMENT Formative Assessment: Recording detailed observational data
QUESTIONS TO EXPLORE/INSTRUCTIONS/PROCEDURE 1. Students reflect on experience in Lesson 2: Design a water filter.
Why is a system to measure and compare WQ important? 2. View the WQ Investigation PP (23 slides) as an introduction to
Water Quality indicators that will be investigated in Lessons 3-8 3. Questions for discussion and analysis: How do turbidity and
conductivity measures compare on each water sample tested. What are the relationships between turbidity, conductivity, runoff and natural filtration?
Option 1: Use samples of the “dirty” water from Lesson 2. Record observations of the water sample and measure using a turbidity tube. Filter using the student built filters, observe, measure, and compare. Option 2: Erosion and Deposition Activities 43, 45, 46, & 50 (Van Cleave) as class demonstration or experimental stations Option 3: Take water samples at one site each month (or seasonally) and compare conductivity. Option 4: Check conductivity on wind eroded points to see if it differs from non-eroded locations or in coves or streams that feed the body of water. Note: GLOBE lab details are provided in the unit appendices.
Formative Assessment: Objective, precise, descriptive, observations using scientific terminology & symbols
Materials:
Lesson 2 “dirty” water samples & Water filters Secci disc Turbidity tube Lake or pond water GLOBE Turbidity lab GLOBE Conductivity lab Conductivity test probe Janice Van Cleave’s Erosion & Deposition Activities 43, 45,46, & 50
Handouts:
Student Handout
Credits/Citations: PP Slides: Lake Roosevelt Forum, NPS and Eric Starkey Van Cleave Earth Science
TRM Turbidity Protocol Globe: Turbidity Lab Globe: Conductivity Lab
Water Quality in the Upper Columbia River & Lake Roosevelt
3
WATER QUALITY: TURBIDITY & CONDUCTIVITY
Name: _________________________________________________Date: ______________
Essential Questions: How do suspended & dissolved substances impact water quality?
Inquiry Question: What role does runoff play in changing turbidity & conductivity?
Objective: You will: Record objective, precise, descriptive, observations using scientific terminology Take notes on water quality indicators Measure turbidity & conductivity for a variety of water samples Analyze observational, experimental and statistical data to determine variables
Preparation from Lesson 2: Think about your experience in Lesson 2 of designing a water filter. Why is a system to measure and compare water quality indicators important? Think Time:
I think a system for measuring water quality is important because ....

Water Quality in the Upper Columbia River & Lake Roosevelt
4
As you watch the Power Point presentation record notes: Identify key points about each of the following water quality Indicators
TURBIDITY/TRANSPARENCY:
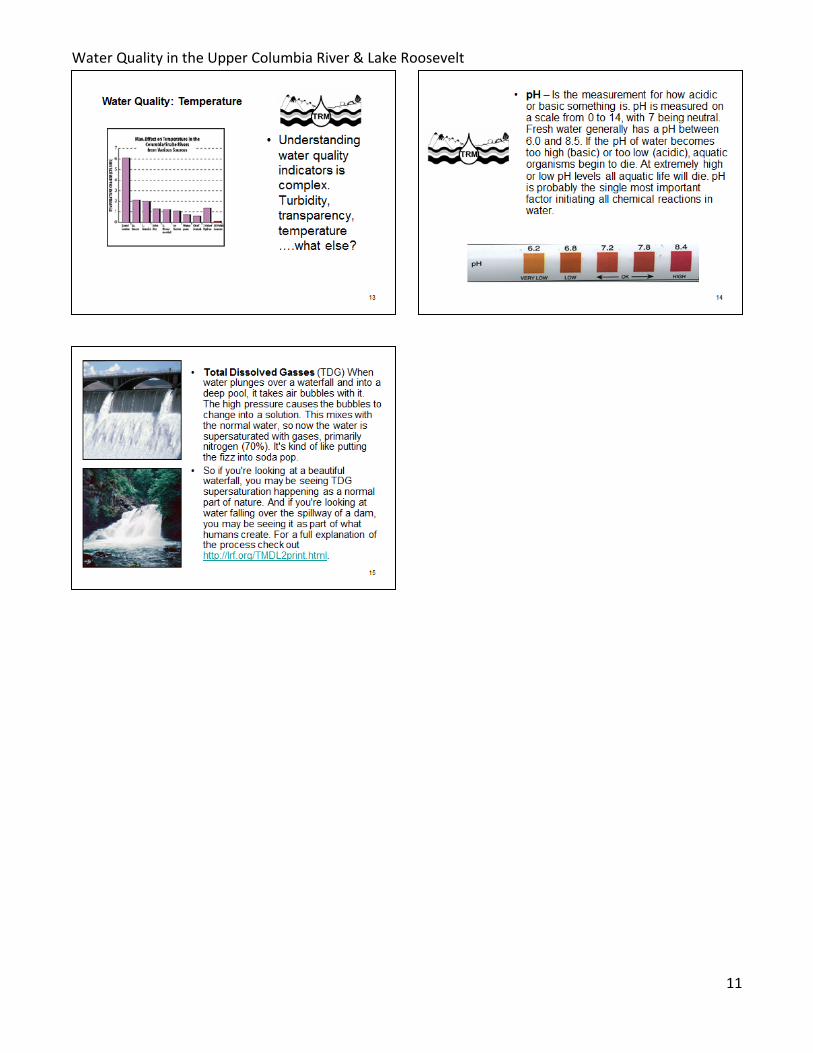
TEMPERATURE:
PH:
DISSOLVED OXYGEN:
DISSOLVED GASSES:
DISSOLVED SOLIDS:
NUTRIENTS (PHOSPHORUS, NITROGEN):
HEAVY METALS:
OTHER IMPORTANT IDEAS:

Water Quality in the Upper Columbia River & Lake Roosevelt
5
Turbidity & Conductivity: Turbidity measures the cloudiness caused by the presence of suspended solids, such as clay and silt particles from erosion or runoff, re-suspended bottom sediments & microscopic organisms in the water. The greater the amount of total suspended solids in the water (not to be confused with total dissolved solids), the murkier it appears and the higher the measured turbidity. Turbidity can greatly affect water quality in many ways. Some examples include reducing the amount of light available for plant growth, damaging sensitive gill structures in fish and aquatic organisms, as well as increasing their susceptibility to disease, and preventing proper egg and larval development. Conductivity and Total Dissolved Solids - Conductivity is a measure of how well water can transmit an electrical current. In the Lake Roosevelt watershed, conductivity is primarily used to determine the mineralization of water (commonly called total dissolved solids). Information from the amount of total dissolved solids can be used to determine changes in water at different times of the year and can also be used to determine certain physiological effects on plants and animals.
Procedure: Using a variety of water samples
□ Learn to use the turbidity tube and/or the Secci disc to measure water transparency /turbidity.
□ Learn to use the conductivity meter to measure the total dissolved solids in your water samples.
PROCESS NOTES:
Turbidity Tube
Secci Disc
Conductivity Meter

Water Quality in the Upper Columbia River & Lake Roosevelt
6
1. Collect observational & statistical data on turbidity & conductivity from experimental samples
Water Sample
Tap water
Lake/pond or river
Filtered #43 Run off
#45 Speedy
#46 Wander
#50 Shake
Up
Turbidity
Particulate Matter
Smell
Color & Appearance
Conductivity
2. Analyze the data and experimental procedure to identify variables that impacted water
quality.
Analysis: How do turbidity and conductivity measures compare on each water sample tested. Identify dependent & independent variables.
3. Draw Conclusions:
Conclusions: Turbidity, conductivity, runoff, filtration, and motion impact water quality in the following ways:

Water Quality in the Upper Columbia River & Lake Roosevelt
7
What is conductivity and why is it important?
Conductivity is a measure of the ability of water to pass an electrical current. Conductivity in water is affected by the presence of inorganic dissolved solids such as chloride, nitrate, sulfate, and phosphate anions (ions that carry a negative charge) or sodium, magnesium, calcium, iron, and aluminum cations (ions that carry a positive charge). Organic compounds like oil, phenol, alcohol, and sugar do not conduct electrical current very well and therefore have a low conductivity when in water. Conductivity is also affected by temperature: the warmer the water, the higher the conductivity. For this reason, conductivity is reported as conductivity at 25 degrees Celsius (25 C). Conductivity in streams and rivers is affected primarily by the geology of the area through which the water flows. Streams that run through areas with granite bedrock tend to have lower conductivity because granite is composed of more inert materials that do not ionize (dissolve into ionic components) when washed into the water. On the other hand, streams that run through areas with clay soils tend to have higher conductivity because of the presence of materials that ionize when washed into the water. Ground water inflows can have the same effects depending on the bedrock they flow through. Discharges to streams can change the conductivity depending on their make-up. A failing sewage system would raise the conductivity because of the presence of chloride, phosphate, and nitrate; an oil spill would lower the conductivity. The basic unit of measurement of conductivity is the mho or siemens. Conductivity is measured in micromhos per centimeter (µmhos/cm) or microsiemens per centimeter (µs/cm). Distilled water has a conductivity in the range of 0.5 to 3 µmhos/cm. The conductivity of rivers in the United States generally ranges from 50 to 1500 µmhos/cm. Studies of inland fresh waters indicate that streams supporting good mixed fisheries have a range between 150 and 500 µhos/cm. Conductivity outside this range could indicate that the water is not suitable for certain species of fish or macroinvertebrates. Industrial waters can range as high as 10,000 µmhos/cm.
Sampling and equipment Considerations
Conductivity is useful as a general measure of stream water quality. Each stream tends to have a relatively constant range of conductivity that, once established, can be used as a baseline for comparison with regular conductivity measurements. Significant changes in conductivity could then be an indicator that a discharge or some other source of pollution has entered a stream. Conductivity is measured with a probe and a meter. Voltage is applied between two electrodes in a probe immersed in the sample water. The drop in voltage caused by the resistance of the water is used to calculate the conductivity per centimeter. The meter converts the probe measurement to micromhos per centimeter and displays the result for the user. NOTE: Some conductivity meters can also be used to test for total dissolved solids and salinity. The total dissolved solids concentration in milligrams per liter (mg/L) can also be calculated by multiplying the conductivity result by a factor between 0.55 and 0.9, which is empirically determined (see Standard Methods #2510, APHA 1992). Suitable conductivity meters cost about $350. Meters in this price range should also measure temperature and automatically compensate for temperature in the conductivity reading. Conductivity can be measured in the field or the lab. In most cases, it is probably better if the samples are collected in the field and taken to a lab for testing. In this way several teams of volunteers can collect samples simultaneously. If it is important to test in the field, meters designed for field use can be obtained for around the same cost mentioned above. If samples will be collected in the field for later measurement, the sample bottle should be a glass or polyethylene bottle that has been washed in phosphate-free detergent and rinsed thoroughly with both tap and distilled water. Factory-prepared Whirl-pak® bags may be used.
How to sample
The procedures for collecting samples and analyzing conductivity consist of the following tasks:

Water Quality in the Upper Columbia River & Lake Roosevelt
8
TASK 1 Prepare the sample containers
If factory-sealed, disposable Whirl-pak® bags are used for sampling, no preparation is needed. Reused sample containers (and all glassware used in this procedure) must be cleaned before the first run and after each sampling run by following Method A as described in MEthod A in Table 1 in Chapter 5 - Water Quality Conditions.
TASK 2 Prepare before leaving for the sampling site
Refer to section 2.3 - Safety Considerations for details on confirming sampling date and time, safety considerations, checking supplies, and checking weather and directions. In addition to the standard sampling equipment and apparel, when sampling for conductivity, include the following equipment: Conductivity meter and probe (if testing conductivity in the field) Conductivity standard appropriate for the range typical of the stream Data sheet for conductivity to record results Be sure to let someone know where you are going and when you expect to return.
TASK 3 Collect the sample (if samples will be tested in the lab)
Refer to Task 2 in Chapter 5 - Water Quality Conditions for details on how to collect water samples using screw-cap bottles or Whirl-pak® bags.
TASK 4 Analyze the sample (field or lab)
The following procedure applies to field or lab use of the conductivity meter.
1. Prepare the conductivity meter for use according to the manufacturer's directions. 2. Use a conductivity standard solution (usually potassium chloride or sodium chloride) to calibrate the meter for
the range that you will be measuring. The manufacturer's directions should describe the preparation procedures for the standard solutio n.
3. Rinse the probe with distilled or deionized water. 4. Select the appropriate range beginning with the highest range and working down. Read the conductivity of
the water sample. If the reading is in the lower 10 percent of the range, switch to the next lower range. If the conductivity of the sample ex ceeds the range of the instrument, you may dilute the sample. Be sure to perform the dilution according to the manufacturer's directions because the dilution might not have a simple linear relationship to the conductivity.
5. Rinse the probe with distilled or deionized water and repeat step 4 until finished.
TASK 5 Return the samples and the field data sheets to the lab/drop-off point. Samples that are sent to a lab for conductivity analysis must be tested within 28 days of collection. Keep the samples on ice or refrigerated.
References APHA. 1992. Standard methods for the examination of water and wastewater. 18
th ed. American Public Health Association,
Washington, DC.
Hach Company. 1992. Hach water analysis handbook. 2nd ed. Loveland, CO.
Mississippi Headwaters River Watch. 1991. Water quality procedures. Mississippi Headwaters Board. March.

Water Quality in the Upper Columbia River & Lake Roosevelt
9

Water Quality in the Upper Columbia River & Lake Roosevelt
10
Water Quality in the Upper Columbia River & Lake Roosevelt
11