
Water Quality of The Brid River - Department of Primary...
64
State of Rivers Water Quality i Water Quality of The Brid River A Report Forming Part of The Requirements for State of Rivers Reporting Christopher Bobbi Land and Water Assessment Branch DPIWE. Report Series WRA 99/09 August, 1999.
Transcript of Water Quality of The Brid River - Department of Primary...
State of Rivers Water Quality
i
Water Quality of The Brid River
A Report Forming Part of The Requirements for State of Rivers Reporting
Christopher BobbiLand and Water Assessment BranchDPIWE.
Report Series WRA 99/09August, 1999.
State of Rivers Water Quality
ii
Executive Summary
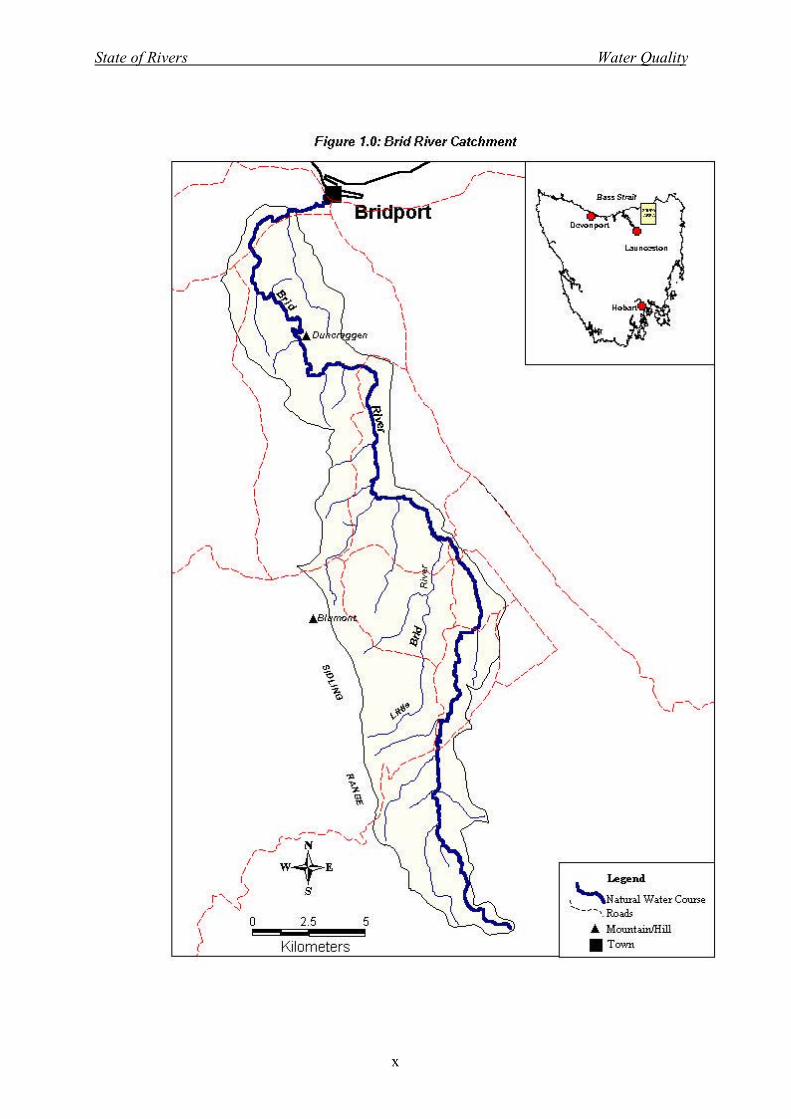
The Brid River catchment is an area extensively used for agriculture and forestry. The catchmentcovers approximately 145 km2 and drains northward into Bass Strait through Bridport. This reportpresents and discusses the results of a 1 year study of water quality in the catchment which wasundertaken in 1998 as part of a program of ‘State of Rivers’ studies in the northeast of Tasmania. Theresults should also be examined in the light of other studies into hydrology, stream condition and aquaticecology which were also undertaken concurrently and which are reported separately.
Some of the major findings of this study are:⇒ Dorset Waterwatch studies in Cox’s Creek have showed that effluent from the Scottsdale sewage
treatment plant has a significant impact on water quality in the creek, but the data also shows thatwater quality improves with distance down stream.
⇒ pH levels in the Brid River are slightly acidic in the upper catchment but become more neutral asthe river flows through State Forest area in the lower catchment. Other evidence demonstrates thatwater quality shows some improvement in the area of the State Forest as catchment inputs to theriver are less.
⇒ Turbidity is moderately high throughout the length of the river, however data shows that at lowerflows sediment appears to settle out of the water column in the middle and lower reaches and maybe deposited on the river bed in these areas.
⇒ Although there is a seasonal pattern of change in dissolved oxygen concentrations in the river, levelsare generally indicative of a healthy ecosystem. Lower summer concentrations in the uppercatchment may indicate the effects of nutrient loads entering the river in this region.
⇒ Salt levels in the catchment are generally low, however water in Shanty’s Creek was found to behighly saline, with conductivity levels as high as 5,000 µS/cm.
⇒ Nitrate levels in the river are very similar to those in the nearby Ringarooma and Great Foresterrivers. Concentrations in the Brid River appear to be linked to streamflow, with higherconcentrations occurring during higher baseflows in winter. The Little Brid River was identified ashaving highest concentrations in the catchment.
⇒ Average phosphorus concentrations are 0.034 mg/L, but fluctuate widely based up rainfall andrunoff. In the Brid River there is a strong link between phosphorus and turbidity.
⇒ Snapshot bacterial testing showed that during summer conditions faecal contamination may behighest in the upper catchment, where animal industries are most intensive. Further monitoring isrequire to ascertain the seriousness of this problem and identify feasible solutions.
⇒ Continuous measurement of turbidity at the bottom of the catchment has showed that levels duringfloods can reach as high as 150 NTU, which is 10 times higher than levels during baseflows. Thisrecord was used to calculate sediment and nutrient export from the catchment. During 1998 anestimated 925 tonnes of sediment, 2.2 tonnes of phosphorus and 38 tonnes of nitrogen wereexported from the Brid catchment.
⇒ A comparison of export figures with those from other Tasmanian catchments showed that export ofnutrients from the Brid catchment is the highest of any catchment yet measured.
⇒ One of the major issues arising from the data collected during this study is that activities in the uppercatchment are having the most significant impact on water quality. These tend to revolve aroundmanagement of runoff from intensively farmed land and a lack of riparian buffering of the river.Implementation of better riparian management practices are singled out as one positive step towardsimproving water quality in the Brid River.
State of Rivers Water Quality
iii
EXECUTIVE SUMMARY __________________________________________________ ii
A GLOSSARY OF TERMS _________________________________________________iv
Units and Conversions ____________________________________________________ vii
Acronyms ______________________________________________________________ vii
B SUMMARY OF NATIONAL GUIDELINES FOR WATER QUALITY ___________viii
C Catchment Map - Brid River_________________________ Error! Bookmark not defined.
WATER QUALITY OF THE BRID RIVER CATCHMENT________________________ 1
1 Historical Data _________________________________________________________ 1
2 Waterwatch Activities____________________________________________________ 8
3 Current Study _________________________________________________________ 123.1 Physico-chemical properties _______________________________________________________ 133.2 General Ionic Composition ________________________________________________________ 193.3 Nutrient Results ________________________________________________________________ 213.2 Catchment Survey ______________________________________________________________ 263.3 Continuous Monitoring __________________________________________________________ 393.4 Nutrient Load Estimates __________________________________________________________ 473.5 Diurnal Water Quality Variations ___________________________________________________ 503.6 Summary and Comments__________________________________________________________ 54
4 References ___________________________________________________________ 55

State of Rivers Water Quality
iv
A GLOSSARY OF TERMS
BaseflowFlow in a stream is essentially a function of overland flow, subsurface flow and groundwater input.During periods when there is no contribution of water from precipitation, flow in a stream is composedof water from deep subsurface and groundwater sources and is termed ‘baseflow’.
Box and Whisker PlotsOne common method of examining data collected at varous sites is to plot the data from each site as a‘box and whisker’ plot. These plots display the median (or the middle of the data) as a line across theinside of the box. The bottom and top edges of the box mark the first and third quartiles respectively,indicating the middle 50% of the data. The ends of the whiskers show the extremes of the data andtogether enclose 95% of the data.
CatchmentThe land area which drains into a particular watercourse (river, stream or creek) and is a naturaltopographic division of the landscape. Underlying geological formations may alter the perceivedcatchment area suggested solely by topography (limestone caves are an example of this).
DischargeThe volume of water passing a specific point during a particular period of time. It usually refers towater flowing in a stream or drainage channel, but can also refer to waste water from industrialactivities.
Dissolved OxygenOxygen is essential for all forms of aquatic life and many organisms obtain this oxygen directly fromthe water in the dissolved form. The level of dissolved oxygen in natural waters varies withtemperature, turbulence, photosynthetic activity and atmospheric pressure. Dissolved oxygen variesover 24 hour periods as well as seasonally and can range from as high as 15 mg/L to levelsapproaching 0 mg/L. Levels below 5 mg/L will begin to place stress on aquatic biota and below 2 mg/Lwill cause death of fish.
EcosystemAn environment, the physical and chemical parameters that define it and the organisms which inhabit it.
Electrical Conductivity (EC)Conductivity is a measure of the capacity of an aqueous solution to carry an electrical current, anddepends on the presence of ions; on their total concentration, mobility and valence. Conductivity iscommonly used to determine salinity and is mostly reported in microSiemens per centimetre (µS/cm) ormilliSiemens per metre (mS/m) at a standard reference temperature of 25o Celsius.
EutrophicationThe enrichment of surface waters with nutrients such as nitrates and phosphates, which causenuisance blooms of aquatic plants and algae.
Export Loads / Export CoefficientsThe calculation of export loads of nutrients, or any other parameter, involves using nutrientconcentration data collected over a wide variety of flow conditions and from various seasons. Thisinformation, when plotted against flow at the time of collection, can reveal relationships between flowand concentration which can then be used to estimate the load of a particular nutrient leaving the

State of Rivers Water Quality
v
catchment (estimates of export loads should be regarded as having no greater accuracy than +/-15%).
The export coefficient (also known as the Runoff Coefficient) corrects for catchment size so thatexport loads from variously sized catchments can be compared. The most commonly used formula toperform this correction is;
Discharge (ML) / Catchment Area (km2) = X (mm km-2)
Total Load (kg) / X = Y (kg mm-1)
Y / Catchment Area (km2) = Export Coefficient (kg mm-1km-2)
Where Z is the Export Coefficient and is equivalent to Total Load (kg) / Discharge (ML).
Faecal Coliforms (also known as ‘thermotolerant coliforms’ - eg. E.coli)Faecal coliform bacteria are a sub-group of the total coliform population that are easy to measure andare present in virtually all warm blooded animals. Although measurement of this group is favoured bythe NHMRC (1996) as suitable indicators of faecal pollution, it is recognised that members of thisgroup may not be exclusively of faecal origin. However their presence in samples implies increasedrisk of disease. Pathogenic bacteria are those which are considered capable of causing disease inanimals.
General IonsGeneral ions are those mineral salts most commonly present in natural waters. They are primarilysodium, potassium, chloride, calcium, magnesium, sulphate, carbonates and bicarbonates. Theirpresence affects conductivity of water and concentrations variable in surface and groundwaters due tolocal geological, climatic and geographical conditions.
HydrographA plot of flow (typically in a stream) versus time. The time base is variable so that a hydrograph canrefer to a single flood event, to a combination of flood events, or alternatively to the plot of all flowsover a month, year, season or any given period.
MacroinvertebrateInvertebrate (without a backbone) animals which can be seen with the naked eye. In rivers commonmacroinvertebrates are insects, crustaecans, worms and snails.
MedianThe middle reading, or 50th percentile, of all readings taken.
i.e. Of the readings 10, 13, 9, 16 and 11{Re-ordering these to read 9, 10, 11, 13 and 16}The median is 11.
The Mean (or Average), is the sum of all values divided by the total number of readings (which in thiscase equals 11.8).
NutrientsNutrients is a broad term which encompasses elements and compounds which are required by plantsand animals for growth and survival. In the area of water quality the term is generally used with onlyphosphorus and nitrogen in mind, though there are many other elements that living organisms requirefor survival.

State of Rivers Water Quality
vi
pH and AlkalinityThe pH is a measure of the acidity of a solution and ranges in scale from 0 to 14 (from very acid tovery alkaline). A pH value of 7 is considered ‘neutral’. In natural waters, pH is generally between 6.0and 8.5. In waters with little or no buffering capacity, pH is related to alkalinity which is controlled byconcentrations of carbonates, bicarbonates and hydroxides in the water. Waters of low alkalinity (< 24ml/L as CaCO3) have a low buffering capacity and are susceptible to changes in pH from outsidesources.
Riparian VegetationRiparian vegetation are plants (trees, shrubs, ground covers and grasses) which grow on the banks andfloodplains of rivers. A ‘healthy’ riparian zone is characterised by a homogeneous mix of plant species(usually native to the area) of various ages. This zone is important in protecting water quality andsustaining the aquatic life of rivers.
Suspended SolidsSuspended solids are typically comprised of clay, silt, fine particulate organic and inorganic matter andmicroscopic organisms. Suspended solids are that fraction which will not pass through a 0.45µm filterand as such corresponds to non-filterable residues. It is this fraction which tends to contribute most tothe turbidity of water.
Total Nitrogen (TN)Nitrogen in natural waters occurs as Nitrate, Nitrite, Ammonia and complex organic compounds. Totalnitrogen concentration in water can be analysed for directly or through the determination of all of thesecomponents. In this report, Total Nitrogen has been calculated as the sum of Nitrate-N + Nitrite-N +TKN.
Total Phosphorus (TP)Like nitrogen, phosphorus is an essential nutrient for living organisms and exists in water as bothdissolved and particulate forms. Total phosphorus can be analysed directly, and includes both forms.Dissolved phosphorus mostly occurs as orthophosphates, polyphosphates and organic phosphates.
TurbidityTurbidity in water is caused by suspended material such as clay, silt, finely divided organic andinorganic matter, soluble coloured compounds and plankton and microscopic organisms. Turbidity is anexpression of the optical properties that cause light to be scattered and absorbed rather thantransmitted in a straight line through the water. Standard units for turbidity are ‘nephelometric turbidityunits’ (NTU’s) standardised against Formazin solution.

State of Rivers Water Quality
vii
Units and Conversions
mg/L = milligrams per litre (1000 milligrams per gram)µg/L = micrograms per litre (1000 micrograms per milligram)
e.g. 1000 µg/L = 1 mg/LµS/cm = Microsiemens per centimeterm3s-1 = cubic metre per second (commonly referred to as a ‘cumec’)ML = 1 million litres (referred to as a ‘megalitre’)
Acronyms
ANZECC - Australian and New Zealand Environment and Conservation CouncilARMCANZ - Agricultural and Resource Management Council of Australia and New ZealandDPIWE - Department of Primary Industries, Water and EnvironmentDPIF - Department of Primary Industry and Fisheries (replaced by DPIWE)DCHS - Department of Community and Health ServicesNHMRC - National Health and Medical Research CouncilRWSC - Rivers and Water Supply Commission

State of Rivers Water Quality
viii
B SUMMARY OF NATIONAL GUIDELINES FOR WATER QUALITY
Australian Water Quality Guidelines as per ANZECC (draft - 1998)As part of a National strategy to “pursue the sustainable use of the nation’s water resources byprotecting and enhancing their quality while maintaining economic and social development’ theAustralian and New Zealand Environment and Conservation Council (ANZECC) has been developingguidelines for water quality for a range of Australian waters. Since 1992, a document titled ‘AustralianWater Quality Guidelines For Fresh and Marine Waters (1992) ’ has been available for use as areference tool for catchment management plans and policies. At the time of its release, the guidelineswere based on the best scientific information available.
Since 1995, that document has been under review, and a new draft has recently been released forpublic comment (ANZECC, draft 1998). The updated version has changed the emphasis of guidelinesetting, suggesting a ‘risk assessment’ approach which utilises the concept of increased risk withincreasing departure from ‘safe’ levels. It also restates the principle that they are simply guidelines tobe used in the absence of local data, and that where local data can be obtained, they should be used todevelop local water quality standards. This needs to be kept in mind when examining the followingtables which summarise the new draft guidelines. The figures quoted are suggested as interim triggerlevels for assessing risk of adverse effects on different ecosystem types (for essentially naturalecosystems).
1. Proposed Trigger Levels for NutrientsEcosystem Type TP
(µg/L)TN
(µg/L)Key Ecosystem-specific factors
Lowland River 37 1600 - light climate (turbidity)- flow- grazing- bioavailable nutrient [ ]
Upland River 35 340 - light climate (turbidity)- substrate type- bioavailable nutrient [ ]- grazing
Lakes and Reservoirs 50 440 - light climate (turbidity)- mixing (stratification)- bioavailable nutrient [ ]
2. Proposed Trigger Levels for Dissolved Oxygen, Suspended Particulate Matter andTurbidity.Ecosystem Type DO (%sat) Susp. Solids#
(mg/L)Turbidity
(NTU)Lowland River 90 6* 10Upland River 92 2* 5Lakes and Reservoirs 90 2* 4.5# Recommend additional work to establish load based trigger levels;* Professional judgement

State of Rivers Water Quality
ix
3. Proposed Trigger Levels for Conductivity, Temperature and pH.Ecosystem Type EC
(µS/cm)Temp.Increase
Temp.Decrease
pH
Lowland River > 500* < 80th %ile >20th %ile 6.6 - 8.0Upland River > 110* < 80th %ile >20th %ile 6.5 - 7.5Lakes and Reservoirs > 60* < 80th %ile >20th %ile 7.8 - 8.3* Professional judgement;
4. Proposed Microbiological GuidelinesThe new guidelines for recreational waters propose a ‘Bacterial Indicator Index’ which requiresroutine sampling (at least 5 samples over a regular period not exceeding one month). It utilisesstatistics of the entire dataset to form the index in the following manner;
Bacterial Indicator Index = 2.5 x median/100mL + 80th percentile/100mL
Using this formula to calculate the index, the following guideline has been suggested;
Primary Contact (eg swimming)Bacterial Indicator Index should not exceed 800 for thermotolerant coliforms
or 300 for enterococciWhere more intensive monitoring is carried out the index should not exceed 550 for thermotolerantcoliforms, or 200 for enterococci
Secondary Contact (eg boating)Bacterial Indicator Index should not exceed 5000 for thermotolerant coliforms
or 2000 for enterococci
National Health and Medical Research Council - Drinking WaterFor drinking water, guidelines published by the National Health and Medical Research Council(NHMRC, 1996) suggest that no thermotolerant coliforms (eg E. coli) should be present in water usedfor drinking.
State of Rivers Water Quality
x

State of Rivers___________________________________________________Water Quality
1
Water Quality of the Brid River Catchment
1 Historical DataThe only historical water quality data which is readily accessible is for the Brid River at the streamgauging site located several kilometres upstream of the tidal limit (Site #19200 on HYDROL).Interrogation of the HYDROL database for water quality data showed that there has been two generaltypes of data collected at this site. Between 1974 and 1989 there has been some intermittent collectionof water quality data, mainly of the parameters which can be measured on-site such as temperatureand pH. Later in that period (1985 - 94) samples were collected and taken to a laboratory for moredetailed analysis.
During a short period between 1994 - 96 sampling on a 10 week basis was carried out following theinstallation of water quality monitoring equipment at this site. These samples were analysed for awider range of parameters.
Table 1.1a-c gives the summary statistics for the water quality data collected during the early period(1974 - 89). The statistic of most importance in all these tables is that for the median, which gives themost accurate representation of the ‘usual’ or ‘average’ condition of the water quality in the river. Tomake it easier to visualise, some of the parameters which have larger datasets are also plotted inFigures 1.1 to 1.4. The river level, which has been noted on all occasions where water quality hasbeen tested, is also plotted to indicate the hydrological condition under which testing was performed.
Table 1.1a Statistics of historical water quality - Brid River 2.6 km upstream of tidal limit. (Hydrol#19200).
River Level Lab pH Field pH (Litmus) TemperatureParameter Number 100.00 15401 15408 10100Number of Readings 155 81 73 147Period of Record 1974 - 1994 1974 - 1989 1982 - 1994 1974 - 1994Maximum 1.065 8.6 7.7 22.0Minimum 0.018 5.9 5.3 3.0Median 0.245 6.7 6.5 12.0Average 0.230 6.7 6.6 12.0
Table 1.1b Statistics of historical water quality - Brid River 2.6 km upstream of tidal limit. (Hydrol#19200).
Turbidity(NTU)
Field ConductivityTref 25oC (µS/cm)
Apparent Colour (HazenUnits)
Suspended Solids (mg/L)
Parameter Number 13601 14101 12301 17100Number of Readings 19 31 21 21Period of Record 1985 - 1989 1983 - 1994 1985 - 1989 1985 - 1989Maximum 20 277 150 42Minimum 3.3 95 50 4Median 10.4 153 70 11Average 11.0 161 75 15
State of Rivers Water Quality
2
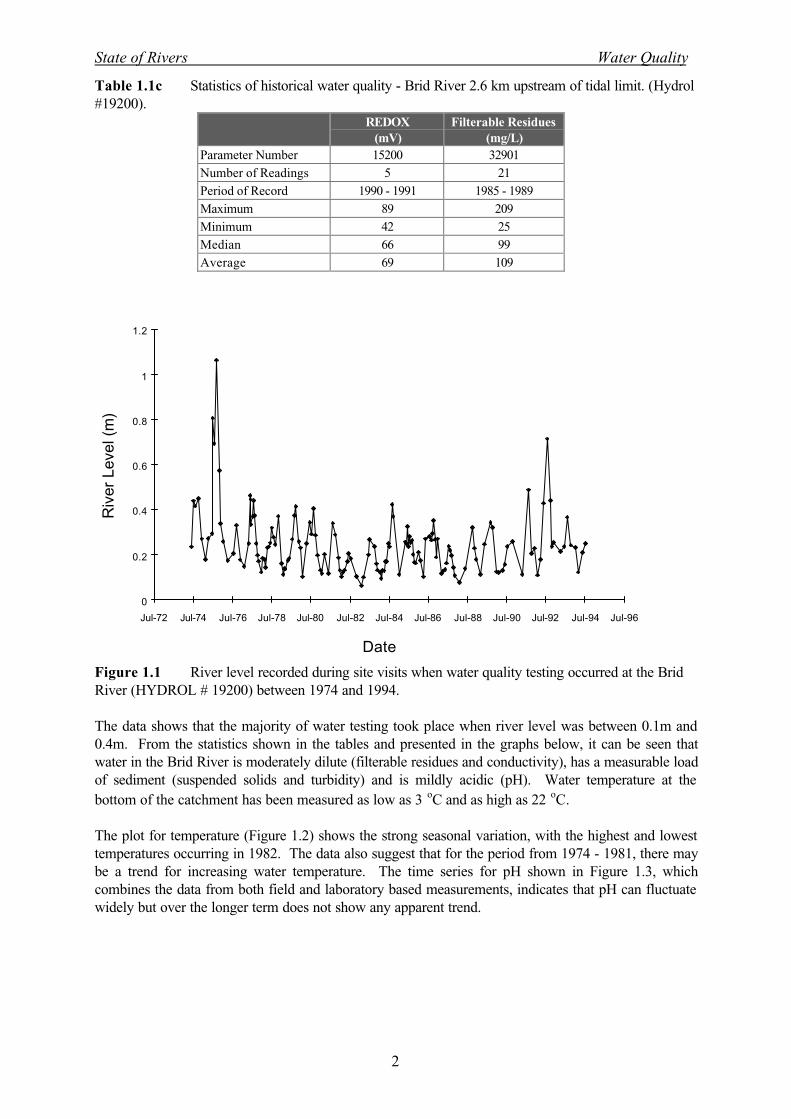
Table 1.1c Statistics of historical water quality - Brid River 2.6 km upstream of tidal limit. (Hydrol#19200).
REDOX(mV)
Filterable Residues(mg/L)
Parameter Number 15200 32901Number of Readings 5 21Period of Record 1990 - 1991 1985 - 1989Maximum 89 209Minimum 42 25Median 66 99Average 69 109
Riv
er L
evel
(m
)
0
0.2
0.4
0.6
0.8
1
1.2
Jul-72 Jul-74 Jul-76 Jul-78 Jul-80 Jul-82 Jul-84 Jul-86 Jul-88 Jul-90 Jul-92 Jul-94 Jul-96
Date
Figure 1.1 River level recorded during site visits when water quality testing occurred at the BridRiver (HYDROL # 19200) between 1974 and 1994.
The data shows that the majority of water testing took place when river level was between 0.1m and0.4m. From the statistics shown in the tables and presented in the graphs below, it can be seen thatwater in the Brid River is moderately dilute (filterable residues and conductivity), has a measurable loadof sediment (suspended solids and turbidity) and is mildly acidic (pH). Water temperature at thebottom of the catchment has been measured as low as 3 oC and as high as 22 oC.
The plot for temperature (Figure 1.2) shows the strong seasonal variation, with the highest and lowesttemperatures occurring in 1982. The data also suggest that for the period from 1974 - 1981, there maybe a trend for increasing water temperature. The time series for pH shown in Figure 1.3, whichcombines the data from both field and laboratory based measurements, indicates that pH can fluctuatewidely but over the longer term does not show any apparent trend.

State of Rivers Water Quality
3
Wat
er T
empe
ratu
re (
o C)
0
5
10
15
20
25
Jul-72 Jul-74 Jul-76 Jul-78 Jul-80 Jul-82 Jul-84 Jul-86 Jul-88 Jul-90 Jul-92 Jul-94 Jul-96
Date
Figure 1.2 Water temperature recorded during site visits when water quality testing occurred atthe Brid River (HYDROL # 19200) between 1974 and 1994.
4
4.5
5
5.5
6
6.5
7
7.5
8
8.5
9
Jul-72 Jul-74 Jul-76 Jul-78 Jul-80 Jul-82 Jul-84 Jul-86 Jul-88 Jul-90 Jul-92 Jul-94 Jul-96
Lab
& F
ield
pH
Date
Figure 1.3 pH (measured on site or from bottle samples) from the Brid River (HYDROL #19200) between 1974 and 1994.
The data for conductivity is more sparse, with two groups of data, one from about 1983 and the otherstretching from 1989 to 1994. Both show that like pH, conductivity in the lower Brid River also variessubstantially. However, the average is about 150 µS/cm.
State of Rivers Water Quality
4
0
50
100
150
200
250
300
Jul-72 Jul-74 Jul-76 Jul-78 Jul-80 Jul-82 Jul-84 Jul-86 Jul-88 Jul-90 Jul-92 Jul-94 Jul-96
Date
Con
duct
ivity
(µS
/cm
)
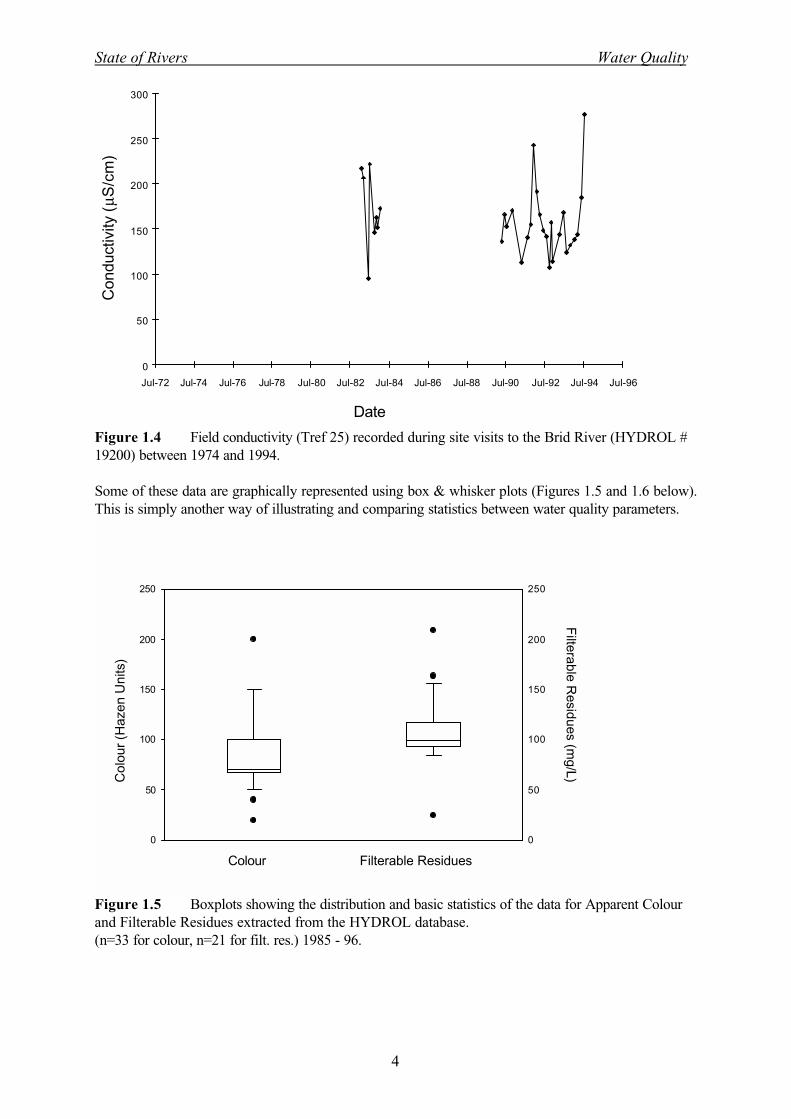
Figure 1.4 Field conductivity (Tref 25) recorded during site visits to the Brid River (HYDROL #19200) between 1974 and 1994.
Some of these data are graphically represented using box & whisker plots (Figures 1.5 and 1.6 below).This is simply another way of illustrating and comparing statistics between water quality parameters.
0
50
100
150
200
250
0
50
100
150
200
250
Filterable R
esidues (mg/L)C
olou
r (H
azen
Uni
ts)
Colour Filterable Residues
Figure 1.5 Boxplots showing the distribution and basic statistics of the data for Apparent Colourand Filterable Residues extracted from the HYDROL database.(n=33 for colour, n=21 for filt. res.) 1985 - 96.

State of Rivers Water Quality
5
0
10
20
30
40
50
60
0
10
20
30
40
50
60
Total S
uspended Solids (m
g/L)
Tur
bidi
ty (N
TU
)
Turbidity Total Suspended Solids
Figure 1.6 Boxplots showing the distribution and basic statistics of the data for Turbidity and TotalSuspended Solids extracted from the HYDROL database.(n=29 for turb, n=32 for TSS). 1985 - 96.
Between 1994-’96 some routine sampling for nutrients was undertaken on about a 10 weeklyfrequency. This data was collected following the installation of turbidity and conductivity monitoringequipment at the stream gauging station. For the purposes of this report, it has been kept separatefrom the other historical data as it is considered as indicative of more recent conditions.
The data shows that nitrate nitrogen (NO3/N) concentrations are between 0.2 - 0.5 mg/L, andcontribute about 40% to total nitrogen (TN) concentrations. The peak TN concentration measuredwas 1.45 mg/L, which is much higher than the median of 0.93 mg/L. That concentration was recordedtwice during high flows in the Brid River when the load of suspended material was elevated. On boththose occasions, total phosphorus (TP) concentrations were also high (0.098 & 0.11 mg/L). The datain Figure 1.8 shows that the median TP concentration in the lower Brid River are about 0.05 mg/L.The same figure also shows the concentrations of ammonia nitrogen (NH3/N), which is generally lowerthan other nutrients, but can reach very high concentrations as indicated by the upper whisker andoutlier.
Box plots illustrating the statistics of the data for dissolved salts and minerals are presented in Figures1.9 and 1.10. They show that chloride, sodium and silica are the major ions present in the Brid Riverand calcium, sulphate and iron are present in lesser amounts. These data will be referred to whendiscussing the results of testing during the present study.

State of Rivers Water Quality
6
Con
cent
ratio
n (m
g/L)
0.2
0.4
0.6
0.8
1.2
1.4
1.6
1.8
0.0
1.0
2.0
Con
cent
ratio
n (m
g/L)
0.2
0.4
0.6
0.8
1.2
1.4
1.6
1.8
0.0
1.0
2.0
Nitrate/N Total Nitrogen
Figure 1.7 Boxplots showing the distribution and basic statistics of the data for Nitrate/N andTotal N extracted from the HYDROL database (n = 11; data from period 1994-96). 1994 - 96.
Con
cent
ratio
n (m
g/L)
0.00
0.05
0.10
0.15
0.20
0.25
0.30
0.35C
once
ntra
tion
(mg/
L)
0.00
0.05
0.10
0.15
0.20
0.25
0.30
0.35
Ammonia/N Total Phosphorus
Figure 1.8 Boxplots showing the distribution and basic statistics of the data for Ammonia/N andTotal P extracted from the HYDROL database (n = 11; data from period 1994-96). 1994 - 96.

State of Rivers Water Quality
7
Con
cent
ratio
n (m
g/L)
0
10
20
30
40
Con
cent
ratio
n (m
g/L)
0
10
20
30
40
Chloride Silica Sodium
Figure 1.9 Boxplots showing the distribution and basic statistics of the data for total Chloride,Silica and Sodium extracted from the HYDROL database (n = 12; data from period 1994-96). 1994 -96.
Con
ccen
trat
ion
(mg/
L)
0
1
2
3
4
5
6
7
Con
cent
ratio
n (m
g/L)
0
1
2
3
4
5
6
7
Sulphate Iron Calcium
Figure 1.10 Boxplots showing the distribution and basic statistics of the data for total Sulphate, Ironand Calcium from the HYDROL database (n = 12; data from period 1994-96).

State of Rivers Water Quality
8
2 Waterwatch ActivitiesWaterwatch activities began in the Scottsdale area following the accidental release of pyrethrum andcaustic soda into the Great Forester River in April 1994. The spill killed all of the macroinvertebrateand fish life in a section of the Great Forester River, and together with mounting community concernover other pollution incidents and perceptions of atrazine contamination of town water resulted in apublic meeting from which ‘Dorset Waterwatch’ was formed. The members of this group represent awide range of interests including education, forestry, local government, agriculture, aquaculture,industry, health services and recreation.
The Dorset Sustainable Development Strategy, developed by Dorset Council through consultation withall stakeholders and sectors of the community, has identified water as a key issue in terms of protectionof natural resources. Dorset Council have been most supportive of Waterwatch and provided achairperson in the initial stages of forming the group and $3,000 for the purchase of chemicals andequipment. They continue to provide administrative support in the form of office space, computer,phone, postage, photocopying and an annual audit. Since 1996 Dorset Waterwatch have receivedfinancial assistance through NHT to employ a regional coordinator.
The group monitors water quality in the 3 major rivers in the municipality, the Brid, Ringarooma andGreat Forester as well as Cox’s Rivulet and waterways in the Waterhouse Protected Area. The data isused to gain a picture of baseline results as well as highlighting areas in need of improvement. Thegroup also runs a community education campaign which has been fuelled by issues such as elevatedturbidity levels during flood events in the major rivers and high phosphate levels in Coxs’s Rivulet.
In the Brid River system, Waterwatch has sampled at 6 sites since the start of monitoring in 1995.Most data has been collected at one site in the upper catchment (BRI 010) and another site lowerdown on the Brid River (BRI 070).
Table 2.1 Location of sites sampled by Dorset Waterwatch group between June 1995 andNovember 1998.
Site Code Easting Northing Site VisitsUpper Brid - Midson’s BRI 010 538600 5432500 11Brid at Tasman Hwy BRI 020 538400 5435300 2Brid at Sledge Track BRI 040 540000 5440400 4Brid at Duncraggen Rd BRI 050 535300 5452300 3Brid at Briddale BRI 070 530200 5457500 15Brid at Stream Gauging Station BRI 080 532100 5459200 5
# Data collected between August,1995 - October, 1998.
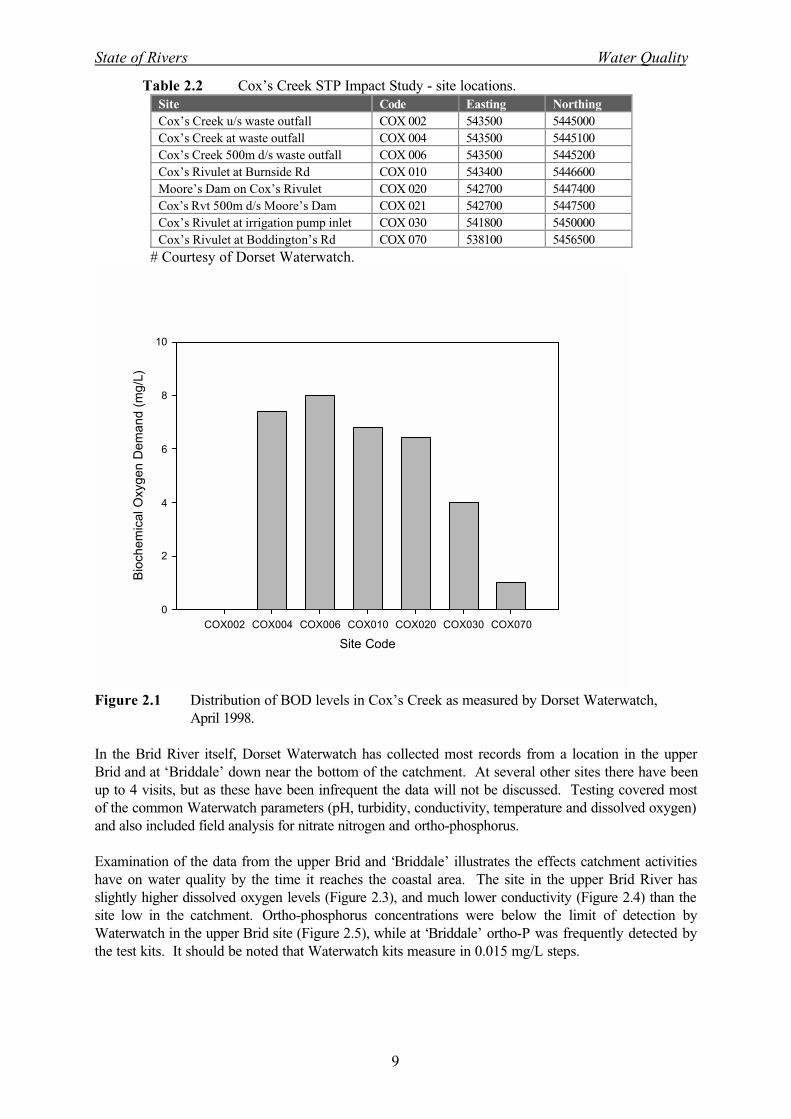
Some sampling has also been undertaken in Cox’s Rivulet (sites listed in Table 2.2, below), a smallcatchment running north between the Brid River and Great Forester River catchments. This samplingwas carried out to examine the influence of outfall discharge from the Scottsdale sewage treatmentplant on water quality in Cox’s Creek and lower down on Cox’s Rivulet. Some of this data wascollated and reported in a Dorset Waterwatch document circulated in April, 1998. The results showedthat several water quality measures deteriorated immediately below of the discharge point, but didrecover to some degree further downstream. Plots showing some of the results from that report arepresented in Figure 2.1 and 2.2.
State of Rivers Water Quality
9
Table 2.2 Cox’s Creek STP Impact Study - site locations.Site Code Easting NorthingCox’s Creek u/s waste outfall COX 002 543500 5445000Cox’s Creek at waste outfall COX 004 543500 5445100Cox’s Creek 500m d/s waste outfall COX 006 543500 5445200Cox’s Rivulet at Burnside Rd COX 010 543400 5446600Moore’s Dam on Cox’s Rivulet COX 020 542700 5447400Cox’s Rvt 500m d/s Moore’s Dam COX 021 542700 5447500Cox’s Rivulet at irrigation pump inlet COX 030 541800 5450000Cox’s Rivulet at Boddington’s Rd COX 070 538100 5456500
# Courtesy of Dorset Waterwatch.
Site Code
COX002 COX004 COX006 COX010 COX020 COX030 COX070
Bio
chem
ical
Oxy
gen
Dem
and
(mg/
L)
0
2
4
6
8
10
Figure 2.1 Distribution of BOD levels in Cox’s Creek as measured by Dorset Waterwatch,April 1998.
In the Brid River itself, Dorset Waterwatch has collected most records from a location in the upperBrid and at ‘Briddale’ down near the bottom of the catchment. At several other sites there have beenup to 4 visits, but as these have been infrequent the data will not be discussed. Testing covered mostof the common Waterwatch parameters (pH, turbidity, conductivity, temperature and dissolved oxygen)and also included field analysis for nitrate nitrogen and ortho-phosphorus.
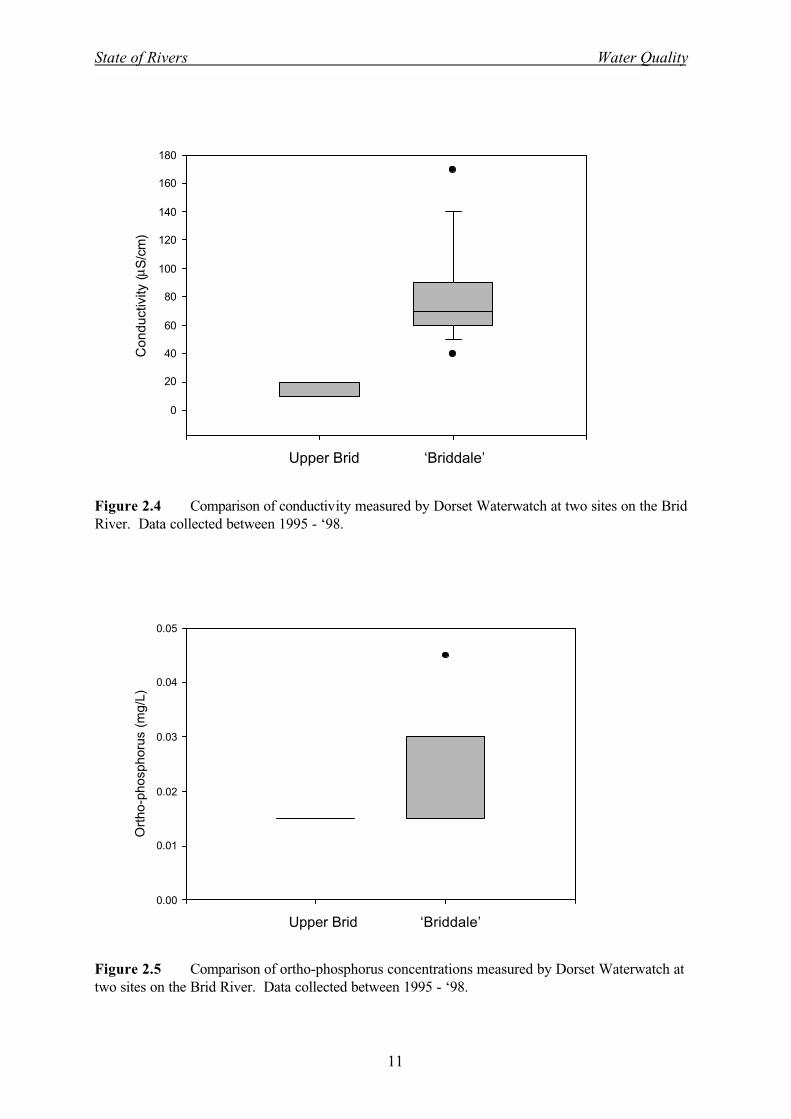
Examination of the data from the upper Brid and ‘Briddale’ illustrates the effects catchment activitieshave on water quality by the time it reaches the coastal area. The site in the upper Brid River hasslightly higher dissolved oxygen levels (Figure 2.3), and much lower conductivity (Figure 2.4) than thesite low in the catchment. Ortho-phosphorus concentrations were below the limit of detection byWaterwatch in the upper Brid site (Figure 2.5), while at ‘Briddale’ ortho-P was frequently detected bythe test kits. It should be noted that Waterwatch kits measure in 0.015 mg/L steps.

State of Rivers Water Quality
10
Site Code
COX002 COX004 COX006 COX010 COX020 COX030 COX070
Con
duct
ivity
( µS
/cm
)
0
200
400
600
800
1000
Figure 2.2 Conductivity variation in Cox’s Creek as measured by Dorset Waterwatch,April 1998.
% D
isso
lved
Oxy
gen
90
100
110
Upper Brid ‘Briddale’
Figure 2.3 Comparison of dissolved oxygen (% saturation) measured by Dorset Waterwatch attwo sites on the Brid River. Data collected between 1995 - ‘98.
State of Rivers Water Quality
11
Con
duct
ivity
(µS
/cm
)
0
20
40
60
80
100
120
140
160
180
Upper Brid ‘Briddale’
Figure 2.4 Comparison of conductivity measured by Dorset Waterwatch at two sites on the BridRiver. Data collected between 1995 - ‘98.
Ort
ho-p
hosp
horu
s (m
g/L)
0.00
0.01
0.02
0.03
0.04
0.05
Upper Brid ‘Briddale’
Figure 2.5 Comparison of ortho-phosphorus concentrations measured by Dorset Waterwatch attwo sites on the Brid River. Data collected between 1995 - ‘98.

State of Rivers Water Quality
12
Tur
bidi
ty (N
TU
by
tube
)
0
10
20
30
40
50
60
Upper Brid ‘Briddale’
Figure 2.6 Comparison of turbidity measured by Dorset Waterwatch at two sites on the BridRiver. Data collected between 1995 - ‘98.
The data for turbidity (Figure 2.6) reflects the pattern for ortho-P, with a significant increase in turbidityat Briddale compared to the upper Brid site. This data, along with the other data collected by DorsetWaterwatch, helps to further develop a picture of the water quality in the Brid River. It is clear fromWaterwatch data that while water quality is good in the upper reaches, by the time water reaches thecoastal plain it has deteriorated markedly.
3 Current StudyThe following water quality data was collected during 1998 in conjunction with a studies of rivers inthe Ringarooma and Great Forester catchments. The main aim of sampling in the Brid River was tocollect current data on the ambient quality of water and report on background conditions in the river.These data, when viewed in conjunction with land use and river condition information, should assist inidentifying sites or areas which could be targeted for remediation activities in the future.
The collection of data was carried out at several levels. Monthly visits were undertaken at two sites todetermine the physico-chemical nature of water quality. Due to resource limitations, sampling fornutrients and dissolved salts was carried out at only one of these sites. The second level of samplinginvolved catchment-wide ‘snapshot’ surveys covering a multitude of sites along the length of the river.During these surveys, field testing was performed at 12 sites, with samples for laboratory analysisbeing taken at a subset of these. The third tier of sampling involved the use of in-stream loggingequipment to examine diurnal changes in dissolved oxygen and other water quality parameters at onesite in the middle reaches of the Brid River. In-stream monitoring of some water quality variables isalso performed in association with streamflow monitoring at the lowermost site on the Brid River. Atthis site, turbidity, conductivity and temperature is currently monitored on a continuous basis. When thedata from this source is combined with nutrient concentrations from samples collected during floodevents, calculations of nutrient fluxes for the period can be made. The results of these calculations willalso be presented during this report.

State of Rivers Water Quality
13
Monthly sampling was carried out at the station on the Brid River just upstream of the tidal limit wherestreamflow monitoring is carried out. Monthly field testing for physico-chemical parameters wascarried out at another site on the main river in the upper part of the catchment. The location and gridreferences of these two sites is listed in the Table 3.1.
Table 3.1 Location of sites where monthly water quality monitoring was carried out during thepresent study.
Site Name Code Easting Northing Monitoring TypeBrid River at Golconda Rd BR1 539000 5444500 Phys-chemBrid River u/s Tidal Limit BR2 532125 5459225 Phys-chem+ Samples
The physico-chemical parameters tested in the field included pH (compensated for temperature),electrical conductivity (corrected to reference temperature 25 oC), water temperature, turbidity anddissolved oxygen. Water samples were taken and analysed in a NATA registered laboratory for thefollowing nutrients; ammonia nitrogen (NH3/N), nitrate nitrogen (NO3/N), nitrite nitrogen (NO2/N),Kjeldahl nitrogen (TK/N), dissolved reactive phosphorus (DR/P) and total phosphorus (TP). Totalnitrogen (TN) was derived using the formula ;
TN = TK/N + NO3/N + NO2/N.
Every 2 months samples were also taken for laboratory analysis to determine general ion content andfactors affected by levels of dissolved salts. These included determination of iron, calcium, magnesium,sulphate, chloride, sodium, potassium, silica, hardness, colour, alkalinity and suspended solidsconcentrations.
3.1 Physico-chemical propertiesWater TemperatureThe difference between water temperature in the Brid River at Golconda and at the stream gaugingstation near the coast was not great during autumn and winter (Figure 3.1) but on two occasionsdiffered by more than 3 oC. On all monitoring rounds, water temperature at the site low in thecatchment was greater than at Golconda Rd.
The variation in daily average water temperature for 1998 in the lower Brid River, as recorded bycontinuous monitoring equipment, is plotted in Figure 3.2. The graph shows both the seasonal patternof change in water temperature and also the large differences between days, which tends to reflectfrontal activity and other shorter term climatic variation. It does not show the maximum and minimumwater temperatures associated with diurnal warming and cooling.
The data for water temperature can also be summarised through duration analysis, which is an analysiswhich partitions the data according to time spent within defined temperature ranges. A durationanalysis for the record collected during the period of the study is shown in Table 3.2. It shows thatover the 365 days of 1998, water temperature was within the range 5 - 20 oC for more than 90% of thetime.

State of Rivers Water Quality
14
1998
Jan Mar May Jul Sep Nov Jan
Tem
pera
ture
(o C)
0
5
10
15
20
25
Brid at SG StationBrid at Golconda
Figure 3.1 Time series plot of water temperature at two sites in the Brid River. The site atGolconda Rd is located halfway up the catchment.
Year 1998
Jan Feb Mar Apr May Jun Jul Aug Sep Oct Nov Dec Jan
Wat
er T
empe
ratu
re (
o C)
0
5
10
15
20
25
Figure 3.2 Time series plot of water temperature in the Brid River 2km upstream of the tidal limit.Daily average data was used.
State of Rivers Water Quality
15
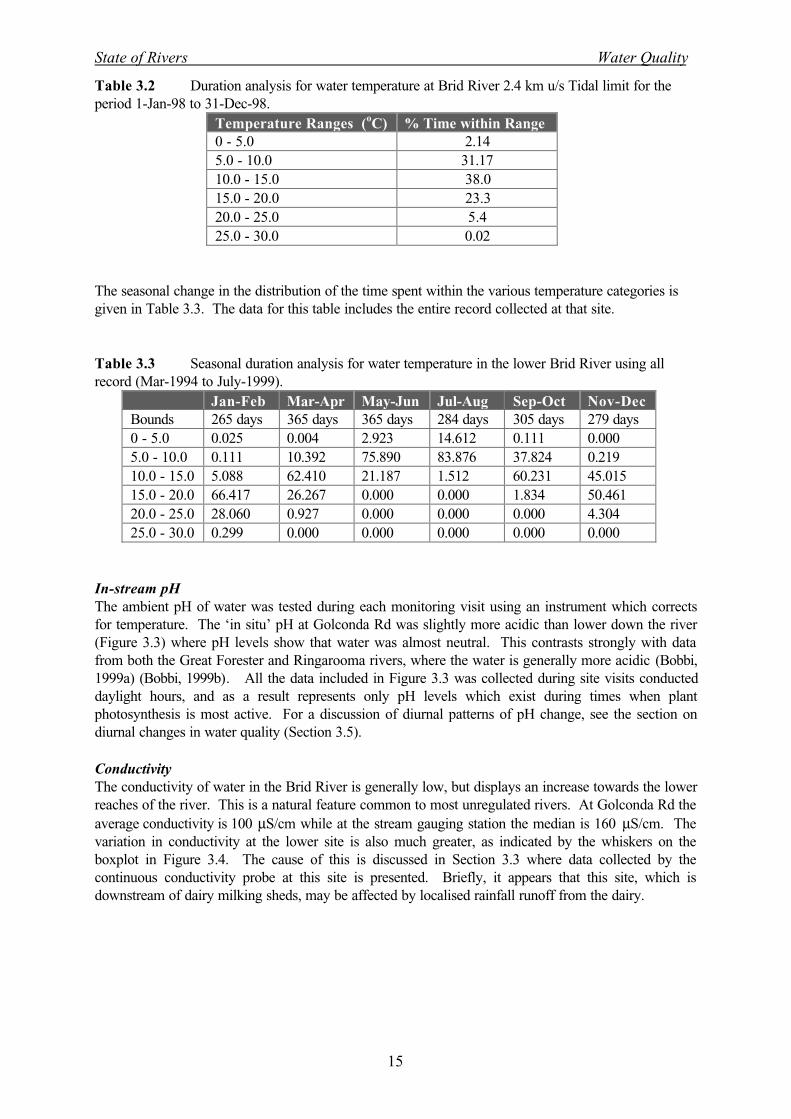
Table 3.2 Duration analysis for water temperature at Brid River 2.4 km u/s Tidal limit for theperiod 1-Jan-98 to 31-Dec-98.
Temperature Ranges (oC) % Time within Range0 - 5.0 2.145.0 - 10.0 31.1710.0 - 15.0 38.015.0 - 20.0 23.320.0 - 25.0 5.425.0 - 30.0 0.02
The seasonal change in the distribution of the time spent within the various temperature categories isgiven in Table 3.3. The data for this table includes the entire record collected at that site.
Table 3.3 Seasonal duration analysis for water temperature in the lower Brid River using allrecord (Mar-1994 to July-1999).
Jan-Feb Mar-Apr May-Jun Jul-Aug Sep-Oct Nov-DecBounds 265 days 365 days 365 days 284 days 305 days 279 days0 - 5.0 0.025 0.004 2.923 14.612 0.111 0.0005.0 - 10.0 0.111 10.392 75.890 83.876 37.824 0.21910.0 - 15.0 5.088 62.410 21.187 1.512 60.231 45.01515.0 - 20.0 66.417 26.267 0.000 0.000 1.834 50.46120.0 - 25.0 28.060 0.927 0.000 0.000 0.000 4.30425.0 - 30.0 0.299 0.000 0.000 0.000 0.000 0.000
In-stream pHThe ambient pH of water was tested during each monitoring visit using an instrument which correctsfor temperature. The ‘in situ’ pH at Golconda Rd was slightly more acidic than lower down the river(Figure 3.3) where pH levels show that water was almost neutral. This contrasts strongly with datafrom both the Great Forester and Ringarooma rivers, where the water is generally more acidic (Bobbi,1999a) (Bobbi, 1999b). All the data included in Figure 3.3 was collected during site visits conducteddaylight hours, and as a result represents only pH levels which exist during times when plantphotosynthesis is most active. For a discussion of diurnal patterns of pH change, see the section ondiurnal changes in water quality (Section 3.5).
ConductivityThe conductivity of water in the Brid River is generally low, but displays an increase towards the lowerreaches of the river. This is a natural feature common to most unregulated rivers. At Golconda Rd theaverage conductivity is 100 µS/cm while at the stream gauging station the median is 160 µS/cm. Thevariation in conductivity at the lower site is also much greater, as indicated by the whiskers on theboxplot in Figure 3.4. The cause of this is discussed in Section 3.3 where data collected by thecontinuous conductivity probe at this site is presented. Briefly, it appears that this site, which isdownstream of dairy milking sheds, may be affected by localised rainfall runoff from the dairy.

State of Rivers Water Quality
16
Fie
ld p
H
0
6
7
8
Brid at Golconda Rd Brid at SG Station
Figure 3.3 Field pH at two sites in the Brid River. Data collected during monthly monitoringvisits, 1998.
Con
duct
ivity
( µS
/cm
)
0
100
200
300
400
500
Brid at Golconda Rd Brid at SG Station
Figure 3.4 Field conductivity at two sites in the Brid River. Data collected during monthlymonitoring visits, 1998.

State of Rivers Water Quality
17
TurbidityTurbidity of water in waterways reflects the amount of suspended material being carried by the water.This suspended matter can be organic (ie plant material or algal particles) or inorganically derived (ieclays, silt, etc). In the Brid River, which is a prime agricultural catchment, turbidity is most likely to becaused by soil disturbance and stream bank erosion. Drainage activities can also increase watervelocities, allowing the water to carry higher concentrations of suspended matter. When seeking toestablish ‘baseline’ water quality it is therefore important that monthly monitoring avoid higher flowevents where possible. Separate sampling during floods can then be compared with what the river isnormally like and is useful in showing how turbidity levels increase with entry to the river of rainfallrunoff from the catchment.
The monthly data from the Brid River (Figure 3.5) reveals that there is no significant differencebetween the upper and lower sites. Both sites have average turbidity levels of around 15 NTU, whichis above the 10 NTU trigger levels suggested in the ANZECC (1998 draft) water quality guidelines forthe protection of aquatic ecosystems. The data tends to indicate that much of the turbidity entering theBrid River may be derived from the catchment above Golconda Rd and is not settling out to anysignificant degree by the time it reaches the coastal area. These turbidity levels are much higher thanwas found by recent studies in the Ringarooma (Bobbi, 1999a) and Great Forester (Bobbi, 1999b)catchments.
Tur
bidi
ty (
NT
U)
0
5
10
15
20
25
30
Brid at Golconda Rd Brid at SG Station
Figure 3.5 Turbidity at two sites in the Brid River. Data collected during monthly monitoringvisits, 1998.
Dissolved OxygenDissolved oxygen is one of the parameters most commonly used to measure the health of the aquaticecosystem. During this study oxygen concentrations in the river were measured on site using portablefield probes which employ membrane diffusion along with silver/gold anode for oxygen detection. Atboth sites, dissolved oxygen was measured in flowing water.
State of Rivers Water Quality
18
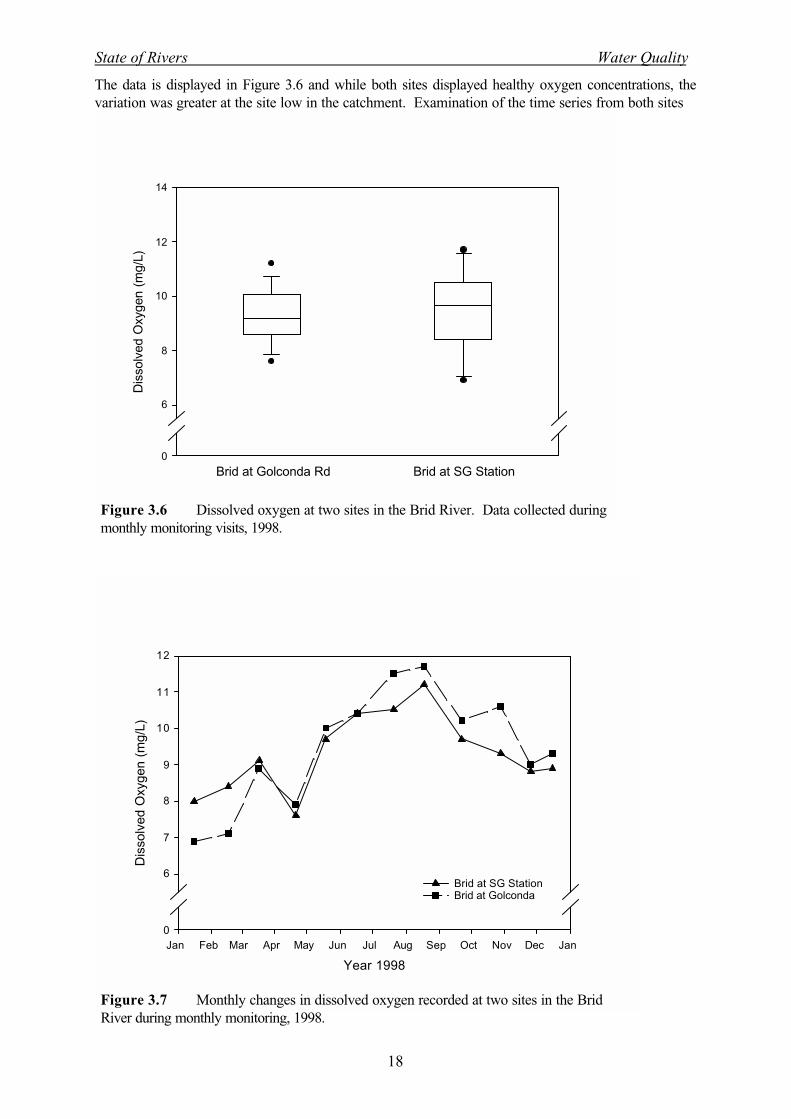
The data is displayed in Figure 3.6 and while both sites displayed healthy oxygen concentrations, thevariation was greater at the site low in the catchment. Examination of the time series from both sites
Dis
solv
ed O
xyge
n (m
g/L)
0
6
8
10
12
14
Brid at Golconda Rd Brid at SG Station
Year 1998
Jan Feb Mar Apr May Jun Jul Aug Sep Oct Nov Dec Jan
Dis
solv
ed O
xyge
n (m
g/L)
0
6
7
8
9
10
11
12
Brid at SG StationBrid at Golconda
Figure 3.6 Dissolved oxygen at two sites in the Brid River. Data collected duringmonthly monitoring visits, 1998.
Figure 3.7 Monthly changes in dissolved oxygen recorded at two sites in the BridRiver during monthly monitoring, 1998.
State of Rivers Water Quality
19
(Figure 3.7) shows that oxygen levels were much lower at Golconda Rd during the January andFebruary site visits, when river flow was very low (see accompanying report ‘Hydrological Analysis ofthe Brid River Catchment’). During the rest of the study, dissolved oxygen concentrations wereconsistently lower at the stream gauging station at the bottom of the catchment. However, across thewhole year, oxygen levels were reflective of a relatively healthy system.
For a discussion of diurnal changes in dissolved oxygen and other water quality parameters, see Section3.5.
3.2 General Ionic CompositionAs chemical testing took place at only one site on the Brid River, monitoring results will be discussedand compared with the data which was collected during the period between 1994 and 1996. Duringthis study, samples for ionic analysis were taken every two months, as these constituents are generallyconsidered to be ‘conservative’ and vary only slightly over time. The ionic character of water typicallyreflects the influence of soils and the underlying geology of a catchment. Where water flows throughlimestone rock types, it will generally have a higher concentration of calcium and magnesium, andconsequently have a higher hardness and alkalinity. Where rivers flow through a dolerite dominatedlandscape, they will generally have lower amounts of dissolved ‘salts’, though silica and iron can begreater.
In the Brid River, the underlying geology is a rather complicated mix of tertiary basalts, granodioriteand mudstone sequences in the upper catchment. Further down the catchment, the river flows throughand area underlain by the Mathinna Beds and Holocene aged sands and gravels. As the conductivityresults from the Waterwatch group indicate, salt levels are very low in the upper catchment. It is likelythat the majority of the dissolved salts in the Brid River is added by the soils and geology in the middleand lower catchment. This area, particularly on the western side, is dominated by the Mathinna Beds.
The data for ionic composition shows that Brid River water has moderate to low levels of dissolvedsalts and is reasonably soft (indicated by hardness values in Figure 3.8). Compared to water in theRingarooma and Great Forester rivers, concentrations of most parameters are higher, with theexception of iron, which was very similar. As a comparison, hardness in the Great Forester andRingarooma rivers was generally around 15 mg/L and 11 mg/L, respectively. In the Brid River,hardness varies between 19 mg/L and 34 mg/L. As Figures 3.8 and 3.9 show, the data for ioniccomposition measured during this study is very similar to that collected during sampling in 1994-’96,although the degree of scatter in the data is not as great.
Sulphate concentrations (Figure 3.9) are also very similar to those measured in both the Great Foresterand lower Ringarooma rivers. Sulphate is naturally present in surface waters as SO4
2-, and generallyoriginates from ocean aerosols or geological sources such as leaching from sulphite minerals insedimentary rocks (UNESCO, 1992). In Tasmania, several studies have shown that concentrations inmany natural waters is around 5 mg/L (Bobbi, Fuller & Oldmeadow, 1996) (Bobbi, 1997) (Bobbi, 1998)(Bobbi, 1999a) with streams receiving some form of polluted effluent having sulphate concentrationssignificantly higher than this (15 - 30 mg/L).

State of Rivers Water Quality
20
Con
cent
ratio
n (m
g/L)
0
10
20
30
40
50
Hardness Chloride
Current 1994-’96 Current 1994-’96
Figure 3.8 Statistics for hardness and total chloride in the Brid River at the stream gauging stationfor data collected during the current study (n = 6) and data collected during the period 1994-’96 (n =12).
Con
cent
ratio
n (m
g/L)
0
1
2
3
4
5
6
7
Iron Sulphate
Current 1994-’96 Current 1994-’96
Figure 3.9 Statistics for iron and sulphate in the Brid River at the stream gauging station for datacollected during the current study (n = 6) and data collected during the period 1994-’96 (n = 12).

State of Rivers Water Quality
21
3.3 Nutrient ResultsThe concentrations of nutrients in water draining agricultural areas can be quite low. Nutrients such asnitrate, ammonia, organic nitrogen and the various forms of phosphorus are generally present at levelswhich preclude field based analysis, as field testing kits cannot operate accurately at these low levelsand often lack the precision needed. Therefore samples were taken and delivered to a registeredlaboratory which could measure down to the required levels (around the 0.01mg/L level). Theselaboratories operate under strict quality control and are able to deliver results which are quality assuredunder NATA (National Association of Testing Authorities). Occasional duplicates and blank sampleswere tested as a means of checking field sampling and preservation operations.
NitrogenTotal nitrogen (TN) is the sum of organic nitrogen, nitrate nitrogen (NO3/N) and nitrite (NO2/N),though NO2/N is not normally detected in environmental waters unless there is some form of localpollution. The data for TN concentrations during monthly monitoring is shown in Figure 3.10 along withthe flow in the river at the time of sampling.
Jan May Sep Jan
Con
cent
ratio
n (m
g/L)
or
F
low
(m
3 s-1)
0.0
0.5
1.0
1.5
2.0
River Flow[Total N]
1998
Figure 3.10 Diagram of changes in Total N concentration and river flow at the Brid River siteduring the study period.
Total N concentrations ranged between about 0.65 mg/L during lower flows earlier in the study, to ashigh as 1.35 mg/L during higher baseflows in winter. The link between concentrations and flow is quiteclear. Looking more closely at the nitrogen data, specifically the NO3/N component (Figure3.11), it isapparent that NO3/N may be the major factor influencing the overall pattern of TN concentration. Thebaseflow concentration of organic nitrogen (median of 0.43 mg/L) is more constant than NO3/Nconcentration, if the sample from June is disregarded.
State of Rivers Water Quality
22
Jan May Sep Jan
Con
cent
ratio
n (m
g/L)
or
F
low
(m
3 s-1)
0.0
0.5
1.0
1.5
2.0
River Flow [Nitrate-N]
1998
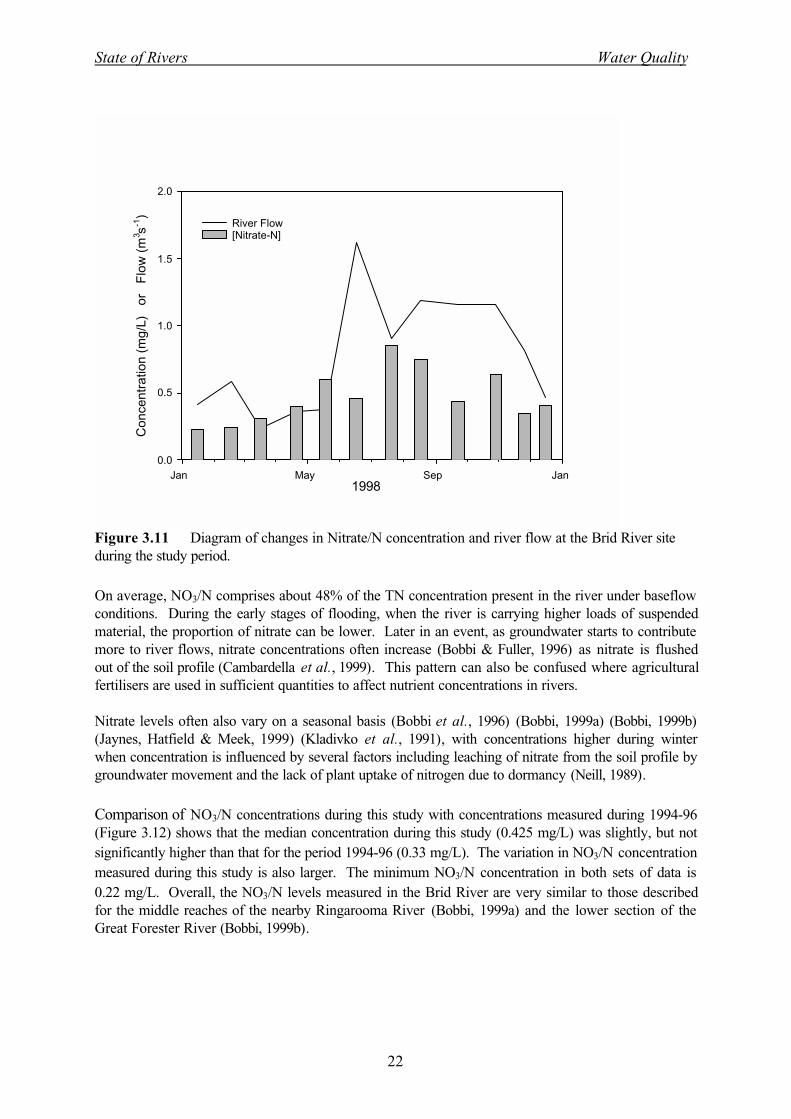
Figure 3.11 Diagram of changes in Nitrate/N concentration and river flow at the Brid River siteduring the study period.
On average, NO3/N comprises about 48% of the TN concentration present in the river under baseflowconditions. During the early stages of flooding, when the river is carrying higher loads of suspendedmaterial, the proportion of nitrate can be lower. Later in an event, as groundwater starts to contributemore to river flows, nitrate concentrations often increase (Bobbi & Fuller, 1996) as nitrate is flushedout of the soil profile (Cambardella et al., 1999). This pattern can also be confused where agriculturalfertilisers are used in sufficient quantities to affect nutrient concentrations in rivers.
Nitrate levels often also vary on a seasonal basis (Bobbi et al., 1996) (Bobbi, 1999a) (Bobbi, 1999b)(Jaynes, Hatfield & Meek, 1999) (Kladivko et al., 1991), with concentrations higher during winterwhen concentration is influenced by several factors including leaching of nitrate from the soil profile bygroundwater movement and the lack of plant uptake of nitrogen due to dormancy (Neill, 1989).
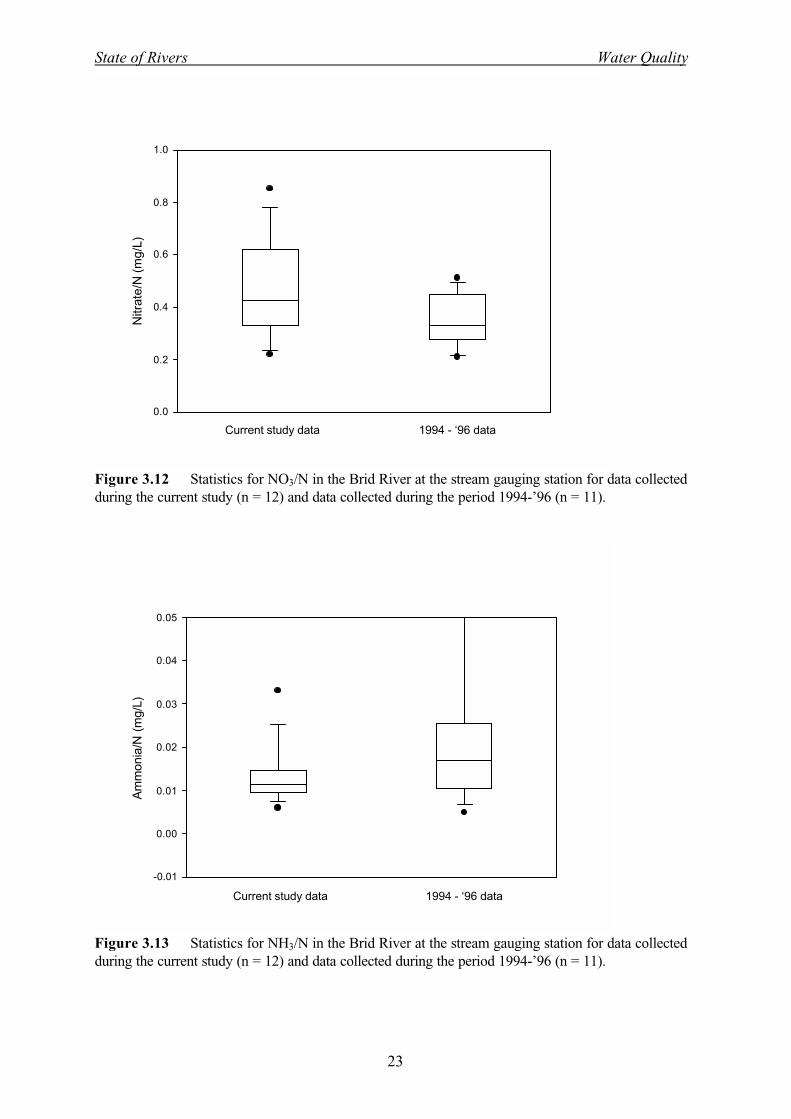
Comparison of NO3/N concentrations during this study with concentrations measured during 1994-96(Figure 3.12) shows that the median concentration during this study (0.425 mg/L) was slightly, but notsignificantly higher than that for the period 1994-96 (0.33 mg/L). The variation in NO3/N concentrationmeasured during this study is also larger. The minimum NO3/N concentration in both sets of data is0.22 mg/L. Overall, the NO3/N levels measured in the Brid River are very similar to those describedfor the middle reaches of the nearby Ringarooma River (Bobbi, 1999a) and the lower section of theGreat Forester River (Bobbi, 1999b).
State of Rivers Water Quality
23
Nitr
ate/
N (m
g/L)
0.0
0.2
0.4
0.6
0.8
1.0
Current study data 1994 - ‘96 data
Figure 3.12 Statistics for NO3/N in the Brid River at the stream gauging station for data collectedduring the current study (n = 12) and data collected during the period 1994-’96 (n = 11).
Am
mon
ia/N
(m
g/L)
-0.01
0.00
0.01
0.02
0.03
0.04
0.05
Current study data 1994 - ‘96 data
Figure 3.13 Statistics for NH3/N in the Brid River at the stream gauging station for data collectedduring the current study (n = 12) and data collected during the period 1994-’96 (n = 11).

State of Rivers Water Quality
24
The data for NH3/N concentrations in the lower Brid River (Figure 3.13) reveals that concentrationsare also similar to those in the middle reaches of the Ringarooma River (Bobbi, 1999b), with maximumconcentrations during the current study reaching 0.033 mg/L. The peak concentration in the data from1994-96 is 0.05 mg/L, indicating that levels can get quite high. Ammonia is naturally present in surfacewater and normally comes from the breakdown of organic and inorganic material. However, higherlevels (in Tasmania greater than about 0.02 mg/L) can be an indicator of organic pollution (UNESCO,1992). In the UK, high NH3/N concentrations have been used as an indicator of impact by intensivedairying on water quality (NRA, 1992) (Foy & Kirk, 1995). Considering the data in light of this, itmight be suggested that water in the lower Brid River is showing the signs of at least intermittentimpact by intensive animal industries.
PhosphorusPhosphorus is one of the nutrients essential for growth of aquatic plants and animals, and is often theunderlying factor driving ecosystem productivity. However, in surface waters phosphorus is normallypresent at very low levels and is usually the nutrient which limits growth of algae. When it is present inexcess due to land use practices or disturbance, it can trigger algal blooms which are a feature ofeutrophication. Although aquatic plants generally require phosphorus in its dissolved form, once presentin a waterway it can change between dissolved and particulate forms depending on environmentalconditions and biological processes (UNESCO, 1992). Therefore where there is a catchment activitywhich may produce increases in phosphorus, it is best to measure total phosphorus (TP), whichincludes both particulate and dissolved forms, as at some stage all of this may become available forplant uptake. Most phosphorus is also normally found attached to organic and inorganic particulatematter and can often be related to turbidity levels. This relationship is further discussed in Section 3.3.
In the Brid River, the median concentration of TP measured during the current study is 0.034 mg/L(Figure 3.14), which is lower than the median of the data from 1994-96. Both datasets show that TPconcentration can get very high at times (above 0.1 mg/L). More detailed examination of the data withrespect to river flows (Figure 3.15) shows that these high concentrations do not always occur duringhigh flow events. The data shows that there have been several occasions when high concentrationshave been detected during moderate flows and that there is no clear relationship between flow andconcentration.
There are various possible explanations for this. The first, and most obvious, is that there is somelocalised activity which is contributing to higher phosphorus levels in the river. The area around the sitewhere water quality was monitored is a dairy farm which extends for some distance both up and downthe length of the river. At several places along the river cattle have direct access to the river and havecreated trampled and compacted ‘ramps’ which would facilitate the entry to the river of phosphorusrich faecal material.
Other factors which may also be responsible for the high concentrations of TP in the river arecatchment drainage activities which make delivery to the river of nutrients and sediment more direct.As has been shown in Section 3.1, turbidity levels are reasonably high and appear to be originating inthe upper half of the catchment, where agricultural and drainage activity id most intense. Thesuspended solids responsible for this higher turbidity would increase the ability of the river to transporthigher levels of nutrients, especially at lower flows. There is also a considerable amount of sedimentstored in the river bed and this could be acting much like a leaking sponge, releasing phosphorus duringlower river flows when suitable conditions for phosphorus release are likely to occur. Never the less,data from both this study and the recent sampling shows that TP concentrations are at or above thetrigger levels suggested by the ANZECC (1998-draft) guidelines for the protection of aquaticecosystems.

State of Rivers Water Quality
25
Tot
al P
(m
g/L)
0.00
0.02
0.04
0.06
0.08
0.10
0.12
0.14
Current study data 1994 - ‘96 data
Figure 3.14 Statistics for TP in the Brid River at the stream gauging station for data collectedduring the current study (n = 12) and data collected during the period 1994-’96 (n = 11).
Flow (cumecs)
0 1 2 3 4 5 6 7
Tot
al P
(mg/
L)
0.00
0.02
0.04
0.06
0.08
0.10
0.12
0.14
1998 Study1994-96 data
Figure 3.15 Total phosphorus concentrations plotted against river flow using recent data from theBrid River upstream of the tidal limit.

State of Rivers Water Quality
26
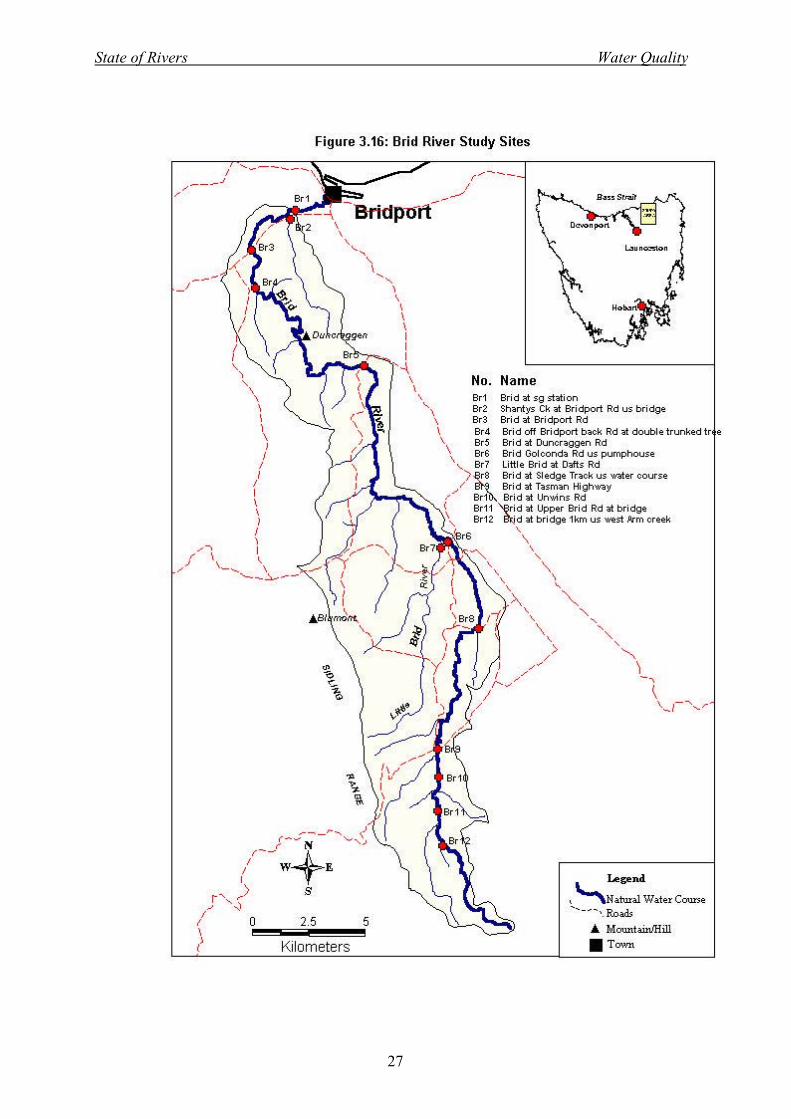
3.2 Catchment SurveyBecause the Brid River lies within a long and very narrow valley, many of the smaller feeder streamsand tributaries are dry for at least part of the year or have been used for the purposes of off-streamwater storages. As a result of this, ‘catchment snapshot’ surveys of the Brid River catchment wereessentially confined to sites on the main river and the Little Brid River. The locations of all sitessampled during the surveys is shown in Figure 3.16. The aim of this ‘snapshot’ approach is to highlightareas where water quality is degraded relative to the rest of the catchment. This technique has beenused in the past both in Tasmania (Bobbi et al., 1996) (Bobbi, 1997) (Bobbi, 1998) and interstate(Grayson et al., 1997) and has proved useful.
Surveys of these sites were carried out on three separate occasions. The first was undertaken duringlow summer flows in December 1997 and involved field testing only. The second was carried out onJanuary 20, 1998 and the thrird was carried out during stable winter flows on August 25, 1998. Duringall surveys, a total of 12 sites were visited, however during Survey #2 Shanty’s Creek was dry andtherefore not able to be tested.. At all sites physical-chemical testing was performed. During thesecond and third surveys a subset of sites (4 in January and 6 in August) were sampled, and analysesperformed for nutrients, heavy metals and bacteria.
As most sites were located on the main stem of the Brid River, longitudinal plots of the data can revealmost of the pattern of variation in water quality and how it relates to location on the river. The data forwater temperature (Figure 3.17) shows two distinct features. The first and most obvious is that watertemperature in the river was much lower during survey #3 (winter) and there is no significant change intemperature down the length of the river. The second feature relates to the data collected duringsummer low flows (survey #1 and #2). Both of these plots show that there is a significant increase inwater temperature towards the bottom of the catchment. This is most clearly demonstrated by thedata from survey #1, when water temperature at the top of the catchment is about 3 oC lower thanlower down the river. During the second survey most of the increase in water temperature occurredbetween BR12 (the top site) and BR8 (Brid at Sledge Track). This section of river is most affected byriparian management practices which have resulted in a lack of riparian vegetation, allowing sunlight tocause significant elevation in water temperature. Further downstream riparian cover shades the river,preventing increases in water temperature.
The pattern for instream pH is somewhat similar to that for summer water temperature (Figure 3.18) inthat pH levels lower down the river are higher than in the headwaters. The pattern of change on allthree occasions is very similar. The water in the upper half of the river (from headwaters to site BR6)is generally more acidic, with values between 6.3 and 6.5. The pH measured in the Little Brid River(site BR7) is similar to that measured nearby in the Brid River at BR6. Downstream of BR6 pHappears to increase markedly, though water is still mildly acidic in character. This may be linked to thechange in land use as the river leaves farmland and flows through forested area (State Forest). Thisexplanation is supported recent studies in New Zealand which found that larger, continuous blocks ofriparian vegetation are more likely to result in water quality improvements than smaller discontinuousstrips (Scarsbrook & Halliday, 1999). Sites BR3 and BR1 are located back in cleared farmland andonce again pH levels are reduced. The very low pH recorded in this section of river is indicative of theeffects of land clearance and drainage in the upper valley. It is known that the removal of vegetationfrom around rivers which lack base cations (calcium and magnesium) can lead to acidification (Cresser& Edwards, 1988), as vegetation in these situations can be the only contributor of these bufferingminerals.
State of Rivers Water Quality
27

State of Rivers Water Quality
28
Site LocationBR12 BR11 BR10 BR9 BR8 BR6 BR5 BR4 BR3 BR1
Tem
pera
ture
(o C)
0
2
4
6
8
10
12
14
16
18
Survey #1Survey #2Survey #3
Figure 3.17 Longitudinal changes in water temperature in the Brid River recorded during threecatchment surveys undertaken in the period Dec ’97 to Aug ’98.
Site LocationBR12 BR11 BR10 BR9 BR8 BR6 BR5 BR4 BR3 BR1
Fie
ld p
H 6.5
0.0
6.0
7.0
pH1pH2pH3
Figure 3.18 Longitudinal changes in pH in the Brid River recorded during three catchment surveysundertaken in the period Dec ’97 to Aug ’98.
State of Rivers Water Quality
29
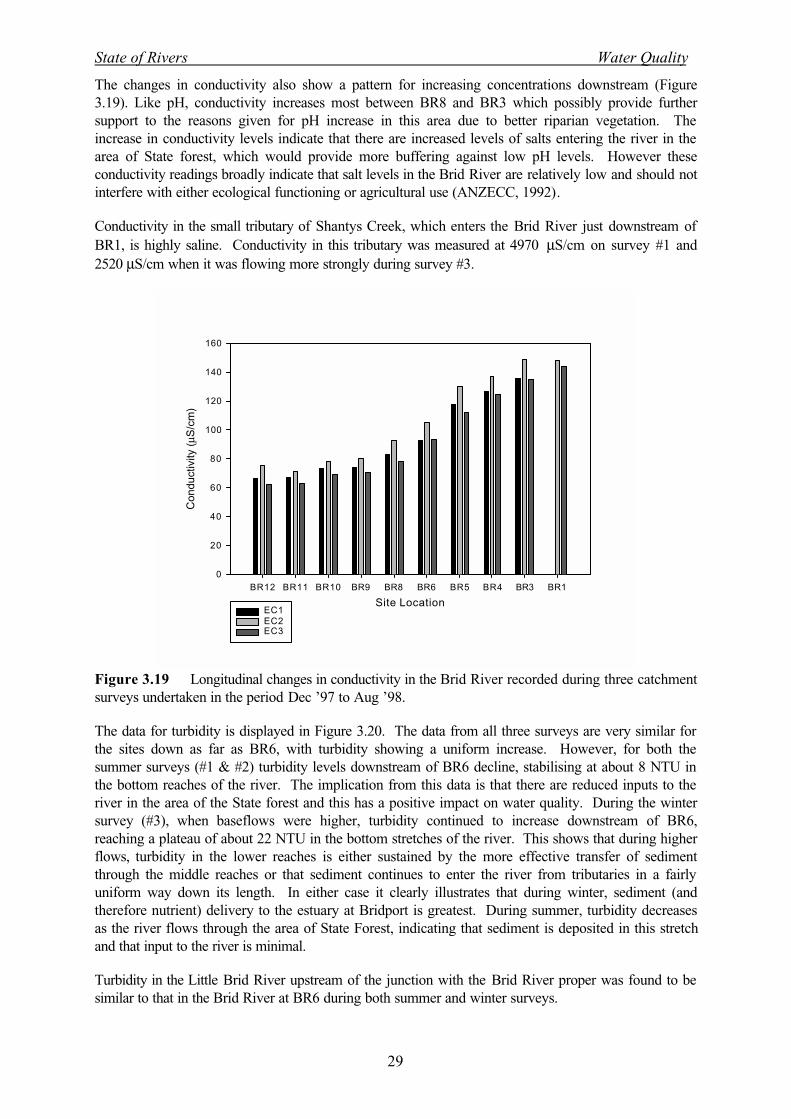
The changes in conductivity also show a pattern for increasing concentrations downstream (Figure3.19). Like pH, conductivity increases most between BR8 and BR3 which possibly provide furthersupport to the reasons given for pH increase in this area due to better riparian vegetation. Theincrease in conductivity levels indicate that there are increased levels of salts entering the river in thearea of State forest, which would provide more buffering against low pH levels. However theseconductivity readings broadly indicate that salt levels in the Brid River are relatively low and should notinterfere with either ecological functioning or agricultural use (ANZECC, 1992).
Conductivity in the small tributary of Shantys Creek, which enters the Brid River just downstream ofBR1, is highly saline. Conductivity in this tributary was measured at 4970 µS/cm on survey #1 and2520 µS/cm when it was flowing more strongly during survey #3.
Site LocationBR12 BR11 BR10 BR9 BR8 BR6 BR5 BR4 BR3 BR1
Con
duct
ivity
(µS
/cm
)
0
20
40
60
80
100
120
140
160
EC1EC2EC3
Figure 3.19 Longitudinal changes in conductivity in the Brid River recorded during three catchmentsurveys undertaken in the period Dec ’97 to Aug ’98.
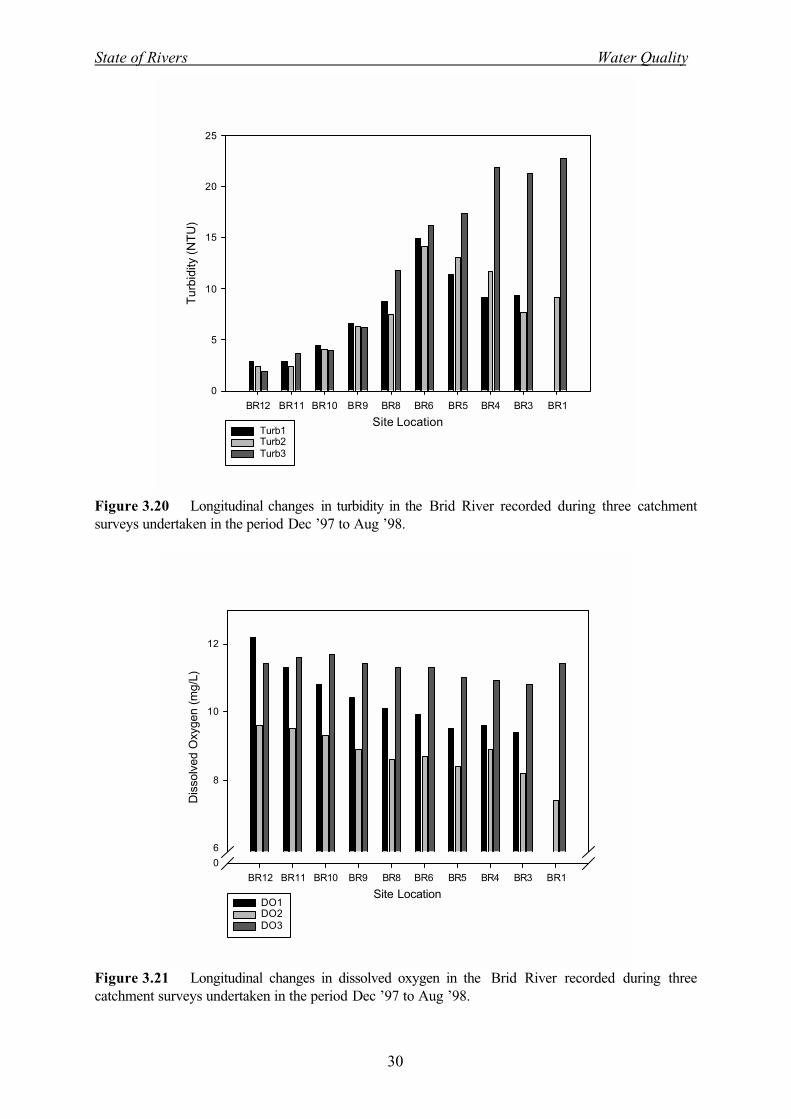
The data for turbidity is displayed in Figure 3.20. The data from all three surveys are very similar forthe sites down as far as BR6, with turbidity showing a uniform increase. However, for both thesummer surveys (#1 & #2) turbidity levels downstream of BR6 decline, stabilising at about 8 NTU inthe bottom reaches of the river. The implication from this data is that there are reduced inputs to theriver in the area of the State forest and this has a positive impact on water quality. During the wintersurvey (#3), when baseflows were higher, turbidity continued to increase downstream of BR6,reaching a plateau of about 22 NTU in the bottom stretches of the river. This shows that during higherflows, turbidity in the lower reaches is either sustained by the more effective transfer of sedimentthrough the middle reaches or that sediment continues to enter the river from tributaries in a fairlyuniform way down its length. In either case it clearly illustrates that during winter, sediment (andtherefore nutrient) delivery to the estuary at Bridport is greatest. During summer, turbidity decreasesas the river flows through the area of State Forest, indicating that sediment is deposited in this stretchand that input to the river is minimal.
Turbidity in the Little Brid River upstream of the junction with the Brid River proper was found to besimilar to that in the Brid River at BR6 during both summer and winter surveys.
State of Rivers Water Quality
30
Site LocationBR12 BR11 BR10 BR9 BR8 BR6 BR5 BR4 BR3 BR1
Tur
bidi
ty (N
TU
)
0
5
10
15
20
25
Turb1Turb2Turb3
Figure 3.20 Longitudinal changes in turbidity in the Brid River recorded during three catchmentsurveys undertaken in the period Dec ’97 to Aug ’98.
Site LocationBR12 BR11 BR10 BR9 BR8 BR6 BR5 BR4 BR3 BR1
Dis
solv
ed O
xyge
n (m
g/L)
0
6
8
10
12
DO1DO2DO3
Figure 3.21 Longitudinal changes in dissolved oxygen in the Brid River recorded during threecatchment surveys undertaken in the period Dec ’97 to Aug ’98.

State of Rivers Water Quality
31
The pattern for dissolved oxygen is typical of most natural rivers (Figure 3.21). During survey #1,oxygen concentrations at the top of the catchment were very healthy (above 11 mg/L), but decreasedsteadily to a minimum around 9.5 mg/L at site BR5. Oxygen concentrations downstream of BR5 weresteady around 9.5 mg/L. During survey #2 the pattern of change was similar but the drop betweenBR12 and BR5 was less marked as levels at sites in the upper catchment were generally lower thanthose recorded in survey #1. The lowest oxygen concentration recorded during survey #2 was at BR1,where concentration was low (7.4 mg/L) but still within the range of values typically found in healthystreams. Healthy dissolved oxygen levels were recorded in the Little Brid River during all threesurveys.
During the winter survey, conditions throughout the length of the Brid River were much more uniformand healthy (range between 10.8 - 11.7 mg/L), demonstrating that conditions in throughout the length ofthe river are much improved during higher winter flows.
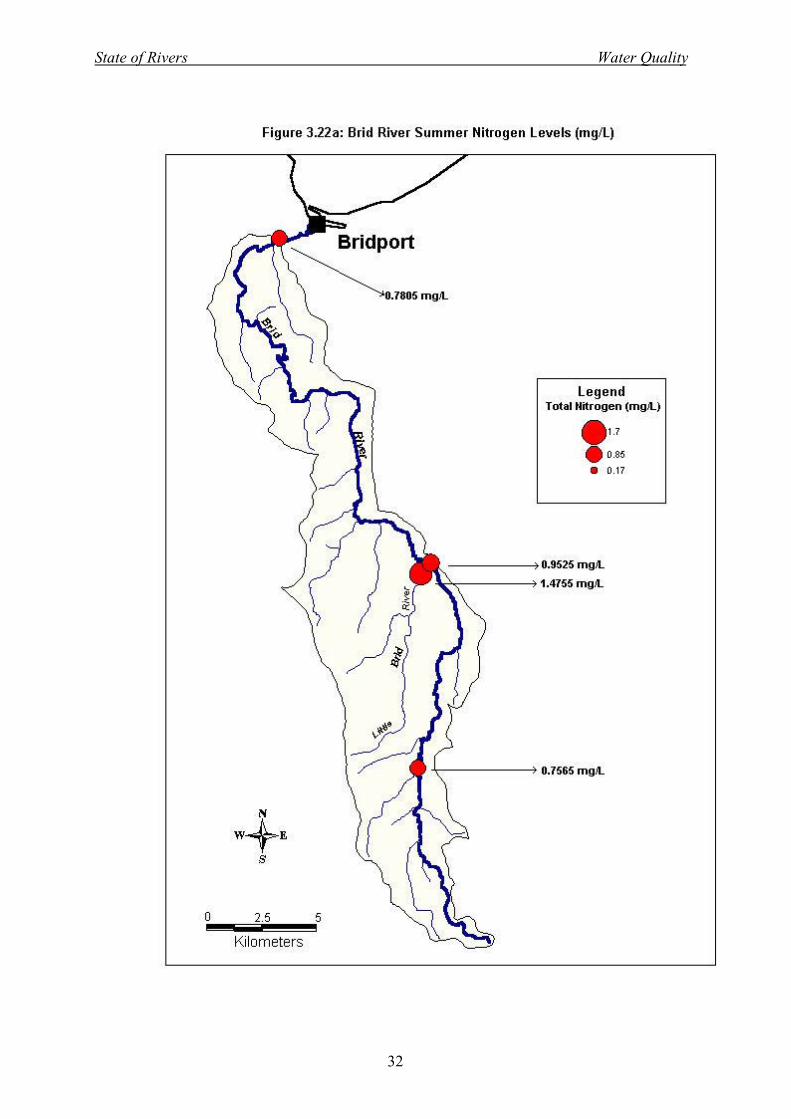
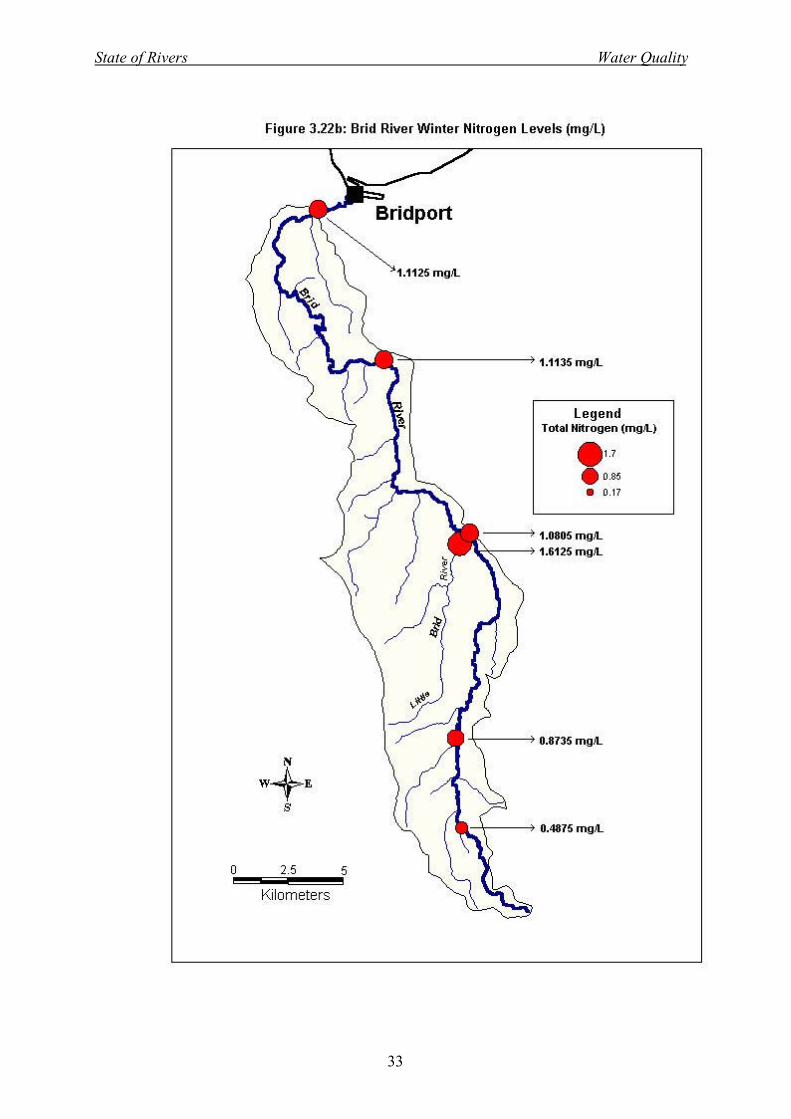
Nutrient concentrations were measured at four sites during survey #2 and at six sites during survey #3.The data for TN concentrations (Figure 3.22a&b) suggest that there are not significant differences inthe pattern of variation between summer and winter. The data of most interest is that from the LittleBrid River, which shows that on both occasions concentrations of TN are higher in this tributary than inthe Brid River just upstream. During the summer survey, the concentration of TN at BR1 at thebottom of the catchment is similar to that at BR9 higher up the river, despite the elevated concentrationin the Brid River prior to its entry into the State forest. This reinforces the data for turbidity (Figure3.20) and the conclusion that water quality improves in the section flowing through the State forestduring low summer flows due to the reduced level of catchment disturbance and a relatively intactriparian zone. The data for winter shows that TN is easily transferred to the bottom of the catchmentby higher flow in the river.
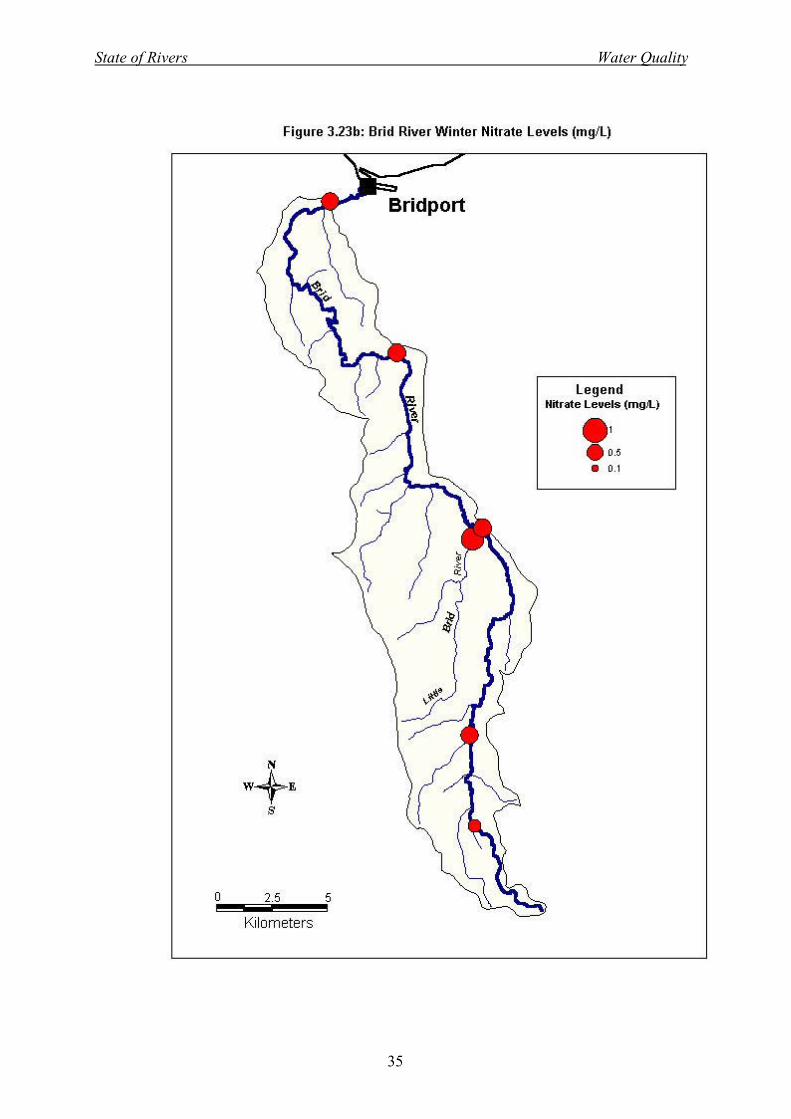
Nitrate nitrogen (NO3/N) is a major component of TN concentrations in both the Brid and the LittleBrid rivers. In the Little Brid River, NO3/N was higher than any site in the Brid River on both summerand winter surveys (Figure 3.23a&b) indicating that this tributary may be a significant contributor toNO3/N levels in the Brid River. In the main river, NO3/N concentrations during winter generally showan increase to BR6 then drop slightly by the time the river reaches BR1 at the bottom of thecatchment. This pattern is more noticeable during the summer survey, despite fewer sites beingsampled.
The concentration of NH3/N throughout the catchment during the summer survey was higher thanduring winter (Figure 3.24a&b). During summer, high levels of NH3/N were measured at BR9 and atBR1, both of which have substantial dairy farms in the area around the river where the sites arelocated. These levels reflect the impact of low level organic pollution to the river near or upstream ofthese sites. Levels at both BR9 and BR1 are lower during the winter, as are concentrations at all othersites in the catchment. During the winter survey, site BR7 on the Little Brid River had the highestNH3/N concentrations (0.02 mg/L).
State of Rivers Water Quality
32
State of Rivers Water Quality
33

State of Rivers Water Quality
34
State of Rivers Water Quality
35

State of Rivers Water Quality
36

State of Rivers Water Quality
37

State of Rivers Water Quality
38
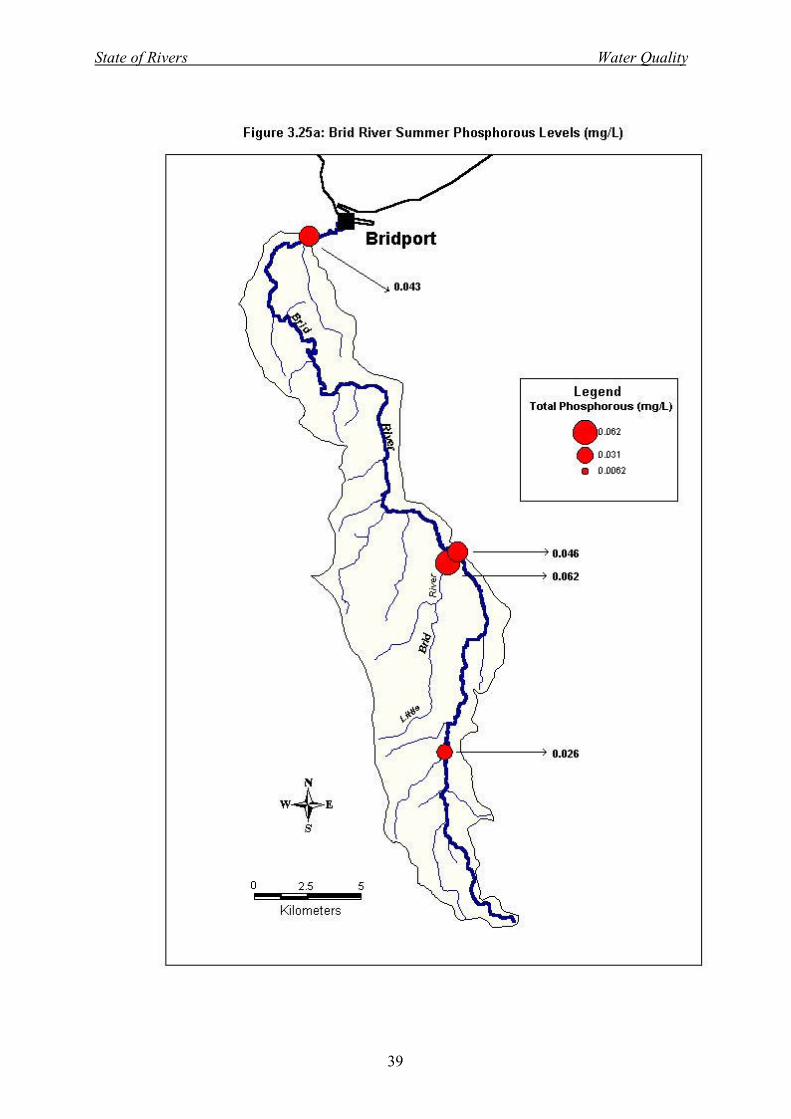
Although the survey results for TP show that concentrations were generally slightly lower during thewinter (Figure 3.25a&b), the pattern is very similar for both sets of results. The most significantfeature of both diagrams is that TP concentration in the Little Brid River are higher than any of thesites in the main river. It is clear that catchment activities in the area around West Scottsdale arehaving an impact on nutrient levels in both the Little Brid and Brid rivers. This is an area whereintensive cattle grazing (beef and dairy) and cropping (primarily poppies and potatoes) occurs.
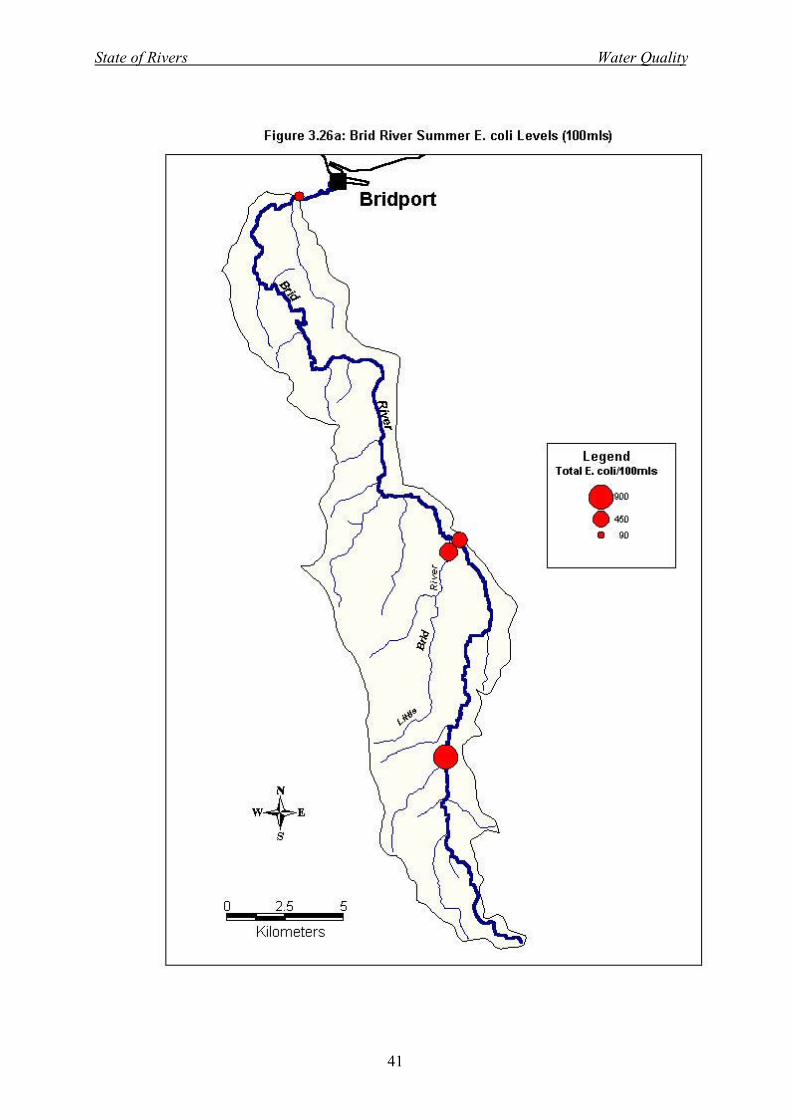
The results of bacterial testing during both the summer and winter surveys is shown in Figure 3.26a&b.It is clear that during summer (survey #2), coliform levels are higher despite the lower river flows.This is most probably a result of two factors. Firstly, during the summer season increased watertemperature in the river (14-18 oC) would lengthen the survival of coliforms in the environment.Combined with this is the reduced flow in the river which would lessen the dilution potential for anyfaecal inputs to the river.
The data from both surveys show that highest coliform levels were found at the uppermost site (BR9),where beef and dairy activities are most intense. During the summer survey, coliform concentrationsin the Little Brid River (BR7) were also high (530 cfu), though all sites covered during ‘snapshot’sampling showed faecal coliform levels which indicate that the water may exceed ANZECC (1992)guidelines for primary contact. Further sampling during summer is required to establish whether thiscondition is common throughout the summer period. The winter snapshot suggests that this may be thecase at least at some sites on the Brid River.
All together the data from the catchment ‘snapshots’ is useful in that it provides further detail andbuilds on the data collected at the monitoring sites. The most significant feature of the ‘snapshot’ datahas been the positive impact the State forest has on some water quality parameters. This may simplybe due to the presence of an adequate buffer zone protecting the river, though the land use practicespresent in the upper part of the catchment are missing in the State forest area and consequently inputsare less. The main point that arises from this is that the establishment of an adequate and functionalriparian strip in the upper catchment can potentially bring about significant improvements in waterquality in the river.
3.3 Continuous MonitoringContinuous water monitoring probes currently operate on the Brid River. They are located at thestream flow recording station which is approximately 2.4 km upstream of the limit of tidal influence. Atthis site water temperature, electrical conductivity and turbidity are recorded on a 20 minute cycle. Asthe probes are permanently immersed in the river, it is necessary to both clean them regularly and alsocheck the accuracy of the data they collect against other regularly calibrated field instruments. Whencleaning and field checking is not performed frequently enough, there can be drift in the data,particularly the turbidity data, and this can reduce the confidence in the data when used at a later date.
During this study, regular monthly monitoring visits as well as site visits during flood events ensuredfrequent cleaning and calibration checks of the probes. An example of the data collected is given inthe following two figures (Figure 3.27 and 3.28). In Figure 3.27 the change in conductivity in the riveris plotted together with the variation in flow during a flood event late in July, 1998.
State of Rivers Water Quality
39

State of Rivers Water Quality
40
State of Rivers Water Quality
41

State of Rivers Water Quality
42

State of Rivers Water Quality
43
0
50
100
150
200
250
300
350
400
25/0
7/98
27/0
7/98
29/0
7/98
31/0
7/98
02/0
8/98
04/0
8/98
06/0
8/98
0
2
4
6
8
10
12
Con
duct
ivity
(µS
cm-1
) River F
low (m
3s-1)
Figure 3.27 ‘In situ’ changes in conductivity in the Brid River during a flood event in July, 1998.Dotted line shows changes in river flow. # Conductivity temperature compensated to reference of 25oC.
The plot shows that at this site in the Brid River, the conductivity actually increases quite dramaticallyalmost 20 hours before the arrival of flood flows. This is very different to what normally happens inother Tasmanian rivers, where conductivity levels generally decrease as dilution takes place due to theentry of runoff to the river (Bobbi et al., 1996) (Bobbi, 1997). Rather than the rapid decrease inconductivity early in floods which is characteristic of most rivers, the spikes in the Brid River indicateinflow of more concentrated water. The cause of the marked increase at this site appears to be due torunoff from the dairy located immediately upstream. It has been shown elsewhere that runoff fromdairy sheds and the area in the immediate vicinity can be a significant source of dissolved andsuspended solids (NRA, 1992) and the sudden entry of this ‘flush’ to the river would occur prior to thearrival of floodwaters from further upstream. Any stormwater drains from such an area wouldfacilitate this effect.
One method of summarising the continuous conductivity data is to perform a duration analysis, whichseparates the data according to time spent in particular ranges. For the conductivity data from the BridRiver, eight range categories were arbitrarily chosen and the resulting duration analysis is shown inTable 3.4. The results show that for at least 77% of the time, conductivity in the lower reaches of
Table 3.4 Duration Analysis for Conductivity at Brid River station.Season: Full YearPeriod Processed 1787 days - 1/3/94 to 27/4/99Band Value Range % Time within Range % Time >= Bound1 0 - 100 (µScm-1) 0.12 1002 100 - 125 (µScm-1) 8.94 99.93 125 - 150 (µScm-1) 45.04 90.94 150 - 175 (µScm-1) 32.40 45.95 175 - 200 (µScm-1) 7.66 13.496 200 - 225 (µScm-1) 2.48 5.847 225 - 250 (µScm-1) 1.19 3.368 > 250 (µScm-1) 2.17 2.17
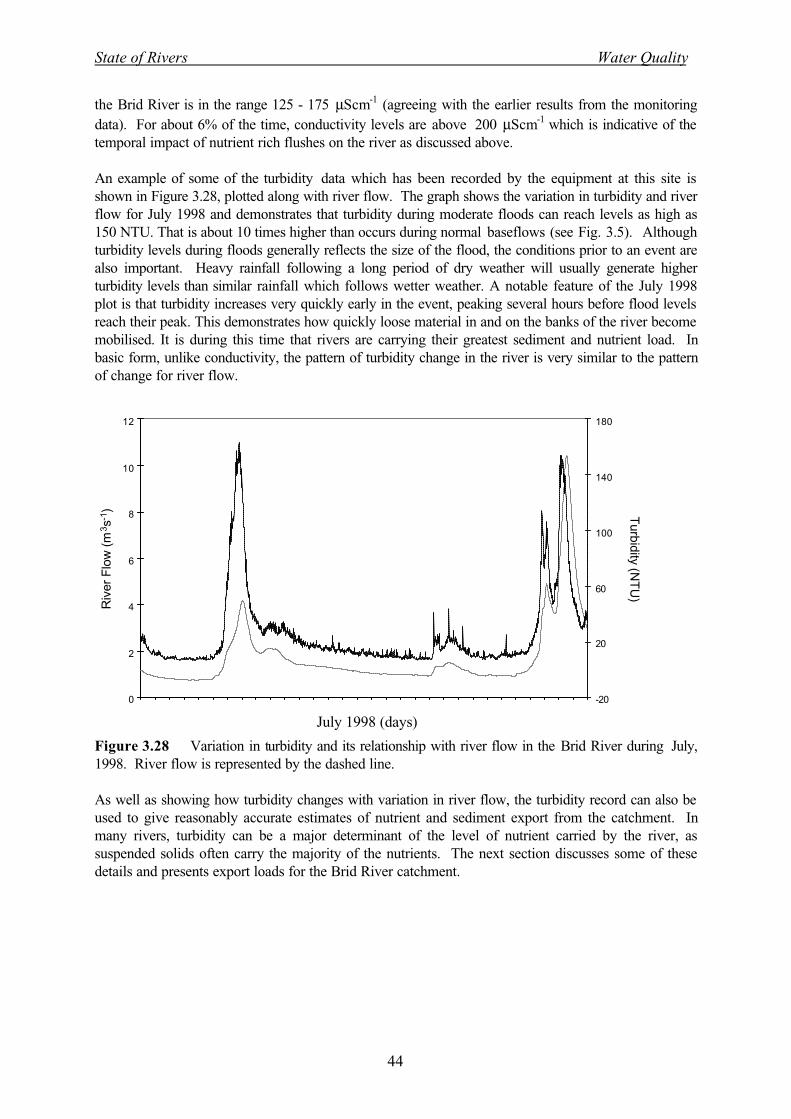
State of Rivers Water Quality
44
the Brid River is in the range 125 - 175 µScm-1 (agreeing with the earlier results from the monitoringdata). For about 6% of the time, conductivity levels are above 200 µScm-1 which is indicative of thetemporal impact of nutrient rich flushes on the river as discussed above.
An example of some of the turbidity data which has been recorded by the equipment at this site isshown in Figure 3.28, plotted along with river flow. The graph shows the variation in turbidity and riverflow for July 1998 and demonstrates that turbidity during moderate floods can reach levels as high as150 NTU. That is about 10 times higher than occurs during normal baseflows (see Fig. 3.5). Althoughturbidity levels during floods generally reflects the size of the flood, the conditions prior to an event arealso important. Heavy rainfall following a long period of dry weather will usually generate higherturbidity levels than similar rainfall which follows wetter weather. A notable feature of the July 1998plot is that turbidity increases very quickly early in the event, peaking several hours before flood levelsreach their peak. This demonstrates how quickly loose material in and on the banks of the river becomemobilised. It is during this time that rivers are carrying their greatest sediment and nutrient load. Inbasic form, unlike conductivity, the pattern of turbidity change in the river is very similar to the patternof change for river flow.
0
2
4
6
8
10
12
-20
20
60
100
140
180
Riv
er F
low
(m
3 s-1
) Turbidity (N
TU
)
July 1998 (days)
Figure 3.28 Variation in turbidity and its relationship with river flow in the Brid River during July,1998. River flow is represented by the dashed line.
As well as showing how turbidity changes with variation in river flow, the turbidity record can also beused to give reasonably accurate estimates of nutrient and sediment export from the catchment. Inmany rivers, turbidity can be a major determinant of the level of nutrient carried by the river, assuspended solids often carry the majority of the nutrients. The next section discusses some of thesedetails and presents export loads for the Brid River catchment.

State of Rivers Water Quality
45
3.4 Nutrient Load EstimatesAs mentioned in the preceding section, turbidity was monitored in the Brid River using an ‘in situ’sensor. A pumping mechanism was also used to help maintain a clean sensor surface, ensuring thatdata collected remained relatively free of interference from algal growth and sediment deposition.Regular checking against a portable meter was performed, both during flooding and during low flows.An example of the turbidity change during a single flood event is presented in Figure 3.29.
0
2
4
6
8
10
12
25/0
7/98
26/0
7/98
27/0
7/98
28/0
7/98
29/0
7/98
30/0
7/98
31/0
7/98
01/0
8/98
02/0
8/98
03/0
8/98
04/0
8/98
0
20
40
60
80
100
120
140
160
Riv
er F
low
(m
3 s-1
) Turbidity (N
TU
)
Figure 3.29 Variation in turbidity and river flow in the Brid River during a flood in July, 1998.River flow is represented by the dotted line.
Continuous turbidity data was recorded for the period October 1997 through to December 1998, andquality checked. To make some estimate of nutrient loads being exported from the catchment, it wasproposed to develop relationships between turbidity and the major nutrients of P and N and forsuspended solids. Therefore, in addition to the routine monthly monitoring, samples were taken duringhigher flows using an automated pump sampling machine which was triggered by rising river levels.These samples were then later collected and analysed for turbidity, suspended solids and nutrients. Asummary of these data is presented in Table 3.5.
Table 3.5 A summary of concentrations of Suspended Solids, Total N and Total P recordedduring flood flows in the Brid River during 1998.
Suspended Solids(mg/L)
Total N(mg/L)
Total P(mg/L)
Number of Samples 27 40 40Average 127 2.12 0.18Maximum 210 3.91 0.40Minimum 60 1.24 0.05
This data was then used for two purposes. The first of these was to calibrate and check the quality ofthe turbidity data recorded by the ‘in situ’ probes. Where necessary, correction of the record was thenperformed. The results from analysis of samples was also used to derive relationships betweenturbidity and the major parameters of TN, TP and suspended solids. It was found that significant linearrelationships existed between all three parameters and turbidity.

State of Rivers Water Quality
46
These are;
Total suspended solids[TSS] = 1.3576*turbidity -10.525R2 = 0.968, n = 27.
Total Nitrogen[TN] = 0.0177*turbidity + 0.64R2 = 0.72, n = 40.
Total Phosphorus[TP] = 0.002*turbidity + 0.01R2 = 0.895, n = 40.
The relationship for TN concentration and turbidity is not as significant as the others, as a proportion ofall the nitrogen being exported from the catchment is in the dissolved form (ie NO3) and is not linked toturbidity. As was discussed in an earlier section, in general nitrate comprises more than 45% of thetotal nitrogen present in the river.
Using the derived relationships for the Brid River, the time series of turbidity was then able to betransformed to a synthetic record of TN, TP and total suspended solids concentrations, which couldthen be used to estimate export loads. As an example, the total estimated load from the single event ofJuly 1998 (shown above) has been calculated at;
Total Suspended Solids = 159,336 kgTotal Nitrogen = 3,565 kgTotal Phosphorus = 284 kg
The total discharge volume of this event was 1,914 megalitres (6% of the total discharge of the BridRiver for the year 1998).
There are some inaccuracies and assumptions associated with this load estimation method. The first ofthese is that the turbidity record is an accurate record of turbidity in the river and although there werevarious checks of the ‘in situ’ sensor against another instrument, it is fair to state that some of therecord is likely to deviate from the true turbidity levels in the river. During low flows the affect of thison load estimates should be fairly inconsequential, however during high flows there are fewer checkson the sensor readings. Checks that were made did show the ‘in situ’ sensor to be accurate to within15% during higher turbidity events.
Another common source of error in load estimates is the recording of flow in the river, and there issignificant growth of aquatic weed at the gauging station which might have reduced the accuracy ofratings. However regular gaugings of the river during the period of the study were able to ensure thatthe flow record was within +/- 5% of the rating.
Bearing these assumptions in mind, Table 3.6 gives the estimated export load of suspended solids, TNand TP for the Brid River for the 15 months of turbidity record. Also included is the total monthlydischarge volume for the river in megalitres (106 litres).

State of Rivers Water Quality
47
Table 3.6 Estimated monthly nutrient load, suspended solids load and discharge for the Brid Riverbetween October 1997 and December 1998.
MONTH TSS Load(kg)
TP Load(kg)
TN Load(kg)
Discharge(ML)
Oct-97 23,844 106 2,472 2,780Nov-97 36,188 112 2,265 2,307Dec-97 8,731 51 1,278 1,497Jan-98 5,932 37 952 1,125Feb-98 7,359 38 910 1,048Mar-98 1,114 18 518 648Apr-98 26,621 72 1,333 1,268May-98 12,280 55 1,286 1,449Jun-98 61,783 160 2,920 2,721Jul-98 250,665 487 6,868 4,631Aug-98 60,909 200 4,143 4,308Sep-98 236,600 491 7,432 5,593Oct-98 154,534 398 7,195 6,665Nov-98 86,148 193 3,149 2,606Dec-98 21,464 79 1,731 1,868TOTALS 994,172 2,497 44,452 40,514
While the accuracy of these export load estimates is difficult to assess, they do provide a reasonablyaccurate estimation of the nutrients being exported from the catchment. To compare this level ofnutrient and sediment loss with other catchments, the export figures need to be corrected forcatchment area and discharge (ie catchment runoff). The derivation of these ‘export coefficients’allow catchments of different sizes and rainfall patterns to be compared (see ‘Glossary of Terms’ atthe front of this document). The export coefficients for the Brid catchment derived from the data fromthis study are given in Table 3.7.
TABLE 3.7 Export coefficients for the Brid River derived from data collected during the periodJanuary to December ’98.
Catchment Discharge (ML)
SuspendedSolids
(kg/mm/km-2)
Total P (kg/mm/km-2)
Total N(kg/mm/km-2)
Brid River 33,930 27.27 0.066 1.13# Brid River catchment area = 136 km-2.
These coefficients can be compared to others which have been calculated for rivers elsewhere inTasmania (Bobbi et al., 1996) (Bobbi, 1998). Some of the figures in Table 3.8 are averages calculatedover several years, while others were calculated from a single years worth of data. This is importantto keep in mind when looking at export coefficients, as the amount of rainfall in a catchment willdetermine the amount of nutrient exported, and hence the export coefficient for that catchment. Ifexport coefficients are calculated from data collected during a period with ‘below average’ rainfall,they can underestimate the level of export, and vice versa for wetter years. It is therefore worth notingthat the total discharge from the Brid River catchment during the period of this study was slightly belowaverage (about 34,00 ML compared with the annual average of about 41,000 ML).
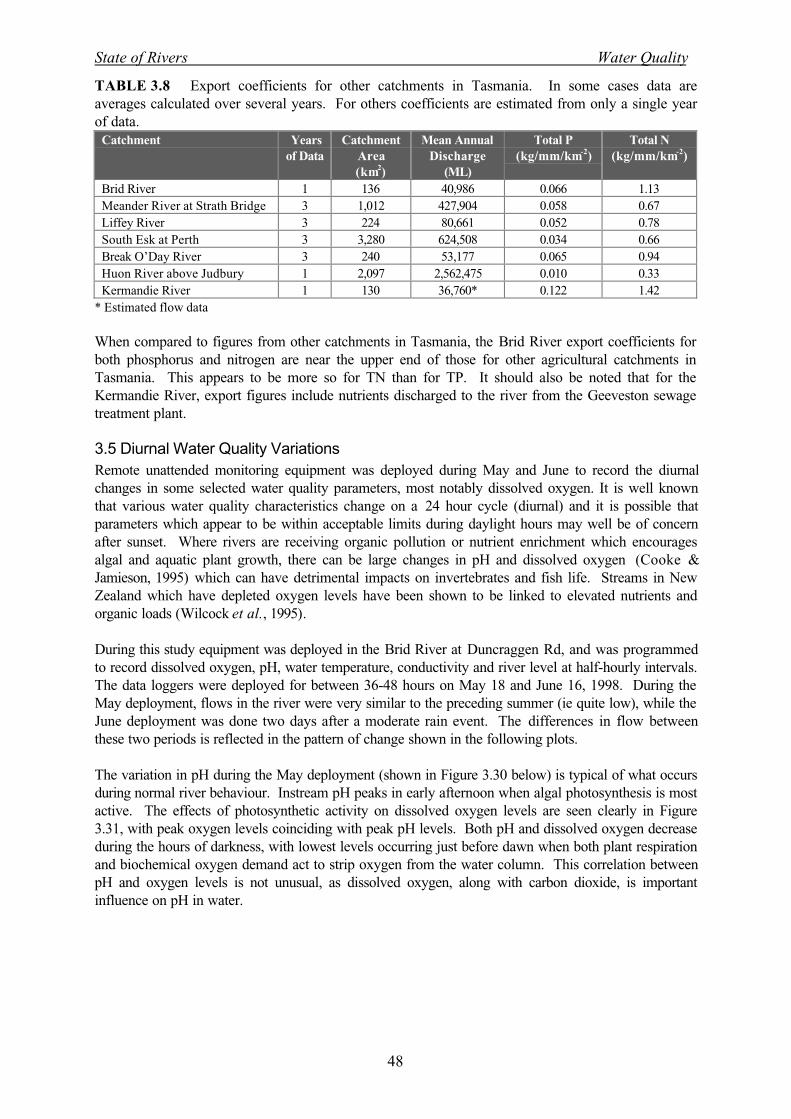
State of Rivers Water Quality
48
TABLE 3.8 Export coefficients for other catchments in Tasmania. In some cases data areaverages calculated over several years. For others coefficients are estimated from only a single yearof data.
Catchment Yearsof Data
CatchmentArea(km2)
Mean AnnualDischarge
(ML)
Total P(kg/mm/km-2)
Total N(kg/mm/km-2)
Brid River 1 136 40,986 0.066 1.13Meander River at Strath Bridge 3 1,012 427,904 0.058 0.67Liffey River 3 224 80,661 0.052 0.78South Esk at Perth 3 3,280 624,508 0.034 0.66Break O’Day River 3 240 53,177 0.065 0.94Huon River above Judbury 1 2,097 2,562,475 0.010 0.33Kermandie River 1 130 36,760* 0.122 1.42
* Estimated flow data
When compared to figures from other catchments in Tasmania, the Brid River export coefficients forboth phosphorus and nitrogen are near the upper end of those for other agricultural catchments inTasmania. This appears to be more so for TN than for TP. It should also be noted that for theKermandie River, export figures include nutrients discharged to the river from the Geeveston sewagetreatment plant.
3.5 Diurnal Water Quality VariationsRemote unattended monitoring equipment was deployed during May and June to record the diurnalchanges in some selected water quality parameters, most notably dissolved oxygen. It is well knownthat various water quality characteristics change on a 24 hour cycle (diurnal) and it is possible thatparameters which appear to be within acceptable limits during daylight hours may well be of concernafter sunset. Where rivers are receiving organic pollution or nutrient enrichment which encouragesalgal and aquatic plant growth, there can be large changes in pH and dissolved oxygen (Cooke &Jamieson, 1995) which can have detrimental impacts on invertebrates and fish life. Streams in NewZealand which have depleted oxygen levels have been shown to be linked to elevated nutrients andorganic loads (Wilcock et al., 1995).
During this study equipment was deployed in the Brid River at Duncraggen Rd, and was programmedto record dissolved oxygen, pH, water temperature, conductivity and river level at half-hourly intervals.The data loggers were deployed for between 36-48 hours on May 18 and June 16, 1998. During theMay deployment, flows in the river were very similar to the preceding summer (ie quite low), while theJune deployment was done two days after a moderate rain event. The differences in flow betweenthese two periods is reflected in the pattern of change shown in the following plots.
The variation in pH during the May deployment (shown in Figure 3.30 below) is typical of what occursduring normal river behaviour. Instream pH peaks in early afternoon when algal photosynthesis is mostactive. The effects of photosynthetic activity on dissolved oxygen levels are seen clearly in Figure3.31, with peak oxygen levels coinciding with peak pH levels. Both pH and dissolved oxygen decreaseduring the hours of darkness, with lowest levels occurring just before dawn when both plant respirationand biochemical oxygen demand act to strip oxygen from the water column. This correlation betweenpH and oxygen levels is not unusual, as dissolved oxygen, along with carbon dioxide, is importantinfluence on pH in water.

State of Rivers Water Quality
49
7.46
7.48
7.5
7.52
7.54
7.56
7.58
7.6
7.62
7.64
18/05/98 12:00 19/05/98 0:00 19/05/98 12:00 20/05/98 0:00 20/05/98 12:00
‘In s
itu’ p
H
Figure 3.30 ‘In situ’ pH changes in the Brid River at Duncraggen Rd between 18th - 20th May,1998. River level was stable during the entire period.
10.1
10.2
10.3
10.4
10.5
10.6
10.7
18/05/98 12:00 19/05/98 0:00 19/05/98 12:00 20/05/98 0:00 20/05/98 12:00
Dis
solv
ed o
xyge
n (m
g/L)
Figure 3.31 Diurnal changes in dissolved oxygen in the Brid River at Duncraggen Rd between 18th
- 20th May, 1998. River level was stable during the entire period.
During the June deployment of the data loggers, both pH and dissolved oxygen did not display the samepattern of variation as was found in May. Both variables showed a relatively steady increase duringthe 40 hour period over which monitoring occurred (Figures 3.32 and 3.33). The remnant of somediurnal pattern is still evident in both plots, but is not as dominant as was found in the May deployment.
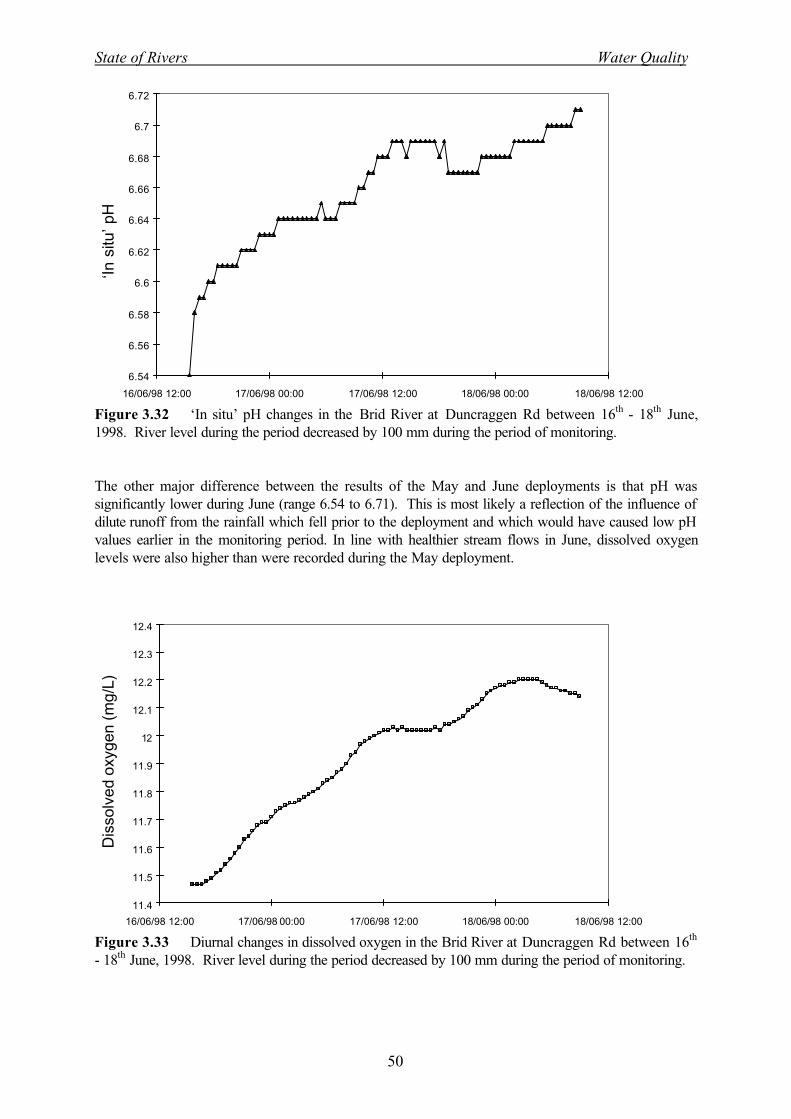
State of Rivers Water Quality
50
6.54
6.56
6.58
6.6
6.62
6.64
6.66
6.68
6.7
6.72
16/06/98 12:00 17/06/98 00:00 17/06/98 12:00 18/06/98 00:00 18/06/98 12:00
‘In s
itu’ p
H
Figure 3.32 ‘In situ’ pH changes in the Brid River at Duncraggen Rd between 16th - 18th June,1998. River level during the period decreased by 100 mm during the period of monitoring.
The other major difference between the results of the May and June deployments is that pH wassignificantly lower during June (range 6.54 to 6.71). This is most likely a reflection of the influence ofdilute runoff from the rainfall which fell prior to the deployment and which would have caused low pHvalues earlier in the monitoring period. In line with healthier stream flows in June, dissolved oxygenlevels were also higher than were recorded during the May deployment.
11.4
11.5
11.6
11.7
11.8
11.9
12
12.1
12.2
12.3
12.4
16/06/98 12:00 17/06/98 00:00 17/06/98 12:00 18/06/98 00:00 18/06/98 12:00
Dis
solv
ed o
xyge
n (m
g/L)
Figure 3.33 Diurnal changes in dissolved oxygen in the Brid River at Duncraggen Rd between 16th
- 18th June, 1998. River level during the period decreased by 100 mm during the period of monitoring.

State of Rivers Water Quality
51
A comparison of conductivity data recorded during both deployments is made in Figure 3.34. From thegraph it is clear to see that during June the conductivity of the river was less, but like both dissolvedoxygen and pH, was increasing during the period of monitoring as river flow returned to baseflowconditions. The slight variations in conductivity which occurred during both deployments indicates thepassage of slightly more dilute water down the river rather than any diurnal change.
Con
duct
ivity
(µS
/cm
)
120
122
124
126
128
130
132
134
136
138
12:00 00:00 12:00 00:00 12:00
May
June
Figure 3.34 Conductivity measured in the Brid River at Duncraggen Rd during two data-loggingdeployments in 1998.
The data collected during both deployments of the data-logging equipment showed some of thevariations in water quality which occur during normal river behaviour. Dissolved oxygen levels duringboth periods was indicative of a healthy system, however similar such deployments should occur duringsummer periods when lower flows and higher temperatures may cause some stress on the river. Dueto other commitments, the equipment used in this study was not available for use during the summerperiod.

State of Rivers Water Quality
52
3.6 Summary and CommentsThe data presented and discussed in this report has shown that water in the Brid River is turbid andcarries a substantial sediment and nutrient load. Some of the individual parameters characterising theoverall water quality have indicated that there is a noticeable impact on water quality high in thecatchment. Snapshot surveys also show that for some of these parameters there is an improvement aswater passes through the area of State forest in the middle and lower catchment. It was thought thatintensive land use and a lack of protective riparian vegetation are probably the main reasons for poorerwater quality in the upper catchment and these data should be viewed together with the data on streamcondition presented in a separate report.
While further monitoring at sites in the upper catchment may help to identify the source of nutrientinflow to the river, it is relatively clear from the data in this report that impacts on water quality revolvearound management of runoff from intensively farmed land and a lack of riparian buffering in the uppercatchment. While it is recognised that this part of the catchment may contain the most fertile andproductive land, effort to minimise loss of this through erosion and implementation of better riparianmanagement practices could be a positive step towards improving the water quality of the Brid Riverand its tributaries. The presence of a good riparian strip along both sides of rivers and streams in thecatchment will ensure more productive soil is retained on the land and less nutrients will be transportedto the river during rain events.
The retention of soil and nutrients on the land will also reduce the impact of both these factors on theestuary and coast at Bridport, where the river meets the coast. Reducing the amount of sedimententering the estuary at Bridport will provide at least two obvious benefits. The first of these isdecreased silting of the estuary, which is also used as commercial and recreational fishing port. Theother benefit is to the environmental functioning of the estuary. Reducing the levels of nutrients andsediment being deposited in the lagoon will reduce the possibility of algal blooms and fouling in thelagoon. Eutrophication of coastal lagoons in other parts of Australia has been a significant source ofboth public and environmental concern (ie National State of Environment Report) and activities whichcan prevent it occurring are worthy of attention.

State of Rivers Water Quality
53
4 ReferencesANZECC (1992) Australian Water Quality Guidelines for Fresh and Marine Waters. Australianand New Zealand Environment and Conservation Council, Canberra., Canberra.
ANZECC (draft 1998) Australian Water Quality Guidelines for Fresh and Marine Waters.Australian and New Zealand Environment and Conservation Council, Canberra., Canberra.
Bobbi, C. (1997) Water Quality of Rivers in the Mersey Catchment. No. WRA 97/02. Departmentof Primary Industry and Fisheries, Hobart, Tasmania.
Bobbi, C., Fuller, D. & Oldmeadow, D. (1996) South Esk Basin ‘State of River Report’. TechnicalReport of Data Collected between 1992 and 1995. No. WRA 96/02. Department of PrimaryIndustry and Fisheries, Hobart, Tasmania.
Bobbi, C.J. (1998) Water quality of rivers in the Huon catchment. No. WRA 98/01. Department ofPrimary Industry and Fisheries, Hobart, Tasmania.
Bobbi, C.J. (1999a) Water quality of rivers in the Ringarooma catchment. No. WRA 99/01.Department of Primary Industries, Water and Environment, Hobart, Tasmania.
Bobbi, C.J. (1999b) Water quality of rivers in the Great Forester catchment. No. WRA 99/05.Department of Primary Industries, Water and Environment, Hobart, Tasmania.
Bobbi, C.J. & Fuller, D.A. (1996). Water Quality in the South Esk Basin. Proceedings of theNutrient Determination in Freshwaters Conference, Land and Water Resources Research andDevelopment Corporation.
Cambardella, C.A., Moorman, T.B., Jaynes, D.B., Hatfield, J.L., Parkin, T.B., Simpkins, W.W. &Karlen, D.L. (1999) Water quality in Walnut Creek watershed: Nitrate-nitrogen in soils, subsurfacedrainage water and shallowgroundwater. J. Environ. Qual., 28, 25-34.
Cooke, J. & Jamieson, D. (1995) How low can you go? Water & Atmosphere - NIWA, 3, 11 - 18.
Cresser, M. & Edwards, A. (1988) Natural processes in freshwater acidification. Endeavour, NewSeries, 12, 16-20.
Foy, R.H. & Kirk, M. (1995) Agriculture and Water Quality: A Regional Study. Journal of theInstitute of Water and Environmental Management, 9, 247 - 256.
Grayson, R.B., Gipple, C.J., Finlayson, B.L. & Hart, B.T. (1997) Catchment-wide impacts on waterquality: The use of ‘snapshot’ sampling during stable flow. Journal of Hydrology, 199, 121 - 134.
Jaynes, D.B., Hatfield, J.L. & Meek, D.W. (1999) Water Quality in Walnut Creek Watershed:Herbicide and Nitrate in Surface Waters. J. Environ. Qual., 28, 45-59.
Kladivko, E.J., Van Scoyoc, G.E., Monke, E.J., Oates, K.M. & Pask, W. (1991) Pesticide and NutrientMovement into Subsurface Tile Drains on a Silt Loam Soil in Indiana. J. Environ. Qual., 20, 264-270.
Niell, M. (1989) Nitrate concentrations in river waters in the south-east of Ireland and their relationshipwith agricultural practice. Water Resources, 23, 1339-1355.

State of Rivers Water Quality
54
NHMRC, A. (1996) Australian Drinking Water Guidelines. No. No. 6. National Health and MedicalResearch Council and the Agricultural and Resources Management Council of Australia and NewZealand, Canberra, ACT.
NRA (1992) The Influence of Agriculture on the Quality of Natural Waters in England andWales. No. Water Quality Series No.6. National Rivers Authority, Almondbury, Bristol.
Scarsbrook, M.R. & Halliday, J. (1999) Transition from pasture to native forest land-use along streamcontinua: effects on stream ecosystems and implications for restoration. New Zealand Journal ofMarine and Freshwater Research, 33, 293 - 310.
UNESCO (1992) Water Quality Assessments: A Guide To The Use of Biota, Sediments and Waterin Environmental Monitoring. 1st ed. Chapman and Hall, London,
Wilcock, R.J., McBride, G.B., Nagels, J.W. & Northcott, G.L. (1995) Water Quality in a pollutedlowland stream with chronically depressed dissolved oxygen: Causes and Effects. New ZealandJournal of Marine and Freshwater Research, 29, 277 - 288.

![[P] [W] M. AyPP Brid, Geraldina.pdf](https://static.fdocuments.net/doc/165x107/586f84121a28abf0508c109c/p-w-m-aypp-brid-geraldinapdf.jpg)