Water quality modeling for seasonal fluctuation of ...
12
ORIGINAL ARTICLE Water quality modeling for seasonal fluctuation of Ichamati river, West Bengal, India Ismail Mondal 1 • Jatisankar Bandyopadhyay 1 • Ashis Kr. Paul 2 Received: 24 May 2016 / Accepted: 4 June 2016 / Published online: 21 June 2016 Ó Springer International Publishing Switzerland 2016 Abstract The study was carried out to assess some phy- sico-chemical water quality parameters and pollution sce- nario of the Ichamati river. Water samples were collected from nine different selected stations at origin of the river Majhdia to Taki end portion of the Ichamati river during the pre-monsoon, monsoon and post-monsoon periods. A seasonal variation in these parameters was observed throughout the study period and monthly comparisons were made as monsoon, pre-monsoon and post-monsoon. The results of the present investigation was undertaken to asses seasonal and spatial variation in pH, Electrical Conduc- tivity, Turbidity, Salinity, Chlorophyll, DO and Water Temperature are compared with literature values and investigation reveals that there is a fluctuation in the phy- sico-chemical characters of the water, this will be due to ebb and flow and change in the temperature and salinity as season changes. All parameters except turbidity and con- ductivity have shown high concentration in pre-monsoon- monsoon and post-monsoon, overall the concentration of water quality parameters were governed by flushing of rainfall, river water flow, sea water intrusion runoff from agricultural fields. Turbidity content in the study area was higher because the Ichamati river is dynamic zone of lower stretch. This river only depends on upper stretch rainy season rain water; no tidal fluctuation but lower stretch of the river is high tidal fluctuation the salinity is must high then upper stretch the value of Salinity 3–8.5 ppm that the parallely fluctuation the huge amount of sediment contin- uing; the turbidity is very high 600–700 NTU. Keywords Seasonal variation Á Pre-monsoon Á Pollution Á Water quality parameters and post-season Introduction In the eastern side of the Bhagirathi/Hooghly River the only major river is the Ichamati river which is a link between the ‘Nadia group of rivers’ (viz. Jalangi, Mathabhanga, Churni etc.) in the north and Sundarban in the south (Chakravarti 1938; Mondal and Bandyopadhyay 2014a, b). The Ichamati river, a spill channel of Mathabhanaga river, originating from Majdia (krishnaganj Block) Nadia district, India and Bangladesh (for a short distance) enters into the 24 Parganas (north) district at Bagdah block. Subsequently, the Ichamati river flowing through eastern part of the 24 Parganas (north & south) districts ultimately debouches in the Raimangal river vis- a-vis the bay of Bengal. The Ichamati river could be subdivided into two segments on the basis of the river morphology: Upper stretch Brand off point from Mathabhanaga River at Majdia, Krishnaganj Block, Nadia District and beri/ Swarupnagar, 24 Parganas (N) district. In this stretch the river is moribund in nature with high sinuosity and ser- pentine meanders exhibiting numerous abandoned scrolls/ oxbow lakes. In this part, the river is practically not receiving any upland flow excepting in rainy season (Mondal and Bandyopadhyay 2014a, b; Mondal and Satpati 2012). Lower segment From Beri/Swarupnagar to Bay of Bengal. In this portion, the channel width gradually & Ismail Mondal [email protected] 1 Department of Remote Sensing and GIS, Vidyasagar University, Paschim Medinipur 721102, India 2 Department of Geography and Environment Management, Vidyasagar University, Paschim Medinipur 721102, India 123 Model. Earth Syst. Environ. (2016) 2:113 DOI 10.1007/s40808-016-0153-3
Transcript of Water quality modeling for seasonal fluctuation of ...

ORIGINAL ARTICLE
Water quality modeling for seasonal fluctuation of Ichamati river,West Bengal, India
Ismail Mondal1 • Jatisankar Bandyopadhyay1 • Ashis Kr. Paul2
Received: 24 May 2016 / Accepted: 4 June 2016 / Published online: 21 June 2016
� Springer International Publishing Switzerland 2016
Abstract The study was carried out to assess some phy-
sico-chemical water quality parameters and pollution sce-
nario of the Ichamati river. Water samples were collected
from nine different selected stations at origin of the river
Majhdia to Taki end portion of the Ichamati river during
the pre-monsoon, monsoon and post-monsoon periods. A
seasonal variation in these parameters was observed
throughout the study period and monthly comparisons were
made as monsoon, pre-monsoon and post-monsoon. The
results of the present investigation was undertaken to asses
seasonal and spatial variation in pH, Electrical Conduc-
tivity, Turbidity, Salinity, Chlorophyll, DO and Water
Temperature are compared with literature values and
investigation reveals that there is a fluctuation in the phy-
sico-chemical characters of the water, this will be due to
ebb and flow and change in the temperature and salinity as
season changes. All parameters except turbidity and con-
ductivity have shown high concentration in pre-monsoon-
monsoon and post-monsoon, overall the concentration of
water quality parameters were governed by flushing of
rainfall, river water flow, sea water intrusion runoff from
agricultural fields. Turbidity content in the study area was
higher because the Ichamati river is dynamic zone of lower
stretch. This river only depends on upper stretch rainy
season rain water; no tidal fluctuation but lower stretch of
the river is high tidal fluctuation the salinity is must high
then upper stretch the value of Salinity 3–8.5 ppm that the
parallely fluctuation the huge amount of sediment contin-
uing; the turbidity is very high 600–700 NTU.
Keywords Seasonal variation � Pre-monsoon � Pollution �Water quality parameters and post-season
Introduction
In the eastern side of the Bhagirathi/Hooghly River the
only major river is the Ichamati river which is a link
between the ‘Nadia group of rivers’ (viz. Jalangi,
Mathabhanga, Churni etc.) in the north and Sundarban in
the south (Chakravarti 1938; Mondal and Bandyopadhyay
2014a, b). The Ichamati river, a spill channel of
Mathabhanaga river, originating from Majdia (krishnaganj
Block) Nadia district, India and Bangladesh (for a short
distance) enters into the 24 Parganas (north) district at
Bagdah block. Subsequently, the Ichamati river flowing
through eastern part of the 24 Parganas (north & south)
districts ultimately debouches in the Raimangal river vis-
a-vis the bay of Bengal. The Ichamati river could be
subdivided into two segments on the basis of the river
morphology:
Upper stretch Brand off point from Mathabhanaga River
at Majdia, Krishnaganj Block, Nadia District and beri/
Swarupnagar, 24 Parganas (N) district. In this stretch the
river is moribund in nature with high sinuosity and ser-
pentine meanders exhibiting numerous abandoned scrolls/
oxbow lakes. In this part, the river is practically not
receiving any upland flow excepting in rainy season
(Mondal and Bandyopadhyay 2014a, b; Mondal and
Satpati 2012).
Lower segment From Beri/Swarupnagar to Bay of
Bengal. In this portion, the channel width gradually
& Ismail Mondal
1 Department of Remote Sensing and GIS, Vidyasagar
University, Paschim Medinipur 721102, India
2 Department of Geography and Environment Management,
Vidyasagar University, Paschim Medinipur 721102, India
123
Model. Earth Syst. Environ. (2016) 2:113
DOI 10.1007/s40808-016-0153-3

increases as semidiurnal tidal flow exists. In this stretch,
Jamuna river is a tributary to the Ichamati river and joins at
Tipi, 24 Parganas (N). The lower most part of the river is
funnel shaped (Chakravarti 1938; Mondal and Bandy-
opadhyay 2014a, b).
River banks areas are the upper parts in any of its
cross-section and it may or may not consist of manmade
structures to have influences on the natural morphody-
namic system of the channel. After the bed, bank is the
second most important component of the river channel
and it is a transverse vector of the channel. The river
banks gradually descend up to the river bed and the cross-
profile may consist of different slop elements. The nature
of put significant influences on the morphological equi-
librium of the channel in relation its ambient environ-
mental set up. The bank area of a deltaic river channel is
highly influence by tidal conditions. When the river is in
low tidal level, the bank of river channel is further
exposed, (Mondal and Satpati 2012) but a high tide sit-
uation, when the river is full to its brim, much of its bank
area is inundated. The present study attempted to study
the morphodynamics setting and erosion status of the
river banks of the Ichamati, a decaying river located in
the eastern part of Ganga delta region of West Bengal
(Chakravarti 1938; Mondal and Bandyopadhyay 2014a, b;
Mondal and Satpati 2012).
Background of the study
According to the reference in the Mahabharta, the
Raghubansa and some of the Puranas, the delta lay on the
boundary between two powerful kingdoms, namely
Suhma, corresponding to western Bengal, and Vanga, or
Eastern Bengal, and its probable that the Nadia District
was under the control of the kingdom Vanga in the time of
Raghubansa, i.e., about the fifth century A.D. When the
Chinese traveler Hiuen Tsiang visited Bangal in the sev-
enth century, he found two large kingdoms in the lower
delta, namely, Samatata and tamralipti. From the general
description which he gives of the former, it seems clear
that it must have included what is now known as the Nadia
district. Samatata appears to be another name for Vanga,
given to it on account of its flat and level aspect. In the
tenth eleventh centuries the northern delta seems to have
formed part of the empire of the Pal kings, and it is certain
that it was included in the kingdom of the Sen Rajas, who
are masters of both Vanga and Radha. The town of the
Nabadwip is said have to be founded by Lakshman Sen,
son of Ballal Sen, and Ballal Sen himself used to visit the
locality, as his name is still connected with a mound and a
tank in the village of Bamanpukur which is close by
Nabadwip (Garrett 1910).
Objectives of the study
• Physical measurements of Ichamati river during the
Pre-monsoon, Monsoon and Post-Monsoon season of
Water Temperature, pH, DO, Electric Conductivity,
Turbidity, Salinity and Chlorophyll Concentration etc.
• The trends of changes in water quality with activities in
the catchment area.
• Evaluation of the effectiveness of a water quality
management intervention of the Ichamati river catch-
ment area.
• We performed an exploratory data analysis of Water
Quality Analyzer Instrument consisting mainly com-
paring the distributions for each multi season and
calculating linear trends.
Location
The Ganga–Brahmaputra Meghna river system constitutes
one of the largest river systems of the world in terms of its
water resources its extends to 21�30 to 23�30N and 88�30and 89�E. The distributaries of the Padma River like
Bhairab, Jalangi, Mathabhanga river and their tributaries
enters West Bengal and joins the Bhagirathi on its left bank.
The Bhairab and the Jalangi meet and their joined course
known as Jalangi falls into Bhagirathi. The Mathabhanga
divides into branches namely; Churni and Ichamati, The
river Churni meets the Bhagirathi while the other flows
southwards and joins the Kalindi. The Sundarbans region is
covered by numerous estuaries and streams, mainly dis-
tributaries of main rivers. The rivers are interconnected and
are fed by tidal waters. The major rivers of the area are
Hooghly, Matla, Gosaba, Saptamukhi, Haribhanga, Piyali,
Thakuran/Jamira, Raimangal, Kalindi and Ichamati.
It has an area mainly consists of a wide alluvial plain,
bounded on the west by the Bhagirathi, and intersected by
the Jalangi which flows past the head-quarters station and,
eight or nine miles further on, joins the Bhagirathi opposite
Nabadwip and lower part Santipur of Ichamati river cath-
ment area. In this area are Bhagirathi-Hooghly River is the
western most major distributry channel of the Ganga delta.
In the east other distributaries are Bhairab, Sialmari,
Jalangi, Mathabhanga-Churni-Ichamati rivers (commonly
known as ‘‘Nadia Group of Rivers’’) up to Bangladesh
border. In consequence of this area communication lines-
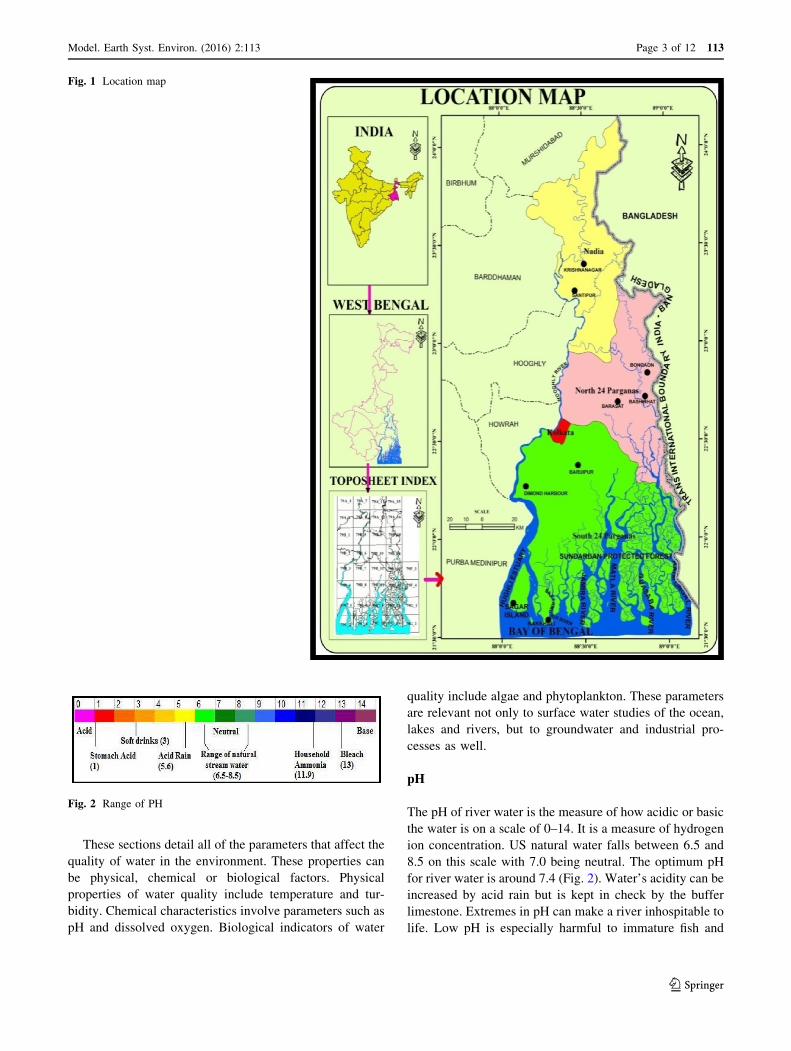
Eastern Railway and National Highway 34 and 31 (Fig. 1).
Water quality analysis of Ichamati river
Water quality testing is an important part of environmental
monitoring. When water quality is poor, it affects not only
aquatic life but the surrounding ecosystem as well.
113 Page 2 of 12 Model. Earth Syst. Environ. (2016) 2:113
123
These sections detail all of the parameters that affect the
quality of water in the environment. These properties can
be physical, chemical or biological factors. Physical
properties of water quality include temperature and tur-
bidity. Chemical characteristics involve parameters such as
pH and dissolved oxygen. Biological indicators of water
quality include algae and phytoplankton. These parameters
are relevant not only to surface water studies of the ocean,
lakes and rivers, but to groundwater and industrial pro-
cesses as well.
pH
The pH of river water is the measure of how acidic or basic
the water is on a scale of 0–14. It is a measure of hydrogen
ion concentration. US natural water falls between 6.5 and
8.5 on this scale with 7.0 being neutral. The optimum pH
for river water is around 7.4 (Fig. 2). Water’s acidity can be
increased by acid rain but is kept in check by the buffer
limestone. Extremes in pH can make a river inhospitable to
life. Low pH is especially harmful to immature fish and
Fig. 1 Location map
Fig. 2 Range of PH
Model. Earth Syst. Environ. (2016) 2:113 Page 3 of 12 113
123

insects. Acidic water also speeds the leaching of heavy
metals harmful to fish.
The Ichamati River had a measured pre-monsoon,
monsoon and post-monsoon pH ranging from 6.9 to 8.9 in
three time tests of a range of locations in 2014 (Fig. 3;
Table 1). The lower values present a problem for
most organisms with the exception of bacteria, which can
survive pH’s as low as 2.0. A pH of 8.0 should be sufficient
to support most river life with the possible exception of
snails, clams, and mussels, which usually prefer a slightly
higher pH. The average pH in the study was 7.5, a value
that is only sufficiently basic for bacteria, carp, suckers,
catfish, and some insects.
During rain water is naturally acidic at about 5.6. Stream
water usually ranges from a pH of 7.5 to a pH of 8.9; this
range is considered to be an optimal range for most aquatic
life. The natural pH of the river will vary from river to river
but the pH range of a river will generally remain stable.
The natural pH range of Ichamati river is largely
determined by the geology and soils of the area, for
example muddy areas will result in rivers and streams
having naturally higher pH levels and peat areas will have
naturally low pH levels. Carbon dioxide from the atmo-
sphere can also affect the pH of a river; when it mixes with
the water it increases its soil fertility.
The pH of the river affects the organisms living there.
Large fluctuations in pH outside of a rivers natural pH
range can lead to stresses on aquatic life in that river.
Low pH levels (below optimal) can result in fish kills by
stressing their systems causing physical damage, which in
turn can make them more vulnerable to disease, similarly
high pH particularly in combination with high water tem-
perature, can increase the amount of unionized ammonia
which is highly toxic to fish of the Ichamati river.
Dissolved oxygen
An adequate supply of dissolved oxygen gas is essential for
the survival of aquatic organisms. A deficiency in this area
is a sign of an unhealthy river. There are a variety of factors
affecting levels of dissolved oxygen. The atmosphere is a
major source of dissolved oxygen in river water. Waves
and tumbling water mix atmospheric oxygen with river
water. Oxygen is also produced by rooted aquatic plants
and algae as a product of photosynthesis.
There are physical factors that can lessen the amount of
oxygen dissolved in the Ichamati river. High temperatures,
which may result from high turbidity, from the return of
industrially used water to the river (the phenomenon of
thermal pollution), or from dry periods, decrease the
Fig. 3 Variations in pH of surface water
113 Page 4 of 12 Model. Earth Syst. Environ. (2016) 2:113
123

amount of gases that can be dissolved in water. Dry periods
also decrease flow which reduces the amount of oxygen
churned into the water.
In the navigation channel near the mouth of the
Raimangal River, the river is dredged regularly to maintain
sufficient depth for boats. This extra depth slows the river
which hampers its mixing action. The navigation channel
has particularly low dissolved oxygen levels.
DO is the most important sensitive parameter for
assessing the water quality and reflects the physical and
biological process. Dissolved oxygen is needed for living
organism to maintain biological process. From the DO
profile it can be seen that the DO level is maximum near
the water surface due to the proper mixing of surface water
with the open atmosphere. As we go deep down the DO
level decreases accordingly but it is still sufficient for the
aquatic life to survive. The percentage of dissolved oxygen
saturation also remains constant along the entire stretch of
the river under study (Fig. 4). The Dissolved oxygen was
classified during the pre-monsoon, monsoon and post
monsoon average ranges of 3.5–7.5 mg/l for pre monsoon
Bongaon location place is high flacuation DO because this
area huge amout of water hyacinth value of DO 9.8 mg/1.
The Ichamati river based on the ranges the spatial variation
graph of Dissolved oxygen has been prepared and pre-
sented (Fig. 4; Table 1). In the present study the Ichamati
river catchment area of water having acceptable range of
DO.
Chlorophyll concentration of Ichamati river
Chlorophyll gives plants their green colour and is produced
by microscopic plants called algae in lakes and rivers. The
amount of chlorophyll in water is usually highest in sum-
mer and lowest in winter because of course it is not easy for
plants to grow in winter. There are many human activities
Table 1 Location-wise sampling stations and water quality parameters
Sampling station pH DO Conductivity Turbidity Temperature Salinity Chlorophyll
(Pre-monsoon April 2014)
Orgin of Ichamati River Majdia 7.95 6.23 5.3 8.9 33.3 0.1 4.3
Naghata 8.45 6.49 5.2 2.8 33.5 0.2 18.7
Pipul Baria 7.47 5.2 6.4 12.6 34.4 0.1 5.1
Bongaon Bridge 8.21 9.52 8.8 3.3 33.8 0.3 32.6
Old Bongaon Kalitala 7.13 3.83 6.7 8.9 34.5 0.3 2.5
Kalanchi Bridge 7.94 4.62 5.15 26.3 33.1 0.7 2.5
Tentulia Bridge 8.5 5.23 7.3 500.6 34.2 5.6 1.9
Bashirhat Bridge 8.14 6.45 9.96 709.9 34.4 5.5 1.6
Taki 8.19 7.29 11.55 700.2 34.5 8.7 8.5
(Monsoon July 2014)
Orgin of Ichamati River Majdia 7.3 5.7 2.14 5.6 30.2 0.1 5.4
Naghata 7.8 5.69 2.62 8.5 31.5 0.2 7.9
Pipul Baria 7.63 5.8 2.81 9.2 31.2 0.3 8.9
Bongaon Bridge 7.2 5.6 3.2 10.7 30.8 0.1 6.9
Old Bongaon Kalitala 7.23 5.35 3.1 8.6 30.9 0.1 11.1
Kalanchi Bridge 7.94 5.74 5.6 20.4 31.7 1.2 7.7
Tentulia Bridge 7.9 5.28 8.7 201.6 31.2 2.1 2.4
Bashirhat Bridge 8.13 5.31 9.7 618.3 30.6 5.4 15.4
Taki 8.9 5.9 10.43 680.2 30.2 3.4 13.1
(Post-monsoon October 2014)
Orgin of Ichamati River Majdia 7.9 5.6 4.3 5.3 28.2 0.1 5.9
Naghata 6.98 6.2 3.4 6.5 27.3 0.2 6.87
Pipul Baria 7.2 7.52 5.6 7.9 26.6 0.1 7.6
Bongaon Bridge 7.5 6.79 6.2 4.7 27.8 0.2 6.9
Old Bongaon Kalitala 7.73 5.9 7.1 8.6 27.9 0.3 10.1
Kalanchi Bridge 7.2 4.74 8.6 2.4 28.1 1.5 8.7
Tentulia Bridge 8.1 6.28 9.7 160.6 28.2 6.1 3.4
Bashirhat Bridge 8.3 7.31 10.7 518.3 29.3 6.4 14.4
Taki 8.1 6.9 11.43 610.2 29.5 7.4 15.1
Model. Earth Syst. Environ. (2016) 2:113 Page 5 of 12 113
123

that affect chlorophyll in water, such as sewage inputs and
destruction of lake and river shorelines (Horne and Gold-
man 1994).
Chlorophyll concentrations can act as an indicator of
phytoplankton abundance and biomass in the Ichamati
river waters. It is natural for levels of chlorophyll to fluc-
tuate over the different seasons Jamshidi and Bakar (2011)
(Fig. 5; Table 1). Here at the time of measurements in pre-
monsoon, monsoon and post-monsoon the concentrations
of chlorophyll in creased with depth. Concentrations at the
Ichamati river mainly varied between 5 and 35 g/l. Dif-
ferent nine place to sample collect along the river catch-
ment the maximum value of chlorophyll was recorded
around 5–15 g/l. Then during the monsoon and post-
monsoon season average chlorophyll concentration of the
river 5.1–10.8 g/l. So the high fluctuation during the pre-
monsoon time 4.9–34 g/l, but there are two place Bongaon
and Naghita location place is high flacuation chlorophyll
because this area huge amout of water hyacinth highest
value 35 g/1 (Fig. 5; Table 1).
Water hyacinth of Ichamati river
This Ichamati river is now considered a major weed species
huge amount ofwater hyacinth are showing theBongoan and
Naghita. Ichamati river water-hyacinth is a floating plant that
has clusters of leaves with spongy stalks arising from a base
of dark purple feathery roots (Fig. 6). The leaf clusters are
often linked by smooth horizontal stems (called stolons).
Linked plants form dense rafts in the water and mud. Water-
hyacinth blocks waterways and limits boat traffic, recre-
ation, flood control and wildlife use. By producing a dense
canopy at the water surface, this exotic pest plant shades out
native submersed plant species and can uproot native
emergent species that are important to wildlife.
Environmental damage caused by water-hyacinth
populations of Ichamati river
• Water-hyacinth mats lower dissolved oxygen concen-
trations, damaging fish populations.
• Water-hyacinth mats can increase flooding in rivers and
canals by forming dams.
• Water-hyacinth mats provide ideal breeding environ-
ments for mosquitoes.
• Water-hyacinth populations decrease biodiversity in
Ichamati river catchment area.
Turbidity
Turbidity is the condition resulting from suspended solids
in the water, including silts, clays, industrial wastes, sew-
age and plankton. Such particles absorb heat in the sun-
light, thus raising water temperature, which in turn lowers
Fig. 4 Variations in DO of surface water
113 Page 6 of 12 Model. Earth Syst. Environ. (2016) 2:113
123

dissolved oxygen levels. They also prevent sunlight from
reaching plants below the surface. This decreases the rate
of photosynthesis, so less oxygen is produced by plants.
Turbidity may harm fish and their larvae. It is caused by
soil erosion, excess nutrients, various wastes and pollu-
tants, and the action of bottom feeding organisms which
stir sediments up into the water.
In the Ichamati river catchment area average tur-
bidity from a study of nine sites was Pre-Monsoon,
Monsoon and Post-Monsoon water quality analyzer
Turbidity Units (NTU), with a range of average
Majhdia to Kalanchi 10 units of upper stretch this area
influence of fresh water turbidity range low but in
lower stretch the Ichamati river depends on tidal fluc-
tuations huge amount of turbidity continuing and the
riverside of the river lots of brick fields industry are
growing the huge amount sediment accumulate of the
river. So our filed study collect the sample of turbidity
by water quality analyzer instruments maximum high
turbidity of suspended sediment load are shown of the
lower stretch average value 600–700 NTU (Fig. 7;
Table 1).
Fig. 5 Variations in chlorophyll concentration of surface water
Fig. 6 Water hyacinth of
Ichamati river Bongoan
Model. Earth Syst. Environ. (2016) 2:113 Page 7 of 12 113
123

Water temperature of Ichamati river
Temperature impacts the rates of metabolism and growth
of aquatic organisms, rate of plants’ photosynthesis, solu-
bility of oxygen in river water, and organisms’ sensitivity
to disease, parasites, and toxic materials. At a higher
temperature, plants grow and die faster, leaving behind
matter that requires oxygen for decomposition. The tem-
perature of the Ichamati river as tested in Pre-Monsoon,
Monsoon and Post-Monsoon by water quality analyzer.
The temperature of the river water fluctuates between multi
seasonal variations 25.5–34.5 �C along the entire stretch
from Ichamati river. In the Ichamati river, temperature
changes radically in the spring and autumn.
Figure 8 and Table 1 shows the temperature at different
Stations in pre-monsoon, monsoon and post-monsoon.
Among different stations, in pre-monsoon, the highest
temperature was observed at Taki (34.5 �C) and lowest at
Majhdia (33.2 �C), whereas in post-monsoon season, the
highest value was observed at Taki (28.7 �C) and lowest at
Papul Baria (26.5 �C) station and during the monsoon sea-
son, the highest value was observed at Kalanchi Bridge
(31.5 �C) and lowest at Taki (29.9 �C) station The fluctua-
tion in river water usually depends on the season, geographic
location, sampling time and temperature of effluents enter-
ing the stream (Ahipathi and Puttaiah 2006). The standard
value of temperature of river water is 20–30 �C (ECR 1997).
Why the temperature of water is important
of Ichamati river
Temperature is an important factor to consider when
assessing water quality. In addition to its own effects,
temperature influences several other parameters and can
alter the physical and chemical properties of water. In this
regard, water temperature should be accounted for when
determining (Wilde 2006).
• Metabolic rates and photosynthesis production.
• Compound toxicity.
• Dissolved oxygen and other dissolved gas
concentrations.
• Conductivity and salinity.
• Oxidation reduction potential (ORP).
• pH.
• Water density (Fig. 9).
Electric conductivity of water level
The conductivity of water due to water level fluctuations is
often directly connected to water flow. Conductivity and
salinity fluctuations due to water level changes are most
noticeable in the lower stretch of Ichamati river. As tides
rise, saltwater from the Bay of Bengal is pushed into the
river, raising salinity and conductivity values. When the
Fig. 7 Variations in turbidity of surface water
113 Page 8 of 12 Model. Earth Syst. Environ. (2016) 2:113
123

tide falls, the saltwater is pulled back toward the ocean,
lowering conductivity and salinity.
Evaporation can cause salinity concentrations to rise. As
the water level lowers, the ions present become concen-
trated, contributing to higher conductivity levels (LCRA
2014). This is why conductivity and salinity values often
increase in summer due to lower flow volume and evapo-
ration (Virginia Institute of Marine Science 2005). On the
other side of the scale, rain can increase water volume and
level, lowering conductivity of the river.
In streams and rivers, normal conductivity levels come
from the surrounding geology (EPA 2012). Clay soils will
contribute to conductivity, while granite bedrock will not
(EPA 2012). The minerals in clay will ionize as they dis-
solve, while granite remains inert. Likewise, groundwater
inflows will contribute to the conductivity of the stream or
river depending on the geology that the groundwater flows
through. Groundwater that is heavily ionized from dis-
solved minerals will increase the conductivity of the water
into which it flows.
Electrical conductivity usually used for indicating the
total concentration of ionized constituents of water (Huq
and Alam 2005). The standard value of electrical conduc-
tivity is 300 lS/cm (De 2007). The highest EC (11.5 mS/
cm) lower streche of Ichamati river of pre-monsoon,
monsoon and post-monsoon was found at Bahirhat and
Taki. The values of EC at different stations are shown in
(Fig. 10; Table 1). The average value of EC in pre-mon-
soon season was 6.5 mS/cm and monsoon season are found
that 6.5 mS/cm and post-monsoon season 8 mS/cm. These
values exceeded the standard value which indicates the
pollution of Ichamati river.
Salinity frequency change of Ichamati River Salinity is
an ambiguous term. As a basic definition, salinity is the
total concentration of all dissolved salts in water (Wetzel
2001).
These electrolytes form ionic particles as they dissolve,
each with a positive and negative charge. As such, salinity
Fig. 8 Variations in water temperature of surface water
Fig. 9 Water temperature affects nearly every other water quality
parameter
Model. Earth Syst. Environ. (2016) 2:113 Page 9 of 12 113
123

is a strong contributor to conductivity. While salinity can
be measured by a complete chemical analysis, this method
is difficult and time consuming (Water Environment Fed-
eration 1999). Seawater cannot simply be evaporated to a
dry salt mass measurement as chlorides are lost during the
process (Stewart 2004).
The salinity of the river water increases progressively as
we move from upstream towards downstream as observed
from the results (Fig. 11). In the Ichamati river catchment
area average salinity from a study of nine sites was Pre-
Monsoon, Monsoon and Post-Monsoon water quality ana-
lyzer salinity Units (PPM), with a range of average
Majhdia to Old Bongaon 0–1.5 ppm of upper stretch this
area influence of fresh water salinity range low but in lower
stretch the Ichamati river depends on tidal fluctuations
huge amount of salinity from the high tide of Bay of
Bengal. So our filed study collect the sample of salinity by
water quality analyzer instruments maximum high salinity
are shown of the lower stretch of the river average value
3–8.5 ppm (Figs. 11, 12; Table 1).
Conclusion
The present investigation summarizes various water and
soil quality parameters of the samples collected from nine
sites of the Ichamati river. The results of the Parameters
significantly fluctuated over different seasons.
• In the respect, the applied Geomorphological studies
using satellite image (of different seasons) supported
with ground truthing unravel the following major
issues.
• Increase of upland flow for rejuvenating the river
because siltation is obvious in such a river where
semidiurnal tidal effect is present.
• Need to study the difference in R.L. of river bed
between the upper and the lower stretches of the river
(especially between Beri-Swarupnagar to Tipi, North
24 Parganas) where tidal flow exists. It may so happen
that due to siltation caused by tidal flow, the river bed
level in the lower stretch i.e. after Bei-Swarupnagar is
higher than the upstream side. For the reason, even in
the low tide time the river is incapable of clearing the
flood water and long lasting inundation is prevailing in
the area.
• In the lower reaches where tidal effect is present, the
brick kilns situated in the riverside are accused for
‘water logging’ in the upper reaches-it may be termed
as ‘apparent visualization‘. Actually, the brick kilns are
acting as ‘silt trapper zone’ or ‘siltation tank’ of tide
water and thereby minimizing the deposition of silt in
the river bed. However, modernization of the ‘‘inlet
system’’ is required, as the existing ‘‘bamboo sluice
with mud lining’’ are not that much effective should be
converted with modern engineering techniques.
Fig. 10 Variations in electric conductivity of surface water
113 Page 10 of 12 Model. Earth Syst. Environ. (2016) 2:113
123

• As the season changes there is a fluctuation in the
physicochemical characters of the water, this will be
due to ebb and flow, change in the temperature and
salinity as during the pre-monsoon, monsoon-and post-
monsoon changes.
• The present water quality of Ichamati catchment area
reveals that salinity plays a dominant role in controlling
the water quality.
• The Ichamati river catchment are the lower stretch mud
content was higher because high organic matter in soil
while higher water holding capacity directs that the soil
was clays in texture.
• The present day information of Ichamati river phsio-
chamical characteristics of water would form a useful
tool or further ecological assessment and monitoring of
these Ichamati catchment ecosystem.
• Presented data in this manuscript provide a preliminary
knowledge on the distributions of chlorophyll-a in the
Ichamati river catchment area. The results showed that
the maximum concentrations of chlorophyll-a were
observed in pre-monsoon time of Bangaon.
References
Ahipathi MV, Puttaiah ET (2006) Ecological characteristics of
Vrisha bhavathi River in Bangalore (India). Environ Geol
49:1217–1222
American Public Health Assoc., American Water Works Assoc. &
Water Environment Federation (1999) Standard methods for the
examination of water and wastewater, 20th edn. American
Public Health Association, Baltimore
Fig. 11 Variations in salinity of surface water
Fig. 12 Data sampling collection of Ichamati river of WQP
instrument
Model. Earth Syst. Environ. (2016) 2:113 Page 11 of 12 113
123

Chakravarti K (1938) Land-use in relation to the fluvial ecology in the
Bhagirathi-Jalangi riparian tract-Calcutta University, M.A. thesis
(unpublished)De AK (2007) Environmental Chemistry. New age international
limited, New Delhi
ECR (1997) The environment conservation rules. Government of the
People’s Republic of Bangladesh, Ministry of Environment and
Forest, pp 205–207
EPA (2012) 5.9 Conductivity. In: Water: monitoring and assessment.
Retrieved from http://water.epa.gov/type/rsl/monitoring/vms59.
cfm
Garrett JHE (1910) Bengal district ggazetteers, Nadia
Horne AJ, Goldman CR (1994) Limnology, 2nd edition. McGraw-
Hill, Inc., 576 pp
Huq SMI, Alam MD (2005) A handbook on analysis of soil, plant and
water. BACERDU, Univerversity of Dhaka, Bangladesh, pp
xxii–246
Jamshidi S, Bakar NBA (2011) A study on distribution of chloro-
phyll-a in the coastal waters of Anzali Port, south Caspian Sea
LCRA (2014) Water quality indicators. In: Colorado river watch
network. Retrieved from http://www.lcra.org/water/quality/color
ado-river-watch-network/Pages/water-quality-indicators.aspx
Mondal I, Bandyopadhyay J (2014a) Coastal zone mapping through
geospatial technology for resource management of Indian
Sundarban, West Bengal, India. Int J Remote Sens Appl
4(2):103–112
Mondal I, Bandyopadhyay J (2014b) Environmental change of trans
international boundary Indo-Bangladesh border of Sundarban
Ichamati River catchment area using geoinformatics techniques,
West Bengal, India. Univers J Environ Res Technol 4(3):
143–154
Mondal M, Satpati LN (2012) Morphodynamic setting and nature of
bank erosion of the Ichamati River in Swarupnagar and Baduria
Blocks, 24 Parganas (N), West Bengal. Indian J Spat Sci Vol 3.0,
No. 2, Winter Issue 2012, pp 35–43
Stewart RH (2004) 6.1 Definition of salinity. In: Chapter 6–temper-
ature, salinity, and density. Retrieved from http://oceanworld.
tamu.edu/resources/ocng_textbook/chapter06/chapter06_01.html
Virginia Institute of Marine Science (2005) Physical characteristics:
salinity. In: shallow water habitats. Retrieved from http://web.
vims.edu/bio/shallowwater/physical_characteristics/salinity.html
Wetzel RG (2001) Limnology: lake and river ecosystems, 3rd edn.
Academic Press, San Diego
Wilde F (2006) Temperature 6.1. In: USGS field manual. Retrieved
from http://water.usgs.gov/owq/FieldManual/Chapter6/6.1_ver2.
113 Page 12 of 12 Model. Earth Syst. Environ. (2016) 2:113
123