Water Quality Classification by Integration of Attribute ...
17
70 INTRODUCTION River water quality is an essential required data that needs to be addressed to providing in- formation for availability decisions and usage management. Human activities are the majority of factors greatly influencing the quality of water resources. On the other hand, water quality is sig- nificantly related to public human’s health. The quality classification is crucial and beneficial to monitoring, predicting, and managing water re- sources [Shakhman and Bystriantseva, 2021]. In this case, the water quality index (WQI) is a uni- versal indicator. WQI represents a precise math- ematic function that integrated multi-variable effects, stated as a single value [Yan et al., 2015]. Various applications of WQI had been reported for many purposes, i.e., protection of the urban, lake, groundwater environments [Talalaj, 2014] and development of a specific index for river ecosystem [Naubi, 2016]. Several conditions and criteria were applied to determine WQI; for instance, Gradilla-Hernández et al. [2020] used seven physical parameters, i.e., oxygen, nutrients, organics, heavy metals, to develop their WQI from historical data. On the other hand, nine pa- rameters, such as aluminium, iron, copper, Esch- erichia coli and nitrate, were used differently by De Figueiredo et al. [De Figueiredo et al., 2019]. Simultaneously, Gaikwal et al. [2020] used many Water Quality Classification by Integration of Attribute-Realization and Support Vector Machine for the Chao Phraya River Chalisa Veesommai Sillberg 1* , Pratin Kullavanijaya 2 , Orathai Chavalparit 3 1 Department of Environmental Science, Faculty of Environment, Kasetsart University, Bangkok, 10900, Thailand 2 Pilot Plant Development and Training Institute, Excellent Center of Waste Utilization and Management, King Mongkut’s University of Technology, Thonburi , Bangkhuntien, Bangkok 10150, Thailand 3 Department of Environmental Engineering, Faculty of Engineering, Chulalongkorn University Phayathai Rd., Wangmai Pratumwan, Bangkok 10330, Thailand * Corresponding author’s email: [email protected], [email protected] ABSTRACT The water quality index (WQI) is an essential indicator to manage water usage properly. This study aimed at apply- ing a machine learning-based approach integrating attribute-realization (AR) and support vector machine (SVM) algorithm to classify the Chao Phraya River’s water quality. The historical monitoring dataset during 2008-2019 including biological oxygen demand (BOD), conductivity (Cond), dissolved oxygen (DO), faecal coliform bacte- ria (FCB), total coliform bacteria (TCB), ammonia (NH 3 -N), nitrate (NO 3 -N), salinity (Sal), suspended solids (SS), total nitrogen (TN), total dissolved solids (TDS), and turbidity (Turb), were processed via four studied steps: data pre-processing by means substituting method, contributing parameter evaluation by recognition pattern study, ex- amination of the mathematic functions for quality classification, and validation of obtained approach. The results showed that NH 3 -N, TCB, FCB, BOD, DO, and Sal were the main attributes contributing orderly to water quality classification with confidence values of 0.80, 0.79, 0.78, 0.76, 0.69, and 0.64, respectively. Linear regression was the most suitable function to river water data classification than Sigmoid, Radial basis and Polynomial. The differ- ent number of attributes and mathematic functions promoted the different classification performance and accuracy. The validation confirmed that AR-SVM was a potent approach application to classify river water’s quality with 0.86-0.95 accuracy when applied three to six attributes. Keywords: environmental data analysis, machine learning, SVM, water quality index, WQI. Journal of Ecological Engineering Received: 2021.07.20 Accepted: 2021.08.25 Published: 2021.09.01 Journal of Ecological Engineering 2021, 22(9), 70–86 hps://doi.org/10.12911/22998993/141364 ISSN 2299–8993, License CC-BY 4.0
Transcript of Water Quality Classification by Integration of Attribute ...

70
INTRODUCTION
River water quality is an essential required data that needs to be addressed to providing in-formation for availability decisions and usage management. Human activities are the majority of factors greatly influencing the quality of water resources. On the other hand, water quality is sig-nificantly related to public human’s health. The quality classification is crucial and beneficial to monitoring, predicting, and managing water re-sources [Shakhman and Bystriantseva, 2021]. In this case, the water quality index (WQI) is a uni-versal indicator. WQI represents a precise math-ematic function that integrated multi-variable
effects, stated as a single value [Yan et al., 2015]. Various applications of WQI had been reported for many purposes, i.e., protection of the urban, lake, groundwater environments [Talalaj, 2014] and development of a specific index for river ecosystem [Naubi, 2016]. Several conditions and criteria were applied to determine WQI; for instance, Gradilla-Hernández et al. [2020] used seven physical parameters, i.e., oxygen, nutrients, organics, heavy metals, to develop their WQI from historical data. On the other hand, nine pa-rameters, such as aluminium, iron, copper, Esch-erichia coli and nitrate, were used differently by De Figueiredo et al. [De Figueiredo et al., 2019]. Simultaneously, Gaikwal et al. [2020] used many
Water Quality Classification by Integration of Attribute-Realization and Support Vector Machine for the Chao Phraya River
Chalisa Veesommai Sillberg1*, Pratin Kullavanijaya2, Orathai Chavalparit3
1 Department of Environmental Science, Faculty of Environment, Kasetsart University, Bangkok, 10900, Thailand2 Pilot Plant Development and Training Institute, Excellent Center of Waste Utilization and Management, King
Mongkut’s University of Technology, Thonburi , Bangkhuntien, Bangkok 10150, Thailand3 Department of Environmental Engineering, Faculty of Engineering, Chulalongkorn University Phayathai Rd.,
Wangmai Pratumwan, Bangkok 10330, Thailand* Corresponding author’s email: [email protected], [email protected]
ABSTRACTThe water quality index (WQI) is an essential indicator to manage water usage properly. This study aimed at apply-ing a machine learning-based approach integrating attribute-realization (AR) and support vector machine (SVM) algorithm to classify the Chao Phraya River’s water quality. The historical monitoring dataset during 2008-2019 including biological oxygen demand (BOD), conductivity (Cond), dissolved oxygen (DO), faecal coliform bacte-ria (FCB), total coliform bacteria (TCB), ammonia (NH3-N), nitrate (NO3-N), salinity (Sal), suspended solids (SS), total nitrogen (TN), total dissolved solids (TDS), and turbidity (Turb), were processed via four studied steps: data pre-processing by means substituting method, contributing parameter evaluation by recognition pattern study, ex-amination of the mathematic functions for quality classification, and validation of obtained approach. The results showed that NH3-N, TCB, FCB, BOD, DO, and Sal were the main attributes contributing orderly to water quality classification with confidence values of 0.80, 0.79, 0.78, 0.76, 0.69, and 0.64, respectively. Linear regression was the most suitable function to river water data classification than Sigmoid, Radial basis and Polynomial. The differ-ent number of attributes and mathematic functions promoted the different classification performance and accuracy. The validation confirmed that AR-SVM was a potent approach application to classify river water’s quality with 0.86-0.95 accuracy when applied three to six attributes.
Keywords: environmental data analysis, machine learning, SVM, water quality index, WQI.
Journal of Ecological EngineeringReceived: 2021.07.20Accepted: 2021.08.25Published: 2021.09.01
Journal of Ecological Engineering 2021, 22(9), 70–86https://doi.org/10.12911/22998993/141364ISSN 2299–8993, License CC-BY 4.0

71
Journal of Ecological Engineering 2021, 22(9), 70–86
parameters between 11-14 for their WQI. In Thai-land, WQI is formerly calculated from eight pa-rameters: pH, DO, BOD, NO3-N, FCB, TP, TS, and SS. It is then deduced into five parameters: DO, BOD, NH3-N, FCB, and TCB. The stable variation of temperature and seasonal fluctuation of TP, TS, and SS is the main neglected reasons [Thammarak et al., 2020]. NH3-N replaces NO3-N due to its direct reflection on the contamination of wastewater from human activities. TCB has been considered a critical parameter indicating coliform bacteria and faecal coliform contamina-tion, while pH is neglected by its low variation found [PCD, 2018].
In the determination of WQI, the multi-variables system is usually applied. This system is considered valuable in its more accuracy, but some weaknesses are promoted simultaneously. For instance, there are much variable interference, longer processing time-consumed, difficulty pro-cessing of a large amount of data, errors by the inclusion of less accurate data, and the cost of analysis increase [Tung and Yaseen, 2020]. The use of a smaller number of some significant vari-ables is preferred to minimize these limitations. However, an advance of recently developed au-tomation programming and the supervised algo-rithm has demonstrated its practical applicability to the environmental monitoring data [Dezfooli et al., 2018]. A machine learning-based approach (ML) is an algorithm used popularly in the envi-ronmental prediction proposes, for example, clus-tering image classification [Okwuash and Ndehe-dehe, 2020; Najah et al., 2016], data classification [Braun et al., 2011], discovering the information for mobile’s massages data and malware data [Chen, 2020], determining the monitoring site for design the hydrometeorological monitoring net-work by groundwater-level data [Asquith, 2020], and creating a visualization map for river’s water quality prediction [Kausar et al., 2011]. ML in-volves the scientific study of the statistical model and mathematic functions in programming. The statistical theory is applied to build mathematical models and improve accuracy by recognizing pat-terns of the experienced data consisted mainly of a majority training set and a minority testing set of all historical data [Alpaydin, 2020]. ML adapta-tion approaches include an accuracy improvement via ensembles learning, comprising a scaling up, supervising and reinforcing the learning algo-rithm, and then covering the complex stochastic model [Dietterich, 1997].
The mathematic function of ML that has been used popularly in quality classification is supervised learning algorithms such as a sup-port vector machine (SVM), Naïve Bayes, and decision trees. SVM is a powerful function due to its roots in statistical learning theory and the optimization ability method to solve convex and non-convex problems. The use of a combined ML algorithm has also been studied, i.e., for pre-dicting the suspended sediment concentration from turbidity of a stream [Bayram et al., 2012], predicting the water quality parameters like a dissolved oxygen, biological oxygen demand, ammonia nitrogen, and suspended sediment concentration from complex river system [Kur-niawan et al., 2021], designing the water quality parameters and sampling frequency from sur-fact water quality management network [Khalil et al., 2014], and evaluating the carbon dioxide emissions with the related influencing factors [Wei and Wang, 2017]. It was reported that SVM provides a more accurate result [Singh et al., 2011], requires less time, and can operate with a smaller amount of data than other algorithms using the same data and condition [Gamble and Babbar-Sebens, 2012]. However, solving the limitation of variable interference is complicat-ed for each environmental data set. Therefore, the development of water quality classification using a combination of learning algorithms is a tempting approach. In this study, an Attribute-Realization (AR) combined with a Support Vec-tor Machine (SVM) algorithm was implemented to classify the Chao Praya River’s water quality. The alternative and practical method optimizing the number of variables needed to classify the river water quality and its validity when apply-ing AR-SVM to the new dataset was an aim.
MATERIAL AND METHODS
In this study, four steps were applied to de-velop an integrated approach for water quality classification: data preparation for missing values minimization using the means substitution meth-od, attribute-realization by recognition pattern study for the primary contributing parameters identification, a mathematic algorithm selection for creation of classification approach, and vali-dation of a proposed approach for the new datas-et. In Figure 1 the methodological procedure used in this study is summarized.

72
Journal of Ecological Engineering 2021, 22(9), 70–86
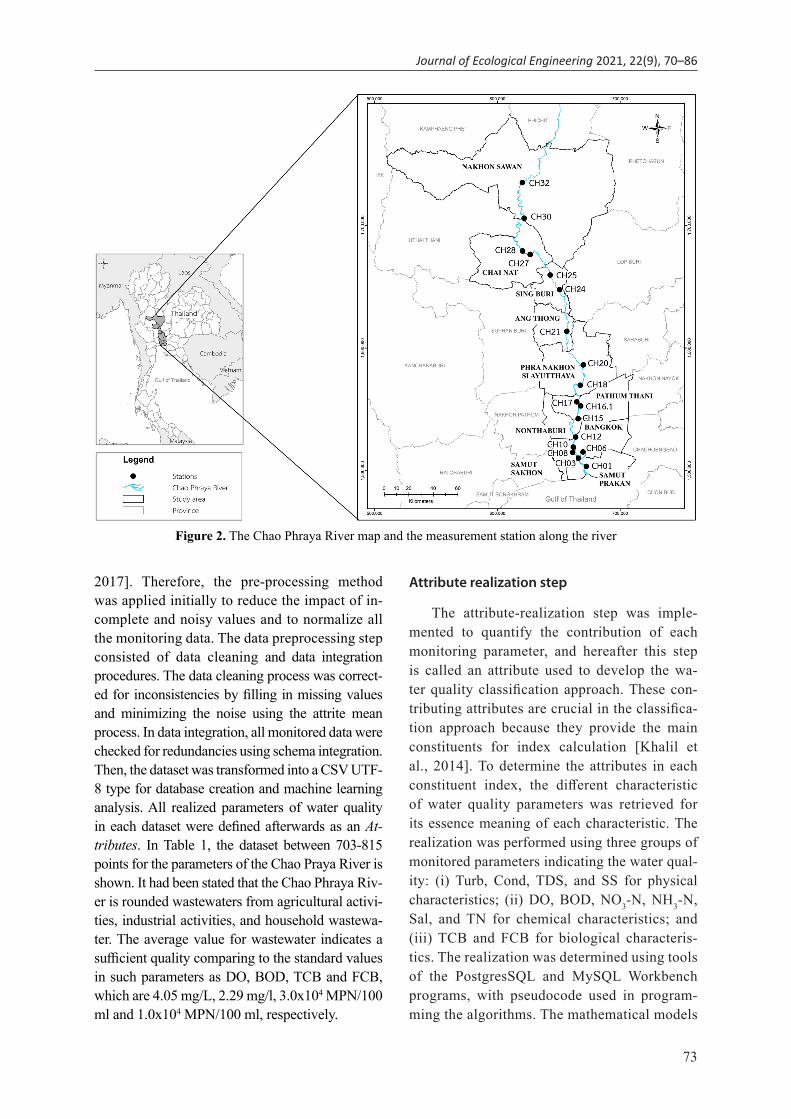
The research was conducted based on the monitoring dataset of the Chao Phraya River, the largest river in Thailand. This river begins in the north of the country, sources from two small rivers named Ping and Nan, and becomes the Chao Phra-ya River in Nakhon Sawan province, as shown in Figure 2. Then, the river fl ows through the central region, including Bangkok and exits the Gulf of Thailand in Samut Prakarn province [Muttamara and Sales, 1994]. The classifi cation approach was developed using the water quality monitoring data collected by the Pollution Control Depart-ment (PCD), Ministry of Natural Resources and Environment of Thailand [IWIS, 2019]. PCD is responsible for river water quality monitoring. About 18 stations are installed in the Chao Praya River, divided into three zones along the river. The fi rst zone is downstream, starting in Samutprakarn province at the latitude of 13.59697 to 13.81063 and longitude of 100.59439 to 100.51880, consist-ing of six monitoring stations named to the PCD as CH01, CH03, CH06, CH08, CH10, and CH12. The second zone is the midstream having fi ve sta-tions, CH15, CH16.1, CH17, CH18, and CH20, located in the latitude of 13.94527 to 14.34268 and longitude of 100.53825 to 100.57916. The upstream area is the last zone in the northern re-gion with seven stations, CH21, CH24, CH25, CH27, CH28, CH30, and CH33, in the latitude of 14.58753 to 15.68577 and longitude 100.45550 to
100.25335. The collection of monitoring data is four times a year divided roughly into two main seasons: wet season (two samplings in January-March and April-June) and the dry season (two samplings in July to September and October to December). While a new dataset of the Tha Chin River, a branch of the Chao Phraya River, was applied in the validation step. This river starts in Chi Nart province and then runs through the west-ern part of the country and fl ows into the Gulf of Thailand at Samut Sakorn. There are 14 monitor-ing stations along the river running from Chi Nart to Samut Sakorn.
Data collection and data preprocessing step
From January 2008 to February 2019, the raw dataset of the Chao Phraya River was col-lected by the PCD. This monitoring data con-sists of 12 parameters characterized by physi-cal, chemical, and biological characteristics, as shown in Table 1. These monitoring parameters indicated the water quality infl uenced by the an-thropogenic activities which are the major con-tamination sources of river water bodies, i.e., ag-riculture, household, and industry located along the river. In practice, the raw data obtained from water monitoring stations contains some miss-ing values. This incomplete, noisy, and inconsis-tent data hinders the data processing [Balderas,
Figure 1. The methodological approach used in this study
73
Journal of Ecological Engineering 2021, 22(9), 70–86
2017]. Therefore, the pre-processing method was applied initially to reduce the impact of in-complete and noisy values and to normalize all the monitoring data. The data preprocessing step consisted of data cleaning and data integration procedures. The data cleaning process was correct-ed for inconsistencies by filling in missing values and minimizing the noise using the attrite mean process. In data integration, all monitored data were checked for redundancies using schema integration. Then, the dataset was transformed into a CSV UTF-8 type for database creation and machine learning analysis. All realized parameters of water quality in each dataset were defined afterwards as an At-tributes. In Table 1, the dataset between 703-815 points for the parameters of the Chao Praya River is shown. It had been stated that the Chao Phraya Riv-er is rounded wastewaters from agricultural activi-ties, industrial activities, and household wastewa-ter. The average value for wastewater indicates a sufficient quality comparing to the standard values in such parameters as DO, BOD, TCB and FCB, which are 4.05 mg/L, 2.29 mg/l, 3.0x10⁴ MPN/100 ml and 1.0x10⁴ MPN/100 ml, respectively.
Attribute realization step
The attribute-realization step was imple-mented to quantify the contribution of each monitoring parameter, and hereafter this step is called an attribute used to develop the wa-ter quality classification approach. These con-tributing attributes are crucial in the classifica-tion approach because they provide the main constituents for index calculation [Khalil et al., 2014]. To determine the attributes in each constituent index, the different characteristic of water quality parameters was retrieved for its essence meaning of each characteristic. The realization was performed using three groups of monitored parameters indicating the water qual-ity: (i) Turb, Cond, TDS, and SS for physical characteristics; (ii) DO, BOD, NO3-N, NH3-N, Sal, and TN for chemical characteristics; and (iii) TCB and FCB for biological characteris-tics. The realization was determined using tools of the PostgresSQL and MySQL Workbench programs, with pseudocode used in program-ming the algorithms. The mathematical models
Figure 2. The Chao Phraya River map and the measurement station along the river

74
Journal of Ecological Engineering 2021, 22(9), 70–86
for the water quality index and the Apriori al-gorithm are shown in Figure 3-4.
To determine the significant contribution parameters of water quality classification, the essential attributes representing each water characteristic were evaluated comparing the traditional method of WQI calculation, after-wards called calculated WQI. The Apriori algo-rithm was implemented to identify each param-eter’s importance as a parameter that promoted the class similarly to WQI calculated from the traditional method by the PCD and USEPA. Two criteria for the calculated WQI algorithm are that firstly, the expected value of the wa-ter quality attribute according to PCD standard defining as A for lower concentration and B for a higher concentration of attribute’s value compared with surface water quality standard value. Secondly, the classification class follows the Inland Water Quality Information System of PCD (IWIS-PCD), consisting of four classes classified water quality as below [IWIS, 2016]. • class I: good water class; 70 < WQI ≤ 100 • class II: fair water class; 60 < WQI ≤ 70 • class III: poor water class; 30 < WQI ≤ 60 • class IV: very poor water class; 0 < WQI ≤ 30
Algorithm selection step
Four mathematical algorithms, namely a lin-ear regression, sigmoid, radial basis, and polyno-mial function, were examined for their suitabil-ity and compatibility with the monitoring data in developing the classification approach for river water’s quality. In this procedure, the SVM al-gorithm was utilized to transform the original water attributes into a multidimensional feature space. Then, clustered data groups were iden-tified, and subsequently, a hyperplane for data classification was designed. This procedure was conducted using PostgresSQL, the python pro-gram, and pseudocode. The six steps in the appli-cation procedure were: (i) the system divided the dataset into two, namely a training set accounted for 80% of the total monitoring data, and a test-ing set accounted for 20% of the total monitor-ing data, based on automated random sampling; (ii) the system acquired the data set from the database; (iii) the system set up the algorithm for classification; (iv) the system evaluated the optimum hyperplane by increasing the margin of two spaces in between the hyperplane;(v) analysis to optimize the kernel function was carried out using four functions which is linear, sigmoid, radial basis, and polynomial function; and (vi) the system performance of algorithms
Table 1. The characteristics and monitoring data of the Cha Phraya River during 2008-2019
Group Parameter Abbr. Unit Number Min. Max. Avg Deviation Standard value
Physical
Turbidity Turb mg/L 809 nd a 436.0 66.6 64.3 5.0 c
Conductivity Cond µS 803 0.2 4.22x10⁴ 2.3x10³ 6.32x10³ 1.5x10³ c
Total dissolved solids TDS mg/L 478 43.0 24575 1.1x10³ 2.4x10³ 500 b
Suspended solids SS mg/L 792 nd a 592.5 40.5 51.3 25 b
Chemical
Dissolved oxygen DO mg/L 813 0.1 10.0 4.0 1.9 4.0 b
Biological oxygen demand BOD mg/L 812 ND 12.8 2.3 1.8 1.5 b
Ammonia NH3-N Mg/L 748 0 8.4 1.2 4.8 0.5 b
Nitrate NO3-N mg/L 792 0.1 12.0 1.3 1.9 5.0 b
Salinity Sal ppt 799 nd a 84.0 1.2 4.7 1.0 c
Total nitrogen TN Mg/L 748 nd a 13.1 1.8 2.3 6.0 c
BiologicalFeacal coliform FCB MPN/100 mL 812 1.7x10² 9.2x10⁵ 1.1x10⁴ 3.9x10⁴ 1.0x10³ b
Total coliform TCB MPN/100 mL 813 2.0x10² 1.6x10⁶ 3x10⁴ 7.1x10⁴ 5.0x10³ b
Note: a nd non-detectable when Turb < 5.0 NTU, SS < 25 mg/L, BOD < 1.5 mg/L, NH3-N < 0.5 mg/L Sal < 1.00 ppt, and TN <6.0 mg/L; b Standard value for surface water of PCD; c Standard value for surface water of USEPA.

75
Journal of Ecological Engineering 2021, 22(9), 70–86
was evaluated, and the suitable algorithm was selected based on its precision, recall, F1-score, and accuracy. The SVM algorithm used for the supervised machine and performance evaluation is provided in detail in Figure 5.
Validation step
Various indications are used to determine mathematic function performance, divided into prediction and classifi cation approaches. For ex-ample, the linear regression model is verifi ed by
mean-absolute-error (MAE), mean squared error (MSE), root-mean-squared-error (RMSE), or R-Squared (R2). However, in this study, the classifi ca-tion model was developed. The classifi cation per-formance of each mathematic function for the ML application approach was determined using preci-sion, recall, F1-score, and accuracy [Muharemi et al., 2019]. The precision, recall, F1-score, and ac-curacy are range from 0 to 1, where the minimum to a maximum of those values depicted the poor to perfect classifi cation result [Chicco and Jurman, 2020]. In this study, the evaluation criteria were
Figure 3. Mathematical model used to determine water quality index
Figure 4. Apriori algorithm for analysis of relationship retrieval scenario using variable’s temporal information data

76
Journal of Ecological Engineering 2021, 22(9), 70–86
accuracy, precision, recall, and F1-score. Accuracy is a standard measure of accurate prediction of the results. Accuracy performance can be implemented by several correct predictions per total number of predictions described in Eq. (1). While precision represents the positive predictive value, criteria computed from the ratio of positive observations incorrectly predicted results per the total positive observations predicted. The equation of precision is described in Eq. (2). A recall is based on the sensi-tivity of the ratio of correct predicted observations from all observations. A recall is calculated by true positive per total of true positive and false negatives
of prediction as shown in Eq. (3). The point of the F1-score is the weighted average of precision and recall. When the model gives a diff erence of false positive and negative predicted results, evaluating the weighted average of precision and recall as an F1-score is better to apply. The equation of F1-score is described in Eq. (4).
𝐴𝐴𝐴𝐴𝐴𝐴𝐴𝐴𝐴𝐴𝐴𝐴𝐴𝐴𝐴𝐴𝐴𝐴𝐴𝐴𝐴𝐴𝐴𝐴𝐴𝐴𝐴𝐴𝐴𝐴𝐴𝐴 = 𝑇𝑇𝑇𝑇𝑇𝑇𝑇𝑇 + 𝑇𝑇𝑇𝑇𝑇𝑇𝑇𝑇
𝑇𝑇𝑇𝑇𝑇𝑇𝑇𝑇 + 𝑇𝑇𝑇𝑇𝑇𝑇𝑇𝑇 + 𝐹𝐹𝐹𝐹𝑇𝑇𝑇𝑇 + 𝐹𝐹𝐹𝐹𝑇𝑇𝑇𝑇 (1)
𝑃𝑃𝑃𝑃𝑃𝑃𝑃𝑃𝑃𝑃𝑃𝑃𝑃𝑃𝑃𝑃𝑃𝑃𝑃𝑃𝑃𝑃𝑃𝑃𝑃𝑃𝑃𝑃𝑃𝑃𝑃𝑃𝑃𝑃𝑃𝑃 = 𝑇𝑇𝑇𝑇𝑃𝑃𝑃𝑃
𝑇𝑇𝑇𝑇𝑃𝑃𝑃𝑃 + 𝐹𝐹𝐹𝐹𝑃𝑃𝑃𝑃 (2)
Figure 5. SVM algorithms of the supervised machine learning approach

77
Journal of Ecological Engineering 2021, 22(9), 70–86
𝑅𝑅𝑅𝑅𝑅𝑅𝑅𝑅𝑅𝑅𝑅𝑅𝑅𝑅𝑅𝑅𝑅𝑅𝑅𝑅𝑅𝑅𝑅𝑅 = 𝑇𝑇𝑇𝑇𝑇𝑇𝑇𝑇
𝑇𝑇𝑇𝑇𝑇𝑇𝑇𝑇 + 𝐹𝐹𝐹𝐹𝐹𝐹𝐹𝐹 (3)
𝐹𝐹𝐹𝐹1 − 𝑠𝑠𝑠𝑠𝑠𝑠𝑠𝑠𝑠𝑠𝑠𝑠𝑠𝑠𝑠𝑠𝑠𝑠𝑠𝑠 = 2 ∗ (𝑅𝑅𝑅𝑅𝑠𝑠𝑠𝑠𝑠𝑠𝑠𝑠𝑅𝑅𝑅𝑅𝑅𝑅𝑅𝑅𝑅𝑅𝑅𝑅 ∗ 𝑃𝑃𝑃𝑃𝑠𝑠𝑠𝑠𝑠𝑠𝑠𝑠𝑠𝑠𝑠𝑠𝑃𝑃𝑃𝑃𝑠𝑠𝑠𝑠𝑃𝑃𝑃𝑃𝑠𝑠𝑠𝑠𝑃𝑃𝑃𝑃)𝑅𝑅𝑅𝑅𝑠𝑠𝑠𝑠𝑠𝑠𝑠𝑠𝑅𝑅𝑅𝑅𝑅𝑅𝑅𝑅𝑅𝑅𝑅𝑅 + 𝑃𝑃𝑃𝑃𝑠𝑠𝑠𝑠𝑠𝑠𝑠𝑠𝑠𝑠𝑠𝑠𝑃𝑃𝑃𝑃𝑠𝑠𝑠𝑠𝑃𝑃𝑃𝑃𝑠𝑠𝑠𝑠𝑃𝑃𝑃𝑃
(4)
where: TP – true positive predicted results; TN –true negative predicted results; FP – false positive predicted results; FN – false neg-ative predicted results.
The new dataset of the Tha Chin River from Jan 2017 to Feb 2019 was applied to validate the model. The validation of the proposed approach of AR-SVM in classifying the water quality class was evaluated. The obtained finding from the attri-bute realization and algorithm selection step were performed. The validation process was discussed for the greatest contributing attributes, based on precision, recall, F1-score, and accuracy.
RESULTS AND DISCUSSION
Preprocessed data
The application of AR-SVM for the classifi-cation of the river water quality was herein in-vestigated for the Chao Praya River. An approach considered the minimum number of attributes for using in the SVM algorithm to classify water quality. The results were based on the analytical pattern and statistical correlative frequency in the analysis of water attributes. The historical data indicated substantial variations in the majority of contributing attributes, which affected water quality classification. Table 1 summarizes the av-erage values of water quality parameters in the Chao Phraya River. The results of data prepro-cessing showed the consistent trends of each attri-bute after applying the preprocessing process for missing data correction and noise minimization. The dataset consisted of 815 points. The missing data is 561 from 9,780 data in 815 points: Turb (6 data), Cond (12 data), Sal (16 data), DO (2 data), BOD (3 data), TCB (2 data), FCB (3 data), NO3-N (23 data), NH3-N (67 data), TN (67 data), SS (23 data), TDS (337 data). They indicated that the river’s water was good (DO more than 4.0 mg/L) at Nakornsawan. Pollution contamination was then found where the river passed through communities and industrial areas due to inflow from wastewater from agricultural and industrial activity, recreation, and household wastewater.
Limitations cause the missing data in this study during water quality samplings such as critical weather, equipment, which is call missing com-pletely at random (MCAR) type and limitation during analysis water quality in the laboratory like a non-detection limit of equipment and miss-ing record, which is missing at random (MAR). Those of missing value affects an error in analy-sis results. The data set after pre-processing be-come a quality dataset due to pro-processing.
Realized attributes
The results of the attribute realization identi-fied the crucial contribution of the monitoring pa-rameters to the water quality classification. The highest contributing attributes were NH3-N, TCB, and FCB for the chemical and biological character-istics, as shown in Table 2. These realized results promoted contribution support values of 0.80, 0.79 and 0.78, while BOD, DO, Sal, Turb, TDS, TN, SS, NO3-N, and Cond were the lower contribut-ing attributes with values of 0.76, 0.69, 0.64, 0.64, 0.59, 0.57, 0.54 0.54, and 0.25, respectively. This realization procedure can remove the redundant or irrelevant attributes. The result was a minimized number of calculated attributes from the large dataset. This finding was similar to Ilayaraja [Il-ayaraja and Meyyappan, 2013], who identified the frequency of significant diseases that affect pa-tients by implementing large and complex health care data. The applied realization using the Apriori algorithm reduced the number of attributes and shortened the overall processing time, similarly to Al-Maolegi [Al-Maolegi and Arkok, 2014].
From Table 2, the chemical parameter real-ization’s results based on its frequency correla-tion and the pattern of occurrences indicated that the concentration change in NH3-N promoted the highest contribution affecting water quality clas-sification accounted for 0.80 contributed support compared to 0.79, 0.78, 0.76, 0.69 and 0.64 of TCB, FCB, BOD, DO, and Sal, respectively. This finding confirmed that NH3-N was one of the main attributes that indicated the quality of river water contaminated by agricultural and household activ-ities. NH3-N is the product of aquatic organism ex-cretion and organic residue decomposition in ami-no acid catabolism [Mallasen and Valenti, 2015], precipitation, anthropogenic source, and bacterial activities [Frazier et al., 1996]. The second and third-order of the highest contribution affecting water quality classification was TCB and FCB.

78
Journal of Ecological Engineering 2021, 22(9), 70–86
of the recreational water quality standard and quantify gastrointestinal illness [USEPA, 1986; Francy et al., 1993; Cude, 2005]. In particular, TCB is a crucial parameter that can affect human health as the initiator of many illnesses. While FCB represents contamination from sources of the intestinal tracts of warm-blooded animals and oth-ers such as plants, soil, or seeds [Cude, 2005]. The four and five orders of the highest contribution affecting water quality classification were BOD and DO with contributed support 0.79 and 0.69, shown in Table 2. Both BOD and DO also pro-vide a direct indication of the quality level of river water. These parameters depict the carbonaceous biological oxygen demand to digest the remaining organic via biological metabolism and oxygen in
These biological parameters provided the contrib-uted support values of 0.79 and 0.78, respectively. TCB’s data pattern had the highest frequency of water quality class, while FCB had a bit low-fre-quency effect. Both TCB and FCB are indicators used as a recreational water quality standard and represent gastrointestinal illness [USEPA, 1986; Francy et al., 1993]. Even though these attributes’ concentrations were lower than the standard limit were defined as good water quality.
In addition, we found that both TCB and FCB were highly essential attributes for water qual-ity analysis. Those parameters have an enormous impact on water quality as it indicates intestinal bacteria, and it is also correlated with water-borne disease. TCB and FCB are the leading indicators
Table 2. Realized result of the attribute contributed to the classification of river water quality
Characteristic Variable Condition(Contributed support of each class)
Avg of contributed support g
Physical
Turb Aa -> Ic (0.00)Bb -> IIIe (0.90)
A -> IId (0.02)B -> IVf (1.00) 0.64
Cond A -> I (1.00)B -> III (0.00)
A -> II (0.00)B -> IV (0.00) 0.25
SS A -> I (0.81)B -> III (0.23)
A -> II (0.81)B -> IV (0.34) 0.54
TDS A -> I (0.54)B -> III (0.48)
A -> II (0.54)B -> IV (0.81) 0.59
Chemical
Sal A -> I (0.96)B -> III (0.20)
A -> II (0.96)B -> IV (0.63) 0.64
DO A -> I (0.63)B -> III (0.19)
A -> II (0.50)B -> IV (0.85) 0.69
BOD A -> I (1.00)B -> III (0.99)
A -> II (1.00)B -> IV (0.15) 0.76
NO3-NA -> I (1.00)
B -> III (0.07)A -> II (0.98)B -> IV (0.11) 0.54
NH3-NA -> I (1.00)
B -> III (0.33)A -> II (1.00)B -> IV (0.95) 0.80
Biological
TN A -> I (1.00)B -> III (0.09)
A -> II (0.99)B -> IV (0.20) 0.57
TCB A -> I (0.90)B -> III (0.77)
A -> II (0.50)B -> IV (1.00) 0.79
FCB A -> I (0.85)B -> III (0.78)
A -> II (0.50)B -> IV (1.00) 0.78
Note: a A is the lower concentration of attribute’s value when compare with surface water quality standard value from PCD and USEPA except DO;b B is the higher concentration of attribute’s value when compare with surface water quality standard value from PCD and USEPA except DO;c-f I-IV are the surface water-quality class that calculated from WQI,c I (good water class),d II (fairwater class), e III (poor water class), and f IV (very poor water class, respectively;g Avg of contributed support is the average of the lower concentration of attribute’s value than standard value that contribute to water quality class I and II and the higher concentration of attribute’s value than standard value that contribute to water quality class III and IV

79
Journal of Ecological Engineering 2021, 22(9), 70–86
the water. In practice, an analysis of DO is easier and quicker than BOD. Thus, DO is an essential indicator of dissolved oxygen for clean water, while BOD measurements is sometimes affected by nitrogenous contaminants that also demand oxygen, which refers to water quality. This extra oxygen demand can arise from algal respiration during intensive radiation [Bayram et al., 2012]. Also, DO is a critical factor for aquatic life and the aquatic ecosystem, making it one of the most crucial water quality attributes. Simultaneously, the data realized the DO pattern had the highest frequency effect on water quality classification and was a significant attribute regarding chemical characteristics [Franklin, 2014; Qureshimatva et al., 2015; Best et al., 2017].
Furthermore, for the physical parameter, less contribution was found. These monitoring parame-ters such as Sal, Turb, TDS, SS, and Cond prompt-ed a minor role in the realization pattern, contribut-ing the support values of 0.64, 0.64, 0.57, 0.54, and 0.25, respectively shown in Table 2. The classifica-tion level was defined as good, where the concen-tration of a parameter was lower than the standard amount. The quality of this river water was then classified as good quality. This finding was simi-lar to the traditional calculation assumption that these physical characteristics affected the overall water quality less significantly. Turb and TDS are related to the amounts of the suspended solids, col-loids, and organic-inorganic particles. However, Turb refers to particles in water and is determined by the amount of light scattered by particles. Turb includes dissolved particles in the water like TDS and affects by colour, fluorescent dissolved organic matter, SS, and TS. These are particulate matters of sediment, soil erosion, runoff, discharges, and algal blooms. Turb is a clear indicator of water quality more than TS and SS because the former includes the colour of dissolved organic matter (DOM). Furthermore, it is not affected by settled solids during the rainy and dry seasons. Despite Turb not being an inherent property of water, it is an indicator of water bodies’ environmental health and is used to regulate drinking water, determine water clarity for aquatic organisms [Anderson, 2005], and marine ecosystem [Srivastava and Ku-mar, 2013; Parra et al., 2018].
It was found that the Chao Phraya River’s water quality was significantly affected by riv-erbank activities on both sides, such as com-munities discharging waste, commercial waste, agricultural contamination, and industrial waste
[PCB, 2018]. These variations influenced the contamination and quality of the river. The up-per part of the river tended to have lower density communities than the middle and downstream el-ements, so better water could be expected in the upper reaches. For example, Cond, TS, and SS values were similar to WQI of the upstream part of the river (CH01, 03, 06, 08, 10, and 12). Slight differences were observed in the midstream to the beginning of downstream (CH15, 16.1, 17, 18, 20, 21, 24, 25, 27, and 28), while a signifi-cant change was evident downstream (CH30 and CH32). From the attribute-realization step, it was concluded that NH3-N, TCB and FCB were the most realized parameters contributing to the quality index classification. These attributes were then applied to develop the classification approach via algorithm selection.
The probability distribution of data char-acteristics and distribution frequency is related to water-quality classification, weighting order criteria. Like, NH3-N, TCB, FCB, and BOD are continuous exponential probability distribution of data characteristic (ordering value) that same occurrence with water classes, so they are high accuracy relationship with the water-quality class result (represented as contributed support). Those results are similar to the finding by Rodrigues et al., [2016]. While DO is a normal probabili-ty distribution and results in dataset some in the missing classification. For Sal, is combination of detached island type and exponential probability distribution cause missing water-quality classifi-cation. Two criteria were applied to analyze the contributed attributes with the expected to obtain more accuracy in values and classification. Ac-cording to the attribute concentration, lower (A) than standard value classifies to good (I) or fair (II) water class, while higher (B) than standard value classifies to poor (III) or very poor (IV) wa-ter class. Otherwise, WQI classification is based on aggregated weighting criteria; therefore, it causes errors in detail classification to compare with WQI classification. Otherwise, WQI classi-fication is based on aggregated weighting criteria; therefore, it causes errors in detail classification to compare with WQI classification.
Selected algorithm for classification approach development
In this step, the classification performance of four mathematic functions, which were linear

80
Journal of Ecological Engineering 2021, 22(9), 70–86
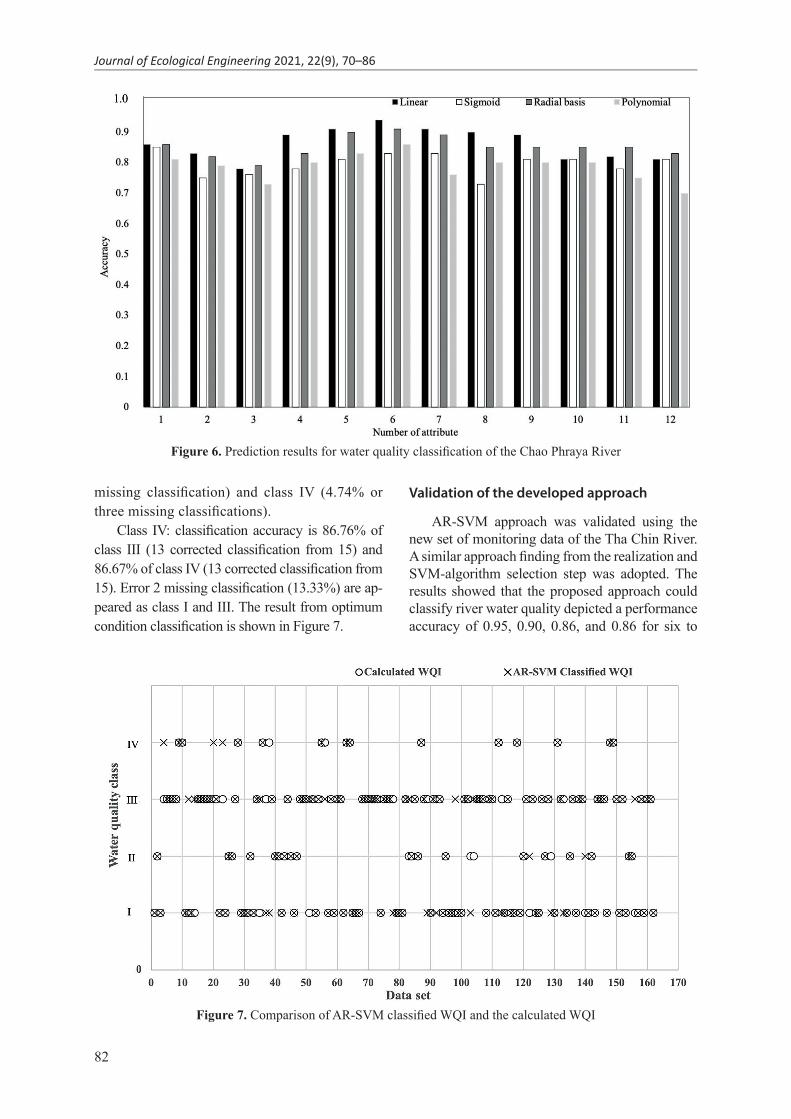
regression, sigmoid, radial basis, and polynomial function, were evaluated. The dataset was divided into two sets: training data which accounted for 80% of total data or around 653 data points, and testing data, around 162 data points. The testing results from this approach were compared to the calculated WQI. The crucial attributes were se-lected as a primary set, representing the pollutant from anthropogenic activities and harmful patho-gen effects to disease and illness from surface water utilization. Besides, each attributes supple-mentation effect on classification performance af-ter applied different classification functions were also considered. The performance of classifica-tion is summarized in Table 3. The result dem-onstrated that the different number of attributes and mathematic function classification promoted different performance measurements as accuracy, precision, recall and F1-score. The linear was the most suitable function for river water quality classification. The linear algorithm’s best classi-fication performance was obtained when six at-tributes (NH3-N, TCB, FCB, BOD, DO, and Sal)
were applied. This condition provided an accura-cy of 0.94. However, about three to six attributes also promoted satisfactorily performing in clas-sification depicted as an accuracy between 0.79-0.94. Table 3 shows the training results gathered by increasing attributes based on contributed sup-port from more to less. As a result, we found that the accuracy of the classification was expanding in each classification function. On the other hand, classification with over six attributes promoted a slightly decreasing trend due to lower contributed support value and un-distributing in a wide range of data patterns.
The classification using different attributes and mathematic functions promoted production performance differently, as shown in Table 3 and Figure 6. The proper attributes for 3-6 were found a suitable condition for classification. The higher number of attributes application was seemed un-necessary and promoted a reduction of classifi-cation performance significantly subsequently. Linear regression promoted higher classification performance than other mathematic functions.
Table 3. Trained results of AR-SVM for the Chao Phraya RiverFunction
ClassPrecision Recall F1-score Accuracy
3Pa 4Pb 5Pc 6Pd 3P 4P 5P 6P 3P 4P 5P 6P 3P 4P 5P 6P
Linear 0.79 0.89 0.91 0.94
Good Water 0.88 0.94 0.95 0.94 1.00 0.04 0.98 0.97 0.94 0.08 0.97 0.95
Fair Water 0.70 0.78 0.70 0.67 0.54 0.86 0.76 0.70 0.61 0.63 0.73 0.68
Poor Water 0.70 0.88 0.94 0.92 0.85 0.82 0.89 0.88 0.77 0.87 0.91 0.90
Very poor Water 0.67 0.88 0.92 0.82 0.20 0.75 0.85 0.82 0.31 0.67 0.88 0.82
Sigmoid 0.76 0.78 0.81 0.83
Good Water 0.87 0.89 0.91 0.92 1.00 0.98 0.98 0.97 0.93 0.94 0.95 0.94
Fair Water 0.67 0.62 0.62 0.71 0.46 0.42 0.62 0.65 0.55 0.50 0.62 0.68
Poor Water 0.70 0.75 0.83 0.85 0.80 0.84 0.80 0.85 0.75 0.79 0.82 0.85
Very poor Water 0.55 0.55 0.40 0.40 0.30 0.38 0.31 0.36 0.39 0.44 0.35 0.38
Radial basis 0.78 0.83 0.90 0.91
Good Water 0.88 0.00 0.94 0.90 1.00 0.92 0.98 0.95 0.94 0.00 0.96 0.93
Fair Water 0.80 0.51 0.71 0.65 0.46 0.63 0.71 0.57 0.59 0.62 0.71 0.60
Poor Water 0.70 0.89 0.90 0.87 0.93 0.80 0.92 0.91 0.80 0.88 0.91 0.89
Very poor Water 0.80 0.67 1.00 0.75 0.20 0.90 0.62 0.55 0.32 0.57 0.76 0.63
Polynomial 0.73 0.80 0.83 0.86
Good Water 0.90 0.95 0.98 0.97 1.00 0.97 0.97 0.95 0.95 0.00 0.98 0.96
Fair Water 0.00 0.00 0.00 0.33 0.00 0.00 0.00 0.04 0.00 0.62 0.00 0.08
Poor Water 0.60 0.70 0.71 0.70 1.00 0.97 1.00 0.94 0.75 0.82 0.83 0.81
Very poor Water 1.00 0.86 1.00 0.78 0.15 0.75 0.62 0.64 0.26 0.20 0.76 0.70a 3P is three (NH3, TCB, FCB) attributes used for classification;b 4P is four (3P+BOD) attributes used for classification;c 5P is five (4P+DO) attributes used for classification;d 6P is six (5P+Sal) attributes used for classification.

81
Journal of Ecological Engineering 2021, 22(9), 70–86
However, a similar trend was found that when in-creasing the number of attributes from three to six, the classification performance increased similarly in all functions. For example, the six attributes provided the highest accuracy result for the linear regression function for 0.86-0.94. The second to last was 5, 4, and 3 attributes, which gave 0.83-0.91, and the latter were 0.78-0.89 and 0.73-0.79, respectively. With 3-6 attributes, classification re-sults represent that the linear function was suitable for classification. The best performance evaluation was the linear function with six attributes; NH3-N, TCB, FCB, BOD, DO, and Sal, which provide 0.94 of accuracy value. The linear function has promoted the precision, recall and F1-score evalu-ation 0.94-0.97 for class I, 0.67-0.70 for class II, 0.88-0.92 for class III, and 0.82 for class IV. The redial basis is a second of higher performance clas-sification. The precision-recall and F1-score results from applying an redial basis are provided by 0.90-0.95 for class I, 0.57-0.65 for class II, 0.59-0.65 for class III and 0.55-0.75 for class IV. The third higher performance classification by precision, re-call and F1-score is polynomial. It is represented performance classification as class I (0.95-0.97), class II (0.04-0.33), class III (0.70-0.94), and class IV (0.64-0.78). Lastly, sigmoid presented the low-est performance classification by using precision, recall and F1-score evaluation. Sigmoid is present-ed as 0.92-0.97 for class I, 0.65-0.71 for class II, 0.0.85 for class III, and 0.36-0.40 for class IV.
The comparison of the classified results done on the developed AR-SVM approach and the traditional calculation of WQI using classification by the one to twelve attributes and four functions with the conven-tional WQI. The conventional water classification results from WQI were used for comparison and rep-resented as calculated-WQI. NH3-N, TCB, and FCB were the highest contributing attributes from chemi-cal and biological characteristics, which are the pri-mary pollutants from municipal wastewater. Those attributes are provided with a proper performance classification over 0.70. When applying BOD, DO, and Sal, the accuracy classification is increasing ac-cording to more comprehensive data range (4-10 ranges) and high data distribution frequency. Turb provide lower classification accuracy than Sal when utilizes at the 6th attribute, which might cause from 1) missing training of class I, where Sal classifica-tion accuracy is 96% (110 from 115 data) while Turb is 0% (0 from 115) and 2) limitation to classifica-tion class I and II. due to Turb being able to classify class I and II lower than 1% on the other hand, Sal
contributes to classifying class I and II over 95% and class IV 63%. In addition, Sal is representing the saltwater intrusion in the current situation of the Chao Phraya River. Due to the lower amount of wa-ter downstream of the river then saltwater invasion from the Gulf of Thailand into the river, especially during dry season and rain delay period. In addition, typhoon Linda in 1997 and tropical storm Pabuk in 2019 cause widespread along the Gulf of Thailand then affect rising sea levels downstream of the river [Charoensuk et al., 2019]. The over standard Sal concentration in the river also affect agriculture and irrigation usage, water supply process and quality, aquatic life and aquatic plant in the river, ecosys-tem along the river, and human health. Therefore, Sal could be included in water quality analysis and classification for river water sources.
Figure 6 shows the classification performance comparisons of four algorithms when increasing attributes. Furthermore, the results from each func-tion in this approach give a similar trend result of Bui et al. [2012], Ravi [2016] and Kalcheva et al. [2020], which is reported that the linear function had better performance than the radial basis func-tion, sigmoid function, and polynomial function. Due to linear function is the best function to deal with the linear data type and binary and multiply class [Fan et al., 2008], while radial basis func-tion, polynomial function and sigmoid function are powerful ability to classify the nonlinear data and s curve data type [Keskes and Braham, 2014].
From prediction results for water quality classifi-cation of the Chao Phraya River found the optimum condition for water quality classification at six attri-butes with linear function. The optimum condition provided over 80% accuracy in each classification.
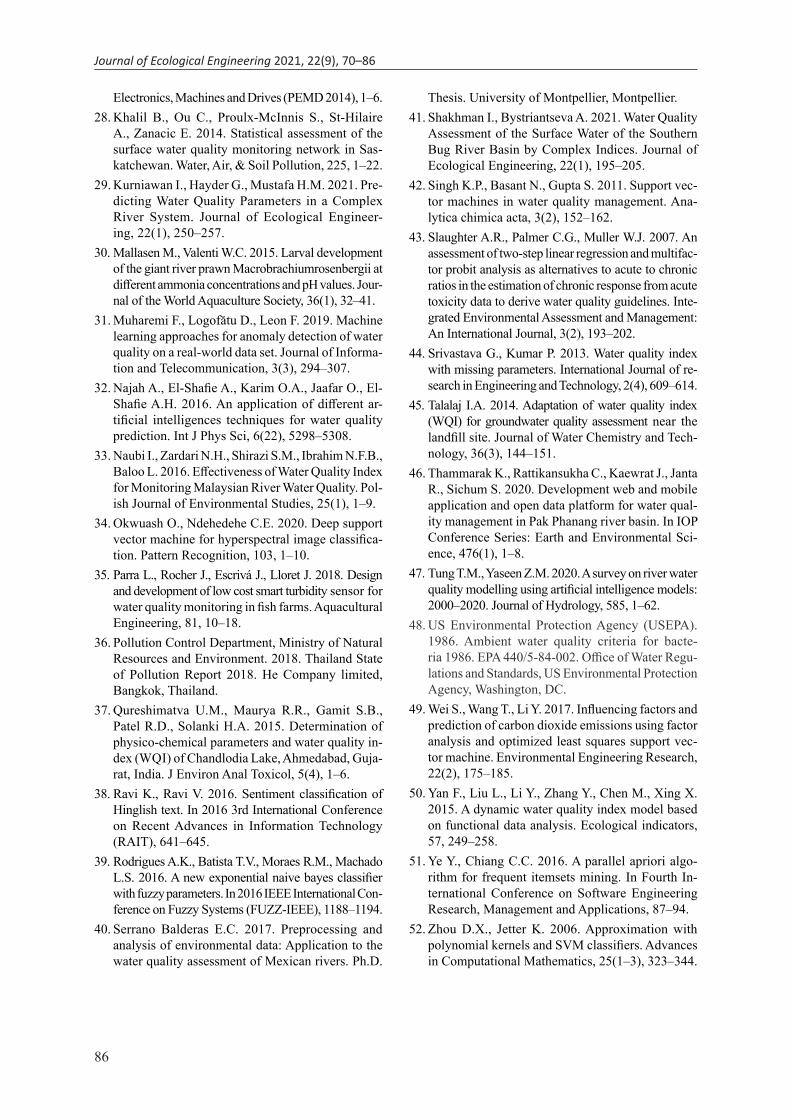
Class I: classification accuracy is 85.81% (48 corrected classification from 56 calculated WQI). The 18.18% error is from class I cause by miss-ing classification to class I (9.09% or two missing classifications) and class III (9.09% or two missing classification).
Class II: classification accuracy is 81.82% of class II (18 corrected classification from 22). The 18.18% error is from class I cause by miss-ing classification to class I (9.09% or two miss-ing classifications) and class III (9.09% or two missing classification).
Class III: classification accuracy is 86.76% of class III (59 corrected classification from 68). Then 14.24% error occurred in class III with missing classification to class I (9.50% or six
82
Journal of Ecological Engineering 2021, 22(9), 70–86
missing classifi cation) and class IV (4.74% or three missing classifi cations).
Class IV: classifi cation accuracy is 86.76% of class III (13 corrected classifi cation from 15) and 86.67% of class IV (13 corrected classifi cation from 15). Error 2 missing classifi cation (13.33%) are ap-peared as class I and III. The result from optimum condition classifi cation is shown in Figure 7.
Validation of the developed approach
AR-SVM approach was validated using the new set of monitoring data of the Tha Chin River. A similar approach fi nding from the realization and SVM-algorithm selection step was adopted. The results showed that the proposed approach could classify river water quality depicted a performance accuracy of 0.95, 0.90, 0.86, and 0.86 for six to
Figure 6. Prediction results for water quality classifi cation of the Chao Phraya River
Figure 7. Comparison of AR-SVM classifi ed WQI and the calculated WQI

83
Journal of Ecological Engineering 2021, 22(9), 70–86
three attributes applied, as shown in Table 4. The comparison of water quality classifi cation results by the proposed approach compared to the calcu-lated WQI in 16 sampling points (TC01-TC28) in 2017-2019. The prediction results were accurate and corresponded well with the traditional WQI values, with the same result for 15 of the 16 data-sets or 93.75% accuracy. Regarding non-accurate results, being out by two classes compared to the traditional WQI results occurred in 1 of 16 da-tasets or 6.25%. The comparison of prediction classifi cation with the traditional WQI of the Tha Chin River is shown in Figure 8.
Several water parameters are utilized in a water quality study for monitoring and evalua-tion based on their properties. In Thailand, the primary contamination of water resources, in-cluding the Chao Praya River, are accordingly to wastewater discharged mainly from municipal
and industrial wastewater, anthropogenic activi-ties besides water resource. It was worth noting that the results depicted the possibility of the water quality classifi cation by AR-SVM of mul-tiple attributes, which is comparable to the con-ventional calculated WQI with the same water body’s condition dynamically changing accord-ing to time, pollution sources, and the environ-ment. From attribute realized found that the Chao Phraya River’s water quality has been aff ected by several variables during the past ten year. This approach was applied based on static analysis and data pattern learning to deal with dynami-cally changing water quality data. The results obtained depicted a possibility of ML approach integrating attributes realization and SVM to identify attributes, order and accurate classifi ca-tion, representing the quality of water resource. In addition, those results can promote the likely
Table 4. Validation results of SVM-linear function for the Tha Chin RiverFunction
ClassPrecision Recall F1-score Accuracy
3Pa 4Pb 5Pc 6Pd 3P 4P 5P 6P 3P 4P 5P 6P 3P 4P 5P 6P
Linear 0.86 0.86 0.90 0.95
Good Water 0.00 0.00 0.00 0.00 0.00 0.00 0.00 0.00 0.00 0.00 0.00 0.00
Fair Water 0.50 0.50 0.86 0.88 1.00 1.00 0.86 0.00 0.67 0.67 0.86 0.93
Poor Water 1.00 1.00 0.92 1.00 0.83 1.00 1.00 1.00 0.91 1.00 0.96 1.00
Very poor Water 0.00 0.00 1.00 1.00 0.00 0.00 1.00 1.00 0.00 0.00 1.00 1.00
a 3P is three (NH3, TCB, FCB) attributes used for classifi cation;b 4P is four (3P+BOD) attributes used for classifi cation;c 5P is fi ve (4P+DO) attributes used for classifi cation;d 6P is six (5P+Sal) attributes used for classifi cation.
Figure 8. Water quality classifi cation by AR-SVM classifi ed WQI of the Tha Chin River

84
Journal of Ecological Engineering 2021, 22(9), 70–86
classification result and trend comparing with the traditional method. Some of the minority results are represented the slightly decreasing trend of performance, even though its performance is also possible to utilize for water quality classification.
In detail, the attributed realization step provided the minimum number of water qual-ity attributes in the WQI classification that covered the three characteristics of the water. The contributed attributes’ results were appro-priate for classifying water quality instead of overall variables and covered three character-istics with the linear function. The outcome based on the realized attributes produced the same result as Ye and Chiang [Ye and Chi-ang, 2006], who found a regular water class due to each water parameters. A similar result in chronic responses of aquatic ecotoxicology analysis, which is provided accuracy of predic-tion by a linear function and multifactor profit analysis [Slaughter et al., 2007]. The suitable AR-SVM gave a similar trend result with the linear weighting method of calculated WQI classification according to the linear function of SVM. A few errors were occurred due to the classification process’s inherent complexity like a margin classifies part, which is changed according to the new insert dataset [Zhou and Jetter, 2006; Gorriz et al., 2017]. Furthermore, the approach could be applied to another river system (Tha Chin) as a case study. The results produced a similar outcome compared with calculated WQI and established the minimum number of variables necessary (dimensionless).
As well as AR step also including Sal ac-cording to a current situation in Thailand, which facing to saltwater invasion problem in the dry season and rain delay period. Other also chang-ing, the physical characteristic has highly vari-ant during the rainy (flooding) season due to soil erosions. It causes a higher concentration of SS and Turb, while the concentration of TDS and Sal are lower in the rainy (flooding) season. In the dry season, the physical characteristic is af-fected by the salt intrusion, and it leaks a higher concentration of Sal and TDS but also cause a low concentration of SS and Turb. So physical characteristics could be limited for water quality analysis and classification in Thailand and other developing countries with high variant water ac-cording to season. Therefore, this study could alternate for water quality analysis and classifi-cation in limitation areas.
CONCLUSIONS
The results demonstrated the possibility of ap-plying a machine learning tool integrating AR and SVM algorithms to classify river water quality. AR identified the most contributing attributes to promote the river’s quality. The most contributing attributes were orderly NH3-N, TCB, FCB, BOD, DO, and Sal, promoting the contributed values in the classification of 0.80, 0.79, 0,78, 0.76, 0.69, and 0.64, respectively, compared to 0.25-0.64 of TDS, Turb, TN, SS, NO3-N, and Cond. The SVM linear algorithm was the most suitable function for river water quality classification with six attri-butes. It enabled the highest classification perfor-mances depicted as the accuracy of 0.94, a preci-sion average of 0.84, recall average of 0.84, and F1-score average of 0.84. While the minimum condition of three attributes also made it possible to classification with an accuracy of 0.73. The validation of the developed approach integrating AR and SVM for the Tha Chin River dataset con-firmed the possibility of applying this alternative approach to classify river water, with satisfactory and reliable classification results being obtained as 0.95, 0.90, 0.86, and 0.86 for six to three at-tributes for classification. The prediction results in 2019 were accurate 93.75% and corresponded well with the traditional WQI values. The finding results depicted a beneficial application of ML for the classification of river water quality and the possibility of using the different attributes that influencing the classification performance-related significantly to contamination source relatively.
Acknowledgments
This work was supported by a grant from the Kasetsart University Research and Development Institute (KURDI), Bangkok, Thailand.
REFERENCES
1. Al-Maolegi M., Arkok B. 2014. An improved Apriori algorithm for association rules. International Journal on Natural Language Computing (IJNLC), 3(1), 21–29.
2. Alpaydin E. 2020. Introduction to machine learning fourth edition. MIT press, United States.
3. Anderson C.W. Turbidity 6.7.2005. USGS National Field Manual for The Collection of Water Quality Data, US Geological Survey.
4. Asquith W.H. 2020. The Use of Support Vectors from Support Vector Machines for Hydrometeorologic

85
Journal of Ecological Engineering 2021, 22(9), 70–86
Monitoring Network Analyses. Journal of Hydrol-ogy, 583, 1–10.
5. Bayram A., Kankal M., Önsoy H. 2012. Estima-tion of suspended sediment concentration from turbidity measurements using artificial neural networks. Environmental monitoring and assess-ment, 184(7), 4355–4365.
6. Best M.A., Wither A.W., Coates S. 2007. Dissolved oxygen as a physico-chemical supporting element in the Water Framework Directive. Marine pollution bulletin, 55(1–6), 53–64.
7. Braun A.C., Weidner U., Hinz S. 2011. Support vec-tor machines import vector machines and relevance vector machines for hyperspectral classification—A comparison. In 2011 3rd Workshop on Hyperspectral Image and Signal Processing: Evolution in Remote Sensing (WHISPERS), 1–4.
8. Bui D.T., Pradhan B., Lofman O., Revhaug I., Dick O.B. 2012. Application of support vector machines in landslide susceptibility assessment for the Hoa Binh province (Vietnam) with kernel functions analysis. In 6th International Congress on Environ-mental Modelling and Software, 1–9.
9. Chen Y. 2020. Mining of instant messaging data in the Internet of Things based on support vector ma-chine. Computer Communications, 154, 278–287.
10. Charoensuk T., Jantanavanich K., Thanatarnporn W., Srisomporn P. 2019. Monitor and Analyzing Salinity intrusion using Salinity Intrusion Forecast System in the Chao Phraya River During Tropical Pabuk 2019. The 25th National Convention on Civil Engineering, 1–7.
11. Chicco D. & Jurman, G. 2020. The advantages of the Matthews correlation coefficient (MCC) over F1 score and accuracy in binary classification evalua-tion. BMC genomics, 21(1), 1–13.
12. Cude C.G. 2005. Accommodating Change of Bacte-rial Indicators in Long Term Water Quality Datasets. JAWRA Journal of the American Water Resources Association, 41(1), 47–54.
13. De Figueiredo H.P., de Figueiredo C.R.P., de Sou-za Barros J.H., Constantino M., Magalhães Filho F.J.C., de Moraes P.M., da Costa R.B.. 2019. Water quality in an urban environmental protection area in the Cerrado Biome, Brazil. Environmental monitor-ing and assessment, 191(2), 117.
14. Dezfooli D., Hosseini-Moghari S.M., Ebrahimi K., Araghinejad S. 2018. Classification of water quality status based on minimum quality parameters: ap-plication of machine learning techniques. Modeling Earth Systems and Environment, 4(1), 311–324.
15. Dietterich T.G. 1997. Machine-learning research. AI magazine, 18(4), 97–97.
16. Fan R.E., Chang K.W., Hsieh C.J., Wang X.R., Lin C.J. 2008. LIBLINEAR: A library for large linear
classification. the Journal of machine Learning re-search, 9, 1871–1874.
17. Francy D.S., Myers D.N, Metzker K.D. 1993. Esch-erichia coli and fecal-coliform bacteria as indicators of recreational water quality. US Department of the Interior, US Geological Survey, 93(4083), United States of America.
18. Franklin P.A. 2014. Dissolved oxygen criteria for freshwater fish in New Zealand: a revised approach. New Zealand Journal of Marine and Freshwater Re-search. 48(1), 112–126.
19. Frazier B.E., Naimo T.J., Sandheinrich M.B. 1996. Temporal and vertical distribution of total ammonia nitrogen and un‐ionized ammonia nitrogen in sedi-ment pore water from the upper Mississippi River. Environmental Toxicology and Chemistry: An In-ternational Journal, 15(2), 92–99.
20. Gamble A., Babbar-Sebens M. 2012. On the use of multivariate statistical methods for combin-ing in-stream monitoring data and spatial analy-sis to characterize water quality conditions in the White River Basin, Indiana. USA. Environ. Monit. Assess, 184, 845–875.
21. Gorriz J.M., Ramírez J., Suckling J., Illan I.A., Ortiz A., Martínez-Murcia F.J., Segovia F., Salas-Gonzalez D., Wang S. 2017. Case-based statistical learning: a non-parametric implementation with a conditional-error rate SVM. IEEE Access, 5, 11468–11478.
22. Gradilla-Hernández M.S., de Anda J., Garcia-Gonzalez A., Montes C.Y., Barrios-Piña H., Ruiz-Palomino P., Díaz-Vázquez D. 2020. Assessment of the water quality of a subtropical lake using the NSF-WQI and a newly proposed ecosystem specific water quality index. Environmental Monitoring and Assessment, 192, 1–19.
23. Ilayaraja M., Meyyappan T. 2013. Mining medical data to identify frequent diseases using Apriori algorithm. In 2013 International Conference on Pattern Recogni-tion, Informatics and Mobile Engineering, 194–199.
24. Inland Water Quality Information System (IWIS) of Pollution Control Department. 2016. Manual for Water Quality Index (WQI) calculation. Pollution Control Department, Bangkok, Thailand.
25. Kalcheva N., Karova M., Penev I. 2020. Comparison of the accuracy of SVM kemel functions in text classi-fication. In 2020 International Conference on Biomed-ical Innovations and Applications (BIA), 141–145.
26. Kausar N., Samir B.B., Abdullah A., Ahmad I., Hus-sain M. 2011. A review of classification approaches using support vector machine in intrusion detection. In International Conference on Informatics Engi-neering and Information Science, 24–34.
27. Keskes H. & Braham A. 2014. DAG SVM and pitch synchronous wavelet transform for induction motor di-agnosis. In 7th IET International Conference on Power
86
Journal of Ecological Engineering 2021, 22(9), 70–86
Electronics, Machines and Drives (PEMD 2014), 1–6.28. Khalil B., Ou C., Proulx-McInnis S., St-Hilaire
A., Zanacic E. 2014. Statistical assessment of the surface water quality monitoring network in Sas-katchewan. Water, Air, & Soil Pollution, 225, 1–22.
29. Kurniawan I., Hayder G., Mustafa H.M. 2021. Pre-dicting Water Quality Parameters in a Complex River System. Journal of Ecological Engineer-ing, 22(1), 250–257.
30. Mallasen M., Valenti W.C. 2015. Larval development of the giant river prawn Macrobrachiumrosenbergii at different ammonia concentrations and pH values. Jour-nal of the World Aquaculture Society, 36(1), 32–41.
31. Muharemi F., Logofătu D., Leon F. 2019. Machine learning approaches for anomaly detection of water quality on a real-world data set. Journal of Informa-tion and Telecommunication, 3(3), 294–307.
32. Najah A., El-Shafie A., Karim O.A., Jaafar O., El-Shafie A.H. 2016. An application of different ar-tificial intelligences techniques for water quality prediction. Int J Phys Sci, 6(22), 5298–5308.
33. Naubi I., Zardari N.H., Shirazi S.M., Ibrahim N.F.B., Baloo L. 2016. Effectiveness of Water Quality Index for Monitoring Malaysian River Water Quality. Pol-ish Journal of Environmental Studies, 25(1), 1–9.
34. Okwuash O., Ndehedehe C.E. 2020. Deep support vector machine for hyperspectral image classifica-tion. Pattern Recognition, 103, 1–10.
35. Parra L., Rocher J., Escrivá J., Lloret J. 2018. Design and development of low cost smart turbidity sensor for water quality monitoring in fish farms. Aquacultural Engineering, 81, 10–18.
36. Pollution Control Department, Ministry of Natural Resources and Environment. 2018. Thailand State of Pollution Report 2018. He Company limited, Bangkok, Thailand.
37. Qureshimatva U.M., Maurya R.R., Gamit S.B., Patel R.D., Solanki H.A. 2015. Determination of physico-chemical parameters and water quality in-dex (WQI) of Chandlodia Lake, Ahmedabad, Guja-rat, India. J Environ Anal Toxicol, 5(4), 1–6.
38. Ravi K., Ravi V. 2016. Sentiment classification of Hinglish text. In 2016 3rd International Conference on Recent Advances in Information Technology (RAIT), 641–645.
39. Rodrigues A.K., Batista T.V., Moraes R.M., Machado L.S. 2016. A new exponential naive bayes classifier with fuzzy parameters. In 2016 IEEE International Con-ference on Fuzzy Systems (FUZZ-IEEE), 1188–1194.
40. Serrano Balderas E.C. 2017. Preprocessing and analysis of environmental data: Application to the water quality assessment of Mexican rivers. Ph.D.
Thesis. University of Montpellier, Montpellier.41. Shakhman I., Bystriantseva A. 2021. Water Quality
Assessment of the Surface Water of the Southern Bug River Basin by Complex Indices. Journal of Ecological Engineering, 22(1), 195–205.
42. Singh K.P., Basant N., Gupta S. 2011. Support vec-tor machines in water quality management. Ana-lytica chimica acta, 3(2), 152–162.
43. Slaughter A.R., Palmer C.G., Muller W.J. 2007. An assessment of two‐step linear regression and multifac-tor probit analysis as alternatives to acute to chronic ratios in the estimation of chronic response from acute toxicity data to derive water quality guidelines. Inte-grated Environmental Assessment and Management: An International Journal, 3(2), 193–202.
44. Srivastava G., Kumar P. 2013. Water quality index with missing parameters. International Journal of re-search in Engineering and Technology, 2(4), 609–614.
45. Talalaj I.A. 2014. Adaptation of water quality index (WQI) for groundwater quality assessment near the landfill site. Journal of Water Chemistry and Tech-nology, 36(3), 144–151.
46. Thammarak K., Rattikansukha C., Kaewrat J., Janta R., Sichum S. 2020. Development web and mobile application and open data platform for water qual-ity management in Pak Phanang river basin. In IOP Conference Series: Earth and Environmental Sci-ence, 476(1), 1–8.
47. Tung T.M., Yaseen Z.M. 2020. A survey on river water quality modelling using artificial intelligence models: 2000–2020. Journal of Hydrology, 585, 1–62.
48. US Environmental Protection Agency (USEPA). 1986. Ambient water quality criteria for bacte-ria 1986. EPA 440/5-84-002. Office of Water Regu-lations and Standards, US Environmental Protection Agency, Washington, DC.
49. Wei S., Wang T., Li Y. 2017. Influencing factors and prediction of carbon dioxide emissions using factor analysis and optimized least squares support vec-tor machine. Environmental Engineering Research, 22(2), 175–185.
50. Yan F., Liu L., Li Y., Zhang Y., Chen M., Xing X. 2015. A dynamic water quality index model based on functional data analysis. Ecological indicators, 57, 249–258.
51. Ye Y., Chiang C.C. 2016. A parallel apriori algo-rithm for frequent itemsets mining. In Fourth In-ternational Conference on Software Engineering Research, Management and Applications, 87–94.
52. Zhou D.X., Jetter K. 2006. Approximation with polynomial kernels and SVM classifiers. Advances in Computational Mathematics, 25(1–3), 323–344.