Water quality and geochemistry evaluation of … quality and geochemistry evaluation of groundwater...
17
REVIEW ARTICLE Water quality and geochemistry evaluation of groundwater upstream and downstream of the Khirbet Al-Samra wastewater treatment plant/Jordan William Bajjali • Kheir Al-Hadidi • Ma’mmon Ismail Received: 27 June 2014 / Accepted: 19 December 2014 Ó The Author(s) 2015. This article is published with open access at Springerlink.com Abstract Groundwater in the northeastern Amman-Zarqa basin is an important source of water for irrigation. The quality and quantity of water has deteriorated due to mis- management and misunderstanding of the hydrogeological system. Overexploitation of groundwater resources upstream of the Khirbet Al-Samra wastewater treatment plant (KSWTP) has lowered the water table 43 m since the beginning of groundwater development in 1968. Heavy pumping of groundwater downstream of KSWTP has not dropped the water level due to constant recharge from the Zarqa river bed. The water level of groundwater is rising continuously at a rate of 20 cm per year since building the KSWTP in 1985. Groundwater salinity has also shifted the quality of the aquifer from fresh to brackish. Continual irrigation from the groundwater upstream of KSWTP dis- solves accumulated salt from the soil formed by evapora- tion, and the contaminated water infiltrates back to the aquifer, thereby increasing both salt and nitrate concen- trations. The intense irrigation from the reclaimed water downstream of KSWTP and leakage of treated wastewater from the Zarqa River to the shallow groundwater is a secondary source of salt and nitrates. The isotopic com- position of groundwater varies over a wide range and is associated with the meteoric water line affected by Mediterranean Sea air moisture. The isotopic composition of groundwater is represented by evaporation line (EL) with a low slope of 3.6. The enrichment of groundwater in d 18 O and dD is attributed mainly to the two processes of evaporation before infiltration of return flow and mixing of different types of water in KSWTP originating from dif- ferent aquifers. The EL starts from a location more depleted than the weighted mean value of the Amman rainfall station on the Eastern Meteoric Water Line indi- cating that the recharge took place under the climate regime prevailing today in Jordan and the recharge of the groundwater originates from a greater elevation than that of the Amman station. Elevated high tritium levels observed in wells in close proximity to a regional fault system sig- nify local recharge and short residence time. The Khaldyia dam is a local source for groundwater recharge. Keywords Salinity Over-exploitation Return flow Recharge Environmental isotope Fault Introduction Jordan is categorized as the fourth water poorest country in the world, the allocation per capita reaches less than 150 l/ capita/day (Alkhaddar et al. 2005). This water scarcity restricts economic growth (Al-Hadidi 2011), and decision makers are challenged to secure additional potable water for an increasing population, agricultural activities, and growing industry. Very soon, more water will be required for cooling a proposed nuclear power plant in the study area. The climate of the region is considered arid, and water resources in the study region depend on precipitation. Average precipitation and evaporation is 150 and 1,500 mm/year respectively in the study area (WAJ 2003). W. Bajjali (&) Department of Natural Sciences, University of Wisconsin- Superior, Belknap and Catlin, PO Box 2000, Superior, WI 54880, USA e-mail: [email protected] K. Al-Hadidi M. Ismail Water Authority of Jordan, PO Box 2412, Amman, Jordan e-mail: [email protected] M. Ismail e-mail: [email protected] 123 Appl Water Sci DOI 10.1007/s13201-014-0263-x
Transcript of Water quality and geochemistry evaluation of … quality and geochemistry evaluation of groundwater...
REVIEW ARTICLE
Water quality and geochemistry evaluation of groundwaterupstream and downstream of the Khirbet Al-Samra wastewatertreatment plant/Jordan
William Bajjali • Kheir Al-Hadidi • Ma’mmon Ismail
Received: 27 June 2014 / Accepted: 19 December 2014
� The Author(s) 2015. This article is published with open access at Springerlink.com
Abstract Groundwater in the northeastern Amman-Zarqa
basin is an important source of water for irrigation. The
quality and quantity of water has deteriorated due to mis-
management and misunderstanding of the hydrogeological
system. Overexploitation of groundwater resources
upstream of the Khirbet Al-Samra wastewater treatment
plant (KSWTP) has lowered the water table 43 m since the
beginning of groundwater development in 1968. Heavy
pumping of groundwater downstream of KSWTP has not
dropped the water level due to constant recharge from the
Zarqa river bed. The water level of groundwater is rising
continuously at a rate of 20 cm per year since building the
KSWTP in 1985. Groundwater salinity has also shifted the
quality of the aquifer from fresh to brackish. Continual
irrigation from the groundwater upstream of KSWTP dis-
solves accumulated salt from the soil formed by evapora-
tion, and the contaminated water infiltrates back to the
aquifer, thereby increasing both salt and nitrate concen-
trations. The intense irrigation from the reclaimed water
downstream of KSWTP and leakage of treated wastewater
from the Zarqa River to the shallow groundwater is a
secondary source of salt and nitrates. The isotopic com-
position of groundwater varies over a wide range and is
associated with the meteoric water line affected by
Mediterranean Sea air moisture. The isotopic composition
of groundwater is represented by evaporation line (EL)
with a low slope of 3.6. The enrichment of groundwater in
d18O and dD is attributed mainly to the two processes of
evaporation before infiltration of return flow and mixing of
different types of water in KSWTP originating from dif-
ferent aquifers. The EL starts from a location more
depleted than the weighted mean value of the Amman
rainfall station on the Eastern Meteoric Water Line indi-
cating that the recharge took place under the climate
regime prevailing today in Jordan and the recharge of the
groundwater originates from a greater elevation than that of
the Amman station. Elevated high tritium levels observed
in wells in close proximity to a regional fault system sig-
nify local recharge and short residence time. The Khaldyia
dam is a local source for groundwater recharge.
Keywords Salinity � Over-exploitation � Return flow �Recharge � Environmental isotope � Fault
Introduction
Jordan is categorized as the fourth water poorest country in
the world, the allocation per capita reaches less than 150 l/
capita/day (Alkhaddar et al. 2005). This water scarcity
restricts economic growth (Al-Hadidi 2011), and decision
makers are challenged to secure additional potable water
for an increasing population, agricultural activities, and
growing industry. Very soon, more water will be required
for cooling a proposed nuclear power plant in the study
area. The climate of the region is considered arid, and
water resources in the study region depend on precipitation.
Average precipitation and evaporation is 150 and
1,500 mm/year respectively in the study area (WAJ 2003).
W. Bajjali (&)
Department of Natural Sciences, University of Wisconsin-
Superior, Belknap and Catlin, PO Box 2000, Superior,
WI 54880, USA
e-mail: [email protected]
K. Al-Hadidi � M. Ismail
Water Authority of Jordan, PO Box 2412, Amman, Jordan
e-mail: [email protected]
M. Ismail
e-mail: [email protected]
123
Appl Water Sci
DOI 10.1007/s13201-014-0263-x
The intensive use of groundwater for agricultural
activities disturbed the aquifer balance, and a major decline
in water level accompanied by deterioration in groundwa-
ter quality has taken place. The decline of groundwater
levels due to over-pumping exceeds the recognized safe
yield. The salinity increased from 265 part per millions
(ppm) to more than 4,000 ppm at present and nitrate con-
centration in some wells has reached more than 300 ppm.
To reduce the amount of groundwater use for agriculture
and prevent further decline in the water table of the aquifer,
the water authority built in 1985 the Khirbet Al-Samra
wastewater treatment plant (KSWTP) in the region with an
intent to make the plant a reliable and sustainable water
resource for irrigation purposes.
Wastewater use in irrigation is a widespread practice
worldwide. For centuries, farmers in China, northern Eur-
ope, and Mediterranean countries used human and animal
manure as fertilizers. In the Middle East, countries such as
Egypt, Lebanon, and Morocco have used wastewater a
source of crop nutrients over many decades (Jimenez and
Asano 2008). Worldwide, the land irrigated with waste-
water or polluted water is estimated to be 40–60 thousand
square kilometers (Keraita et al. 2008). A study by the
World Health Organization estimated that the land irrigated
by wastewater is nearly equivalent to 7 % of the total
irrigated land in the world (WHO 2006).
The biggest user of wastewater in undeveloped countries
is the agriculture sector, which makes wastewater a valuable
and reliable source of water. It is available all year round,
unlike precipitation or perennial streams especially in arid
areas (Jimenez and Asano 2008; Raschid-Sally et al. 2005).
This allows farmers to produce year-round production with
multiple cultivation cycles (Keraita et al. 2008).
Despite the great benefit of using the treated wastewater
in agriculture, it becomes apparent that this application
comes with a negative impact on the environment and
health risks to human from microbiological pathogens.
Risks of infection with the bacteria ‘‘Giardia’’ in devel-
oping countries have been associated with wastewater
reuse, and have been reported in Mexico (Cifuentes et al.
2000) and in the Jordan Valley, Jordan (Mutaz 2007).
Heavy metals in plants grown in wastewater-irrigated soil
were also observed in high concentration in China (Khan
et al. 2008). It generates high rates of solute infiltrate into
the underlying aquifers, and has had an effect on the rates
and compositions of groundwater recharge and aquifer
geochemistry. It dissolves and transports excess quantities
of fertilizers to the subsurface, enhancing the water–rock
interactions in soils and aquifers caused by increased
concentrations (Bohlke 2002).
Numerous studies at various locations worldwide
showed that the chemical makeup of shallow aquifers have
been altered from agricultural practices and fertilizers.
Agricultural contaminant loads in recharging groundwater
have resulted in problems related to water quality and its
suitability for different uses (Fan and Steinberg 1996;
Bajjali 2006).
Agricultural activates usually lead to higher salinity and
affected the concentrations of a large number of inorganic
chemicals in groundwater, for example: NO3-, Cl-,
SO42-, H?, PO4
3-, HCO3-, K?, Mg2?, Ca2?, Sr2?, Ba2?
(Ma et al. 2005; Bohlke 2002). The long-term irrigation,
irrigation-return-flow, application of unlimited agricultural
fertilizers, and recycling of saline groundwater act to fur-
ther increase the salinity in the groundwater. This changes
the chemical makeup of the recharging water, thus result-
ing in the change of the molal ratios of Na/Cl and Ca/Cl
(Subba Rao 2008; Kass et al. 2005; Bajjali and Al-Hadidi
2006).
Other studies also indicate that agricultural practices
with treated wastewater have resulted in nitrate contami-
nation of groundwater, with concentrations commonly
exceeding the drinking-water maximum contaminant level
of 45 ppm. In the state of California, 10 % of public water-
supply wells exceed the maximum contamination level of
nitrate due to agricultural activities (Ekdahl et al. 2009).
Irrigation resulted in groundwater becoming contaminated
by nitrate to great depth (Chena et al. 2006; Seiler 2005;
Moore et al. 2004). High NO3- concentration ([100 ppm)
in the region’s water table was derived from nitrification of
the NH4 in the wastewater used for irrigation (Kass et al.
2005).
Contamination of groundwater adjacent to wastewater
facilities discharging into surface water has been observed.
The hydrological conditions created by treated wastewater
discharge into streams raises the potential for contamina-
tion of shallow groundwater aquifers, especially in arid
areas (Foster and Chilton 2004). In such settings, waste-
water facilities act as a significant groundwater recharge
zone, with high hydraulic gradients that enhance the
transport of water solute transport to the nearby aquifer
(Lapworth et al. 2012).
Study area
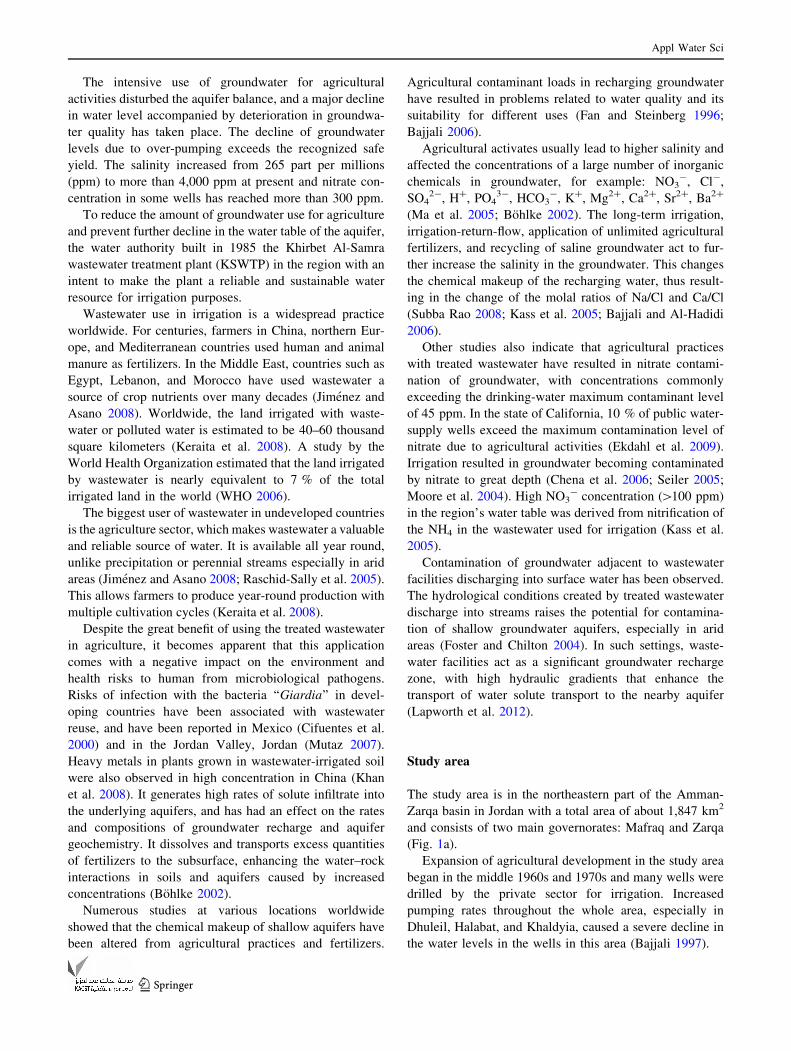
The study area is in the northeastern part of the Amman-
Zarqa basin in Jordan with a total area of about 1,847 km2
and consists of two main governorates: Mafraq and Zarqa
(Fig. 1a).
Expansion of agricultural development in the study area
began in the middle 1960s and 1970s and many wells were
drilled by the private sector for irrigation. Increased
pumping rates throughout the whole area, especially in
Dhuleil, Halabat, and Khaldyia, caused a severe decline in
the water levels in the wells in this area (Bajjali 1997).
Appl Water Sci
123
The KSWTP was constructed along the Zarqa River in
1985 for treating domestic wastewater from the cities of
Amman, Zarqa, and Russeifa (Fig. 1c). From 1985 to 2008
the capacity of the plant increased from 68,000 to
267,000 m3/day (RSS 2012). The plant treats around 72 %
of all the wastewater in the country and currently the treated
wastewater is used for agriculture. On its course to the Jordan
Rift Valley (JRV), the reclaimed water is mixed with surface
runoff from wadis (dry valleys) before it is stored in King
Talal Dam (KTD), and spills out downstream until it reaches
the JRV, where it is mainly used for irrigation (WAJ 2004).
Wastewater use for agricultural irrigation in the country
is cost effective since the study area has limited water
resources. It provides low cost water resources, increases
crop production, reduces the dependence upon groundwa-
ter, saves the use of synthetic fertilizers (treated wastewater
is rich in plant nutrients), and increases employment
opportunities in the rural population.
Two small dams, Khaldyia and Al Luhfi, were con-
structed in 1985 to store the water from rainy seasons and
are used locally for agricultural purposes and for watering
livestock (Fig. 1a).
The study area is highly faulted and these fault systems
can facilitate rapid infiltration of the return flow by acting as
channels from the surface causing groundwater contami-
nation (Benson 1995). Wells that were drilled along a fault
system to tap the highest permeable area of the aquifer, are
very likely to be affected by agricultural activities.
This study focuses on the conditions that brought the
groundwater system to its current state, causing both the
quality and the quantity of water to be affected. Three
issues related to the groundwater upstream and downstream
of KSWTP have been examined in this study: (1) fluctua-
tion of the groundwater levels (2) salinity distribution in
groundwater and its source (3) and the mechanism of
recharge using the environmental isotopes.
Fig. 1 Site location
Appl Water Sci
123

Geology and hydrogeology of the study area
The study area is part of the Amman-Zarqa basin in
northern Jordan. The geological formations in the area are
mainly Cretaceous carbonate rocks with thick flows of
Cenozoic basalt and Holocene alluvial deposits along the
flow of the Zarqa River (Fig. 2).
The limestone and the overlying basalt are hydraulically
connected and form one aquifer unit. The direction of the
regional flow over the whole basin is from the northeast
highlands of the Al Druz Mountains in Syria, southwest
towards the area downstream of the KSWTP. There is a
major NW–SE trending fault system in the area, and the
basalt filled a major synclinal structure having a pitch to
ESE. Both the fault system and the syncline in the area
influence the permeability and groundwater recharge of the
aquifer system.
Fluctuations in ground-water levels
Water levels in aquifers are a dynamic balance between
recharge, storage, and discharge. If recharge exceeds
discharge, the volume of water in storage will increase and
water levels will rise; if discharge exceeds recharge, the vol-
ume of water in storage will decrease and water levels will
fall. Therefore, water-level measurements provide under-
standing into the physical properties that control aquifer
recharge, storage, and discharge. These properties affect the
timing and intensity of responses to hydrologic stresses such
as precipitation, infiltration or pumping. Long term fluctua-
tions of water levels, over periods of decades, can provide
insight into the effects of climate and man-made activities
such as pumping, irrigation, and changes in land use. Short
term fluctuations can also occur in response to rainfall,
pumping, barometric-pressure variations, or other phenomena
(Healy and Cook 2002). The water levels in the observation
wells in the study area show a completely different pattern
upstream versus downstream of the KSWTP. Over the last
40 years the wells upstream of the plant, especially in Dhuleil-
Halabat-Khaldyia area, show steady long-term declines with
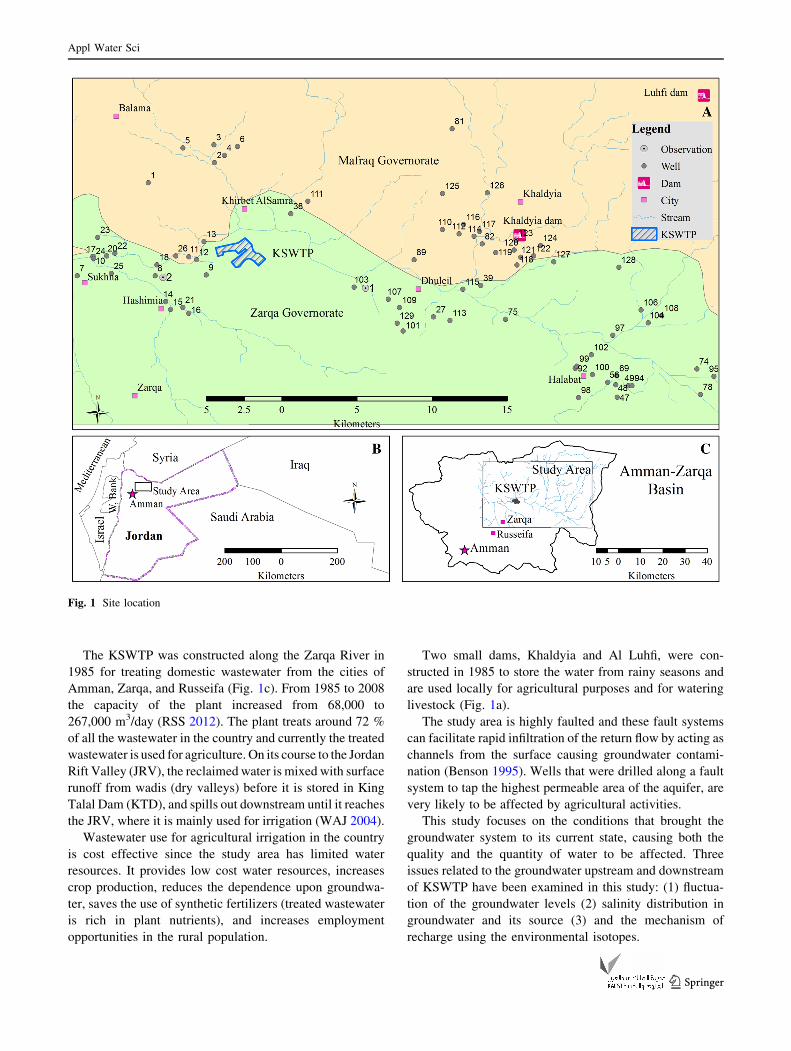
or without seasonal variations. The greatest declines in the
aquifers were in the south of the study area and upstream of
the KSWTP where groundwater level in observation well 1
dropped as much as 43.17 m in 44 years (Fig. 3). The decline
was almost 1 m per year between 1968 and 2012.
Fig. 2 Simplified geological map
Appl Water Sci
123
The sharp decline in the water level can be attributed
mainly to anthropogenic activities and slight changes in
climate (Bajjali 1997). Groundwater upstream of KSWTP
was subject to high extraction for irrigation purposes, and
greatly exceeds the recharge rate from precipitation, which
caused the groundwater level to decline sharply without
replenishment. The amount of rain in the country has
decreased for several decades and the general trend of the
data in Mafraq station in the study area indicates that the
amount of rain has been decreasing there since 1988 (Ba-
jjali 2012).
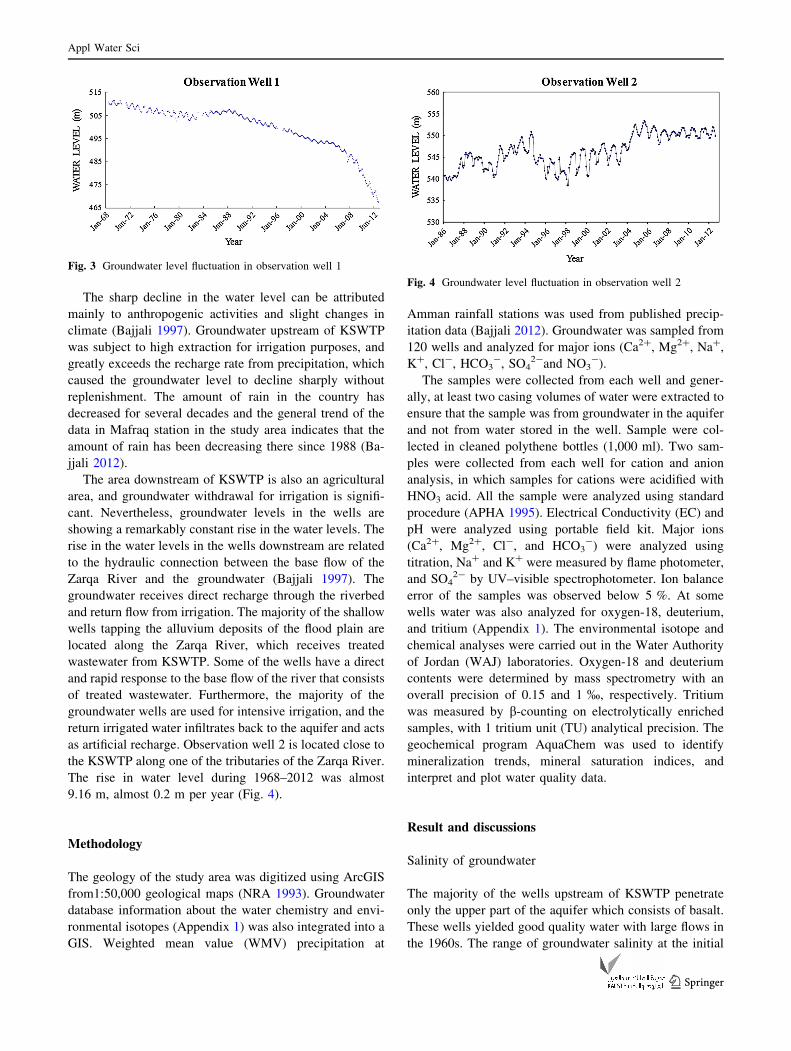
The area downstream of KSWTP is also an agricultural
area, and groundwater withdrawal for irrigation is signifi-
cant. Nevertheless, groundwater levels in the wells are
showing a remarkably constant rise in the water levels. The
rise in the water levels in the wells downstream are related
to the hydraulic connection between the base flow of the
Zarqa River and the groundwater (Bajjali 1997). The
groundwater receives direct recharge through the riverbed
and return flow from irrigation. The majority of the shallow
wells tapping the alluvium deposits of the flood plain are
located along the Zarqa River, which receives treated
wastewater from KSWTP. Some of the wells have a direct
and rapid response to the base flow of the river that consists
of treated wastewater. Furthermore, the majority of the
groundwater wells are used for intensive irrigation, and the
return irrigated water infiltrates back to the aquifer and acts
as artificial recharge. Observation well 2 is located close to
the KSWTP along one of the tributaries of the Zarqa River.
The rise in water level during 1968–2012 was almost
9.16 m, almost 0.2 m per year (Fig. 4).
Methodology
The geology of the study area was digitized using ArcGIS
from1:50,000 geological maps (NRA 1993). Groundwater
database information about the water chemistry and envi-
ronmental isotopes (Appendix 1) was also integrated into a
GIS. Weighted mean value (WMV) precipitation at
Amman rainfall stations was used from published precip-
itation data (Bajjali 2012). Groundwater was sampled from
120 wells and analyzed for major ions (Ca2?, Mg2?, Na?,
K?, Cl-, HCO3-, SO4
2-and NO3-).
The samples were collected from each well and gener-
ally, at least two casing volumes of water were extracted to
ensure that the sample was from groundwater in the aquifer
and not from water stored in the well. Sample were col-
lected in cleaned polythene bottles (1,000 ml). Two sam-
ples were collected from each well for cation and anion
analysis, in which samples for cations were acidified with
HNO3 acid. All the sample were analyzed using standard
procedure (APHA 1995). Electrical Conductivity (EC) and
pH were analyzed using portable field kit. Major ions
(Ca2?, Mg2?, Cl-, and HCO3-) were analyzed using
titration, Na? and K? were measured by flame photometer,
and SO42- by UV–visible spectrophotometer. Ion balance
error of the samples was observed below 5 %. At some
wells water was also analyzed for oxygen-18, deuterium,
and tritium (Appendix 1). The environmental isotope and
chemical analyses were carried out in the Water Authority
of Jordan (WAJ) laboratories. Oxygen-18 and deuterium
contents were determined by mass spectrometry with an
overall precision of 0.15 and 1 %, respectively. Tritium
was measured by b-counting on electrolytically enriched
samples, with 1 tritium unit (TU) analytical precision. The
geochemical program AquaChem was used to identify
mineralization trends, mineral saturation indices, and
interpret and plot water quality data.
Result and discussions
Salinity of groundwater
The majority of the wells upstream of KSWTP penetrate
only the upper part of the aquifer which consists of basalt.
These wells yielded good quality water with large flows in
the 1960s. The range of groundwater salinity at the initial
Fig. 3 Groundwater level fluctuation in observation well 1
Fig. 4 Groundwater level fluctuation in observation well 2
Appl Water Sci
123
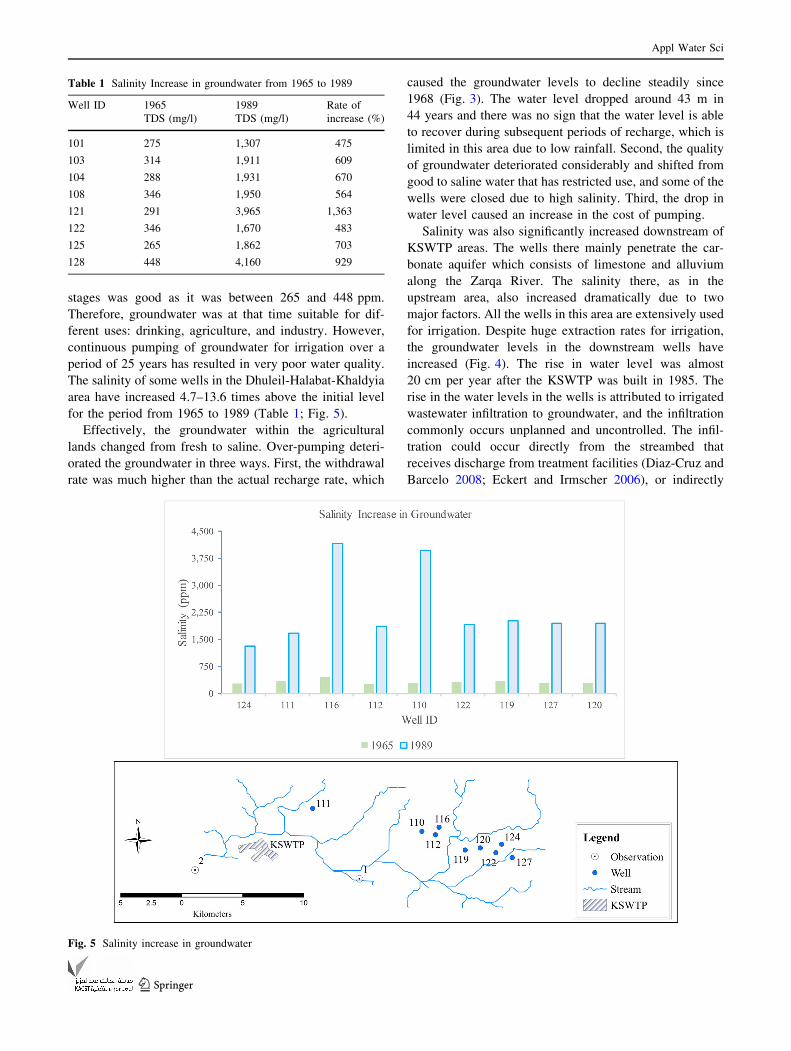
stages was good as it was between 265 and 448 ppm.
Therefore, groundwater was at that time suitable for dif-
ferent uses: drinking, agriculture, and industry. However,
continuous pumping of groundwater for irrigation over a
period of 25 years has resulted in very poor water quality.
The salinity of some wells in the Dhuleil-Halabat-Khaldyia
area have increased 4.7–13.6 times above the initial level
for the period from 1965 to 1989 (Table 1; Fig. 5).
Effectively, the groundwater within the agricultural
lands changed from fresh to saline. Over-pumping deteri-
orated the groundwater in three ways. First, the withdrawal
rate was much higher than the actual recharge rate, which
caused the groundwater levels to decline steadily since
1968 (Fig. 3). The water level dropped around 43 m in
44 years and there was no sign that the water level is able
to recover during subsequent periods of recharge, which is
limited in this area due to low rainfall. Second, the quality
of groundwater deteriorated considerably and shifted from
good to saline water that has restricted use, and some of the
wells were closed due to high salinity. Third, the drop in
water level caused an increase in the cost of pumping.
Salinity was also significantly increased downstream of
KSWTP areas. The wells there mainly penetrate the car-
bonate aquifer which consists of limestone and alluvium
along the Zarqa River. The salinity there, as in the
upstream area, also increased dramatically due to two
major factors. All the wells in this area are extensively used
for irrigation. Despite huge extraction rates for irrigation,
the groundwater levels in the downstream wells have
increased (Fig. 4). The rise in water level was almost
20 cm per year after the KSWTP was built in 1985. The
rise in the water levels in the wells is attributed to irrigated
wastewater infiltration to groundwater, and the infiltration
commonly occurs unplanned and uncontrolled. The infil-
tration could occur directly from the streambed that
receives discharge from treatment facilities (Diaz-Cruz and
Barcelo 2008; Eckert and Irmscher 2006), or indirectly
Table 1 Salinity Increase in groundwater from 1965 to 1989
Well ID 1965 1989 Rate of
increase (%)TDS (mg/l) TDS (mg/l)
101 275 1,307 475
103 314 1,911 609
104 288 1,931 670
108 346 1,950 564
121 291 3,965 1,363
122 346 1,670 483
125 265 1,862 703
128 448 4,160 929
Fig. 5 Salinity increase in groundwater
Appl Water Sci
123

from excess agricultural irrigation in downstream riparian
areas (BGS et al. 1998). A wide range of salinity between
186 and 9,000 ppm was recorded in the downstream
groundwater wells. The low salinity value represents a
shallow hand dug pit made of bricks and coated with
cement to collect the rainwater and surface runoff during
rainy season and is used for livestock and crop growing.
The hand dug pit is located in close proximity to KSWTP,
but not hydraulically connected with the water table of the
shallow aquifer. Shallow well No. 12 penetrates the allu-
vium formation of the floodplain of the Zarqa River 1.5 km
downstream of KSWTP, and recorded a high salinity of
9,067 ppm. This well is located only 25 m from the
channel of the river. Since all wells are used for intensive
irrigation, the return irrigated water infiltrated back to the
aquifer and acted as an artificial recharge, as in the area
upstream of KSWTP.
Groundwater salinity and faulting
The study area is highly fractured (Fig. 2), and the struc-
ture has been tested to see if it has an influence on the
quality of the groundwater. This phenomenon has been
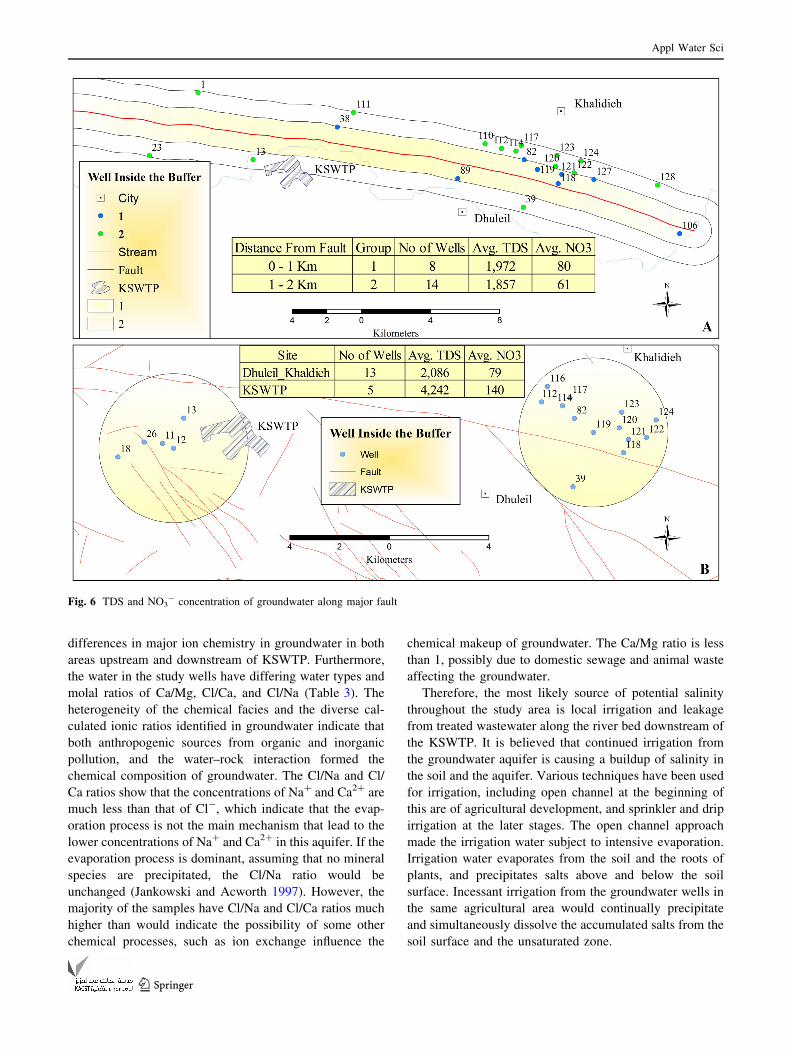
tested at two locations. The first location is along a main
fault running in close proximity to the Zarqa River between
Dhuleil, Khaldyia, and KSWTP (Fig. 6a). 22 wells are
located within a 2 km buffer zone, where the wells inside
the buffer are classified into two groups: group 1 are the
wells located within 1 km from the fault (blue), while
group 2 are the wells located between 1 and 2 km from the
fault (green).
The average total dissolved solids (TDS) and NO3-
concentrations in group 1 are higher than in group 2. The
TDS and NO3- in group 1 are 6.19 and 34.4 1 % higher
respectively than the concentrations in group 2 (Table 2).
This may indicate that the farther the wells are from the
fault, the less effect there is on return flow. At the second
location, a group of wells in a faulty area within 3 km from
KSWTP (downstream) were compared with a group of
wells located in an area with no faults within 3 km of the
agricultural centers of Dhuleil and Khaldyia (upstream)
(Fig. 6b). The TDS and NO3- of the wells in the second
location demonstrated higher concentration downstream of
KSWTP than the upstream area (Table 2).
A statistical ‘‘t test’’ is used to test for a significant
difference between TDS and NO3- in location 1 and
location 2. The t test analysis assumes that the variances of
both TDS and NO3- are unequal and a 95 % significant
level (a = 0.05) is adopted to run the test. The t test was
performed using a data analysis package in Microsoft
Excel. The result of the analysis shows that the two-tailed
p value in both locations is more than 0.05, yielding no
significant difference at the 5 % level (Table 2).
The entire region, both up- and down-stream of
KSWTP, is an active agricultural area. The upstream
region, however, relies on groundwater for irrigation, while
the downstream region relies on reclaimed water from
KSWTP. The irrigation mechanism in both regions allows
for return flow to the aquifer; deteriorating its quality. The
influence on the quality of the groundwater of using
reclaimed water for irrigation far exceeds the influence of
irrigation from groundwater. This is clear when we com-
pare the chemical makeup of the groundwater wells located
in close proximity to KSWTP. The water chemistry of
Well No. 108 upstream of the plant is different than Well
No. 13 that is located 767 m downstream of it. Well No.
108 recorded a TDS of 499 ppm and NO3- concentration
of 26.6 ppm, while Well No. 13 recorded a TDS of
3,510 ppm and NO3- concentration of 119 ppm.
It is obvious that we are dealing with a complex hydro-
logical scenario since the local fault system, as well as the
irrigation practices of the region, allow irrigation water to
infiltrate through the unsaturated zone at different rate.
Source of salinity in groundwater
There are several ways in which the salinity of ground-
water can be increased. One possibility is cyclic salting.
This is a term applied to salt input to the groundwater from
precipitation. However the range of TDS in precipitation in
10 rainfall stations throughout the country ranged between
38 and 210 ppm (Bajjali 2012). For this reason, precipi-
tation in the region could not be the source of the high salt
levels in the local groundwater. A second possibility for the
source of salts could be rock weathering; however the
bedrock is basalt and limestone, neither of which could
contribute significantly to salt accumulation in the top soil.
The third possibility to rising salt levels is invasion of
saline water from the deeper aquifer. A previous study was
conducted to evaluate the salinity build up upstream of
KSWTP in specific wells in the Dhuleil-Halabat-Khaldyia
area, and concluded that an invasion of saline water from
the deep layer to the upper aquifer was caused by over-
pumping (Nitsch 1990). The over-pumping from the upper
aquifer lowered the water table below the piozemetric head
of the lower aquifer, which caused the deeper saline water
aquifer to invade the upper aquifer and raise salinity.
Invasion from the deeper aquifer in this particular case is
unlikely for the following reason: if saline water moves
from the lower saline aquifer to the upper fresh aquifer due
to the difference in hydraulic head caused by heavy
pumping, the salinity concentration and chemical compo-
sition of the water in the productive wells should be more
or less homogeneous. However, this is not observed in the
chemical makeup of the area’s groundwater, as seen in the
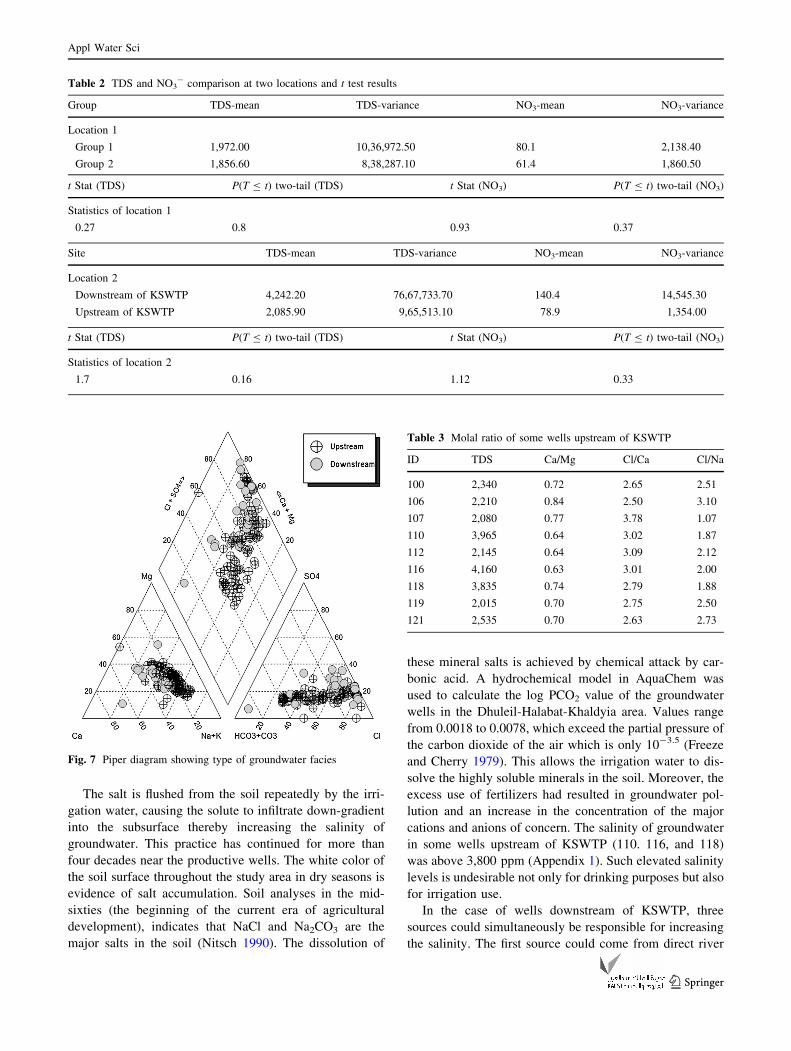
hydrochemical facies. The piper diagram (Fig. 7) shows
Appl Water Sci
123
differences in major ion chemistry in groundwater in both
areas upstream and downstream of KSWTP. Furthermore,
the water in the study wells have differing water types and
molal ratios of Ca/Mg, Cl/Ca, and Cl/Na (Table 3). The
heterogeneity of the chemical facies and the diverse cal-
culated ionic ratios identified in groundwater indicate that
both anthropogenic sources from organic and inorganic
pollution, and the water–rock interaction formed the
chemical composition of groundwater. The Cl/Na and Cl/
Ca ratios show that the concentrations of Na? and Ca2? are
much less than that of Cl-, which indicate that the evap-
oration process is not the main mechanism that lead to the
lower concentrations of Na? and Ca2? in this aquifer. If the
evaporation process is dominant, assuming that no mineral
species are precipitated, the Cl/Na ratio would be
unchanged (Jankowski and Acworth 1997). However, the
majority of the samples have Cl/Na and Cl/Ca ratios much
higher than would indicate the possibility of some other
chemical processes, such as ion exchange influence the
chemical makeup of groundwater. The Ca/Mg ratio is less
than 1, possibly due to domestic sewage and animal waste
affecting the groundwater.
Therefore, the most likely source of potential salinity
throughout the study area is local irrigation and leakage
from treated wastewater along the river bed downstream of
the KSWTP. It is believed that continued irrigation from
the groundwater aquifer is causing a buildup of salinity in
the soil and the aquifer. Various techniques have been used
for irrigation, including open channel at the beginning of
this are of agricultural development, and sprinkler and drip
irrigation at the later stages. The open channel approach
made the irrigation water subject to intensive evaporation.
Irrigation water evaporates from the soil and the roots of
plants, and precipitates salts above and below the soil
surface. Incessant irrigation from the groundwater wells in
the same agricultural area would continually precipitate
and simultaneously dissolve the accumulated salts from the
soil surface and the unsaturated zone.
Fig. 6 TDS and NO3- concentration of groundwater along major fault
Appl Water Sci
123
The salt is flushed from the soil repeatedly by the irri-
gation water, causing the solute to infiltrate down-gradient
into the subsurface thereby increasing the salinity of
groundwater. This practice has continued for more than
four decades near the productive wells. The white color of
the soil surface throughout the study area in dry seasons is
evidence of salt accumulation. Soil analyses in the mid-
sixties (the beginning of the current era of agricultural
development), indicates that NaCl and Na2CO3 are the
major salts in the soil (Nitsch 1990). The dissolution of
these mineral salts is achieved by chemical attack by car-
bonic acid. A hydrochemical model in AquaChem was
used to calculate the log PCO2 value of the groundwater
wells in the Dhuleil-Halabat-Khaldyia area. Values range
from 0.0018 to 0.0078, which exceed the partial pressure of
the carbon dioxide of the air which is only 10-3.5 (Freeze
and Cherry 1979). This allows the irrigation water to dis-
solve the highly soluble minerals in the soil. Moreover, the
excess use of fertilizers had resulted in groundwater pol-
lution and an increase in the concentration of the major
cations and anions of concern. The salinity of groundwater
in some wells upstream of KSWTP (110. 116, and 118)
was above 3,800 ppm (Appendix 1). Such elevated salinity
levels is undesirable not only for drinking purposes but also
for irrigation use.
In the case of wells downstream of KSWTP, three
sources could simultaneously be responsible for increasing
the salinity. The first source could come from direct river
Fig. 7 Piper diagram showing type of groundwater facies
Table 2 TDS and NO3- comparison at two locations and t test results
Group TDS-mean TDS-variance NO3-mean NO3-variance
Location 1
Group 1 1,972.00 10,36,972.50 80.1 2,138.40
Group 2 1,856.60 8,38,287.10 61.4 1,860.50
t Stat (TDS) P(T B t) two-tail (TDS) t Stat (NO3) P(T B t) two-tail (NO3)
Statistics of location 1
0.27 0.8 0.93 0.37
Site TDS-mean TDS-variance NO3-mean NO3-variance
Location 2
Downstream of KSWTP 4,242.20 76,67,733.70 140.4 14,545.30
Upstream of KSWTP 2,085.90 9,65,513.10 78.9 1,354.00
t Stat (TDS) P(T B t) two-tail (TDS) t Stat (NO3) P(T B t) two-tail (NO3)
Statistics of location 2
1.7 0.16 1.12 0.33
Table 3 Molal ratio of some wells upstream of KSWTP
ID TDS Ca/Mg Cl/Ca Cl/Na
100 2,340 0.72 2.65 2.51
106 2,210 0.84 2.50 3.10
107 2,080 0.77 3.78 1.07
110 3,965 0.64 3.02 1.87
112 2,145 0.64 3.09 2.12
116 4,160 0.63 3.01 2.00
118 3,835 0.74 2.79 1.88
119 2,015 0.70 2.75 2.50
121 2,535 0.70 2.63 2.73
Appl Water Sci
123
loss by leakage through the riverbed. This leakage is
dependent on stream flow and properties of the riverbed
sediment. The stream flow is estimated to be 267,000 m3/
day and the leakage was recorded through the rise in the
water table in observation well 2, which is located within
1 km downstream from KSWTP. The water level rose
7.72 m between 2000 and 2005, averaging 1.5 m per year
(Fig. 4). The hydrogeological setting of the aquifer system
downstream of the KSWTP allows this infiltration to occur.
The upper part of the shallow aquifer consists of alluvium
which is highly permeable material. The second possible
source of salinity is the dissolution of the accumulated salts
in the soil by the irrigation water (similar to the situation
upstream of KSWTP). The third source is due to direct
evaporation from the water table for the wells tapping the
relatively shallow alluvium, its average depth around 10 m.
Concentrations of Cl-, SO42-, and Ca2? were highest
downstream of KSWTP compared with the concentrations
upstream in groundwater, the ratio is almost 3–4 times
higher. Various factors contribute to high sulfate, calcium,
and chloride levels downstream and upstream, including
mineral constituents of aquifers and irrigation return flow.
The difference in both regions is that the return flow
upstream consists of groundwater, while the downstream
return flow is from reclaimed water (Table 4). This high
variation in these ions indicates that the reclaimed water
used for irrigation downstream has higher concentrations
than the groundwater upstream. The variation in Cl-,
SO42-, and Ca2? upstream and downstream of KSWTP
indicates an irrigation return flow contribution. This is seen
from the high concentration of NO3- (Appendix 1).
Groundwater contamination
Nitrate is another chemical parameter in addition to salinity
that was found in high concentrations in some wells
throughout the study area. Nitrate is the most available
indicator of organic (sewage and manure) and inorganic
(artificial fertilizer) sources of contamination. Nitrate is
easily dissolved in groundwater, very mobile in subsurface
flows and spreads very quickly through the fractured sub-
surface water-bearing formation.
The nitrate concentration in groundwater in the entire
study area had increased beyond the level of natural
abundance of nitrate in groundwater, less than 5 ppm as
adopted for this study. Nitrate levels in groundwater wells
upstream and downstream of KSWTP have increased by
17.3 and 32 % respectively above the World Health
Organization’s (WHO) standard of 45 ppm for drinking
purposes (WHO 2011).
Chemical fertilizers, particularly urea (46 % nitrogen
content), are used extensively and without control in the
agricultural area to increase soil fertility and crop yields.
However, the most noticeable increase in nitrate is
observed in wells downstream of KSWTP. Well No. 12
recorded a nitrate concentration of 324 ppm. This high
concentration is due to the sewage effluent of KSWTP,
which is high in ammonium (NH4) concentration (Saqqar
et al. 1989). Through the process of nitrification the NH4 is
converted to NO3- by oxidation. This process normally
occurs above the water table, generally in the soil zone
where organic matter and oxygen are abundant (Freeze and
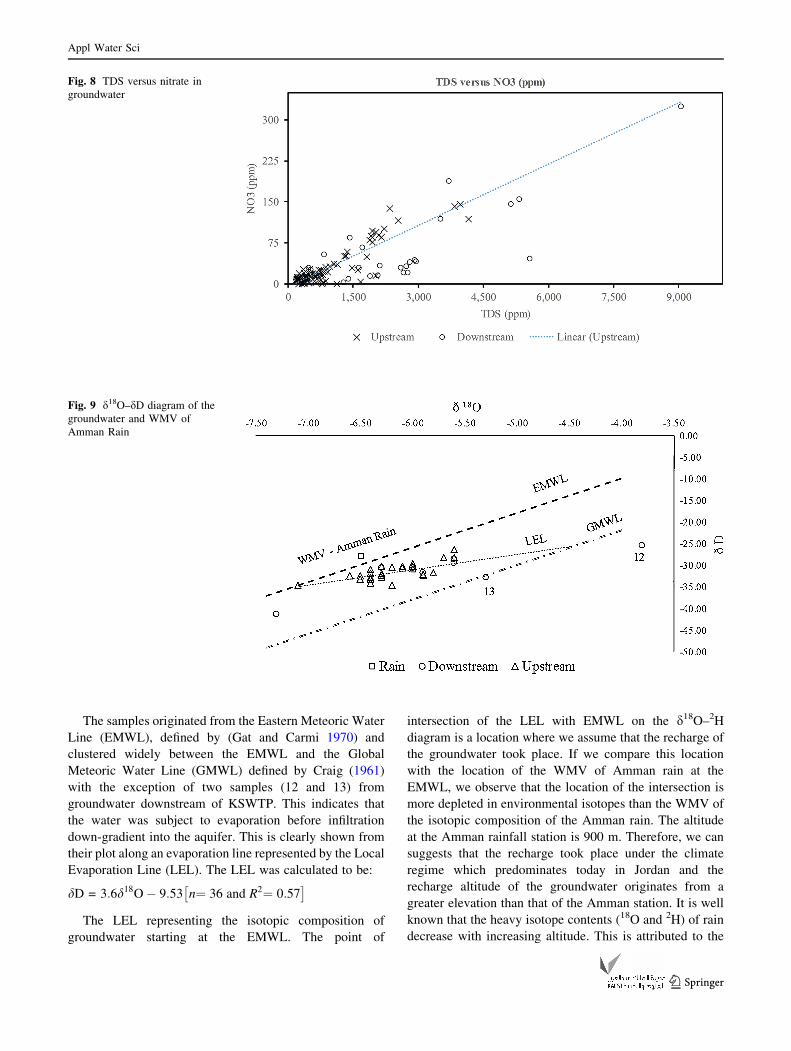
Cherry 1979). Figure 8 shows that NO3- concentration is
highly correlated with the TDS of the groundwater
(R2 = 0.89).
The high association between TDS and NO3- is strong
evidence that the source of high salinity originates from the
surface rather than from the subsurface due to the absence
of nitrate in non-developed groundwater resources.
Environmental stable and radioactive isotopes
Environmental isotopes techniques using the 18O, 2H, and3H have become an integral part of geochemical studies in
groundwater projects. Isotopes provide information that
complements chemical data, giving insights into geo-
chemical pathways, and processes in groundwater resource
and groundwater quality studies. It was used extensively to
study the mechanism of infiltration of water into the sub-
surface, recharge origin, evaporation, mixing, and resi-
dence time of recharge (Mathieu and Bariac 1996; Kass
et al. 2005; Darling and Bath 1988; Bohlke 2002; Bajjali
2008).
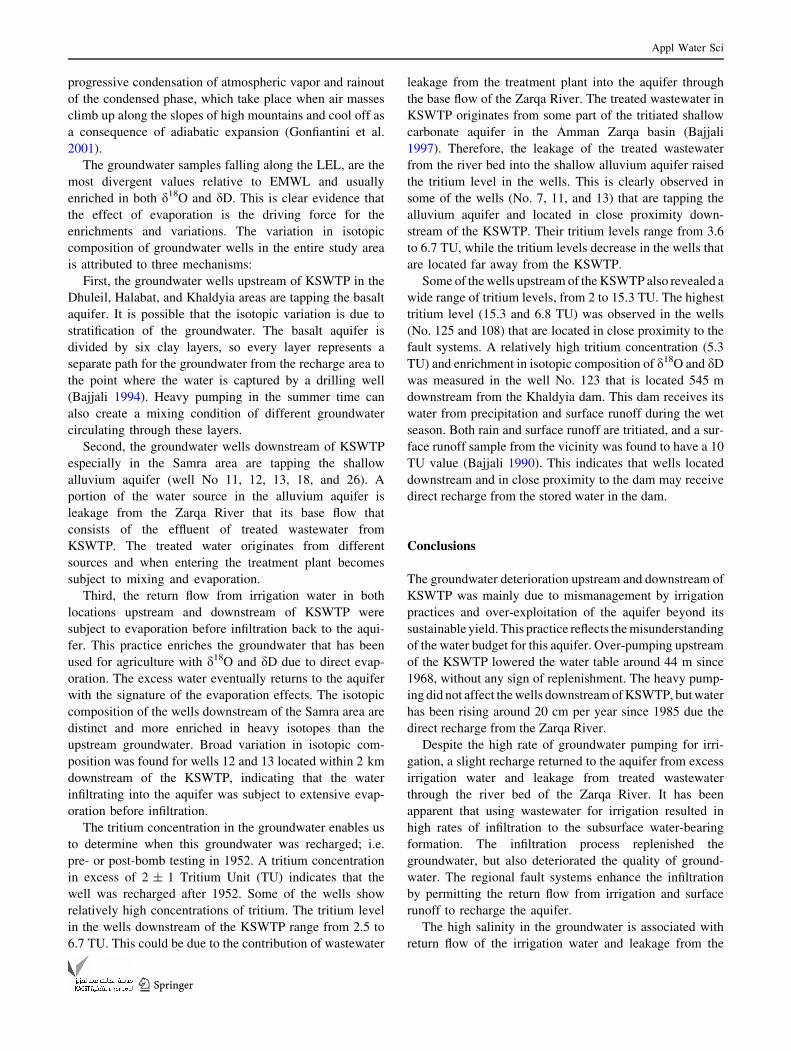
The stable isotope data for all groundwater in conjunc-
tion with weighted mean value (WMV) of the rain in the
Amman station for the period of 1987–2005 (Bajjali 2012)
are plotted on a d18O–2H diagram (Fig. 9). The Amman
rainfall station is located at 900 m above sea level east of
the Mediterranean Sea. Due to the world-wide variation in
isotopic composition of precipitation (Dansgaard 1964;
Yurtsever and Gat 1981), the long-term WMV was chosen
to monitor the isotopic signature of the rain, so it could be
used as a guideline to evaluate groundwater recharge pro-
cesses and the origin of groundwater in the study area.
Figure 9, shows that the groundwater samples reveal a
wide variation in stable isotope content, and a close look at
the isotopic composition of all the data indicates that there
is at least a 3.5 and 15.8 % range in d18O and dD
respectively.
Table 4 Ratio of some parameters up-downstream of KSWTP
Location Ca SO4 Cl
Upstream 62.60 107.20 294.09
Downstream 265.34 465.13 951.31
Ratio 4.24 4.34 3.23
Appl Water Sci
123
The samples originated from the Eastern Meteoric Water
Line (EMWL), defined by (Gat and Carmi 1970) and
clustered widely between the EMWL and the Global
Meteoric Water Line (GMWL) defined by Craig (1961)
with the exception of two samples (12 and 13) from
groundwater downstream of KSWTP. This indicates that
the water was subject to evaporation before infiltration
down-gradient into the aquifer. This is clearly shown from
their plot along an evaporation line represented by the Local
Evaporation Line (LEL). The LEL was calculated to be:
dD = 3:6d18O� 9:53 n¼ 36 and R2¼ 0:57� �
The LEL representing the isotopic composition of
groundwater starting at the EMWL. The point of
intersection of the LEL with EMWL on the d18O–2H
diagram is a location where we assume that the recharge of
the groundwater took place. If we compare this location
with the location of the WMV of Amman rain at the
EMWL, we observe that the location of the intersection is
more depleted in environmental isotopes than the WMV of
the isotopic composition of the Amman rain. The altitude
at the Amman rainfall station is 900 m. Therefore, we can
suggests that the recharge took place under the climate
regime which predominates today in Jordan and the
recharge altitude of the groundwater originates from a
greater elevation than that of the Amman station. It is well
known that the heavy isotope contents (18O and 2H) of rain
decrease with increasing altitude. This is attributed to the
Fig. 8 TDS versus nitrate in
groundwater
Fig. 9 d18O–dD diagram of the
groundwater and WMV of
Amman Rain
Appl Water Sci
123
progressive condensation of atmospheric vapor and rainout
of the condensed phase, which take place when air masses
climb up along the slopes of high mountains and cool off as
a consequence of adiabatic expansion (Gonfiantini et al.
2001).
The groundwater samples falling along the LEL, are the
most divergent values relative to EMWL and usually
enriched in both d18O and dD. This is clear evidence that
the effect of evaporation is the driving force for the
enrichments and variations. The variation in isotopic
composition of groundwater wells in the entire study area
is attributed to three mechanisms:
First, the groundwater wells upstream of KSWTP in the
Dhuleil, Halabat, and Khaldyia areas are tapping the basalt
aquifer. It is possible that the isotopic variation is due to
stratification of the groundwater. The basalt aquifer is
divided by six clay layers, so every layer represents a
separate path for the groundwater from the recharge area to
the point where the water is captured by a drilling well
(Bajjali 1994). Heavy pumping in the summer time can
also create a mixing condition of different groundwater
circulating through these layers.
Second, the groundwater wells downstream of KSWTP
especially in the Samra area are tapping the shallow
alluvium aquifer (well No 11, 12, 13, 18, and 26). A
portion of the water source in the alluvium aquifer is
leakage from the Zarqa River that its base flow that
consists of the effluent of treated wastewater from
KSWTP. The treated water originates from different
sources and when entering the treatment plant becomes
subject to mixing and evaporation.
Third, the return flow from irrigation water in both
locations upstream and downstream of KSWTP were
subject to evaporation before infiltration back to the aqui-
fer. This practice enriches the groundwater that has been
used for agriculture with d18O and dD due to direct evap-
oration. The excess water eventually returns to the aquifer
with the signature of the evaporation effects. The isotopic
composition of the wells downstream of the Samra area are
distinct and more enriched in heavy isotopes than the
upstream groundwater. Broad variation in isotopic com-
position was found for wells 12 and 13 located within 2 km
downstream of the KSWTP, indicating that the water
infiltrating into the aquifer was subject to extensive evap-
oration before infiltration.
The tritium concentration in the groundwater enables us
to determine when this groundwater was recharged; i.e.
pre- or post-bomb testing in 1952. A tritium concentration
in excess of 2 ± 1 Tritium Unit (TU) indicates that the
well was recharged after 1952. Some of the wells show
relatively high concentrations of tritium. The tritium level
in the wells downstream of the KSWTP range from 2.5 to
6.7 TU. This could be due to the contribution of wastewater
leakage from the treatment plant into the aquifer through
the base flow of the Zarqa River. The treated wastewater in
KSWTP originates from some part of the tritiated shallow
carbonate aquifer in the Amman Zarqa basin (Bajjali
1997). Therefore, the leakage of the treated wastewater
from the river bed into the shallow alluvium aquifer raised
the tritium level in the wells. This is clearly observed in
some of the wells (No. 7, 11, and 13) that are tapping the
alluvium aquifer and located in close proximity down-
stream of the KSWTP. Their tritium levels range from 3.6
to 6.7 TU, while the tritium levels decrease in the wells that
are located far away from the KSWTP.
Some of the wells upstream of the KSWTP also revealed a
wide range of tritium levels, from 2 to 15.3 TU. The highest
tritium level (15.3 and 6.8 TU) was observed in the wells
(No. 125 and 108) that are located in close proximity to the
fault systems. A relatively high tritium concentration (5.3
TU) and enrichment in isotopic composition of d18O and dD
was measured in the well No. 123 that is located 545 m
downstream from the Khaldyia dam. This dam receives its
water from precipitation and surface runoff during the wet
season. Both rain and surface runoff are tritiated, and a sur-
face runoff sample from the vicinity was found to have a 10
TU value (Bajjali 1990). This indicates that wells located
downstream and in close proximity to the dam may receive
direct recharge from the stored water in the dam.
Conclusions
The groundwater deterioration upstream and downstream of
KSWTP was mainly due to mismanagement by irrigation
practices and over-exploitation of the aquifer beyond its
sustainable yield. This practice reflects the misunderstanding
of the water budget for this aquifer. Over-pumping upstream
of the KSWTP lowered the water table around 44 m since
1968, without any sign of replenishment. The heavy pump-
ing did not affect the wells downstream of KSWTP, but water
has been rising around 20 cm per year since 1985 due the
direct recharge from the Zarqa River.
Despite the high rate of groundwater pumping for irri-
gation, a slight recharge returned to the aquifer from excess
irrigation water and leakage from treated wastewater
through the river bed of the Zarqa River. It has been
apparent that using wastewater for irrigation resulted in
high rates of infiltration to the subsurface water-bearing
formation. The infiltration process replenished the
groundwater, but also deteriorated the quality of ground-
water. The regional fault systems enhance the infiltration
by permitting the return flow from irrigation and surface
runoff to recharge the aquifer.
The high salinity in the groundwater is associated with
return flow of the irrigation water and leakage from the
Appl Water Sci
123
treated wastewater of KSWTP along the Zarqa river bed.
The high nitrate concentration in groundwater was attrib-
uted to organic and inorganic origin. Organic and inorganic
fertilizers are heavily used in agricultural areas to improve
fertility and crop yield, but easily leech into the subsurface
via run off and infiltration. The chemical fertilizers dis-
solved in the irrigation water usually ended up in the
aquifer and this resulted in a major increase in cations and
anions in the water chemistry. For the majority of
groundwater wells, the quality shifted from fresh water
(salinity less than 500 ppm) to brackish water (salinity
higher than 1,000 ppm). There is evidence that Khaldyia
dam serves as an artificial recharge during the winter sea-
son and replenishes downstream wells.
The stable isotopes (18O and 2H) show that the water is
of meteoric origin affected by the Mediterranean Sea air
moisture. The recharge area of the study area originates at
altitudes greater than 900 m. The wide scatter of the iso-
tope composition is due to an evaporation effect. The
radioactive tritium found in some wells is a sign of local
recharge. Since farmers applied both inorganic and organic
fertilizers for agricultural purposes, it would be helpful for
future study to apply the nitrogen isotope techniques to
trace the source of nitrate contamination.
Open Access This article is distributed under the terms of the
Creative Commons Attribution License which permits any use, dis-
tribution, and reproduction in any medium, provided the original
author(s) and the source are credited.
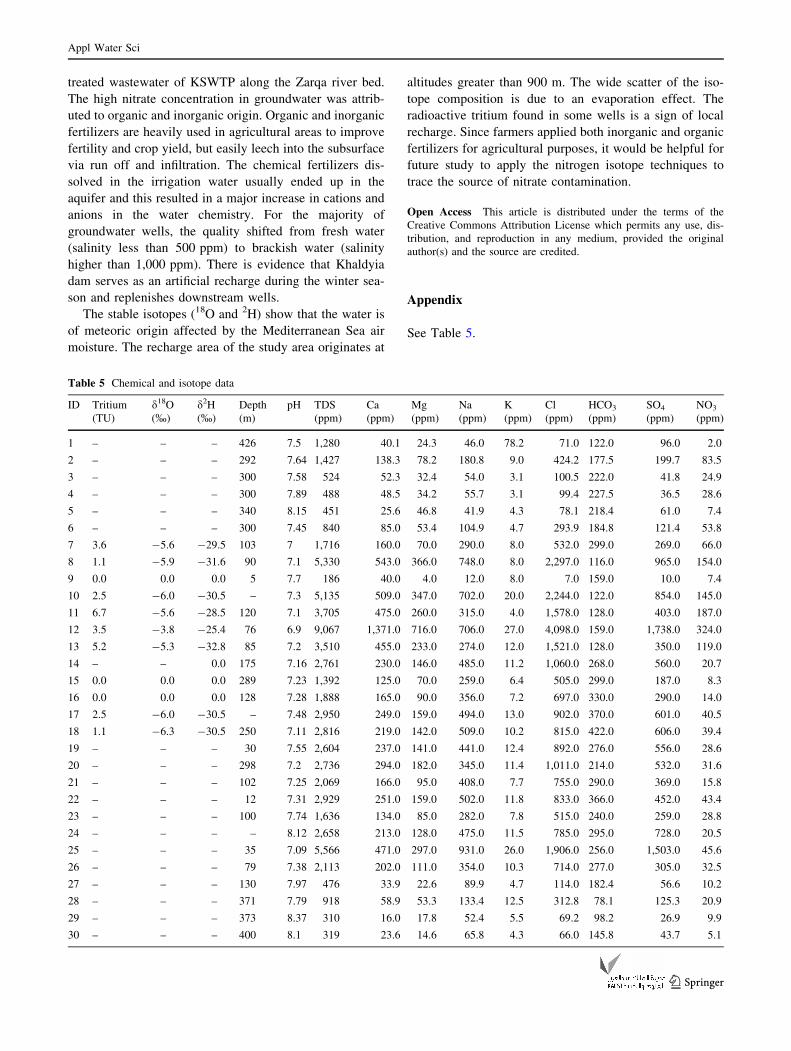
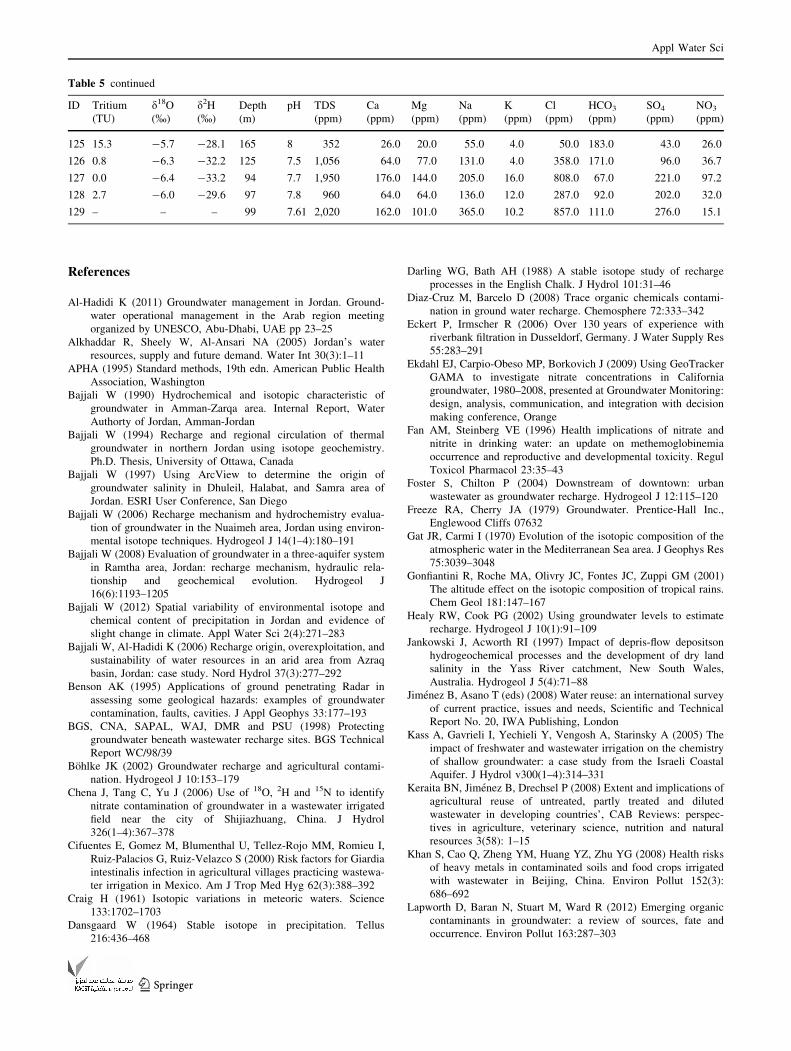
Appendix
See Table 5.
Table 5 Chemical and isotope data
ID Tritium
(TU)
d18O
(%)
d2H
(%)
Depth
(m)
pH TDS
(ppm)
Ca
(ppm)
Mg
(ppm)
Na
(ppm)
K
(ppm)
Cl
(ppm)
HCO3
(ppm)
SO4
(ppm)
NO3
(ppm)
1 – – – 426 7.5 1,280 40.1 24.3 46.0 78.2 71.0 122.0 96.0 2.0
2 – – – 292 7.64 1,427 138.3 78.2 180.8 9.0 424.2 177.5 199.7 83.5
3 – – – 300 7.58 524 52.3 32.4 54.0 3.1 100.5 222.0 41.8 24.9
4 – – – 300 7.89 488 48.5 34.2 55.7 3.1 99.4 227.5 36.5 28.6
5 – – – 340 8.15 451 25.6 46.8 41.9 4.3 78.1 218.4 61.0 7.4
6 – – – 300 7.45 840 85.0 53.4 104.9 4.7 293.9 184.8 121.4 53.8
7 3.6 -5.6 -29.5 103 7 1,716 160.0 70.0 290.0 8.0 532.0 299.0 269.0 66.0
8 1.1 -5.9 -31.6 90 7.1 5,330 543.0 366.0 748.0 8.0 2,297.0 116.0 965.0 154.0
9 0.0 0.0 0.0 5 7.7 186 40.0 4.0 12.0 8.0 7.0 159.0 10.0 7.4
10 2.5 -6.0 -30.5 – 7.3 5,135 509.0 347.0 702.0 20.0 2,244.0 122.0 854.0 145.0
11 6.7 -5.6 -28.5 120 7.1 3,705 475.0 260.0 315.0 4.0 1,578.0 128.0 403.0 187.0
12 3.5 -3.8 -25.4 76 6.9 9,067 1,371.0 716.0 706.0 27.0 4,098.0 159.0 1,738.0 324.0
13 5.2 -5.3 -32.8 85 7.2 3,510 455.0 233.0 274.0 12.0 1,521.0 128.0 350.0 119.0
14 – – 0.0 175 7.16 2,761 230.0 146.0 485.0 11.2 1,060.0 268.0 560.0 20.7
15 0.0 0.0 0.0 289 7.23 1,392 125.0 70.0 259.0 6.4 505.0 299.0 187.0 8.3
16 0.0 0.0 0.0 128 7.28 1,888 165.0 90.0 356.0 7.2 697.0 330.0 290.0 14.0
17 2.5 -6.0 -30.5 – 7.48 2,950 249.0 159.0 494.0 13.0 902.0 370.0 601.0 40.5
18 1.1 -6.3 -30.5 250 7.11 2,816 219.0 142.0 509.0 10.2 815.0 422.0 606.0 39.4
19 – – – 30 7.55 2,604 237.0 141.0 441.0 12.4 892.0 276.0 556.0 28.6
20 – – – 298 7.2 2,736 294.0 182.0 345.0 11.4 1,011.0 214.0 532.0 31.6
21 – – – 102 7.25 2,069 166.0 95.0 408.0 7.7 755.0 290.0 369.0 15.8
22 – – – 12 7.31 2,929 251.0 159.0 502.0 11.8 833.0 366.0 452.0 43.4
23 – – – 100 7.74 1,636 134.0 85.0 282.0 7.8 515.0 240.0 259.0 28.8
24 – – – – 8.12 2,658 213.0 128.0 475.0 11.5 785.0 295.0 728.0 20.5
25 – – – 35 7.09 5,566 471.0 297.0 931.0 26.0 1,906.0 256.0 1,503.0 45.6
26 – – – 79 7.38 2,113 202.0 111.0 354.0 10.3 714.0 277.0 305.0 32.5
27 – – – 130 7.97 476 33.9 22.6 89.9 4.7 114.0 182.4 56.6 10.2
28 – – – 371 7.79 918 58.9 53.3 133.4 12.5 312.8 78.1 125.3 20.9
29 – – – 373 8.37 310 16.0 17.8 52.4 5.5 69.2 98.2 26.9 9.9
30 – – – 400 8.1 319 23.6 14.6 65.8 4.3 66.0 145.8 43.7 5.1
Appl Water Sci
123
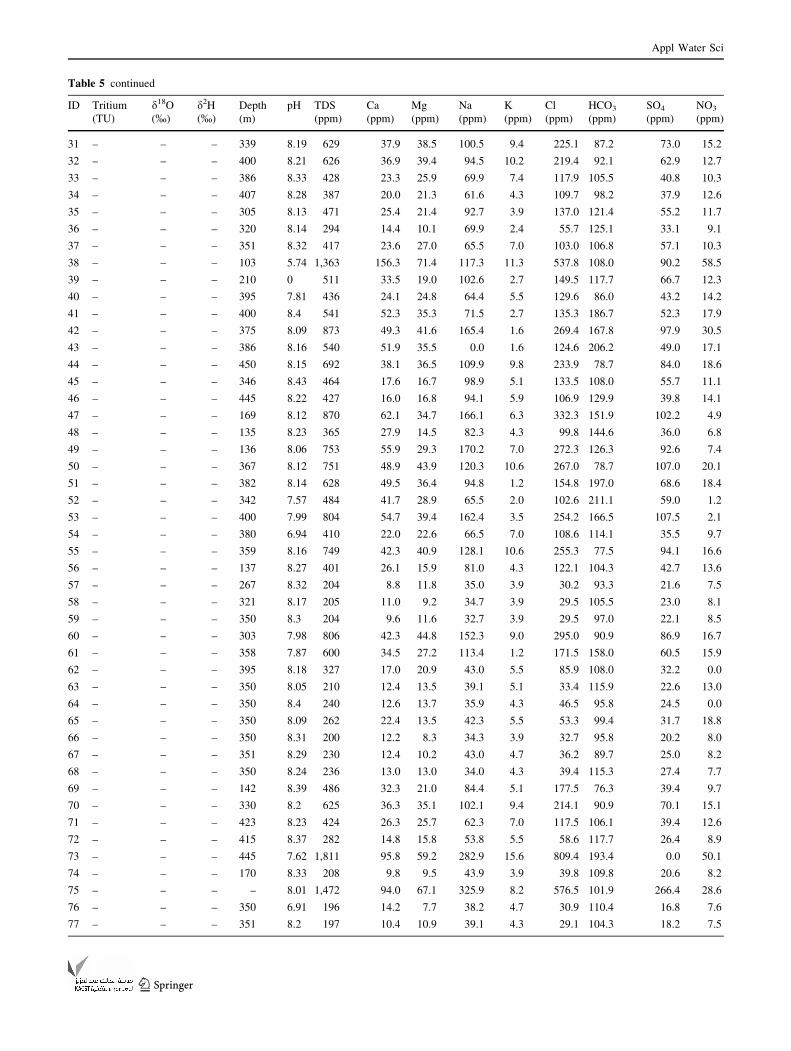
Table 5 continued
ID Tritium
(TU)
d18O
(%)
d2H
(%)
Depth
(m)
pH TDS
(ppm)
Ca
(ppm)
Mg
(ppm)
Na
(ppm)
K
(ppm)
Cl
(ppm)
HCO3
(ppm)
SO4
(ppm)
NO3
(ppm)
31 – – – 339 8.19 629 37.9 38.5 100.5 9.4 225.1 87.2 73.0 15.2
32 – – – 400 8.21 626 36.9 39.4 94.5 10.2 219.4 92.1 62.9 12.7
33 – – – 386 8.33 428 23.3 25.9 69.9 7.4 117.9 105.5 40.8 10.3
34 – – – 407 8.28 387 20.0 21.3 61.6 4.3 109.7 98.2 37.9 12.6
35 – – – 305 8.13 471 25.4 21.4 92.7 3.9 137.0 121.4 55.2 11.7
36 – – – 320 8.14 294 14.4 10.1 69.9 2.4 55.7 125.1 33.1 9.1
37 – – – 351 8.32 417 23.6 27.0 65.5 7.0 103.0 106.8 57.1 10.3
38 – – – 103 5.74 1,363 156.3 71.4 117.3 11.3 537.8 108.0 90.2 58.5
39 – – – 210 0 511 33.5 19.0 102.6 2.7 149.5 117.7 66.7 12.3
40 – – – 395 7.81 436 24.1 24.8 64.4 5.5 129.6 86.0 43.2 14.2
41 – – – 400 8.4 541 52.3 35.3 71.5 2.7 135.3 186.7 52.3 17.9
42 – – – 375 8.09 873 49.3 41.6 165.4 1.6 269.4 167.8 97.9 30.5
43 – – – 386 8.16 540 51.9 35.5 0.0 1.6 124.6 206.2 49.0 17.1
44 – – – 450 8.15 692 38.1 36.5 109.9 9.8 233.9 78.7 84.0 18.6
45 – – – 346 8.43 464 17.6 16.7 98.9 5.1 133.5 108.0 55.7 11.1
46 – – – 445 8.22 427 16.0 16.8 94.1 5.9 106.9 129.9 39.8 14.1
47 – – – 169 8.12 870 62.1 34.7 166.1 6.3 332.3 151.9 102.2 4.9
48 – – – 135 8.23 365 27.9 14.5 82.3 4.3 99.8 144.6 36.0 6.8
49 – – – 136 8.06 753 55.9 29.3 170.2 7.0 272.3 126.3 92.6 7.4
50 – – – 367 8.12 751 48.9 43.9 120.3 10.6 267.0 78.7 107.0 20.1
51 – – – 382 8.14 628 49.5 36.4 94.8 1.2 154.8 197.0 68.6 18.4
52 – – – 342 7.57 484 41.7 28.9 65.5 2.0 102.6 211.1 59.0 1.2
53 – – – 400 7.99 804 54.7 39.4 162.4 3.5 254.2 166.5 107.5 2.1
54 – – – 380 6.94 410 22.0 22.6 66.5 7.0 108.6 114.1 35.5 9.7
55 – – – 359 8.16 749 42.3 40.9 128.1 10.6 255.3 77.5 94.1 16.6
56 – – – 137 8.27 401 26.1 15.9 81.0 4.3 122.1 104.3 42.7 13.6
57 – – – 267 8.32 204 8.8 11.8 35.0 3.9 30.2 93.3 21.6 7.5
58 – – – 321 8.17 205 11.0 9.2 34.7 3.9 29.5 105.5 23.0 8.1
59 – – – 350 8.3 204 9.6 11.6 32.7 3.9 29.5 97.0 22.1 8.5
60 – – – 303 7.98 806 42.3 44.8 152.3 9.0 295.0 90.9 86.9 16.7
61 – – – 358 7.87 600 34.5 27.2 113.4 1.2 171.5 158.0 60.5 15.9
62 – – – 395 8.18 327 17.0 20.9 43.0 5.5 85.9 108.0 32.2 0.0
63 – – – 350 8.05 210 12.4 13.5 39.1 5.1 33.4 115.9 22.6 13.0
64 – – – 350 8.4 240 12.6 13.7 35.9 4.3 46.5 95.8 24.5 0.0
65 – – – 350 8.09 262 22.4 13.5 42.3 5.5 53.3 99.4 31.7 18.8
66 – – – 350 8.31 200 12.2 8.3 34.3 3.9 32.7 95.8 20.2 8.0
67 – – – 351 8.29 230 12.4 10.2 43.0 4.7 36.2 89.7 25.0 8.2
68 – – – 350 8.24 236 13.0 13.0 34.0 4.3 39.4 115.3 27.4 7.7
69 – – – 142 8.39 486 32.3 21.0 84.4 5.1 177.5 76.3 39.4 9.7
70 – – – 330 8.2 625 36.3 35.1 102.1 9.4 214.1 90.9 70.1 15.1
71 – – – 423 8.23 424 26.3 25.7 62.3 7.0 117.5 106.1 39.4 12.6
72 – – – 415 8.37 282 14.8 15.8 53.8 5.5 58.6 117.7 26.4 8.9
73 – – – 445 7.62 1,811 95.8 59.2 282.9 15.6 809.4 193.4 0.0 50.1
74 – – – 170 8.33 208 9.8 9.5 43.9 3.9 39.8 109.8 20.6 8.2
75 – – – – 8.01 1,472 94.0 67.1 325.9 8.2 576.5 101.9 266.4 28.6
76 – – – 350 6.91 196 14.2 7.7 38.2 4.7 30.9 110.4 16.8 7.6
77 – – – 351 8.2 197 10.4 10.9 39.1 4.3 29.1 104.3 18.2 7.5
Appl Water Sci
123
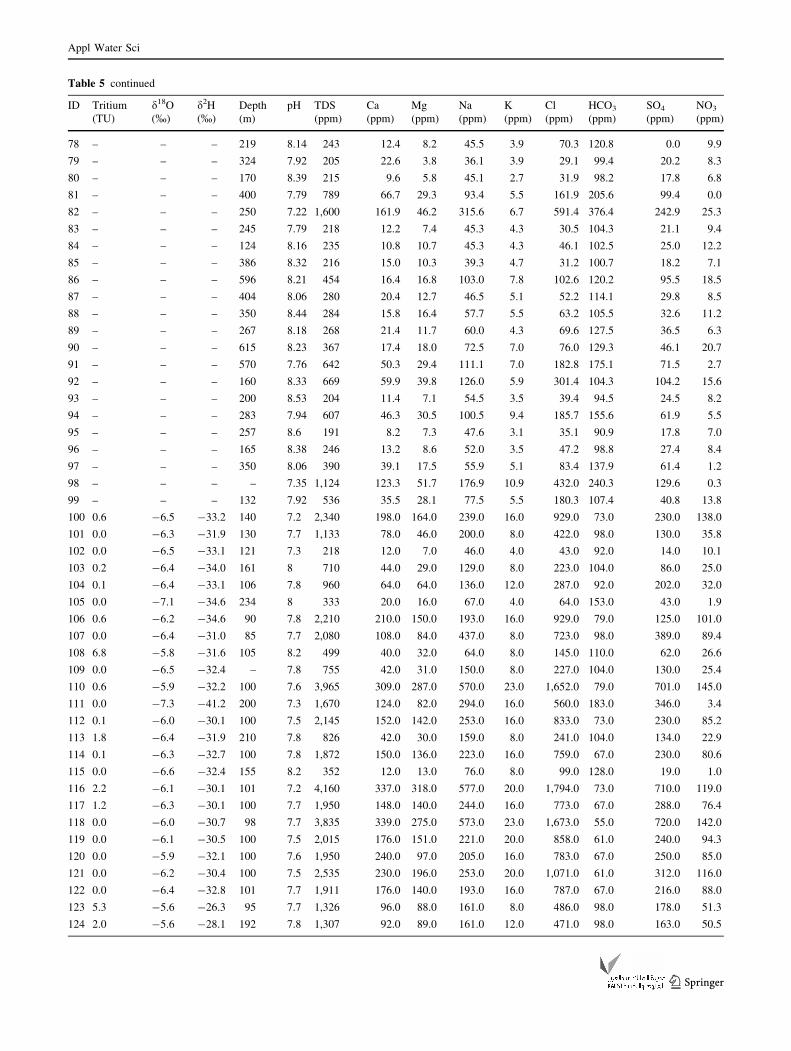
Table 5 continued
ID Tritium
(TU)
d18O
(%)
d2H
(%)
Depth
(m)
pH TDS
(ppm)
Ca
(ppm)
Mg
(ppm)
Na
(ppm)
K
(ppm)
Cl
(ppm)
HCO3
(ppm)
SO4
(ppm)
NO3
(ppm)
78 – – – 219 8.14 243 12.4 8.2 45.5 3.9 70.3 120.8 0.0 9.9
79 – – – 324 7.92 205 22.6 3.8 36.1 3.9 29.1 99.4 20.2 8.3
80 – – – 170 8.39 215 9.6 5.8 45.1 2.7 31.9 98.2 17.8 6.8
81 – – – 400 7.79 789 66.7 29.3 93.4 5.5 161.9 205.6 99.4 0.0
82 – – – 250 7.22 1,600 161.9 46.2 315.6 6.7 591.4 376.4 242.9 25.3
83 – – – 245 7.79 218 12.2 7.4 45.3 4.3 30.5 104.3 21.1 9.4
84 – – – 124 8.16 235 10.8 10.7 45.3 4.3 46.1 102.5 25.0 12.2
85 – – – 386 8.32 216 15.0 10.3 39.3 4.7 31.2 100.7 18.2 7.1
86 – – – 596 8.21 454 16.4 16.8 103.0 7.8 102.6 120.2 95.5 18.5
87 – – – 404 8.06 280 20.4 12.7 46.5 5.1 52.2 114.1 29.8 8.5
88 – – – 350 8.44 284 15.8 16.4 57.7 5.5 63.2 105.5 32.6 11.2
89 – – – 267 8.18 268 21.4 11.7 60.0 4.3 69.6 127.5 36.5 6.3
90 – – – 615 8.23 367 17.4 18.0 72.5 7.0 76.0 129.3 46.1 20.7
91 – – – 570 7.76 642 50.3 29.4 111.1 7.0 182.8 175.1 71.5 2.7
92 – – – 160 8.33 669 59.9 39.8 126.0 5.9 301.4 104.3 104.2 15.6
93 – – – 200 8.53 204 11.4 7.1 54.5 3.5 39.4 94.5 24.5 8.2
94 – – – 283 7.94 607 46.3 30.5 100.5 9.4 185.7 155.6 61.9 5.5
95 – – – 257 8.6 191 8.2 7.3 47.6 3.1 35.1 90.9 17.8 7.0
96 – – – 165 8.38 246 13.2 8.6 52.0 3.5 47.2 98.8 27.4 8.4
97 – – – 350 8.06 390 39.1 17.5 55.9 5.1 83.4 137.9 61.4 1.2
98 – – – – 7.35 1,124 123.3 51.7 176.9 10.9 432.0 240.3 129.6 0.3
99 – – – 132 7.92 536 35.5 28.1 77.5 5.5 180.3 107.4 40.8 13.8
100 0.6 -6.5 -33.2 140 7.2 2,340 198.0 164.0 239.0 16.0 929.0 73.0 230.0 138.0
101 0.0 -6.3 -31.9 130 7.7 1,133 78.0 46.0 200.0 8.0 422.0 98.0 130.0 35.8
102 0.0 -6.5 -33.1 121 7.3 218 12.0 7.0 46.0 4.0 43.0 92.0 14.0 10.1
103 0.2 -6.4 -34.0 161 8 710 44.0 29.0 129.0 8.0 223.0 104.0 86.0 25.0
104 0.1 -6.4 -33.1 106 7.8 960 64.0 64.0 136.0 12.0 287.0 92.0 202.0 32.0
105 0.0 -7.1 -34.6 234 8 333 20.0 16.0 67.0 4.0 64.0 153.0 43.0 1.9
106 0.6 -6.2 -34.6 90 7.8 2,210 210.0 150.0 193.0 16.0 929.0 79.0 125.0 101.0
107 0.0 -6.4 -31.0 85 7.7 2,080 108.0 84.0 437.0 8.0 723.0 98.0 389.0 89.4
108 6.8 -5.8 -31.6 105 8.2 499 40.0 32.0 64.0 8.0 145.0 110.0 62.0 26.6
109 0.0 -6.5 -32.4 – 7.8 755 42.0 31.0 150.0 8.0 227.0 104.0 130.0 25.4
110 0.6 -5.9 -32.2 100 7.6 3,965 309.0 287.0 570.0 23.0 1,652.0 79.0 701.0 145.0
111 0.0 -7.3 -41.2 200 7.3 1,670 124.0 82.0 294.0 16.0 560.0 183.0 346.0 3.4
112 0.1 -6.0 -30.1 100 7.5 2,145 152.0 142.0 253.0 16.0 833.0 73.0 230.0 85.2
113 1.8 -6.4 -31.9 210 7.8 826 42.0 30.0 159.0 8.0 241.0 104.0 134.0 22.9
114 0.1 -6.3 -32.7 100 7.8 1,872 150.0 136.0 223.0 16.0 759.0 67.0 230.0 80.6
115 0.0 -6.6 -32.4 155 8.2 352 12.0 13.0 76.0 8.0 99.0 128.0 19.0 1.0
116 2.2 -6.1 -30.1 101 7.2 4,160 337.0 318.0 577.0 20.0 1,794.0 73.0 710.0 119.0
117 1.2 -6.3 -30.1 100 7.7 1,950 148.0 140.0 244.0 16.0 773.0 67.0 288.0 76.4
118 0.0 -6.0 -30.7 98 7.7 3,835 339.0 275.0 573.0 23.0 1,673.0 55.0 720.0 142.0
119 0.0 -6.1 -30.5 100 7.5 2,015 176.0 151.0 221.0 20.0 858.0 61.0 240.0 94.3
120 0.0 -5.9 -32.1 100 7.6 1,950 240.0 97.0 205.0 16.0 783.0 67.0 250.0 85.0
121 0.0 -6.2 -30.4 100 7.5 2,535 230.0 196.0 253.0 20.0 1,071.0 61.0 312.0 116.0
122 0.0 -6.4 -32.8 101 7.7 1,911 176.0 140.0 193.0 16.0 787.0 67.0 216.0 88.0
123 5.3 -5.6 -26.3 95 7.7 1,326 96.0 88.0 161.0 8.0 486.0 98.0 178.0 51.3
124 2.0 -5.6 -28.1 192 7.8 1,307 92.0 89.0 161.0 12.0 471.0 98.0 163.0 50.5
Appl Water Sci
123
References
Al-Hadidi K (2011) Groundwater management in Jordan. Ground-
water operational management in the Arab region meeting
organized by UNESCO, Abu-Dhabi, UAE pp 23–25
Alkhaddar R, Sheely W, Al-Ansari NA (2005) Jordan’s water
resources, supply and future demand. Water Int 30(3):1–11
APHA (1995) Standard methods, 19th edn. American Public Health
Association, Washington
Bajjali W (1990) Hydrochemical and isotopic characteristic of
groundwater in Amman-Zarqa area. Internal Report, Water
Authorty of Jordan, Amman-Jordan
Bajjali W (1994) Recharge and regional circulation of thermal
groundwater in northern Jordan using isotope geochemistry.
Ph.D. Thesis, University of Ottawa, Canada
Bajjali W (1997) Using ArcView to determine the origin of
groundwater salinity in Dhuleil, Halabat, and Samra area of
Jordan. ESRI User Conference, San Diego
Bajjali W (2006) Recharge mechanism and hydrochemistry evalua-
tion of groundwater in the Nuaimeh area, Jordan using environ-
mental isotope techniques. Hydrogeol J 14(1–4):180–191
Bajjali W (2008) Evaluation of groundwater in a three-aquifer system
in Ramtha area, Jordan: recharge mechanism, hydraulic rela-
tionship and geochemical evolution. Hydrogeol J
16(6):1193–1205
Bajjali W (2012) Spatial variability of environmental isotope and
chemical content of precipitation in Jordan and evidence of
slight change in climate. Appl Water Sci 2(4):271–283
Bajjali W, Al-Hadidi K (2006) Recharge origin, overexploitation, and
sustainability of water resources in an arid area from Azraq
basin, Jordan: case study. Nord Hydrol 37(3):277–292
Benson AK (1995) Applications of ground penetrating Radar in
assessing some geological hazards: examples of groundwater
contamination, faults, cavities. J Appl Geophys 33:177–193
BGS, CNA, SAPAL, WAJ, DMR and PSU (1998) Protecting
groundwater beneath wastewater recharge sites. BGS Technical
Report WC/98/39
Bohlke JK (2002) Groundwater recharge and agricultural contami-
nation. Hydrogeol J 10:153–179
Chena J, Tang C, Yu J (2006) Use of 18O, 2H and 15N to identify
nitrate contamination of groundwater in a wastewater irrigated
field near the city of Shijiazhuang, China. J Hydrol
326(1–4):367–378
Cifuentes E, Gomez M, Blumenthal U, Tellez-Rojo MM, Romieu I,
Ruiz-Palacios G, Ruiz-Velazco S (2000) Risk factors for Giardia
intestinalis infection in agricultural villages practicing wastewa-
ter irrigation in Mexico. Am J Trop Med Hyg 62(3):388–392
Craig H (1961) Isotopic variations in meteoric waters. Science
133:1702–1703
Dansgaard W (1964) Stable isotope in precipitation. Tellus
216:436–468
Darling WG, Bath AH (1988) A stable isotope study of recharge
processes in the English Chalk. J Hydrol 101:31–46
Diaz-Cruz M, Barcelo D (2008) Trace organic chemicals contami-
nation in ground water recharge. Chemosphere 72:333–342
Eckert P, Irmscher R (2006) Over 130 years of experience with
riverbank filtration in Dusseldorf, Germany. J Water Supply Res
55:283–291
Ekdahl EJ, Carpio-Obeso MP, Borkovich J (2009) Using GeoTracker
GAMA to investigate nitrate concentrations in California
groundwater, 1980–2008, presented at Groundwater Monitoring:
design, analysis, communication, and integration with decision
making conference, Orange
Fan AM, Steinberg VE (1996) Health implications of nitrate and
nitrite in drinking water: an update on methemoglobinemia
occurrence and reproductive and developmental toxicity. Regul
Toxicol Pharmacol 23:35–43
Foster S, Chilton P (2004) Downstream of downtown: urban
wastewater as groundwater recharge. Hydrogeol J 12:115–120
Freeze RA, Cherry JA (1979) Groundwater. Prentice-Hall Inc.,
Englewood Cliffs 07632
Gat JR, Carmi I (1970) Evolution of the isotopic composition of the
atmospheric water in the Mediterranean Sea area. J Geophys Res
75:3039–3048
Gonfiantini R, Roche MA, Olivry JC, Fontes JC, Zuppi GM (2001)
The altitude effect on the isotopic composition of tropical rains.
Chem Geol 181:147–167
Healy RW, Cook PG (2002) Using groundwater levels to estimate
recharge. Hydrogeol J 10(1):91–109
Jankowski J, Acworth RI (1997) Impact of depris-flow depositson
hydrogeochemical processes and the development of dry land
salinity in the Yass River catchment, New South Wales,
Australia. Hydrogeol J 5(4):71–88
Jimenez B, Asano T (eds) (2008) Water reuse: an international survey
of current practice, issues and needs, Scientific and Technical
Report No. 20, IWA Publishing, London
Kass A, Gavrieli I, Yechieli Y, Vengosh A, Starinsky A (2005) The
impact of freshwater and wastewater irrigation on the chemistry
of shallow groundwater: a case study from the Israeli Coastal
Aquifer. J Hydrol v300(1–4):314–331
Keraita BN, Jimenez B, Drechsel P (2008) Extent and implications of
agricultural reuse of untreated, partly treated and diluted
wastewater in developing countries’, CAB Reviews: perspec-
tives in agriculture, veterinary science, nutrition and natural
resources 3(58): 1–15
Khan S, Cao Q, Zheng YM, Huang YZ, Zhu YG (2008) Health risks
of heavy metals in contaminated soils and food crops irrigated
with wastewater in Beijing, China. Environ Pollut 152(3):
686–692
Lapworth D, Baran N, Stuart M, Ward R (2012) Emerging organic
contaminants in groundwater: a review of sources, fate and
occurrence. Environ Pollut 163:287–303
Table 5 continued
ID Tritium
(TU)
d18O
(%)
d2H
(%)
Depth
(m)
pH TDS
(ppm)
Ca
(ppm)
Mg
(ppm)
Na
(ppm)
K
(ppm)
Cl
(ppm)
HCO3
(ppm)
SO4
(ppm)
NO3
(ppm)
125 15.3 -5.7 -28.1 165 8 352 26.0 20.0 55.0 4.0 50.0 183.0 43.0 26.0
126 0.8 -6.3 -32.2 125 7.5 1,056 64.0 77.0 131.0 4.0 358.0 171.0 96.0 36.7
127 0.0 -6.4 -33.2 94 7.7 1,950 176.0 144.0 205.0 16.0 808.0 67.0 221.0 97.2
128 2.7 -6.0 -29.6 97 7.8 960 64.0 64.0 136.0 12.0 287.0 92.0 202.0 32.0
129 – – – 99 7.61 2,020 162.0 101.0 365.0 10.2 857.0 111.0 276.0 15.1
Appl Water Sci
123
Ma JZ, Wang XS, Edmunds WM (2005) The characteristics of
ground-water resources and their changes under the impacts of
human activity in the arid Northwest China a case study of the
Shiyang River Basin. J Arid Environ v61:277–295
Mathieu R, Bariac T (1996) An isotopic study (2H and 18O) of water
movements in clayey soils under a semiarid climate. Water
Resour Res v32:779–789
Moore KB, Ekwurzel B, Esser BK, Hudson GB, Moran JE (2004)
Sources of groundwater nitrate revealed using residence time
and isotope methods. Appl Geochem 21:1016–1029
Mutaz Al-Alawi (2007) Health assessment of wastewater reuse in
Jordan’, in wastewater reuse: risk assessment, decision-making
and environmental security, NATO security through science
series. Springer, Netherlands, pp 385–92
Natural Resources Authority (NRA) (1993) Geology of Az Zarqa
(3254), scale 1:50,000. Geological Mapping Division
Nitsch M (1990) Soil Salinization in the Wadi Dhuleil and Wadi Arja
Irrigation Project. Hashemite Kingdom of Jordan. Hannover
Raschid-Sally L, Carr R, Buechler S (2005) Managing wastewater
agriculture to improve livelihoods and environmental quality in
poor countries’. Irrig Drain 54(1):11–22
Royal Scientific Society (RSS) (2012) Monitoring the wastewater that
enter and exit the Khirbet Samra wastewater treatment plants and
its effect on the quality of groundwater. Amman-Jordan
Saqqar M, Matar A, Bajjali W (1989) Performance evaluation of
wastewater treatment plants in Jordan and their effect on
groundwater, internal report, water authority of Jordan, Amman,
Jordan
Seiler R (2005) Combined use of 15N and 18O of nitrate and 11B to
evaluate nitrate contamination in groundwater. Appl Geochem
v20(9):1626–1636
Subba Rao N (2008) Factors controlling the salinity in groundwater in
parts of Guntur district, Andhra Pradesh, India. Environ Monit
Assess 138(1–3):327–341
Water Authority of Jordan (WAJ) (2003) WAJ open files. Amman,
Jordan
Water Authority of Jordan (WAJ) (2004) The third country training
programme for water resources management. Amman, Jordan
World Health Organization (WHO) (2006) Guidelines for the safe use
of wastewater, excreta and greywater, Vol 2: Wastewater use in
agriculture, World Health Organization, Geneva
World Health Organization (WHO) (2011) Guideline for drinking
water quality 4th ed. ISBN 9789241548151, Geneva
Yurtsever Y, Gat JR (1981) Atmospheric waters. Stable isotopes
hydrology, deuterium and oxygen-18 in the water cycle.
Technical Reports Series No. 210. IAEA, Vienna
Appl Water Sci
123