Water Management and Water Treatment at Golden Cross
12
Water Management and Water Treatment at Golden Cross By M. P. A. WILLIAMS' and A. GOLDSTONE 2 ABSTRACT The water management system and the water treatment plant for a pro- posed new gold mine in New Zealand are Rainfall substan- tially exceeds evaporation at the site, so that water treatment and discharge will be necessary. A high level of investigation and engineering design detail are required to meet New Zealand regulatory standards for environmental impact reports and supporting documenta- tion for water rights applications. The water management system was designed with the aid of three distinct computer models, WATER PLAN, TAIL STORE, and BALANCE. Each model is briefly described together with the manner in which they were co-ordinated to provide an inte- grated approach to the design. Water treatment is primarily concerned with cyanide and trace metals. The alternative methods were short- listed to hydrogen peroxide and biological treatment. Studies also showed cost benefits from cyanide recovery using AVR treatment of the tailings slurry. Laboratory scale testwork on all three treatment technologies is described. INTRODUCTION The proposed Golden mine is located in a known gold rich province in the north island of New Zealand that was extensively worked in the late 1800's and early 1900's. The proposed will be worked in both open pit and underground and will extract some 6 million tonnes of ore with a grade varying from 0.75g/t to over 30g/t of gold over a planned mine life of 10 years. The site is located in steep topography in tary to the Waitekauri River, close to the It is a high rainfall area and the current sheep farming surrounded by State forest. river supports a small population of young the catchment of a tribu- headwaters of the river. land use is dairy and Further downstream the trout and eels. The Third International Mine Water Congress, Melbourne Australia, October 1988 571 IMWA Proceedings 1988 | © International Mine Water Association 2012 | www.IMWA.info Reproduced from best available copy
Transcript of Water Management and Water Treatment at Golden Cross

Water Management and Water Treatment at Golden Cross By M. P. A. WILLIAMS' and A. GOLDSTONE2
ABSTRACT
The water management system and the water treatment plant for a proposed new gold mine in New Zealand are describe~. Rainfall substantially exceeds evaporation at the site, so that water treatment and discharge will be necessary. A high level of investigation and engineering design detail are required to meet New Zealand regulatory standards for environmental impact reports and supporting documentation for water rights applications. The water management system was designed with the aid of three distinct computer models, WATER PLAN, TAIL STORE, and BALANCE. Each model is briefly described together with the manner in which they were co-ordinated to provide an integrated approach to the design. Water treatment is primarily concerned with cyanide and trace metals. The alternative methods were shortlisted to hydrogen peroxide and biological treatment. Studies also showed cost benefits from cyanide recovery using AVR treatment of the tailings slurry. Laboratory scale testwork on all three treatment technologies is described.
INTRODUCTION
The proposed Golden C~oss mine is located in a known gold rich province in the north island of New Zealand that was extensively worked in the late 1800's and early 1900's. The proposed m~ne will be worked in both open pit and underground and will extract some 6 million tonnes of ore with a grade varying from 0.75g/t to over 30g/t of gold over a planned mine life of 10 years.
The site is located in steep topography in tary to the Waitekauri River, close to the It is a high rainfall area and the current sheep farming surrounded by State forest. river supports a small population of young
the catchment of a tribuheadwaters of the river. land use is dairy and Further downstream the trout and eels.
The Third International Mine Water Congress, Melbourne Australia, October 1988
571
IMWA Proceedings 1988 | © International Mine Water Association 2012 | www.IMWA.info
Reproduced from best available copy

Annual average rainfall of nearly 3m exceeds evaporation at around 0.6m by a substantial margin. The open pit and underground workings are expected to need dewatering on an on-going basis. It is thus necessary to plan for significant water treatment and discharge from the site.
WATER MANAGEMENT SYSTEM
The water management system developed for the project is illustrated on Figures 1 and 2. The open pit, tailings impoundment, and plant areas take up almost all of the Union Stream catchment which is formed by steep escarpments to the north and east of the site. The Union Stream flows south west to join the Waitekauri River.
The priority task of any mine water management system is to ensure that the needs of the mining and processing operation are met throughout the range of climate conditions that could occur, whilst minimising the environmental impact of any discharges. At Golden Cross this has involved maximising the diversion of runoff from undisturbed catchments above the site, maximising the segregation of water streams within the system on the basis of quality, and maximising the recycle of water, particularly that containing cyanide from the gold recovery process.
Principal inflows to the system consist of rainfall and groundwater pumped from the underground mine and the open pit to the surface.
Principal outflows consist of evaporation, water entrapped in the tailings and discharges to the existing river system.
Water quality has been handled in the system by categorising the flows into the following "streams".
Clean Water. Rainfall runoff from undisturbed catchments above and within the site, runoff from rehabilitated waste rock stacks, clean groundwater from the unfierground mine, and baseflows to the streams in the catchment.
Turbid Water. Rainfall runoff from disturbed catchments within the site, etc. to be
roads, some hard standing areas, the open pit, waste rock stacks Water, notwithstanding the suspended solids content, considered free of cyanide or significant trace metals content.
Possible Trace Metals. Runoff and leachate from ore stockpiles, and possibly leachate from deep infiltration to the waste rock stacks.
Cyanide. Process plant tailings to the AVR plant and the tailings impoundment, fill going underground, return water from the tailings impoundment decant pond, seepage collection in the tailings impoundment, and possibly in the Union waste rock stack underdrainage systems.
The main water treatment plant will receive water from the Union waste rock stack and tailings impoundment underdrainage systems, and overflow from the decant return from the tailings pond. Treatment will be
The Third International Mine Water Congress, Melbourne Australia, October 1988
572
IMWA Proceedings 1988 | © International Mine Water Association 2012 | www.IMWA.info
Reproduced from best available copy

Figure 1
Figure 2
Site plan
0 & !i&J DiJW:D --
Water management system flow sheet
The Third International Mine Water Congress, Melbourne Australia, October 1988
573
IMWA Proceedings 1988 | © International Mine Water Association 2012 | www.IMWA.info
Reproduced from best available copy

by hydrogen peroxide or by biological methods. Minor treatment may also be necessary for both clean and contaminated water from the underground mine, and for turbid water at times of low river flow.
WATER MANAGEMENT MODELLING
Tailings Consolidation
The behaviour of the tailings in the storage impoundment has a major impact on the water management system. The impoundment is designed for sub-aerial deposition of tailings. As the slurry accumulates on the beach, most of the water is retained with the solids. Bleed water runs off and reports to the decant pond. Some evaporation occurs from the beach. As the tailings build up they consolidate. Substantial quantities of water squeezed out by consolidation report upwards to the surface and downwards to the underdrainage system throughout the mine life. Because of the relatively high clay content of the ore at Golden Cross, consolidation is slow and this pro~ss will continue for many years after mine closure.
Behaviour of the tailings was studied using a consolidation model, TAIL STORE, developed specifically for the purpose. The analysis of the consolidation behaviour of tailings cannot be handled by conventional consolidation theory. Conventional theory assumes that the thickness of the deposit does not change during consolidation, ignores the self weight of the deposit, assumes constant consolidation parameters, and assumes the instantaneous application of load. Whilst this is satisfactory for the analysis of settlement problems under applied loads, such as buildings or storage tanks, it is manifestly not true of tailings deposits where the strains are large, the self weight of the material is itself the consolidating influence, the parameters can change by an order of magnitude as consolidation proceeds, and material is continuously being added to the deposit.
TAIL STORE is based on a numerical solution of the partial differential equation governing large-strain, self weight consolidation, proposed by Somogyi [4r. The technique intrinsically copes with the highly non-linear behaviour of tailings deposited at low solids content and is applicable both during and after tailings deposition. The solution proposed by Somogyi has been extended, by the introduction of seepage forces, to allow for a more general solution to the underdrainage conditions that may be modelled. f Inputs to the programme include tailings discharge rate, impoundment geometry and tailings properties.
Outputs from the programme include the initial split between bleed water and water retained in the tailings on the beach, density, permeability and pore pressure
~r---------------------------------, .. end of minng
.. upward
. .. downward
" years
Figure 3. Expected consolidation seepage flows
The Third International Mine Water Congress, Melbourne Australia, October 1988
574
IMWA Proceedings 1988 | © International Mine Water Association 2012 | www.IMWA.info
Reproduced from best available copy

profiles within the deposit during mine life, progressive tailings RLs in the impoundment year by year during mine life, and the timing and magnitude of settlement and consolidation seepage expected during and after completion of mining. Figure 3 shows a plot of the expected consolidation flows versus time at Golden Cross.
Water Management System
To enable the sensitivity to changes in parameters such as runoff coefficients, groundwater flows, rainfall and evaporation, etc. to be studied, WATER PLAN was developed. The programme uses a standard spreadsheet format.
The site was subdivided into a total of thirty-eight sub-catchments for modelling purposes. Flows into and out from the various subcatchments are calculated, summed or proportioned in accordance with the protocols established and directed to the next sub-catchment downstream. The rainfall runoff from each sub-catchment is calculated using a runoff coefficient specific to that catchment. The model can be used to calculate flows over any desired period - annual, monthly, daily, etc. but the runoff coefficients must be adjusted accordingly. Very short term events such as brief, high intensity storms cannot be studied since the programme format assumes instantaneous transfer from one sub-catchment to another. Catchment lag, which is significant during such short term events, is not allowed f~r.
Once the model is established, the sensitivity and impact of changes to the many input parameters and the year by year evolution of the water management system as mining proceeds can be easily studied by making appropriate adjustments to sub-catchment areas, routing protocols, etc. The outputs from TAIL STORE constitute inputs to the WATER PLAN model.
Cyanide concentrations are also included in the programme and are based on dilution ratios and, at locations where residence times are likely to be significant such as the tailings impoundment, on decay coefficients.
Water Balance in the Tailings Impoundment
More than thirty years of continuous daily rainfall records exists at the site. The annual average precipitation is 2910mm. The distribution is characterised by great variability in daily and monthly extremes. In April 1~81, 427mm fell in one day and 744mm over three days. The wettest month on record is 1011mm and the driest 10mm. In these circumstances, the design of any structure on site that must store rainfall and runoff needs to be approached with some care. The only such structure in the Golden Cross water management system is the tailings impoundment. A number of issues are involved:-
The volume of stored water at any one time. The embankment freeboard against overtopping. The decant pump requirements, the resulting flow to the water treatment plant, and hence the proposed discharge rates to the river.
There is difficulty in assessing the impact of a certain return
The Third International Mine Water Congress, Melbourne Australia, October 1988
575
IMWA Proceedings 1988 | © International Mine Water Association 2012 | www.IMWA.info
Reproduced from best available copy
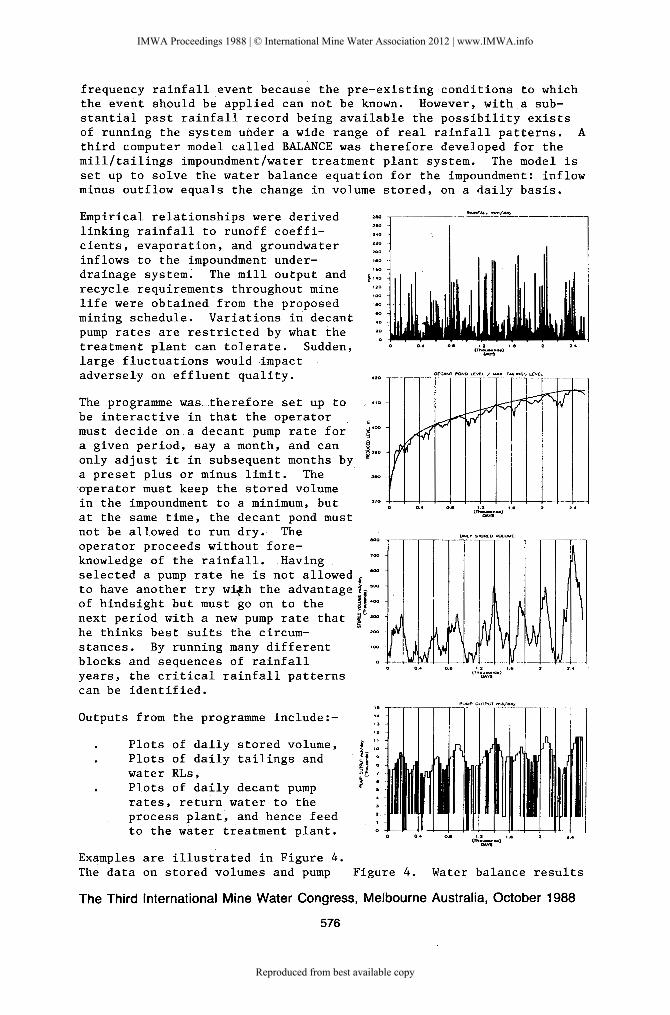
frequency rainfall event because the pre-existing conditions to which the event should be applied can not be known. However, with a substantial past rainfall record being available the possibility exists of running the system under a wide range of real rainfall patterns. A third computer model called BALANCE was therefore developed for the mill/tailings impoundment/water treatment plant system. The model is set up to solve the water balance equation for the impoundment: inflow minus outflow equals the change in volume stored, on a daily basis.
Empirical relationships were derived linking rainfall to runoff coefficients, evaporation, and groundwater inflows to the impoundment under-drainage system. The mill output and 1,.0
recycle requirements throughout mine life were obtained from the proposed mining schedule. Variations in decant pump rates are restricted by what the treatment plant can tolerate. Sudden, large fluctuations would impact adversely on effluent quality.
The programme was. therefore set up to be interactive in that the operator must decide on a decant pump rate for ' ~-a given period, say a month, and can ~••o only adjust it in subsequent months by a preset plus or minus limit. The operator must keep the stored volume in the impoundment to a minimum, but at the same time, the decant pond must not be allowed to run dry. The operator proceeds without fore-knowledge of the rainfall. Having selected a pump rate he is not allowed f
to have another try w¥h the advantage !f ·~ of hindsight but must go on to the ~J •oo
next period with a new pump rate that ~~,~ he thinks best suits the circum-stances. By running many different blocks and sequences of rainfall years, the critical rainfall patterns can be identified.
Outputs from the programme include:-
Plots of daily stored volume, Plots of daily tailings and water RLs, Plots of daily decant pump rates, return water to the process plant, and hence feed to the water treatment plant.
Examples are illustrated in Figure 4.
D£CANT PONC LE'YEL / MU TAiliNG$ I.£V£L
,-- - -- .c - =-c -- - -
.,;<ii"Jd<:;{-:::""\f
vv;(~
The data on stored volumes and pump Figure 4. Water balance results
The Third International Mine Water Congress, Melbourne Australia, October 1988
576
IMWA Proceedings 1988 | © International Mine Water Association 2012 | www.IMWA.info
Reproduced from best available copy

rates also enables typical residence times in the decant pond to be determined for cyanide decay modelling in WATER PLAN. Treatment plant design and sizing was based on the results from the modelling.
The proposed receiving water quality standards require that the treatment plant effluent be pipelined several kilometres down river and that the ratio of effluent to river flow not exceed 25%. The model enabled the effluent flow rates to be compared with the river hydrographic records to determine the extent and impact of likely discharge restrictions at times of low river flow.
WATER TREATMENT
Water treatment testing has been directed at the evaluation of the recovery of cyanide from the tailings slurry and of various alternative technologies for final treatment of water to be discharged. The bench work was carried out at the Industrial Processing Division of the Department of Scientific and Industrial Research in Wellington, New Zealand.
AVR
AVR technology is reasonably well known in its application to process liquors [1] but the application to CIP or CIL tailings slurry would be novel. The concept tested is to adjust the pH ~ownward in order to dissociate CN- from its metal complexes. CN- is hydrolyzed and HCN volatilized. The reaction requires turbulence to keep the liquor mixed and slurry in suspension and requires air to effect mass transfer and volatilization of HCN. Thus the reaction is vigorously aerated to provide both turbulence and the required air.
Testwork centered on 10L samples of tailings from freshly milled representative samples of ore. Test conditions used a reaction pH from 7.5 to 10.5 and airflow rates from 60L/min to 100L/min (approximately 3.5m3fm2/minJ. HCN recovery was into 10L of pH 11.5 sodium hydroxide solution. The reaction was substantially complete in most tests after 3-4 hrs. The sensitivity to pH and air flow rates is illustrated in Table 1 which shows the effluent concentrations for both total cyanide (CNT) and weak acid dissociable cyanide (CNWAD).
Test pH Air Flow, L/min Start
3 CNWAD' g/m CNWAD'
F~nal g/m CNT' g/•3
10.5 82 160 114 114 8.7 60 160 9 18 8.7 8'2 160 10 15 7.6 60 160 9 14 7.6 82 160 8 15 8.1 100 218 10 25 8.1 80 218 8 25
TABLE 1 Summary of 3.6 hour AVR results.
For this AVR application it appears that a pH of around 8 will.be necessary, together with an air flux of up to 5m3fm2/min. Treated effluent values for CNT of around 20-30g/m3 and CNWAD of 10g/m3 can be expected. The plant will treat some 1900t/day at 30% solids and has the potential to save around $NZ1 million/yr. in returned cyanide. Geochemical testing of the tailings effluent has also shown further
The Third International Mine Water Congress, Melbourne Australia, October 1988
577
IMWA Proceedings 1988 | © International Mine Water Association 2012 | www.IMWA.info
Reproduced from best available copy

decay of CNWAD and immobilisation of trace metals. Bearing in mind the saving in final water treatment and the reduced environmental impact in the tailings impoundment, the cost/benefits to be obtained from the employment of the AVR technology at Golden Cross are clear.
Final Water.Treatment
An extensive physico-chemical and ecological study of the ground and surface waters of the 42km2 Waitekauri catchment was carried out to enable design goals to be set for treated wastewater. The river supports a non-reproductive rainbow trout fishery - trout spawning was found to occur principally in unaffected tributaries. It was decided that the treatment plant should provide a reasonable level of protection for this fishery and the associated aquatic communities.
A large data base of toxicological information was assembled and used to calculate chemical specific water quality criteria suitable to meet the required level of protection. The calculati~n methodology was based on that used by the US EPA to calculate their national criteria [6, 7]. This approach is conservative in that complex mine wastes are generally less toxic than components of equivalent dissolved specific chemicals. Thus ultimately it is proposed that the plant's success will be based on the maintenance of the receiving waters rather than specific chemical criteria [5, 8, 9].
Flow in the Waitekauri River at the mine site can be extremely variable, from 0.013-40m3k in any one year, as a result of the intense rain storms that characterise the area. Water balance modelling combined with the derived receiving water criteria plus other factors led to the decision that effluent should be piped 5km downstream from the mine site to improve dilution ratios and that effluent should not exceed 25% of the river flow.
The treatment plant will be required to treat both CNT and CNWAD, a number of trace metals (Ag, As, Cd, Cu, Cr, Fe, Hg, Mn, Ni, Se, Zn), and parameters such as pH, SCN, dissolved salts, and treatment byproducts such as NH4. ~rom an initial list of ten, hydrogen peroxide and biological treatment by bacteria were selected for detailed laboratory trial.
Hydrogen Peroxide
The technology investigated relies on the oxidation of H202. The reaction is catalysed and the precipitation complexes enhanced, by the addition of Cu2+ as CuS04. reactions involved are as follows:
CN- +H202 = OCN- + H20 (free CN ions)
CN to CNO- by of iron The general
M(CN)4- + 4H202 + 20H- = M(OH)2 + 4CNO- + 4H20 (weak metal complexes)
2Cu2+ + Fe(CN)64- = Cu2Fe(CN)6 (iron copper complex precipitation)
CNO- + 2H20 = C032- + NH4++ (slow hydrolysis of cyanate)
Metal removal is achieved by using optimal pH conditions for precipitation and co-precipitation of metal hydroxides and clarification.
The Third International Mine Water Congress, Melbourne Australia, October 1988
578
IMWA Proceedings 1988 | © International Mine Water Association 2012 | www.IMWA.info
Reproduced from best available copy

Additional use of coagulants and precipitants such as FeCl3 and sulphides is possible to enhance metal removal. An organic sulphide manufactured by DeGussa chemicals known as TMT15 (sodium - s triazine - 246 trimercaptide) has proven effective for the precipitation of metals such as Hg and Ag from mine process solutions. [2, 3, 10].
A total of about 200 test conditions were used to look at feed solutions containing 10g/m3, 50g/m3, 100g/m3 and 250g/m3 CNWAD and various initial metal concentrations. Both synthetic and specially produced metallurgical solutions were tested. In practice the feed CNWAD cannot exceed the value in the AVR plant effluent, and water management system modelling indicates that it will be less than 1g/m3 for most of the time, depending on decay rates in the tailings impoundment.
Apart from the various influent chemistries investigated, the interactions between the following reaction parameters were also considered in detail.
H202 addition rate CuS04 addition rate pH history reaction time
precipitation time FeC13 additions TMT15 additions NaOH vs NazC03 for pH adjustment
CNT, CNWAD, Fe, Cu and pH throughout the reaction and especially at test conclusion were of principal interest alt~ough a full chemical analysis o~ all species of interest was generally carried out on final liquors.
Table 2 summarises the results for 50g/m3 and 10g/m3 CNWAD feed respectively. Trace metals analyses for the 50g/m3 feed are also given. Values for the 10g/m3 feed were similar.
It can be seen that the treatment achieved the target values by a comfortable margin for all the parameters with the exception of Cu in two tests.
Biological
Biological treatment technology relies on the biological degradation of cyanide present as ions, complexes, and compounds, and the adsorption of metals into biological solids and/or conversion to insoluble forms. The biological degradation of cyanide by biological systems has been known for some time but has only been a reality in the treatment of mine wa~rs in the last few years with the operation of a full scale treatment plant at Homestake's gold mine at Lead in South Dakota. The Homestake process uses a Pseudomonas species on rotating disc contactors for both cyanide destruction and nitrification of the resulting ammonia. [11, 12]
The processes thought to operate at the Homestake plant are:-
MCN + H20 + ~02 = M - Biofilm + HC03- + NH3 SCN- + 2HzO + 2 ~ 02 = S042- + HC03- + NH3
(M = Metal)
The Third International Mine Water Congress, Melbourne Australia, October 1988
579
IMWA Proceedings 1988 | © International Mine Water Association 2012 | www.IMWA.info
Reproduced from best available copy

/3 50gm CNWAD Influent
Test No. 34B 35A 358 75 84 Target n2o2 added \ 250 250 250 250 250 Cu added g/m3 15 15 15 15 15 FeC1 3 " 50 50 50 50 50 TMT addition N N N N y CN reaction time hr 3 3 3 3 3
Effluent Ana~ysis:-0.41 0.39 CNftAD g/m 0.38 0. 39 o. 33 0.5
sc • 15 15 15 15 15 OCN 43 44 45 44 43 N(NH3 ) 9.7 9.3 9.3 8.5 8.7 N(NO ) 0.3 0.3 0.3 NA NA Alkalinity 75 93 108 280 315 pH
g/m3 9.41 10.05 10.04 9.74 9.88
As <0.001 NA NA <0.001 0.001 1.1 Co . 0.02 NA 0.02 0.03 0.04 Cu 0.2 0.14 0.12 0.15 0.23 0.15 Fe 0.14 0.14 0.11 0.24 0.15 5.0 Hg + 0.002 NA NA 0.002 <0.001 0.005 Se 0.013 NA NA 0.017 0.013 0.12 Zn <0.01 NA <0.01 <0.01 <0.01 0.45 Mn 0.03 NA 0.01 0.0« 0.01 5.0
+ Four tests using 0.01 g/m 3 Hg influent and TMT ~ddition at 120\ of stochiometric gave effluent values of 0.001 g/m • These tests were run on raw barren water.
10gm/3 CNWAD Influent
Test No. 88 94 95 96 97 98 99 Target
\ H 2o~ added ' 150 200 200 200 150 200 250 Cu ad ed g/m3 6 6 6 6 3 3 3 Fec1 3 added g/m3 50 50 50 50 50 50 TMT addition N N N N N N N CN reaction time (hr) 3 3 3 3 3 3 3
Effluent Analy~is:-0.04 0.037 0.036 CNWAD g/m 0.057 0.0<;7 11.053 0.089 0.5
Cu • 0.07 0.041 0.036 0.044 0.025 0.022 0.028 0.15 Fe 0.01 0.05 0.07 0.08 0.09 0.1 0.16 5.0
TABLE 2 Hydrogen peroxide treatment test results.
These are followed by traditional nitrification processes in a second series of reactors. ~
NH4+ + Hoz Noz- + !oz
NOz- + 2H+ + H20 N03-
The system was studied for Golden Cross by using bench scale suspended growth reactors and then in more detail by trickling filter type attached growth reactors. At the time of writing. further trials are being undertaken using a bench scale five chamber rotating disc contactor. Test organisms were obtained from the Homestake plant and from the Christchurch Drainage Board's sewage treatment facility.
The trickling filter attached growth reactors were constructed from pyrex columns (63mm id l.Om long) with perforated pyrex bottom plates packed with 8mm glass rashig rings. Peristaltic pumps were used to circulate the test solutions and dose the system. Seeding and acclimation were carried out followed by effectiveness and sensitivity testing.
No design data has been produced at this stage although the work thus
The Third International Mine Water Congress, Melbourne Australia, October 1988
580
IMWA Proceedings 1988 | © International Mine Water Association 2012 | www.IMWA.info
Reproduced from best available copy

far has shown the system to be technically feasible for the treatment of mine waters from the Golden Cross project. Tables 3 and 4 summarize data from three months of trickling filter testing. These figures, whilst not providing design information and also being exclusive of the sensitivity and the rotating contactor data, have nevertheless demonstrated basic system feasibility for the Golden Cross Project. Work carried out since the time of writing has focused on design testing and economic feasibility of the alternatives studied.
Seed Christchurch Combined Christchurch Combined
Flowrate mL/min. 5 5 1 1
CNT (50) 19.5 (50) 16.6 (45) 0.020 (46) 0.021 CN~AD (50) 19.1 (50) 14.5 ( 44) 0.005 ( 46) 0.004 sc (5.7) 7.5 (5.7) 7.2 (7.5) 0.10 (7.5) 0.110 OCN ( 2. 3) 9.5 ( 2. 3) <1.0 (<1) <1 ( <1) <1 N(NH3) ( o. 3) 5.1 (0.3) 9.3 ( <1) 9.1 ( <1) 8.5 N(N02 ) (0.44) (0.44) (0.04) 13.7 (0.04) 6.7 N(N03) (0.05) 0.2 ( 0.05) 0.4 (0.12) 0.3 (0.14) 6.9 pH (9.0) 8.6 (9.0) 8.6 (8.9) 6.0 (9.0) 6.0 Alkalinity (102) 75 (102) 80 (68) 25 (85) 40
Note:
TABLE
Metal
Cu Ag Zn Fe As Hg Se
1. 2. 3.
4.
3
TABLE 4
All concentrations are in g/m3 Figures in brackets are the approximate influent concentrations This table shows the best results at each flowrate for each seed (i.e. results after 1000 hrs in the continuous mode) Mean hydraulic retention time at 5 mL/min = 1.5 hrs, at lmL/min = 25 hrs.
Effectiveness of the biomass in the attached growth system ;.
Influen~ Cone g/m
1. 65 0.62 0.77 0.88 0.097 0.0023 0.019
Summary of metal data
SUMMARY
Effluen~ Cone g/m
Christchurch
0.02 0.01
<0.01 0.23 0.051
<0.0001 0.047
Combined
0.02 0.01 0.03 0.07 0.033
<0.0001 0.047
Computer programmes have been used to advantage to model the water management system at the proposed Golden Cross mine in New Zealand. The programmes have enabled the consolidation behaviour of the tailings, and the dynamic water balance to be expected in the tailings impoundment in respons~ to real rainfall patterns to be integrated into the water management system for the site as a whole. The water treatment plant capacity was sized on the basis of the model results and the feasibility and impact of the proposed discharge strategy checked.
A system for pretreatment of the mill tailings to reduce cyanide and trace metals loads has been successfully bench tested. Two alternatives for the final treatment of drainage and decant waters have also been tested and each has shown that stringent design targets set for protection of a cold water fishery in the discharge receiving section can be met. Accordingly, an integrated system using both cyanide regeneration from the tailings slurry and hydrogen peroxide or biolo-
The Third International Mine Water Congress, Melbo!,lrne Australia, October 1988
581
IMWA Proceedings 1988 | © International Mine Water Association 2012 | www.IMWA.info
Reproduced from best available copy

gical treatment of final discharge waters is proposed.
ACKNOWLEDGEMENTS
The permission of Cyprus Minerals New Zealand Limited to publish the data contained in this paper and the contributions of the Department of Scientific and Industrial Research in Wellington and Dr. Terry Mudder in the United States are gratefully acknowledged.
REFERENCES
1. McNamara, V.M. Canmet AVR Process for Cyanide Recovery and Environmental Pollution Control. CANMET. (March 1985)
2. Griffiths, A. Advances in the treatment of gold mill effluents with hydrogen peroxide. Randol Gold Forum, Phoenix, Arizona. (1988)
3. Scott, J.S. An overview of cyanide treatmen~methods for gold mill effluents. Cyanide and the Environment Conference, Tuscon, Arizona. (1984)
4. Somogyi, F. Large Strain Consolidation of Fine Grained Slurries. Canadian Society for Civil Engineering, Annual Conference, Winnipeg, Manitoba. (1980)
5. USEPA. Water Quality Standards Handbook. Office of Water Regulations and Standards, Washington, D.C. (1983)
6. USEPA. Guidelines for Deriving Numerical Aquatic Site-Specific Water Quality Criteria by Modifying National Criteria. EPA-600/3-84-099,PB85-121101, USEPA, Minnesota. (1984)
7. USEPA. Guidelines for Deriving Numerical National Water Quality Criteria for the Protection of Aquatic Organisms and their Uses. (1985)
8. USEPA. Technical Support Document for Water Quality-Based Toxics Control. EPA-440/4-85-032,PB86-150057. USEPA, Office of Water Regulations and Standards, Washington, D.C. (1985)
9. USEPA. Permit Writer's Guide to Water Quality-Based Permitting for Toxic Pollutants. USEPA, Office of Water, Washington, D.C. (1987)
10. Zaidi, A., Schmidt, J.W., Simovic, L. and Scott, J. The Art and Science of Treating Wastewaters from Gold Mines. Presented at the Canadian Mineral Processors Annual Operations Conference, Ottowa, Canada. (January 1987)
11. Mudder, T. and Whitlock, J. Biological Treatment of Cyanidation Wastewaters. Minerals and Metallurgical Processing. (August 1984)
12. Mudder, T. et al. Biological Treatment of Cyanidation: Design Start-up, and Operation of a Full Scale Facility. Submitted for publication in JWPCF. (February 1986)
The Third International Mine Water Congress, Melbourne Australia, October 1988
582
IMWA Proceedings 1988 | © International Mine Water Association 2012 | www.IMWA.info
Reproduced from best available copy