Water loss by evaporation from China’s South-North Water...
10
Ecological Engineering 95 (2016) 206–215 Contents lists available at ScienceDirect Ecological Engineering jo ur nal home p ag e: www.elsevier.com/locate/ecoleng Water loss by evaporation from China’s South-North Water Transfer Project Yu-Jun Ma a,b,∗ , Xiao-Yan Li a,b , Maxwell Wilson c , Xiu-Chen Wu a,b , Andrew Smith c , Jianguo Wu a,c a State Key Laboratory of Earth Surface Processes and Resource Ecology, Beijing Normal University, Beijing 100875, China b College of Resources Science and Technology, Beijing Normal University, Beijing 100875, China c School of Life Sciences and School of Sustainability, Arizona State University, Tempe, AZ 85287, USA a r t i c l e i n f o Article history: Received 20 March 2016 Received in revised form 14 June 2016 Accepted 20 June 2016 Keywords: China’s South-North Water Transfer Project Evaporation Penman equation Penman-Monteith equation Priestley-Taylor equation Water loss a b s t r a c t China’s South-North Water Transfer Project (SNWTP) is the longest and largest water transfer project in world history. However, the evaporative loss from SNWTP is still unclear. Here we estimated the water loss by evaporation from the open canal and reservoir of the Middle Route of SNWTP (MR-SNWTP), based on field experiments and three mathematical models (Penman equation, Penman-Monteith equation, and Priestley-Taylor equation). Results showed that the Penman equation was the most reliable model, thus it was used to evaluate the evaporative loss from MR-SNWTP. Under the original planned scenario, average annual evaporative loss from the open canal and accompanying reservoir of MR-SNWTP would be approximately 9.00 × 10 8 m 3 , of which 35.28% results directly from the construction of MR-SNWTP (3.34% of the planned total aqueduct diversion). However, during the first implement year of MR-SNWTP in 2015, the actual total water loss by evaporation was 6.43 × 10 8 m 3 , and the increased evaporative loss was 2.27 × 10 8 m 3 due to the construction of MR-SNWTP, accounting for 8.57% of the actual total aqueduct diversion. This implies that the efficiency of MR-SNWTP from the perspective of water loss would be improved in the future with more water being transferred. Our results demonstrate that there is a general balance between water evaporation and vertical precipitation supplement of MR-SNWTP. © 2016 Elsevier B.V. All rights reserved. 1. Introduction Adequate access to water is essential for human well-being, socio-economic development, and healthy ecosystems. Though the total amount of water available will not diminish on a global scale due to hydrologic cycles, two-thirds of the world population could be under water stress by 2025 because of the uneven distribution of renewable freshwater resources in time and space (FAO, 2014; Oki and Kanae, 2006). The diversion of water from water-rich to water-poor areas has long been a tool to alleviate water stress in water-poor areas, such as the Central Arizona Project in United States (Guan et al., 2011), the Lesotho Highlands Water Project in Lesotho and South Africa (Matete and Hassan, 2006), and the Tagus-Segura Transfer in Spain (Rey et al., 2016). ∗ Corresponding author at: College of Resources Science and Technology, Beijing Normal University, No. 19, Xinjiekouwai Street, Haidian District, Beijing 100875, China. E-mail address: [email protected] (Y.-J. Ma). Water problems are particularly challenging in China, especially in the North China Plain (NCP), which is dominated by dry-land ecosystems and home to significant population, agriculture, and economic centers (Jeremy, 2003). The annual water deficit in the NCP was 43 billion m 3 in 2010, and may reach 48 billion m 3 by 2050 (He et al., 2010). To alleviate the water resource shortage in the NCP, Chinese have developed significant water infrastructure, such as exploitation of more groundwater, desalination of saline waters, rainwater harvesting, wastewater recycling, and interbasin water transfers (Wei et al., 2007; Ma et al., 2008; Wang et al., 2009b). First conceived by Chairman Mao in the 1950s, the South-North Water Transfer Project (SNWTP) represents the grandest attempt to permanently solve the NCP’s water woes. After a 50-year fea- sibility study, the construction of SNWTP began in 2002, aiming to divert 4.5 × 10 10 m 3 /year of water from the Yangtze basin to the NCP via three separate routes (CAB-SNWTP, 2003). The East- ern Route (ER-SNWTP) moves water from the lower Yangtze River along a network of existing rivers, lakes, reservoirs, and canals. The Middle Route (MR-SNWTP) starts at Danjiangkou Reservoir on the Han River, the Yangtze’s longest tributary, and begins to divert water through a new canal in December 2014. The Western http://dx.doi.org/10.1016/j.ecoleng.2016.06.086 0925-8574/© 2016 Elsevier B.V. All rights reserved.
Transcript of Water loss by evaporation from China’s South-North Water...

WP
YJa
b
c
a
ARRA
KCEPPPW
1
stdboOwwSiT
NC
h0
Ecological Engineering 95 (2016) 206–215
Contents lists available at ScienceDirect
Ecological Engineering
jo ur nal home p ag e: www.elsev ier .com/ locate /eco leng
ater loss by evaporation from China’s South-North Water Transferroject
u-Jun Ma a,b,∗, Xiao-Yan Li a,b, Maxwell Wilson c, Xiu-Chen Wu a,b, Andrew Smith c,ianguo Wu a,c
State Key Laboratory of Earth Surface Processes and Resource Ecology, Beijing Normal University, Beijing 100875, ChinaCollege of Resources Science and Technology, Beijing Normal University, Beijing 100875, ChinaSchool of Life Sciences and School of Sustainability, Arizona State University, Tempe, AZ 85287, USA
r t i c l e i n f o
rticle history:eceived 20 March 2016eceived in revised form 14 June 2016ccepted 20 June 2016
eywords:hina’s South-North Water Transfer Projectvaporationenman equationenman-Monteith equation
a b s t r a c t
China’s South-North Water Transfer Project (SNWTP) is the longest and largest water transfer project inworld history. However, the evaporative loss from SNWTP is still unclear. Here we estimated the waterloss by evaporation from the open canal and reservoir of the Middle Route of SNWTP (MR-SNWTP), basedon field experiments and three mathematical models (Penman equation, Penman-Monteith equation,and Priestley-Taylor equation). Results showed that the Penman equation was the most reliable model,thus it was used to evaluate the evaporative loss from MR-SNWTP. Under the original planned scenario,average annual evaporative loss from the open canal and accompanying reservoir of MR-SNWTP wouldbe approximately 9.00 × 10⁸ m3, of which 35.28% results directly from the construction of MR-SNWTP(3.34% of the planned total aqueduct diversion). However, during the first implement year of MR-SNWTP
8 3
riestley-Taylor equationater lossin 2015, the actual total water loss by evaporation was 6.43 × 10 m , and the increased evaporativeloss was 2.27 × 10⁸ m3 due to the construction of MR-SNWTP, accounting for 8.57% of the actual totalaqueduct diversion. This implies that the efficiency of MR-SNWTP from the perspective of water losswould be improved in the future with more water being transferred. Our results demonstrate that thereis a general balance between water evaporation and vertical precipitation supplement of MR-SNWTP.
© 2016 Elsevier B.V. All rights reserved.
. Introduction
Adequate access to water is essential for human well-being,ocio-economic development, and healthy ecosystems. Though theotal amount of water available will not diminish on a global scaleue to hydrologic cycles, two-thirds of the world population coulde under water stress by 2025 because of the uneven distributionf renewable freshwater resources in time and space (FAO, 2014;ki and Kanae, 2006). The diversion of water from water-rich toater-poor areas has long been a tool to alleviate water stress inater-poor areas, such as the Central Arizona Project in United
tates (Guan et al., 2011), the Lesotho Highlands Water Project
n Lesotho and South Africa (Matete and Hassan, 2006), and theagus-Segura Transfer in Spain (Rey et al., 2016).∗ Corresponding author at: College of Resources Science and Technology, Beijingormal University, No. 19, Xinjiekouwai Street, Haidian District, Beijing 100875,hina.
E-mail address: [email protected] (Y.-J. Ma).
ttp://dx.doi.org/10.1016/j.ecoleng.2016.06.086925-8574/© 2016 Elsevier B.V. All rights reserved.
Water problems are particularly challenging in China, especiallyin the North China Plain (NCP), which is dominated by dry-landecosystems and home to significant population, agriculture, andeconomic centers (Jeremy, 2003). The annual water deficit in theNCP was 43 billion m3 in 2010, and may reach 48 billion m3 by 2050(He et al., 2010). To alleviate the water resource shortage in theNCP, Chinese have developed significant water infrastructure, suchas exploitation of more groundwater, desalination of saline waters,rainwater harvesting, wastewater recycling, and interbasin watertransfers (Wei et al., 2007; Ma et al., 2008; Wang et al., 2009b).First conceived by Chairman Mao in the 1950s, the South-NorthWater Transfer Project (SNWTP) represents the grandest attemptto permanently solve the NCP’s water woes. After a 50-year fea-sibility study, the construction of SNWTP began in 2002, aimingto divert 4.5 × 10¹⁰ m3/year of water from the Yangtze basin tothe NCP via three separate routes (CAB-SNWTP, 2003). The East-ern Route (ER-SNWTP) moves water from the lower Yangtze River
along a network of existing rivers, lakes, reservoirs, and canals.The Middle Route (MR-SNWTP) starts at Danjiangkou Reservoiron the Han River, the Yangtze’s longest tributary, and begins todivert water through a new canal in December 2014. The Western
Y.-J. Ma et al. / Ecological Engineering 95 (2016) 206–215 207
F ffect 1a nal. (c
Rbct2ipt(nsap
eWlaAtwiewslwer
(ss
ig. 1. Sketch map of China’s South-North Water Transfer Project. (a) SNWTP will and Tianjin, with a length of 1420 km and 12 national weather stations near the caanal were covered by plastic film and concrete to reduce water seepage.
oute plans to divert water from upper Yangtze River tributaries,ut has not emerged from the planning phase because of compli-ated terrain and ecological concerns. Taken as a whole, SNWTP ishe world’s longest and largest water diversion project (Zhang et al.,009), and will affect 13 provinces in north China (Fig. 1a), cover-
ng 3.57 × 10⁶ km2 area (37.13% of China’s territory), and 5.81 × 10⁸
eople in 2014 (42.63% of China’s population) (NBSC, 2015). Amonghe three routes, MR-SNWTP has attracted significant attentionYan and Chen, 2013; Li et al., 2015), because it is an absolutelyewly-built water diversion project, and has evident economic,ocial and environmental impacts not only on the water-receivingreas (Jeremy, 2003; Barnett et al., 2015), but also on the water-roviding areas (Zhang et al., 2009; Gu et al., 2012; Li et al., 2013).
The construction of large water projects has always been anmotional and controversial issue (WCD, 2000; Yevjevich, 2001;
u et al., 2003; Barnett et al., 2015). One important reason is wateross, which mainly includes evaporation, seepage, and bank stor-ge. For example, in a similar water transfer project, the Centralrizona Project in United States, water loss accounted for 4% of
he total aqueduct diversion in 2012, and 85% of this water lossas resulted from evaporation (CAP, 2013). For MR-SNWTP, pol-
cy makers foresaw these potential losses and rejected the use ofxisting natural channels in favor of a new canal, which is coveredith plastic and concrete in the bottom to limit seepage and bank
torage. The vertical infiltration rate of these cover materials wasess than 1.0 × 10⁻¹¹ cm/s (Wang et al., 2009a), indicating that little
ater will loss by seepage and bank storage. However, mitigatingvaporation, the only main potential water loss from MR-SNWTP,emains a challenge.
Evaporation is observably affected by multi-climatic conditions
Vörösmarty et al., 2000; Roderick and Farquhar, 2002), and thepatiotemporal variations of pan evaporation in China, even in theame subzone, was significant (Zhang et al., 2015). MR-SNWTP3 provinces in the North China Plain. (b) MR-SNWTP crosses Henan, Hebei, Beijingc) The sluice at Taocha, head of MR-SNWTP. Both the bottom and the slope of the
crosses the humid and semi-humid region in China, with a lengthof 1420 km (Fig. 1b), but we have little information on the evapo-rative characteristics along the route as a whole. Until now, therehas been no direct measurement of water evaporation inside thecanal, and measured evaporation within the canal is now admin-istratively difficult as the entire canal is surrounded by enclosuresto limit accessibility. Therefore, we can’t estimate is there any dis-tinct difference of water evaporation inside the canal and at nearbyweather stations, and evaluate the rationality of surrogating theformer one by the later one.
According to the SNWTP administrative plan, after the construc-tion of MR-SNWTP, the maximal impounded level of DanjiangkouReservoir would increase from 157 m to 170 m, expanding itsmaximal water surface area from 813 km2 to 1183 km2. ThoughMR-SNWTP originally planned to transfer 9.5 × 10⁹ m3 water annu-ally from Danjiangkou Reservoir (“planned scenario”), it actuallydiverted approximately 2.65 × 10⁹ m3 water from DanjiangkouReservoir in 2015 (“2015 scenario”), after water transfer officiallystarted on December 12, 2014. Because some supporting facilities inHenan Province and Hebei Province have not been completed, theactual aqueduct diversion under the 2015 scenario was evidentlylower than called for in the planned scenario, and the plannedtotal aqueduct diversion will be achieved gradually in the future(HD, 2015). Due to the lower aqueduct diversion, the actual effi-ciency of MR-SNWTP was argued intensely (XN, 2014). Water lossby evaporation can impact the efficiency of water transfer projectsto a remarkable extent (CAP, 2013), and knowledge gaps still existon water loss from MR-SNWTP under different scenarios and itscorresponding influence on the efficiency of MR-SNWTP.
The objective of this paper was to investigate the open water
evaporative characteristic and water loss by evaporation from MR-SNWTP based on field measurements and mathematical models,and to discuss the efficiency of MR-SNWTP from the perspective of
2 Engine
wmrocM
2
2
cu1if1sttep
niadoistbikes
ww
E
wta(
etss
2
thtwtet
08 Y.-J. Ma et al. / Ecological
ater loss. To our best knowledge, this study is the first to directlyeasure water evaporation inside the canal of MR-SNWTP, and the
esults of this work would fill a knowledge gap in our understandingf water loss from the world’s largest water transfer project, andould be of critical importance for the sustainable management ofR-SNWTP.
. Material and methods
.1. Field experiments
The entire canal of MR-SNWTP consists of 1191 km of openanal from Taocha (Fig. 1c) to the Beijuma River, 75 km of pipingnderground from Beijuma River to Tuancheng Lake in Beijing, and54 km of branch line from Xihei Mountain to Outer Ring River
n Tianjin (93 km aboveground and 61 km underground). There-ore, the evaporative length of the MR-SNWTP is approximately284 km. There are 12 national weather stations with uniformpatial-distribution along the canal of MR-SNWTP, and the dis-ances between the canal and nearby weather stations are all lesshan 30 km (Fig. 1b). Each of these national weather stations isquipped with an evaporation pan (E601B, Jiangsu Naiwch Cor-oration, China).
To assess the difference of evaporation between the canal andearby weather stations, an identical E601B evaporation pan was
nstalled within the canal near four weather stations, i.e. Shiji-zhuang, Xinxiang, Nanyang, and Danjiangkou, respectively, andaily pan evaporation inside the canal was measured simultane-usly with nearby weather stations from 13 to 29 July 2013. The
nstallation of an E601B evaporation pan inside the canal was theame as that at nearby weather stations. First, a pit was dug andhe evaporation barrel was put into the pit, keeping its upperrim aclinic and 30 cm above the land surface. Then, the surround-
ng accessorial ring was installed around the evaporation barrel,eeping its upper brim 7.5 cm lower than the upper brim of thevaporation barrel. Last, both the evaporation barrel and the acces-orial ring were filled with water.
Based on the measured pan evaporation, the measured openater evaporation rate (Em, mm d−1) inside the canal or at nearbyeather stations was expressed by:
m = Em,pan × C (1)
here Em,pan is the measured pan evaporation rate (mm d−1) insidehe canal or at nearby weather stations; C is the pan coefficient,
value that varies by month, with an annual mean value of 0.92Zhao, 2014).
In order to calculate water loss from MR-SNWTP, shape param-ters of the canal, including the bottom elevation, slope angle,otal slope length and bottom width near all 12 national weathertations, were measured directly by GPS locator, compass and mea-uring tape.
.2. Evaporation calculation
Daily meteorological data (including maximum air tempera-ure, minimum air temperature, atmospheric pressure, sunshineours, relative humidity, wind speed, and measured pan evapora-ion) from 2000 to 2014 of all 12 nearby national weather stations
ere collected from China Meteorological Administration. Then,he open water evaporation rate was calculated by the Penmanquation, Penman-Monteith equation, and Priestley-Taylor equa-ion, respectively.
ering 95 (2016) 206–215
2.2.1. Penman equationThe classical form of Penman equation to estimate poten-
tial evaporation from open surface or a wet vegetated surface is(Penman, 1948).
Ec,P = �
� + �× Rn − G
�+ �
� + �× 6.43f(u)(es − ea)
�(2)
where Ec,P is open water evaporation rate calculated by Pen-man equation (mm d−1); � is slope of the saturation vaporpressure-temperature curve (kPa ◦C−1); � is psychrometric con-stant (kPa ◦C−1); Rn is net radiation at the surface (MJ m−2 d−1); Gis heat storage change in water (MJ m−2 d−1), and is not consideredas it has been shown to be largely irrelevant for monthly or dailyestimations in practical hydrological applications (Linacre, 1993);� is latent heat of vaporization (2.45 MJ kg−1); f(u) is wind function;es is saturation vapor pressure (kPa); ea is actual vapor pressure(kPa). The calculation of above parameters is given in the AppendixA.
2.2.2. Penman-Monteith equationPenman-Monteith equation is an extension of Penman equa-
tion and can be applied to a range of surface vegetation (Monteith,1965).
Ec,PM =� (Rn − G) + �aCp(es−ea)
ra× 86400
106
�[� + �
(1 + rs
ra
)] (3)
where Ec,PM is open water evaporation rate calculated by Penman-Monteith equation (mm d−1); �a is the air density (kg m−3); Cp isspecific heat at constant pressure (1013 J kg−1 ◦C−1); ra is aerody-namic resistance (m s−1); rs is bulk surface resistance (m s−1), equalto 0 for water body because the liquid particles are transferredfreely into water vapor without passing through stem and xylem(Mohamed et al., 2012). Other variables are as defined in Eq. (2),and the calculation of �a and ra are given in the Appendix A.
2.2.3. Priestley-Taylor equationThe Priestley-Taylor equation is based on the assumption that
the effect of turbulence is small compared to the effect of radiation,and has been found to accurately estimate the evapotranspirationrates of large regions (Priestley and Taylor, 1972; Tanny et al., 2008).
Ec,PT = D�(Rn − G)�(� + �)
(4)
where Ec,PT is open water evaporation rate calculated by Priestley-Taylor equation (mm d−1); D is a dimensionless parameter, equalto 1.26 over open water and saturated land (Priestley and Taylor,1972). Other variables are as defined in Eq. (2).
2.3. Water loss calculation
The evaporative width of the canal of MR-SNWTP was calculatedusing discharge data collected from the Construction and Admin-istration Bureau of MR-SNWTP, and shape parameters of the canalmeasured as described above.
For an open canal and uniform flow, the hydraulic radius can becalculated by Manning formula (Manning, 1891):
R = V3/2M3/2K (−3/4) (5)
where R is hydraulic radius (m); V is flow velocity (m s−1); M is
canal roughness, 0.015 for concrete surface according to the planof MR-SNWTP; K is hydraulic gradient, approximately equal to thesurface slope, and could be determined on the basis of the surfacetopography (Quinn et al., 1991).
Engine
c
R
w(b
v
V
w
r
W
c
W
w(rmasboleosb
W
W
wiwlbplbeAc
b
W
w(l
el((
Y.-J. Ma et al. / Ecological
According to its definition, the hydraulic radius for a trapeziformanal can also be calculated as (Mayhew, 2015):
= (Wb + Wb + 2L cos ˇ)L sin ˇ
2(W + 2L)(6)
here Wb is bottom width measured directly by measuring tapem); L is wetted slope length (m); ̌ is slope angle measured directlyy compass (◦).
For a trapeziform canal and uniform flow, the average flowelocity can be calculated as follows.
= Q(Wb+Wb+2L cos ˇ)L sin ˇ
2
(7)
here Q is flow rate (m3 s−1).Based on Eqs. (5)–(7), R, V and L can be calculated. Then evapo-
ative width (We, m) inside the canal can be calculated as:
e = Wb + 2L cos ̌ (8)
With this evaporative width, water loss from the whole openanal is calculated by:
LC =12∑i=1
Ec,iWe,ili (9)
here WLC is water loss by evaporation from the whole canalm3 month−1); Ec,i is calculated monthly open water evaporationate inside the canal near weather station i (mm month−1) by the
ost reliable mathematical model (see Section 3.1); We,i is theverage evaporative width of the open canal controlled by weathertation i (m); li is the evaporative length of the open canal controlledy weather station i (km), and was determined by the locationf weather stations and the bisector method, i.e. the meandering
ength of the open canal between two weather stations was dividedqually into two half lengths, and the first half meandering lengthf the open canal was assumed to be controlled by one weathertation while the second half meandering length was assumed toe controlled by the other weather station.
Water loss from the open reservoir was calculated as:
LRp = 1000 × Ec,1 × Ap (10)
LRe = 1000 × Ec,1 × Ae (11)
here Ec,1 is calculated monthly open water evaporation ratenside the canal near Laohekou weather station (mm month−1),
hich is the nearest to Danjiangkou reservoir; WLRp is the wateross by evaporation from previous area of Danjiangkou reservoirefore the construction of MR-SNWTP (m3 month−1); Ap is therevious area of Danjiangkou reservoir (km2); WLRe is the water
oss by evaporation from expanded area of Danjiangkou reservoirecause of the construction of MR-SNWTP (m3 month−1); Ae is thexpanded area of Danjiangkou reservoir (km2). The sum of Ap ande is the actual total area of the Danjiangkou reservoir after theonstruction of MR-SNWTP.
Then, the total water loss by evaporation from MR-SNWTP cane calculated as follows.
L = WLC + WLRp + WLRe (12)
here WL is the total water loss by evaporation from MR-SNWTPm3 month−1), and the sum of WLC and WLRe is the increased wateross because of the construction of MR-SNWTP.
The vertical water input by precipitation to MR-SNWTP was
valuated by the same method as the calculation of total wateross by evaporation, simply replacing open water evaporation rateEc,i) and evaporative width (We,i) in Eqs. (9)–(11) by precipitationPr,i, mm) and top width of the canal controlled by weather stationering 95 (2016) 206–215 209
i (Wt,i, m), respectively. The top width of the canal (Wt , m) can becalculated as:
Wt = Wb + 2Lt cos ̌ (13)
where Lt is the total slope length measured directly by measuringtape (m), and other variables are as defined in Eq. (8).
2.4. Statistical analysis
Comparison between the measured and calculated monthlyopen water evaporation rates was carried out using simple lin-ear regression (Ec,i = �i × Em,i), where Ec,i is calculated open waterevaporation at weather station i (mm month−1), Em,i is measuredopen water evaporation by E601B evaporation pan at weather sta-tion i (mm month−1), and �i is the regression coefficient at weatherstation i. Besides the determination coefficient of this linear regres-sion (Ri
2), root mean square error (RMSEi) and the Nash-Sutcliffeefficiency coefficient (Ci) at weather station i were also calculatedto assess the performance of each model (Nash and Sutcliffe, 1970).
RMSEi =
√√√√ 1m
180∑j=1
(Em,i,j − Ec,i,j)2 (14)
Ci = 1 −
180∑j=1
(Em,i,j − Ec,i,j)2
180∑j=1
(Em,i,j − Em,i,j)2
(15)
where Em,i and Ec,i are as previously defined; subscript j indicatesdifferent monthly values and over bar indicates an average over themeasurement period; 180 is the total number of months from 2000to 2014.
3. Results
3.1. Model performance
There are two steps for the calculation of open water evap-oration inside the canal. The first step is to choose a reliablemathematical model to calculate open water evaporation at nearbyweather stations of MR-SNWTP, and the second step is to transferopen water evaporation at nearby weather stations to open waterevaporation inside the canal. For the first step, monthly evapora-tion data from 2000 to 2014 were used to assess the performance ofthe Penman equation, Penman-Monteith equation, and Priestley-Taylor equation. Simple linear regression suggests that there wasa good agreement between open water evaporation calculated byPenman equation and the measured value (Table 1). For the 12national weather stations, root mean square error (RMSE) values forthe Penman equation were all less than 15 mm month−1, and therelative errors of the calculated monthly open water evaporationrate using the Penman equation were all lower than 10%, with anaverage value of 1.1%, indicating a near perfect approximation. Boththe Penman-Monteith equation and the Priestley-Taylor equa-tion underestimated the open water evaporation, with an averageRMSE of 13.72 mm month−1 and 16.27 mm month−1, respectively.Average Nash-Sutcliffee values of the Penman equation, Penman-Monteith equation, and Priestley-Taylor equation for all 12 weather
stations are 0.87, 0.86 and 0.81, respectively, indicating that thePenman equation better modeled actual open water evaporationthan the Penman-Monteith or Priestley-Taylor methods. In general,the Penman equation was the most reliable model, thus it was used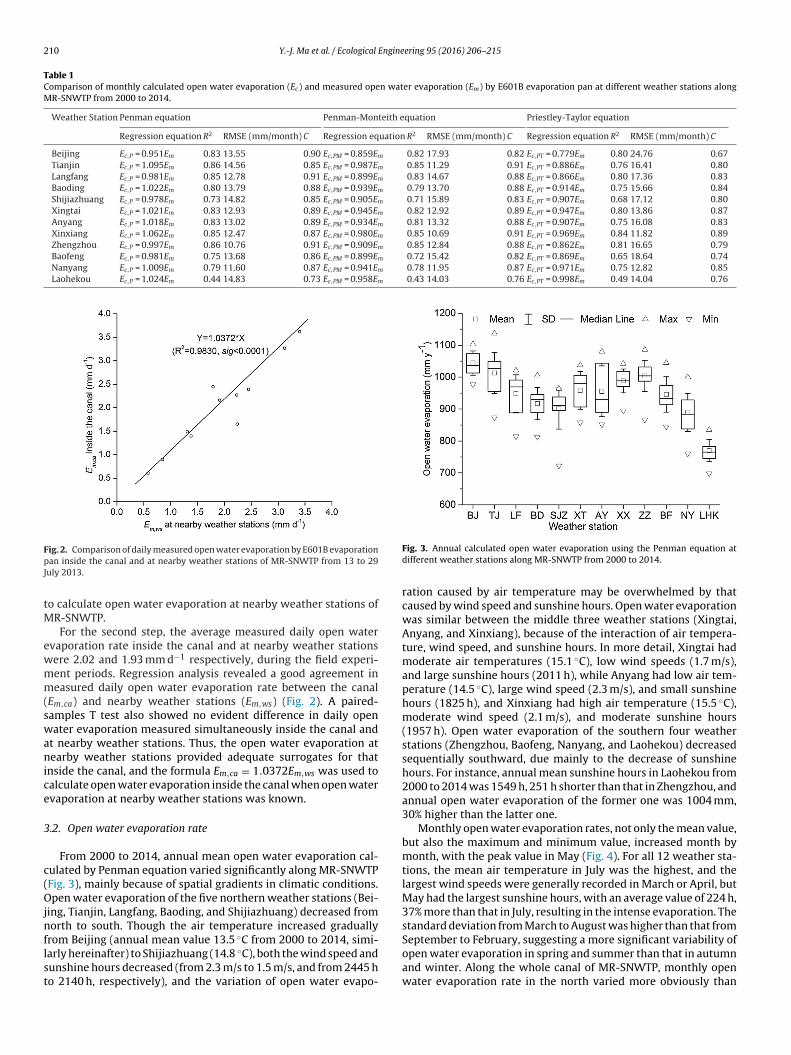
210 Y.-J. Ma et al. / Ecological Engineering 95 (2016) 206–215
Table 1Comparison of monthly calculated open water evaporation (Ec) and measured open water evaporation (Em) by E601B evaporation pan at different weather stations alongMR-SNWTP from 2000 to 2014.
Weather Station Penman equation Penman-Monteith equation Priestley-Taylor equation
Regression equation R2 RMSE (mm/month) C Regression equation R2 RMSE (mm/month) C Regression equation R2 RMSE (mm/month) C
Beijing Ec,P = 0.951Em 0.83 13.55 0.90 Ec,PM = 0.859Em 0.82 17.93 0.82 Ec,PT = 0.779Em 0.80 24.76 0.67Tianjin Ec,P = 1.095Em 0.86 14.56 0.85 Ec,PM = 0.987Em 0.85 11.29 0.91 Ec,PT = 0.886Em 0.76 16.41 0.80Langfang Ec,P = 0.981Em 0.85 12.78 0.91 Ec,PM = 0.899Em 0.83 14.67 0.88 Ec,PT = 0.866Em 0.80 17.36 0.83Baoding Ec,P = 1.022Em 0.80 13.79 0.88 Ec,PM = 0.939Em 0.79 13.70 0.88 Ec,PT = 0.914Em 0.75 15.66 0.84Shijiazhuang Ec,P = 0.978Em 0.73 14.82 0.85 Ec,PM = 0.905Em 0.71 15.89 0.83 Ec,PT = 0.907Em 0.68 17.12 0.80Xingtai Ec,P = 1.021Em 0.83 12.93 0.89 Ec,PM = 0.945Em 0.82 12.92 0.89 Ec,PT = 0.947Em 0.80 13.86 0.87Anyang Ec,P = 1.018Em 0.83 13.02 0.89 Ec,PM = 0.934Em 0.81 13.32 0.88 Ec,PT = 0.907Em 0.75 16.08 0.83Xinxiang Ec,P = 1.062Em 0.85 12.47 0.87 Ec,PM = 0.980Em 0.85 10.69 0.91 Ec,PT = 0.969Em 0.84 11.82 0.89Zhengzhou Ec,P = 0.997Em 0.86 10.76 0.91 Ec,PM = 0.909Em 0.85 12.84 0.88 Ec,PT = 0.862Em 0.81 16.65 0.79Baofeng Ec,P = 0.981Em 0.75 13.68 0.86 Ec,PM = 0.899Em 0.72 15.42 0.82 Ec,PT = 0.869Em 0.65 18.64 0.74Nanyang Ec,P = 1.009Em 0.79 11.60 0.87 Ec,PM = 0.941Em 0.78 11.95 0.87 Ec,PT = 0.971Em 0.75 12.82 0.85Laohekou Ec,P = 1.024Em 0.44 14.83 0.73 Ec,PM = 0.958Em 0.43 14.03 0.76 Ec,PT = 0.998Em 0.49 14.04 0.76
FpJ
tM
ewmm(swanice
3
c(Ojnflst
ig. 2. Comparison of daily measured open water evaporation by E601B evaporationan inside the canal and at nearby weather stations of MR-SNWTP from 13 to 29
uly 2013.
o calculate open water evaporation at nearby weather stations ofR-SNWTP.
For the second step, the average measured daily open watervaporation rate inside the canal and at nearby weather stationsere 2.02 and 1.93 mm d−1 respectively, during the field experi-ent periods. Regression analysis revealed a good agreement ineasured daily open water evaporation rate between the canalEm,ca) and nearby weather stations (Em,ws) (Fig. 2). A paired-amples T test also showed no evident difference in daily openater evaporation measured simultaneously inside the canal and
t nearby weather stations. Thus, the open water evaporation atearby weather stations provided adequate surrogates for that
nside the canal, and the formula Em,ca = 1.0372Em,ws was used toalculate open water evaporation inside the canal when open watervaporation at nearby weather stations was known.
.2. Open water evaporation rate
From 2000 to 2014, annual mean open water evaporation cal-ulated by Penman equation varied significantly along MR-SNWTPFig. 3), mainly because of spatial gradients in climatic conditions.pen water evaporation of the five northern weather stations (Bei-
ing, Tianjin, Langfang, Baoding, and Shijiazhuang) decreased fromorth to south. Though the air temperature increased gradually
rom Beijing (annual mean value 13.5 ◦C from 2000 to 2014, simi-arly hereinafter) to Shijiazhuang (14.8 ◦C), both the wind speed andunshine hours decreased (from 2.3 m/s to 1.5 m/s, and from 2445 ho 2140 h, respectively), and the variation of open water evapo-
Fig. 3. Annual calculated open water evaporation using the Penman equation atdifferent weather stations along MR-SNWTP from 2000 to 2014.
ration caused by air temperature may be overwhelmed by thatcaused by wind speed and sunshine hours. Open water evaporationwas similar between the middle three weather stations (Xingtai,Anyang, and Xinxiang), because of the interaction of air tempera-ture, wind speed, and sunshine hours. In more detail, Xingtai hadmoderate air temperatures (15.1 ◦C), low wind speeds (1.7 m/s),and large sunshine hours (2011 h), while Anyang had low air tem-perature (14.5 ◦C), large wind speed (2.3 m/s), and small sunshinehours (1825 h), and Xinxiang had high air temperature (15.5 ◦C),moderate wind speed (2.1 m/s), and moderate sunshine hours(1957 h). Open water evaporation of the southern four weatherstations (Zhengzhou, Baofeng, Nanyang, and Laohekou) decreasedsequentially southward, due mainly to the decrease of sunshinehours. For instance, annual mean sunshine hours in Laohekou from2000 to 2014 was 1549 h, 251 h shorter than that in Zhengzhou, andannual open water evaporation of the former one was 1004 mm,30% higher than the latter one.
Monthly open water evaporation rates, not only the mean value,but also the maximum and minimum value, increased month bymonth, with the peak value in May (Fig. 4). For all 12 weather sta-tions, the mean air temperature in July was the highest, and thelargest wind speeds were generally recorded in March or April, butMay had the largest sunshine hours, with an average value of 224 h,37% more than that in July, resulting in the intense evaporation. Thestandard deviation from March to August was higher than that from
September to February, suggesting a more significant variability ofopen water evaporation in spring and summer than that in autumnand winter. Along the whole canal of MR-SNWTP, monthly openwater evaporation rate in the north varied more obviously than
Y.-J. Ma et al. / Ecological Engineering 95 (2016) 206–215 211
equation at different weather stations along MR-SNWTP from 2000 to 2014.
taL
3
RitsdhwoettDiFatdac
Fig. 4. Monthly calculated open water evaporation using the Penman
hat in the south. For example, the ratio between the maximumnd minimum value of monthly open water evaporation rate inangfang was 3.67, while it was only 2.36 in Laohekou.
.3. Water loss by evaporation
Under the planned scenario, the water level of Danjiangkoueservoir will begin to reduce in May, reaching the lowest levels
n July to alleviate summer floods, and maintain high levels in win-er and spring to supply sufficient water for diversion. Influencedimultaneously by the water level of Danjiangkou Reservoir and theispatch scheme of MR-SNWTP, the planned discharge at Taocha,ead of MR-SNWTP, is higher in summer and autumn, and lower ininter and spring. Under the 2015 scenario, the actual water level
f Danjiangkou Reservoir varied from 152.28 m to 159.23 m, lowervidently than the planned maximal impounded level (170 m), andhe corresponding total water surface area ranged from 693 km2
o 859 km2, with a generally decreasing trend from January toecember (Fig. 5). In 2015, the actual mean discharge at Taocha
s approximately equal to 60 m3 s−1 in the prior three months.rom April to June, more than 6.60 × 10⁸ m3 water was transferred,nd the mean discharge at Taocha was about 83 m3 s−1. From July
o October, 1.03 × 10⁹ m3 water was transferred with an averageischarge at Taocha of 97 m3 s−1. From November to December,pproximately 4.91 × 10⁸ m3 water was transferred and mean dis-harge at Taocha was about 93 m3 s−1.Fig. 5. Monthly mean discharge at Taocha and monthly mean area of DanjiangkouReservoir under the 2015 scenario.
The evaporative width of the canal varies significantly along MR-SNWTP, interactively affected by the discharge, landform, soil, andother factors. Because water is transferred through underground
pipes in Beijing, both the evaporative width and the water loss byevaporation in Beijing were neglected. For the other 11 sampledsites, evaporative width generally decreases from Taocha (about45 m) to Tianjin (about 23 m), except Nanyang and Xinxiang with a
212 Y.-J. Ma et al. / Ecological Engineering 95 (2016) 206–215
Fu
sfitmZo
fMlaotw(pc5itft2
ig. 6. Monthly calculated evaporative width at different sites along MR-SNWTPnder the 2015 scenario.
harp decrease (Fig. 6). The planned discharge at Xinxiang accountor about 84% of that at Zhengzhou, but its bottom width of the canals only 15 m, 5 m narrower than that of Zhengzhou, due to construc-ion limitations caused by the roads along the canal. Therefore, the
onthly mean evaporative width decreases from 30.0–34.5 m athengzhou to 24.0–28.0 m at Xinxiang. The reason for the decreasef evaporative width at Nanyang is similar.
Under the planned scenario and mean climatic conditionsrom 2000 to 2014, the total water loss by evaporation from
R-SNWTP was 9.00 × 10⁸ m3 (Fig. 7a), and the increased wateross directly due to MR-SNWTP construction (from the canalnd expanded reservoir) was approximately 3.17 × 10⁸ m3, 3.34%f the planned total aqueduct diversion (9.5 × 10⁹ m3). Underhe 2015 scenario, the actual total water loss by evaporationas 6.43 × 10⁸ m3, 24.26% of the aqueduct diversion in 2015
2.65 × 10⁹ m3), significantly higher than the proportion under thelanned scenario. Among the total evaporation loss in 2015, theanal, previous reservoir, and expanded reservoir accounted for.98%, 64.61%, and 29.41%, respectively (Fig. 7b), indicating the
ncreased water loss directly resulting from MR-SNWTP construc-
ion was approximately 2.27 × 10⁸ m3. Therefore, when water lossrom the previously existing reservoir is subtracted, new construc-ion caused the loss of 8.57% of the actual aqueduct diversion in015. Water loss by evaporation from MR-SNWTP followed a sea-Fig. 7. Monthly water loss by evaporation from the canal and reservoir of MR
Fig. 8. Comparison of monthly evaporation loss and precipitation of MR-SNWTPunder the planned scenario.
sonal cycle with the peaking value in May, as a result of higherevaporation rate (Fig. 4) and larger evaporative area (Fig. 5).
Under the planned scenario and mean precipitation of allnearby national weather stations of MR-SNWTP from 2000 to 2014,approximately 8.64 × 10⁸ m3 water will fall directly into the reser-voir and canal of MR-SNWTP every year (Fig. 8). Evaporation ishigher than precipitation in spring and winter, and lower than pre-cipitation in summer, especially in July and August. In autumn,there is no evident difference between them. At an annual scale,the variability of precipitation is much stronger than that of evap-oration, especially in July and August.
4. Discussion
This study showed that open water evaporation rate decreasedgenerally from north to south along MR-SNWTP, and was affectedsynchronously by energy, aerodynamic, and heat conditions, sim-ilar to the findings of ER-SNWTP in Jiangsu Province (Qiu et al.,2011). Correlation analysis revealed that open water evaporationrate has a significant positive relation with air temperature, wind
speed and sunshine hours, and a significant negative relation withvapor pressure. However, there was no evident difference of vaporpressure along the MR-SNWTP, indicating that the variation of openwater evaporation between different weather stations is mainly-SNWTP. (a) Under the planned scenario. (b) Under the 2015 scenario.

Engine
dht1wwlTtflwt“i(cb
odobQ6tJlmttcxocld2h0aFwftwmw
esttTtmmidattfis5o
Y.-J. Ma et al. / Ecological
ue to the difference of air temperature, wind speed and sunshineours. The results of sensitivity analysis (Zhan et al., 1996) showedhat, under the mean climatic conditions from 2000 to 2014, with◦C, 0.1 m/s and 100 h increase of annual mean air temperature,ind speed, and sunshine hours, the open water evaporationill increase 0.64% ± 0.28% (average ± standard deviation, simi-
arly hereinafter), 1.21% ± 0.19%, and 1.48% ± 0.15%, respectively.aking Beijing and Shijiazhuang for example, annual mean airemperature, wind speed, and sunshine hours of the former onerom 2000 to 2014 were 1.3 ◦C lower, 0.8 m/s higher and 305 harger than the latter one, respectively, and the difference of open
ater evaporation between these two sites caused by air tempera-ure (−0.83% ± 0.36% of annual open water evaporation in Beijing,+” indicates increase and “−” indicates decrease, similarly here-nafter) would be overwhelmed by that caused by wind speed+9.68% ± 1.52%) and sunshine hours (+4.51% ± 0.46%), and this isonsistent with the actual difference of open water evaporationetween them (+13.67%).
The findings of this study demonstrate that water loss by evap-ration from MR-SNWTP accounts for 9.47% of the total aqueductiversion under the planned scenario, which is higher than thatf the Central Arizona Project in United States (3.60%, CAP 2013),ut lower than that of ER-SNWTP in Jiangsu Province (17.46%,iu et al., 2011). Of this total evaporative loss, approximately5% was from the previous reservoir, and less than 6% was fromhe canal, which was consistent with the finding of ER-SNWTP iniangsu Province (Qiu et al., 2011). From the perspective of wateross, the efficiency of MR-SNWTP will improve in the future with
ore water diversion. Taking the canal for example, we know thathe variation of flow rate (�Q , m3 s−1) is more significant thanhe variation of evaporative width (�We, m) for a trapeziformanal (�Q = −Vtgˇ(�We
2 + 2We�We)/4), indicating that with a% increase of water diversion, the increase percentage of evap-rative width and accompanying evaporative loss from the openanal will be lower evidently than x%, thus the proportion of wateross by canal evaporation accounting for total water diversion willecrease. For MR-SNWTP, water diversion increased 3.6 times from.65 × 109 m3 (2015 scenario) to 9.5 × 10⁹ m3 (planned scenario),owever, water loss from the canal only increased 1.4 times from.38 × 108 m3 to 0.52 × 10⁸ m3, and the corresponding percentageccounting for total water diversion decreased from 1.43% to 0.55%.or the reservoir, the percentage of evaporation accounting for theater resources available from small reservoirs was more than that
rom large ones (Maestre-Valero et al., 2013), indicating that withhe rise of water level in Danjiangkou Reservoir, the percentage ofater lost to evaporation by reservoir will decrease. Therefore, theore water is transferred, the lower proportion of water diversionill evaporate.
Though water loss by evaporation from the MR-SNWTP can bestimated by field experiments and the Penman equation, there aretill some uncertainties. First, the formula (Em,ca = 1.0372Em,ws) forransferring open water evaporation at nearby weather stations tohat in the canal was based on limited field data measured in July.hough water loss from the canal accounted for less than 6% ofotal water loss from the MR-SNWTP, the utilization of this for-
ula for other months may lead to some misestimates. Therefore,ore field measurements in different seasons are necessary to val-
date and perfect this formula. Second, the canal width may beifferent from one site to another along the MR-SNWTP, and theverage width controlled by a given weather station was assumedo be equal to the canal width near it, which could have leado misestimates of water loss from the canal. According to the
eld measurements, the canal width near all the national weathertations varied from 50.0 m to 68.3 m, with an average value of6.1 m, and the relative deviation can achieve approximately 16.3%f water loss from the canal due to the change of canal widthering 95 (2016) 206–215 213
between the maximum and minimum value, i.e. less than 1% oftotal water loss from the MR-SNWTP, indicating that the assump-tion about the canal width was acceptable. Third, this study onlyanalyzed the efficiency of the MR-SNWTP from the perspective ofwater loss, but its integrated efficiency about economy, ecology andenvironment remains unclear (Barnett et al., 2015). Some previousstudies show that while the SNWTP is diverting water from southto north, inefficient agricultural production consumes about 75%of the water resources in the NCP (Barnett et al., 2015), and over69% of the reaches in the NCP are unable to support fisheries andwildlife owing to water pollution (He et al., 2007). Therefore, how toimprove the water use efficiency of the MR-SNWTP needs furtherresearch. Fourth, this study only considered the vertical supple-ment of precipitation falling into the open reservoir and canal,however surface runoff and groundwater flow were also importantwater supplements to the MR-SNWTP, which have to be studieddeeply in the future based on field experiments and hydrologicalmodels. Moreover, though the total amount of precipitation wasgenerally in balance with water loss by evaporation from 2000 to2014, its variability was higher than that of evaporation, indicatingthat water loss by evaporation in some months or years may behigher than the contemporaneous precipitation, and this should beconsidered for the sustainable management of the MR-SNWTP.
5. Conclusions
This study provides a first exploration of water loss by evap-oration from the MR-SNWTP based on field measurements andmathematical models. The results of this work fill a knowledge gapin our understanding of water loss from the world’s largest watertransfer project, and could be of critical importance for the sustain-able management of the MR-SNWTP and water resources in theNCP. The key findings of this study are summarized as:
(1) Annual open water evaporation along the MR-SNWTPdecreased from north to south, and was affected synchronouslyby energy, aerodynamic, and heat conditions. Monthly openwater evaporation was the highest in May, and was more vari-able in the north than that in the south.
(2) Under the planned scenario, the total water loss by evapora-tion was approximately 9.00 × 10⁸ m3, of which 35.28% directlyresulted from the construction of the MR-SNWTP. Under the2015 scenario, about 6.43 × 10⁸ m3 water was lost to evapora-tion, and the canal and expanded reservoir accounted for 5.98%and 29.41% of this value, respectively.
(3) The proportion of increased water loss by evaporationaccounted for 8.57% the aqueduct diversion under the 2015 sce-nario, and was significantly higher than that under the plannedscenario (3.34%). The efficiency of the MR-SNWTP from the per-spective of water loss will improve in the future with morewater being transferred.
Conflict of interest
The authors declare that they have no conflict of interest.
Acknowledgements
We would like to thank two anonymous reviewers for theirvaluable and constructive comments, and Yuyang Bao and Nan-
huanuowa Zhu for their assistance in performing experiments. Thiswork was supported by National Geographic Air and Water Conser-vation Fund (GEFC08-12) and the National Science Foundation ofChina (NSFC 41301013 and 91425301).
2 Engine
A
a1
�
T
wa
�
wPw(
tw
R
R
R
R
d
R
d
ı
ω
N
wd˛oadirt(aR(toBri
f
14 Y.-J. Ma et al. / Ecological
ppendix A.
The slope of the relationship between saturation vapor pressurend temperature, �, at a given temperature is given by (Allen et al.,998).
=4098
[0.6108 exp
(17.27TaTa+237.3
)](Ta + 237.3)2
(A.1)
a = Tmax + Tmin
2(A.2)
here Ta is daily mean air temperature (◦C); Tmax is daily maximumir temperature (◦C); Tmin is daily minimum air temperature (◦C).
The psychrometric constant, � , is given by:
= CpP
ε�= 0.665 × 10⁻³P (A.3)
here Cp is specific heat at constant pressure (1013 J kg−1 ◦C−1); is atmospheric pressure (kPa); ε is ratio molecular weight ofater vapor to dry air (0.622); � is latent heat of vaporization
2.45 MJ kg−1).The net radiation at the surface, Rn, is the difference between
he incoming net short wave radiation and the outgoing net longave radiation (Allen et al., 1998; Valiantzas, 2006).
n = Rns − Rnl (A.4)
ns = (1 − ˛)Rs (A.5)
s =(as + bs
n
N
)Ra (A.6)
a = 24 × 60
Gscdr[ωs sin(�) sin(ı) + sin(ωs) cos(�) cos(ı)] (A.7)
r = 1 + 0.033 cos(
2365
J)
(A.8)
so = (0.75 + 2 × 10⁻⁵Z)Ra (A.9)
r = 1 + 0.033 cos(
2365
J)
(A.10)
= 0.409 sin(
2365
J − 1.39)
(A.11)
s = arccos(− tan(�) tan(ı)) (A.12)
= 24ωs (A.13)
here Rns is the incoming net short wave radiation (MJ m−2
−1); Rnl is the outgoing net long wave radiation (MJ m−2 d−1); is reflection coefficient or albedo, and a typical value of ̨ forpen water surfaces is 0.08 (Allen et al., 1998); Rs is solar radi-tion (MJ m−2 d−1); n is actual duration of sunshine hours peray (h); N is the maximum possible duration of daylight (h); as
s regression constant, expressing the fraction of extraterrestrialadiation reaching the earth on overcast days (n = 0), as + bs is frac-ion of extraterrestrial radiation reaching the earth on clear daysn = N), as and bs are calculated based on the actual solar radi-tion data in Beijing, Zhengzhou and Nanyang weather stations;a is extraterrestrial radiation (MJ m−2 d−1); Gsc is solar constant0.082 MJ m−2 min−1); dr is relative distance between the earth andhe sun; ωs is the sunset hour angle (radians); � is the latitudef the site (radians); ı is solar declination (radians); � is Stefan-oltzmann constant (4.903 × 10⁻⁹ MJ K−4 m−2 d−1); Rso is clear skyadiation (MJ m−2 d−1); Z is station altitude above sea level (m); J
s the number of Julian day.Wind function, f(u), is given by:
(u) = a + bU2 (A.14)
ering 95 (2016) 206–215
where a and b are wind function coefficients; U2 is wind speedat 2 m height (m s−1). For the original Penman (1948) equation,a = 1, b = 0.536. Later, Penman (1956) suggested a reduction ofthe original function by proposing a = 0.5 and b = 0.536. Linacre(1993) reduced further the value of the wind function proposing a =0 and b = 0.536, which were used for the calculation of evaporationin this paper.
Saturation vapor pressure, es, and actual vapor pressure, ea, aregiven by (Allen et al., 1998):
es =0.6108 exp
(17.27TmaxTmax+237.3
)+0.6108 exp
(17.27TminTmin+237.3
)
2(A.15)
ea = RH
100es (A.16)
where RH is daily mean relative humidity (%).
�a = 1.293 × P
101.325× 273.15Ta + 273.15
(A.17)
ra =ln
(Zm−dZom
)ln
(Zh−dZoh
)
k2U2(A.18)
where Zm is the height of wind measurements (m); d is zero-plane displacement height (m), and it is common to use d = 0 forwater surfaces (Tanny et al., 2008); Zom is the roughness lengthfor momentum transfer (m), equal to 2 × 10⁻⁴ m for open water(Mohamed et al., 2012); Zh is the height of humidity measurements(m); Zoh is the roughness length for vapor and heat transfer (m),equal to 2 × 10⁻⁵ m for open water (Mohamed et al., 2012); k thevan Karman constant (0.41).
References
Allen, R.G., Pereira, L.S., Raes, D., Smith, M., 1998. CropEvapotranspiration—Guidelines for Computing Crop Water Requirements. FAOIrrigation and Drainage Paper 56, Rome.
Barnett, J., Rogers, S., Webber, M., Finlayson, B., Wang, M., 2015. Transfer projectcannot meet China’s water needs. Nature 527, 295–297.
Construction and Administration Bureau of South to North Water Transfer Project,Ministry of Water Resources of China (CAB-SNWTP), 2003. Introduction ofsouth to north water transfer project’s plan. China Water Resour., 56–62 (InChinese).
Central Arizona Project (CAP) 2013. System water losses for 2012.Food and Agriculture Organization of the United Nations (FAO), 2014. Water and
Poverty, An Issue of Life and Livelihoods. http://www.fao.org/nr/water/issues/topics scarcity poverty.html.
Gu, W.Q., Shao, D.G., Jiang, Y.F., 2012. Risk evaluation of water shortage in sourcearea of Middle Route Project for South-North water transfer in China. WaterResour. Manage. 26, 3479–3493.
Guan, G., Clemmens, A.J., Kacerek, T.F., Wahlin, B.T., 2011. Applying water-leveldifference control to central arizona project. J. Irrig. Drain. Eng. 137, 747–753.
Hubei Daily (HD), 2015. One Year After the Officially Running of the Middle Routeof South-North Water Transfer Project (In Chinese) http://hbrb.cnhubei.com/HTML/hbrb/20151212/hbrb2800583.html.
He, C.S., Cheng, S.K., Luo, Y., 2007. Water diversions and china’s water shortagecrisis. In: Robinson, P.J., Jones, T., Woo, M.K. (Eds.), Managing Water Resourcesin a Changing Physical and Social Environment, 007. IGU Home of GeographyPublication Series, Rome, pp. 89–102.
He, C.S., He, X.Y., Fu, L., 2010. China’s South-to-North Water Transfer Project: is itneeded? Geogr. Compass 4, 1312–1323.
Jeremy, B., 2003. China: the South-North Water Transfer Project—is it justified?Water Policy 5, 1–28.
Li, B.S., Zhou, P.J., Wang, X.Y., Zhu, L.D., 2013. Opportunities and eco-environmentalof cascade hydropower development and water diversion projects in Hanjiangriver basin. J. Geol. Soc. India 82, 692–700.
Li, L.C., Zhang, L.P., Xia, J., Gippe, C.J., Wang, R.C., Zeng, S.D., 2015. Implications ofmodelled climate and land cover changes on runoff in the Middle Route of theSouth to North Water Transfer Project in China. Water Resour. Manage. 29,2563–2579.
Linacre, E.T., 1993. Data-sparse estimation of lake evaporation, using a simplifiedPenman equation. Agric. For. Meteorol. 64, 237–256.
Ma, W.J., Mao, Z.Q., Yu, Z.R., Mensvoort, M.E.F.V., Driessen, P.M., 2008. Effects ofsaline water irrigation on soil salinity and yield of winter wheat–maize inNorth China Plain. Irrig. Drain. Syst. 22, 3–18.
Maestre-Valero, J.F., Martínez-Granados, D., Martínez-Alvarez, V., Calatrava, J.,2013. Socio-economic impact of evaporation losses from reservoirs under past,

Engine
M
M
M
M
M
N
N
O
P
PP
Q
Q
R
R
T
of pan evaporation in China during 1960–2005: changing patterns and causes.Int. J. Climatol. 35, 903–912.
Zhao, J.Y., 2014. Analysis of the loss of water surface evaporation and its variationcharacteristics in Zhuzhuang Reservoir. South-to-North Water Transf. WaterSci. Technol. 12, 147–150 (In Chinese with English abstract).
Y.-J. Ma et al. / Ecological
current and future water availability scenarios in the semi-arid segura basin.Water Resour. Manage. 27, 1411–1426.
anning, R., 1891. On the flow of water in open channels and pipes. Trans. Inst.Civil Eng. Irel. 20, 161–207.
atete, M., Hassan, R., 2006. Integrated ecological economics accounting approachto evaluation of inter-basin water transfers: an application to the LesothoHighlands Water Project. Ecol. Econ. 60, 246–259.
ayhew, S., 2015. A Dictionary of Geography, 5th ed. Oxford University Press,London.
ohamed, Y.A., Bastiaanssen, W.G.M., Savenije, H.H.G., van den Hurk, B.J.J.M.,Finlayson, C.M., 2012. Wetland versus open water evaporation: an analysis andliterature review. Phys. Chem. Earth 47–48, 114–121.
onteith, J.L., 1965. Evaporation and environment. In: Proceedings of the 19thSymposium of the Society for Experimental Biology, Cambridge UniversityPress, New York, pp. 205–233.
ational Bureau of Statistics of China (NBSC), 2015. China Statistical Yearbook2015. China Statistics Press, Beijing (In Chinese).
ash, J.E., Sutcliffe, J.V., 1970. River flow forecasting through conceptual modelspart I—a discussion of principles. J. Hydrol. 10, 282–290.
ki, T., Kanae, S., 2006. Global hydrological cycles and world water resources.Science 313, 1068–1072.
enman, H.L., 1948. Natural evaporation from open water, bare soil and grass. Proc.R. Soc. Lond.: Ser. A 193, 120–145.
enman, H.L., 1956. Evaporation: an introductory survey. Neth. J. Agric. Sci. 4, 9–29.riestley, C.H.B., Taylor, R.J., 1972. On the assessment of surface heat flux and
evaporation using large-scale parameters. Mon. Weather Rev. 100, 81–92.iu, B.Y., Wang, F., Feng, X.L., Huang, H.T., Yang, X.L., 2011. Effects of water surface
evaporation on water transfer efficiency for Jiangsu section of South-to-NorthWater Diversion Project. J. Drain. Irrig. Mach. Eng. 29, 219–223 (In Chinesewith English abstract).
uinn, P., Beven, K., Chevallier, P., Planchon, O., 1991. The prediction of hillslopeflow paths for distributed hydrological modelling using digital terrain models.Hydrol. Process. 5, 59–79.
ey, D., Garrido, A., Calatrava, J., 2016. An innovative option contract for allocatingwater in inter-basin transfers: the case of the Tagus-Segura Transfer in Spain.Water Resour. Manage. 30, 1165–1182.
oderick, M.L., Farquhar, G.D., 2002. The cause of decreased pan evaporation overthe past 50 years. Science 298, 1410–1411.
anny, J., Cohen, S., Assouline, S., Lange, F., Grava, A., Berger, D., Teltch, B., Parlange,M.B., 2008. Evaporation from a small water reservoir: direct measurementsand estimates. J. Hydrol. 351, 218–229.
ering 95 (2016) 206–215 215
Vörösmarty, C.J., Green, P., Salisbury, J., Lammers, R.B., 2000. Global waterresources: vulnerability from climate change and population growth. Science289, 284–288.
Valiantzas, J.D., 2006. Simplified versions for the Penman evaporation equationusing routine weather data. J. Hydrol. 331, 690–702.
World Commission on Dams (WCD), 2000. Dams and Development: A NewFramework for Decision-making. Earthscan Publications, London.
Wang, C.Y., Yu, L.S., Ma, B., Jiang, R.G., 2009a. Composite geomembrane’santi-seepage application in SNWD. Water Conserv. Sci. Technol. Econ. 15,738–739 (In Chinese with English abstract).
Wang, Y.J., Xie, Z.K., Malhi, S.S., Vera, C.L., Zhang, Y.B., Wang, J.N., 2009b. Effects ofrainfall harvesting and mulching technologies on water use efficiency and cropyield in the semi-arid Loess Plateau, China. Agric. Water Manage. 96, 374–382.
Wei, Y.Q., Davidson, B., Chen, D.L., White, R., Li, B.G., Zhang, J.B., 2007. Cancontingent valuation be used to measure the in situ value of groundwater onthe North China Plain? Water Resour. Manage. 21, 1735–1749.
Wu, J.G., Huang, J.H., Han, X.G., Xie, Z.Q., Gao, X.M., 2003. Three-GorgesDam—experiment in habitat fragmentation? Science 300, 1239–1240.
Xinhua News (XN), 2014. Is the South-North Water Transfer Project Failed? (InChinese) http://news.xinhuanet.com/politics/2014-12/27/c 1113798357.htm.
Yan, B.W., Chen, L., 2013. Coincidence probability of precipitation for the middleroute of South-to-North water transfer project in China. J. Hydrol. 499, 19–26.
Yevjevich, V., 2001. Water diversions and interbasin transfers. Water Int. 26,342–348.
Zhan, X., Kustas, W.P., Humes, K.S., 1996. An intercomparison study on models ofsensible heat flux over partial canopy surfaces with remotely sensed surfacetemperature. Remote Sens. Environ. 58, 242–256.
Zhang, Q.F., Xu, Z.F., Shen, Z.H., Li, S.Y., Wang, S.S., 2009. The Han River watershedmanagement initiative for the South-to-North Water Transfer project (MiddleRoute) of China. Environ. Monit. Assess. 148, 369–377.
Zhang, Q., Qi, T.Y., Li, J.F., Singhe, V.P., Wang, Z.Z., 2015. Spatiotemporal variations