Water Infrastructure Presentation
24
OHIO’S WATER & SEWER INFRASTRUCTURE NEEDS SEPTEMBER 2016 Jon Honeck, PhD Senior Policy Fellow Greater Ohio Policy Center
-
Upload
greaterohio -
Category
Presentations & Public Speaking
-
view
93 -
download
0
Transcript of Water Infrastructure Presentation

OHIO’S WATER & SEWER
INFRASTRUCTURE NEEDS
SEPTEMBER 2016
Jon Honeck, PhDSenior Policy Fellow
Greater Ohio Policy Center

ABOUT US: GREATER OHIO POLICY CENTER (GOPC)
An outcome-oriented statewide non-profit organization that champions revitalization and sustainable redevelopment in Ohio :
Neighborhood Revitalization
Regional Growth
Transportation & Infrastructure Modernization
Urban Regeneration

Drinking water and wastewater usually separate utilities
Can be organized as municipal, county, or regional (RC Ch 6119) entities
Largely supported by customer charges (enterprise funds)
New concept of “Stormwater utility” fees (MS4)EPA regulation and permit process is large driver of
capital spendingAging infrastructure, some still dates from late 19 th
or early 20 th CenturyOhio has est. 650,000 homes or businesses served
by lead water supply lines (6.1 million nationally)¹
OVERVIEW OF WATER, WASTEWATER AND STORMWATER
UTILITIES
¹AWWA National Survey (2016).

Clean Water Act National Pollutant Discharge Elimination System (NPDES) – state EPA permits for municipal, stormwater, industrial discharges
Combined sewer overflow (CSO) correction 87 Ohio cities are under EPA consent decrees, over 100 others under EPA findings and orders
Created need for large capital projects taking decades to complete
MS4 – municipal stormwater discharges
EPA REGULATORY ENFORCEMENT

Primary Drinking Water Regulations Enforceable standards for Inorganic Chemicals, Organic Chemicals, Radionuclides, Microorganisms
“Lead and Copper Rule” is being revisedSecondary Nonenforceable standards for cosmetic or aesthetic purposes (taste and smell)
SAFE DRINKING WATER ACT

COMBINED SEWER OVERFLOW
http://capitalregionwater.com/author/crwadmin/page/3/#sthash.ZC4KIGcP.dpbs

SEPARATE SEWER SYSTEM
http://www.winnipeg.ca/waterandwaste/sewage/systemOperation.stm

Wastewater Treatment, 11.3%
Conveyance System Repair;
22.6%
New Con-veyance Sys-tems; 8.7%
Combined Sewer Overflow
Correction; 51.2%
Stormwater Man-agement Program;
6.1%
OHIO NEEDS $14.1 BILLION FOR WASTEWATER TREATMENT, 2012 - 2032
U.S. EPA Office of Water. Clean Watersheds Needs Survey 2012 Report to Congress – State Fact Sheets. Ohio CWNS 2012.

OHIO NEEDS $12.1 BILLION FOR DRINKING WATER INFRASTRUCTURE, 2011-2030
U.S. EPA Office of Water. Drinking Water Infrastructure Needs Survey and Assessment. Fifth Report to Congress. EPA 816-R-13-006. April 2013.
Transmis-sion and Dis-
tribution66%
Source4%
Treatment18%
Storage10%
Other 2%

$0
$200
$400
$600
$800
$1,000
$1,200
$1,400 Average Annual Ohio Water and Sewer Rates (2014 Dollars)
INCREASES IN RATES LEAD TO AFFORDABILITY CONCERNS
31.5% Real Increase

2014
33%2016
28%
FULL COST PRICING IS DIFFICULT
Percentage of Large/Medium U.S. Water and Sewer Utilities with revenues sufficient to cover
maintenance, debt service, capital investment, and reserves
Source: Black & Veatch, 2016 Strategic Directions.

Cost of Consent Decrees Led to Search for Alternatives
US EPA encouraging “green infrastructure” and “integrated planning process” that allows modification of plans
Columbus original WWMP $3.5 Billion over 40 years “Blueprint Columbus” avoided deep tunnel and saved $700
million, achieve better stormwater control results NEORSD – providing grants for green infrastructureCincinnati MSD – stream “daylighting” and other green
infrastructure in Lower Mill Creek Valley oGreen Infrastructure is new, hard to evaluate long-term
impacto Maintenance issues – responsibility and costo Stormwater installations on private property
GREEN INFRASTRUCTURE: A NEW SOLUTION?
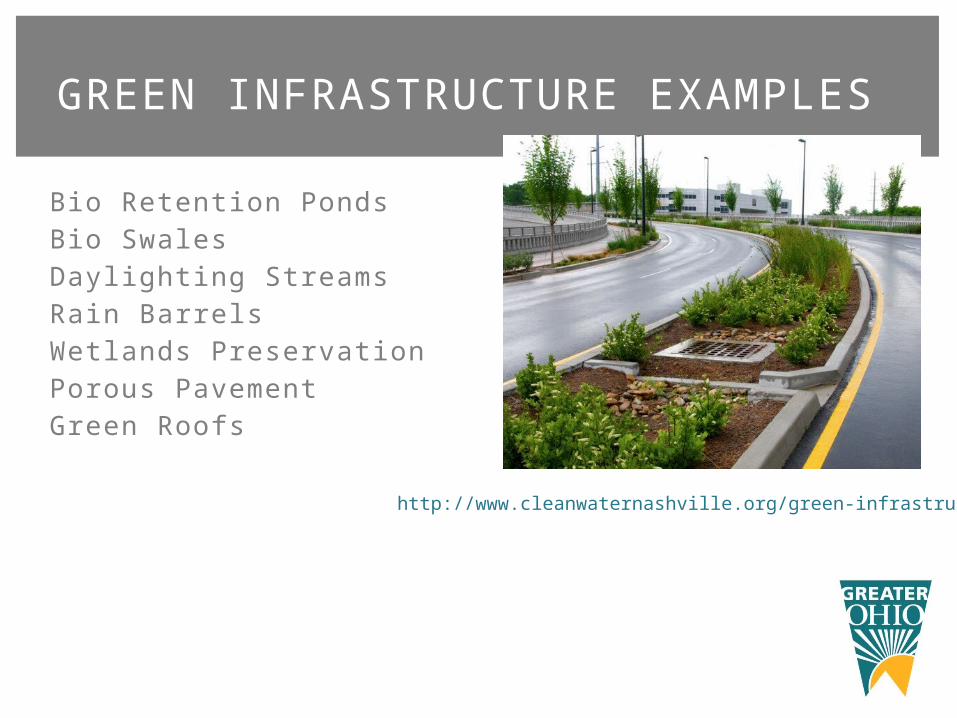
Bio Retention PondsBio SwalesDaylighting StreamsRain BarrelsWetlands PreservationPorous PavementGreen Roofs
GREEN INFRASTRUCTURE EXAMPLES
http://www.cleanwaternashville.org/green-infrastructure

STORMWATER RETENTION GARDEN
http://www.mmsd.com/gi/green-infrastructure/bioswales

GREEN ROOF
http://greencitygrowers.com/wp-content/uploads/2015/04/france-green-roof.jpg

POROUS PAVEMENT
http://www.taschifsky.com/taschifsky.com/Eco_Paving.html

Federal funding switched from grants to loans in late 1980s, partnering with states to create revolving loans funds (SRFs)
Ohio EPA and OWDA Revolving Loan Funds: Water Pollution Control Loan Fund (subsidized) Drinking Water Assistance Fund (subsidized)
OWDA Fresh Water Fund (market rate) Combined loan volume over $1 Billion from these three
funds Ohio Public Works Commission -- Grants and Loans for water
and sewer disbursed through 19 district integrating committees
Other federal sources, ARC, USDA, CDBG for small systems Navigating through various sources is a challenge!
FINANCING SOURCES

OWDA Market Rate, 2.56%
EPA DWAF/WPCLF, 1.31%
OWDA Community Assistance, 0.06%
$- $50,000
$100,000 $150,000 $200,000 $250,000 $300,000 $350,000
INTEREST PAYMENTS ON 20 YEAR $1M LOAN
August 2016 interest rates; level amortization

Asset Management Programs (AMP) tied to capital planning and rate structures Predictive maintenance and prioritization Senate Bill 333 would tie AMP to wastewater permits (Oct.
2018)Regionalization for small systems
Cooperative agreements do not require Ch. 6119 regional govt.
Property-assessed stormwater infrastructure for private parcels concept similar to PACE, but water not included in Ohio
PACE law Public-Private Partnerships (P3s)
Ohio has limited P3 statute for ODOT, not for water
NEW FINANCING AND MANAGEMENT STRATEGIES

No safe level of lead exposure in children Lead service lines mostly installed before Second World
War; Ohio estimated to have about 10% of the 6.1 million total
lead service lines nationally (AWWA National Survey)Corrosion can controlled through chemical treatment but
risk stil l remains Work on main supply line or construction work can disturb LSL Risk from lead fixtures and pipes within building itself
EPA requires testing under “lead and copper rule” but protocols criticized as weak and not enforced (e.g., pre-flushing techniques and failure to target test sites)
Customers usually own service line from street to the home, leading to disputes about who pays for replacement
FLINT, SEBRING AND LEAD POISONING:
INFRASTRUCTURE AND PUBLIC HEALTH

The water system did not know the location of lead service lines
The water utility and state regulators employed dubious lead sampling techniques
Customers had little or no awareness of the potential for lead in their drinking water
Utility construction was taking place without notifying customers of the potential for lead contamination
Lead service line replacement is often looked at as unnecessary, costly, and complex
-- Eric Rothstein, Member of Michigan Governor’s Flint Water Advisory Task Force (Journal AWWA 2016)
WHAT IS NOT UNUSUAL ABOUT FLINT?

Holds public water systems more accountable for recording and reporting lead and copper levels.
Imposes stricter monitoring of public water systems’ compliance with lead and copper rules and imposes penalties for not complying with reporting and recording requirements.
Requires mapping of possible lead pipe lines by water systems every five years
Requires of notice to resident within two days of receiving contaminated results from tests.
HB 390 - $12 million for grants to schools to replace lead fixtures ($15,000 per school, OFCC)
OHIO HOUSE BILL 512 (2016)

March 7th & 8th, 2017
More information is available at: www.GreaterOhio.wix.com/2017-Summit
The Westin Columbus310 South High StreetColumbus, Ohio 43215
Investing in Ohio's Future: Maximizing Growth in our Cities and Regions
More information is available at: www.GreaterOhio.wix.com/2017-Summit

Jon Honeck, Ph.D.Senior Policy Fellow
[email protected](614) 224-0187
www.GreaterOhio.org
FOR FURTHER INFORMATION