
Water for life Documents/44108... · 04 Water for life Executive summary Water gives and sustains...
196
Water for life South East Queensland’s Water Security Program 2015-2045 Version 1 | July 2015
Transcript of Water for life Documents/44108... · 04 Water for life Executive summary Water gives and sustains...

Water for lifeSouth East Queensland’s Water Security Program2015-2045
Version 1 | July 2015

Translation and interpreting assistance
Seqwater is committed to providing accessible services to Queenslanders from all culturally and linguistically diverse backgrounds. Please contact us and we will arrange an interpreter to share this publication with you.
ISBN-13:978-0-9943790-0-9
© Seqwater 2015
Queensland Bulk Water Supply Authority, trading as Seqwater. ABN: 75 450 239 876
Level 8 117 Brisbane Street, Ipswich QLD 4305 PO Box 16146 City East QLD 4002
P +61 7 3035 5500 F +61 7 3229 7926E [email protected] W seqwater.com.au
South East Queensland’s Water Security Program 2015-2045 01
Chairman’s foreword
South East Queensland (SEQ) is renowned for its subtropical climate and diverse landscapes, from the mountain ranges and hinterlands to the beaches and Moreton Bay islands. A safe, secure and cost-effective water supply is fundamental to the region’s health and prosperity. Water sustains our economy and enhances the lives and livelihoods of the more than 3 million people who call SEQ home.
However we live in a climate of extremes. In the past 15 years, South East Queenslanders have experienced the worst drought in 100 years, followed by the worst flood in 100 years. These events have changed the way we use and value water.
The Millennium Drought sparked one of the most successful water saving campaigns in the world, and saw our consumption reduce dramatically. The drought also exposed our vulnerability to the weather, and we invested in climate-resilient water sources and an interconnected pipeline network known as the water grid to help us better manage this most precious resource. The investment proved its worth during the 2011 and 2013 floods, when the ability of the water grid to move water around the region to where it was most needed and additional supplies from the Gold Coast Desalination Plant ensured a continued water supply to our region, despite the flood impacts.
When Seqwater was established in January 2013, we assumed the lead role in planning SEQ’s water future. It is a responsibility we take very seriously, recognising that the people of our region rely on us for a secure water supply. Our planning must take into account the unique bulk water supply system we have today and what is likely to be required in the future. We know our population will continue to grow, we will experience variation
in our climate, there will be developments in policy and technology, and community views and preferences will change over time. All of these factors need to be considered in continuing to ensure delivery of a safe, reliable and affordable water supply to our customers.
This plan is our proposed Water Security Program for 2015-2045. It is the starting point for maintaining water security for our region in a climate of extremes. It builds on previous work in water supply planning and discusses the many issues surrounding the secure delivery of bulk water to SEQ, the risks and influences Seqwater must manage, and the supply, demand and system operation options available.
We have conducted many thousands of hours of research, modelling and planning, and sought advice and input from the Department of Energy and Water Supply, the SEQ water service providers, and a panel of independent industry experts. The program we are proposing achieves a balance between demand, supply and system operation to deliver a fair and equitable water supply for South East Queenslanders, now and for future generations. Importantly, the program also considers the protection of our environment and the ability to operate efficiently under both normal and extreme climate conditions.
Today, we are fortunate to have high water security. This is a result of ongoing investment in infrastructure, the commitment of the community to keep demand at far lower than pre-drought levels, and rainfall that has topped up our water storage dams. Unless we experience an extended drought, for the next 15 years only small scale capital works will be required to continue to meet demand.
While the interconnected water grid means we do not need to build new water sources now, we must plan for what is ahead. Beyond 2030, new supply options will be needed to maintain our water security. Our planning shows we have a number of possible water supply, demand and system operating options to achieve continued water security and we are now asking South East Queenslanders to share their views and values through our stakeholder and community consultation program. The results of this consultation will be used to update the Water Security Program.
I thank the Board, executive leadership team and staff for their efforts in preparing this plan. I would also like to acknowledge the support of the region’s water service providers and the State Government, particularly the Department of Energy and Water Supply. Finally, I wish to extend our sincere thanks to our Independent Review Panel, who provided impartial perspectives, advice, challenge and review to Seqwater during the development of this proposed Water Security Program.
We look forward to talking with South East Queenslanders as we firm up our water future.
Noel K Faulkner Chairman

Water for life02
Independent Review Panel
The Panel and its purpose
The Independent Review Panel (IRP) comprises nationally and internationally recognised industry and research leaders. Rob Skinner, former Managing Director of Melbourne Water, Director of Monash Water for Liveability Centre; (Chair of Panel); Mara Bun, environmental and engagement strategist (Director, Green Cross Australia); Daniel Deere, former Principal Scientist of Sydney Catchment Authority and water quality/science specialist; Steve Kanowski, Chief Economist, Department of State Development, Queensland; Tony Kelly, former Managing Director of Yarra Valley Water; Cynthia Mitchell FTSE, Deputy Director and Professor of Sustainability at the Institute for Sustainable Futures at University of Technology, Sydney (UTS); and David Stewart, former Managing Director of Goulburn-Murray Water.
The Terms of Reference states two major purposes for the IRP: (i) “to provide independent perspectives, advice, inputs, challenge and review to Seqwater during the development of the Program”; and (ii) “the IRP will have a role to guide Seqwater towards industry leadership, including consideration of the scope of future revisions of the Water Security Program”.
Overarching comments and major conclusions
The IRP was established in August 2014 and met seven times. Before each meeting, the IRP was provided with comprehensive papers by the Seqwater Water Security Program (WSP) Study Team (the Study Team) that included requests for review of work related to the Program. The
Study Team supplemented these requests with presentations at meetings. Following each meeting, the IRP deliberated over cross-cutting themes drawing on diverse perspectives, and then provided an integrated response to the Study Team outlining the major issues raised in the work being reviewed, and recommended areas for improvement.
Overall, the IRP was satisfied with the extent and nature of consultation with the IRP itself and with the transparency and responsiveness of Seqwater to the IRP’s feedback. The IRP was impressed by the quality, depth and breadth of the WSP, and the commitment of the Study Team to producing a high quality program.
An overall comment is that the timeframe for delivery of the WSP was only 12 months from the date of the Regulation – this is very short for such studies. The IRP has therefore reviewed the work in this context, noting legislative requirements, the information available, current institutional arrangements and where there are opportunities for future work or improvement.
The first major conclusion of the IRP is that the processes and methodologies adopted by the Study Team are technically sound and will provide a good basis for future work. In saying this, there will undoubtedly be opportunities for their enhancement over time.
The second major conclusion is that the technical work underpinning this version of the WSP is comprehensive and detailed. In fact, in some areas (such as integration with treatment and distribution), it exceeds analysis undertaken elsewhere and utilises advanced modelling tools.
The third major conclusion relates to the importance of engagement with other stakeholders: local and state government, research and private sectors, and the South East Queensland (SEQ) public. The IRP notes that the timelines for subsequent versions of the WSP should allow sufficient time for stakeholder engagement to be undertaken appropriately. In this respect, the IRP notes the $6b invested during the Millennium drought to increase supply capacity through a combination of new sources and grid connections, means the region is well served by a system with a high degree of supply resilience. This resilience also buys time to consider and implement a wider range of options that will make the most of that investment.
The IRP notes that the preliminary assessment underpinning the WSP has found that, on the supply side, costs of augmenting water supply through different combinations of strategically located options are relatively comparable, which means community values about technologies, environmental impacts, liveability and resilience can influence investment decisions without significantly compromising cost. On the demand side, there are multiple opportunities to manage demand, that require aligned efforts of diverse stakeholders and authentic engagement to build trust. With the time available, SEQ has the opportunity to address this range of supply and demand challenges in an integrated way.
Finally, the IRP views the WSP as a living document, which needs to continue to evolve. There are opportunities for Seqwater to leverage from the WSP to become a leader in innovation in the Australian water industry and possibly beyond.

South East Queensland’s Water Security Program 2015-2045 03
Areas for consideration in future versions of WSP
In reviewing all of the work undertaken for the first version of the WSP, the IRP has reported on a number of areas worthy of further consideration in future iterations of the WSP. The IRP notes the identification of these areas for further consideration in no way invalidates the conclusions and recommendations of this version of the WSP.
The IRP is supportive of achieving sustainable, resilient and liveable outcomes within the
context of a changing climate, consistent with the United Nations definition of water security (refer Section 1.4). This can be achieved through flexibile, adaptable, and innovative approaches, whilst building upon the strong base of the SEQ water grid. Success requires a high degree of alignment and collaboration between water service providers, industry and the community.
The IRP would strongly support a comprehensive approach to engaging the community and stakeholders around SEQ water futures. This includes consideration of a range of options (e.g., structural, non-structural;
demand, supply options; a range of scales). The role of demand management will remain critical in future WSP versions and the appropriate integration of decentralised systems, has potential to significantly contribute to the region’s water security.
Engagement with the community through techniques such as deliberative engagement will provide a solid, defensible basis for future decision making, where community values can be articulated and options evaluated from a whole-of-society perspective.
Water Security Program Independent Review Panel (L-R) Steve Kanowski, Cynthia Mitchell, Daniel Deere, Rob Skinner (Chair), David Stewart, Tony Kelly, Mara Bun.

Water for life04
Executive summary
Water gives and sustains life. It supports healthy communities and a prosperous South East Queensland (SEQ). It is an essential service that Seqwater proudly provides to more than 3.1 million people across the region every day. Seqwater is committed to water for life and that means, among other things, planning for a sustainable water future with input from customers, stakeholders and consumers.
As the region’s bulk water supply authority, Seqwater is charged with delivering safe, secure and cost-effective water and catchment services to its customers and communities. Seqwater is responsible not only for the region’s daily water needs, but also for planning and preparing for future needs of the region.
Seqwater operates in a challenging urban water system. The region has recent experience with both large floods and long droughts. The water supply catchments are degraded and climate predictions show the weather will become more variable. It is within this context Seqwater has prepared the first consolidated Water Security Program for the region.
The Water Security Program is underpinned by rigorous modelling and assessment, which demonstrates there are many options and differing approaches available to maintain SEQ’s water security. This analysis, with our current high level of water storages, provides Seqwater with an unprecedented opportunity to consult with the community on the Water Security Program so that the long-term plan for the region’s water future reflects community views on key issues including demand management, new supply options such as recycled water and other non-structural options, as water security is not just about building more assets.
Water security for South East Queensland
The Water Act 2000 requires Seqwater to develop a Water Security Program to plan SEQ’s water future for the next 30 years (2015 to 2045). The State Government has given guidance on the long-term objectives for water security planning through a regulatory framework – the level of service (LOS) objectives. The LOS objectives, established by the Water Regulation 2002 via an amendment in July 2014, provide a measure of performance that the bulk water supply system must meet. This Water Security Program is Seqwater’s blueprint for achieving those objectives.
This version (Version 1) of the Water Security Program provides:
• the projected demand for bulk water supply in SEQ
• a strategy for the bulk water supply system, including information on new bulk water supply sources, and water supply shortfall risks for standalone communities
• information on the arrangements for operating bulk water supply infrastructure
• a broad outline of demand management measures
• an overview of drought risk and drought preparedness activities.
Version 2 of the Water Security Program is planned to be finalised by early 2017 and will include:
• incorporation of customer and community feedback on options and potential water futures
• detailed strategies for all standalone communities
• information on the operations and management of infrastructure
• detailed demand management strategies
• detailed drought response planning
• more detailed financial and economic analysis of options.
Subsequent versions of the Water Security Program, planned for five yearly updates or earlier as required, will integrate the long term strategy for the bulk water supply system with the drought response plan, as well as the more aspirational position outlined by the United Nations (UN), who define water security as:
‘the capacity of a population to safeguard sustainable access to adequate quantities of acceptable quality water for sustaining livelihoods, human well-being, and socio-economic development, for ensuring protection against water-borne pollution and water-related disasters, and for preserving ecosystems in a climate of peace and political stability’.
It will take time and commitment to develop a long-term plan that encompasses the scope of the UN definition of water security. Seqwater will work with the SEQ community and stakeholders to update and continually improve the Water Security Program, to create a long-term plan for water security in the region that reflects community values.
This version (Version 1) only covers matters related to water supplied from the bulk water supply system. SEQ has a network of diverse water supply sources that can be operated in an integrated way to deliver water across the region. This interconnected network is known as the SEQ Water Grid or ‘the water grid’. The majority of the SEQ population serviced by the bulk water supply system is supplied by the

South East Queensland’s Water Security Program 2015-2045 05
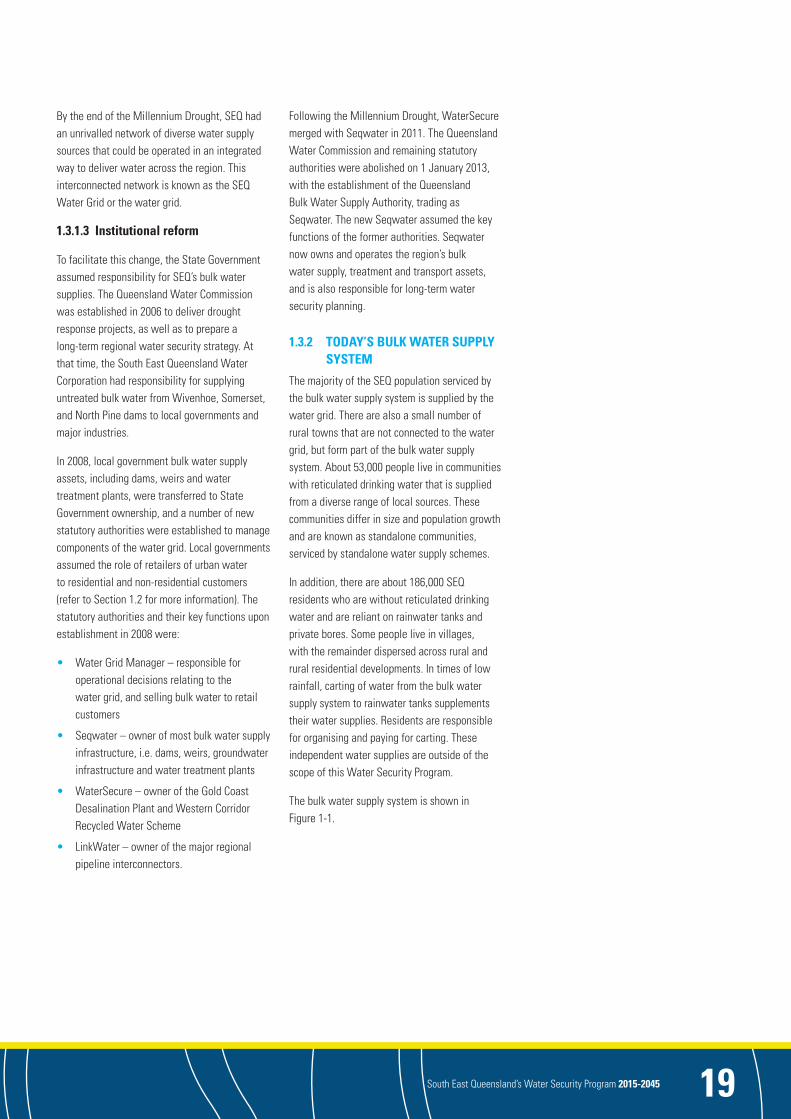
Figure ES-1 Interdependent levers of water security
water grid. There are however, a small number of rural towns that are not connected to the water grid, but form part of the bulk water supply system. About 53,000 people live in these standalone communities, which differ in size and projected population growth. Their reticulated drinking water is supplied from a diverse range of local sources, known as standalone water supply schemes. These rural towns are also included in the scope for this and subsequent versions of the Water Security Program. Smaller towns and communities in SEQ without reticulated water supplies, that is they are reliant on water tanks, are not part of this plan. This Water Security Program does not include flood mitigation.
Seqwater’s major customers are the SEQ water service providers, which source treated drinking water from Seqwater’s bulk water supply points. Although reticulation networks owned and operated by the SEQ water service providers are critical to the consumer supply chain, the Water Security Program does not include distribution past bulk water supply points to these major customers. Seqwater works in partnership with the SEQ water service providers to achieve common water security goals for the region.
Seqwater also supplies untreated water to rural customers for irrigation of agricultural and horticultural crops. These uses are outside the scope of this program. The availability of irrigation water is regulated by other parts of the Water Act 2000.
South East Queensland’s bulk water supply system
THE MILLENNIUM DROUGHT
The Millennium Drought occurred between 2001 and 2009, and was the longest and most severe drought in SEQ since European settlement. The drought also came at a time when the region was experiencing unprecedented population growth.
The severity of the drought, combined with a rapidly increasing population and high consumption rates, put enormous pressure on
the region’s water supplies. In 2005, SEQ’s major storages had fallen to approximately 50% of combined full capacity. By mid-2007 that figure had dropped to about 20%. The region’s largest storage, Wivenhoe Dam, dropped to about 15% of its water supply capacity in July 2007.
This decrease in the region’s water security led to industry restructure and the fast-tracked planning and construction of drought response infrastructure. In addition to infrastructure investment, the community and business sector achieved significant water savings. Had it not been for the support from every sector to conserve water, the water shortage could have been much worse.
A key lesson learnt from the Millennium Drought was that planning for water supply needs to occur well in advance to prevent a crisis from developing. Planning should consider multiple scenarios, including those worse than experienced on the historical record. This is true of both droughts and floods.
One of the fundamental drivers of the Water Security Program is to have a long-term plan in place to maintain water security for the region under a range of circumstances. This Water Security Program is the start of the process in developing a long-term plan for SEQ and builds on previous work.
WATER SECURITY AND SYSTEM PERFORMANCE
A distinguishing feature of the SEQ bulk water supply system is the ability to consider operating strategies in conjunction with the traditional supply and demand balance. The region has access to a diverse range of supply sources during times of decreasing water security, while also being able to choose operating strategies to minimise cost when water security is high, as it is now.
SEQ’s water security is driven by overall system performance, which is determined by three interdependent levers – demand, supply and system operation (Figure ES-1). There is an ability to improve system performance by changing any one or a combination of these three levers.
Long-term water security requirements
A 30-year plan for regional water security means the planning forecasts used today to derive the long-term plan are certain to change, as are community values. Conditions will also change over the timeframe. The key to achieving water security under a range of conditions is the diversification of options for supply, demand and system operation to provide a flexible and adaptive water future.
There are multiple variations of supply, demand and system operation options that can be implemented to achieve the region’s water security objectives. Each option has its own characteristics and performance in different conditions, and therefore advantages and disadvantages. The options identified as part of this Water Security Program form a basis for community and stakeholder engagement and future planning.
WATER SUPPLY AND THE LONG-TERM DEMAND FORECAST
Seqwater considered all options in a comprehensive examination of supply, demand and operating strategies for this Water Security Program. Supply options have been assessed at a strategic level due to the nature and number of potential options and are subject to community feedback.
SYSTEM OPERATION
SYSTEM PERFORMANCE
DEMAND
SUPPLY

Water for life06
Figure ES-3 Most likely demands and LOS yield for augmentations to existing assets
Supply sources considered included around 130 options for surface water, groundwater, seawater desalination, purified recycled water, decentralised schemes and unconventional water supplies.
Choosing between options usually involves trade-offs. In SEQ, the scale and interconnectedness of the water grid has resulted in trade-offs including cost, efficiency, environmental, social, performance and the ability to respond to drought.
Fortunately, the interconnected nature of the water grid means simple actions can be taken to optimise the existing water supply assets, increasing the yield from the bulk water supply system and delaying the need for major new infrastructure.
This version of the Water Security Program uses the concept of LOS yield which is the maximum annual average volume of water that can be supplied to urban and industrial customers by the bulk water supply system every year, while meeting the desired LOS objectives.
The Baroon Pocket Dam minimum operating level was the first LOS objective to fail. Based on this failure, the total annual average demand volume that can be met is estimated to be about 415,000 ML/annum. Therefore 415,000 ML/annum represents the derived LOS yield. Figure ES-2 shows the outcome of the supply/demand analysis for the LOS yield of 415,000 ML/annum in a range of demand scenarios.
Under the adopted most likely demand forecast, the next system augmentation to increase the LOS yield would be required around 2028. This is based on both the Gold Coast Desalination Plant and Western Corridor Recycled Water Scheme being available to contribute to supply when the key bulk water storages reach 60% and 40% respectively of their combined full supply capacity. A higher water consumption rate would bring this year closer to 2025 and a lower consumption rate would push it out to after 2035.
As part of the identification and assessment of supply options, Seqwater has taken the following stepped approach:
• maximise the use of existing water grid assets through efficient augmentations, then
• introduce an efficient new source to achieve water security objectives, then
• introduce subsequent efficient augmentations to achieve water security objectives to 2045.
AUGMENTATIONS TO EXISTING ASSETS
As part of the detailed review of the short list of water supply options, two highly-efficient system
reconfiguration options were identified to increase the LOS yield.
Given their efficiency, these options are able to defer the need for new supply sources. Both of these system reconfiguration options improve the ability of the water grid to transport water from the central sub-region to the northern sub-region and increase the LOS yield of the system to around 440,000 ML/annum. Under the ‘most likely’ demand scenario, these minor system augmentations would delay the construction of a new major supply source until about 2033 (Figure ES-3).
Figure ES-2 Estimated preliminary LOS yield-demand
0
100,000
200,000
300,000
400,000
500,000
600,000
ML/
annu
m
Most likely demand LOS yield of existing system with augmentations to existing assets (LOS yield of 440,000 ML/annum)
Augmentations to existing assets
Next new source required ~ 2033
2015
2017
2019
2021
2023
2029
2035
2037
2025
2027
2031
2033
2043
2045
2039
2041
100,000
200,000
300,000
400,000
500,000
600,000
700,000
Sout
h Ea
st Q
ueen
slan
d de
man
d M
L/an
num
High demand Most likely demand Low demand LOS yield 415,000 ML/annum
Possible augumentation of supply
2015
2017
2019
2021
2023
2029
2035
2037
2025
2027
2031
2033
2043
2045
2039
2041
Demand profile 2015 2016 2017 2018 2045
Resi
dent
ial
(L/p
/day
) Low demand 171 171 171 171 171
Most likely 177 179 182 185 185
Upper demand 183 188 194 200 200
Non
-re
side
ntia
l (L
/p/d
ay) Low demand 86 86 86 86 86
Most likely 90 92 94 96 96
Upper demand 90 92 94 96 96
Pow
er
stat
ions
(L
/p/d
ay)
All profiles 4 4 4 4 4

South East Queensland’s Water Security Program 2015-2045 07
DEMAND
Figure ES-4 Most likely maximum monthly and average day demands, and treated water capacity
Seqwater has taken an integrated approach to planning, which means that both long term LOS yield and system peak demand requirements (i.e. treated water capacity) are taken into account. By considering these drivers in parallel, investment can be optimised. Under current planning assumptions, the bulk water supply system does not need to be augmented with a new source to meet LOS objectives for at least
15 years, however it does not have the ability to effectively treat and supply water to meet higher-than-normal consumption periods during this timeframe.
In addition to the two highly efficient system reconfiguration options, Seqwater has identified two upgrades to existing water treatment plants to address peak demand (all four of these supply
options are listed in Figure ES-5). The upgrades are coupled with planned closures of some older plants that would otherwise require significant investment to refurbish and connect them to the water grid. Figure ES-4 shows how an integrated planning approach can push the timing of the next new source augmentation to about 2033.
By assessing system performance and examining efficient options available to prolong the need for a new source of supply, Seqwater has identified options that provide an efficient strategy to meet water security objectives until after 2030. This outcome will be dependent on supply, demand and operational strategy influences, which may change subject to community input. The supply, demand and system operation options to extend the performance of the water grid and defer new source augmentations are presented as the first phase of a potential water future as shown in Figure ES-5.
Beyond 2030 and after augmentations to existing assets, the first LOS objective that cannot be met is the Baroon Pocket Dam minimum operating level. This is attributed to high population growth in the northern sub-region, with limited local major bulk supply sources.
Figure ES-5 First phase of potential water future for SEQ – 2015 to 2030
SYSTEM PERFORMANCE
DEMANDMost likely demand forecast:
Includes business-as-usual demand management measures
Assumes regional average of 185 L/p/day for residential
use and 100 L/p/day for non-residential use
SUPPLYAugmentations to existing assets:
• Northern Pipeline Interconnector Offtake
• Aspley Pump Station upgrade• North Pine Water Treatment
Plant upgrade• Mount Crosby water
treatment plants upgrade
SYSTEM OPERATION
Balance between cost efficiency and water security:
Operating rules for regional and sub-regional triggers, including interconnectors
and manufactured water assets
0
200
400
600
800
1000
1200
1400
1600
1800
2000
2200
2015 2020 2025 2030 2035 2040 2045
ML/
day
Most likely MDMM demand Augmentations to existing assets — treated water capacity Most likely AD demand
Augmentations to existing assets
Next new source required ~ 2033

Water for life08
process show the most efficient way to address this deficiency is through a northern water supply solution that can achieve both of these outcomes.
Seqwater identified two water source types in the northern sub-region as possible new supply sources that meet the required objectives (Table ES-1). These are surface water options associated with harvesting from the Mary River (with and without the raising of Borumba Dam wall) or a desalination plant located in the northern sub-region.
Table ES-1 Efficient first stage new supply source augmentation options
Option type Sub-region Options that meet the objectives*
Surface water Northern • Harvest water from the Mary River in the Gympie region, pump into a new off-stream storage and from there into the existing Borumba Dam
• Upgrade the Noosa Water Treatment Plant
• Harvest water from the Mary River in the Gympie region, pump into a new off-stream storage and from there into a raised Borumba Dam
• Upgrade the Noosa Water Treatment Plant
• Build a new weir on the Mary River in the vicinity of Coles Crossing
• Raise the wall of the existing Borumba Dam to increase its storage capacity
• Upgrade the Noosa Water Treatment Plant
Desalination Build a northern desalination plant
*All options were identified in previous studies and desktop assessment. Further detailed investigations and consultation will be required to confirm their suitability. Difficult site characteristics, terrain and/or routes for the construction of any of these infrastructure components may considerably impact on the cost and therefore change the outcome of this assessment.
The options identified beyond 2030 form a basis for future planning. The criteria and preferences for options are key elements of selecting a preferred combination of options for which Seqwater is seeking community feedback. The options have been assessed at a strategic level and are subject to community feedback and further assessment. Influences and solutions will evolve and change, and subsequently the most efficient response to achieving water security for SEQ will adapt with these changes. Community feedback will be central to the development of future versions of the Water Security Program to enable the long term plan to reflect community views.
NEW SOURCE AUGMENTATIONS
Due to the interconnectedness of the water grid and the efficient augmentations to existing assets that have been identified, no new water sources are required in SEQ until beyond 2030 (excluding drought conditions). The need for drought response infrastructure is assessed separately and discussed later.
As noted above, the northern sub-region will be the first area to require supply augmentation to address LOS objectives as well as treated water capacity during high consumption periods. The options selection and integrated planning
South East Queensland’s Water Security Program 2015-2045 09
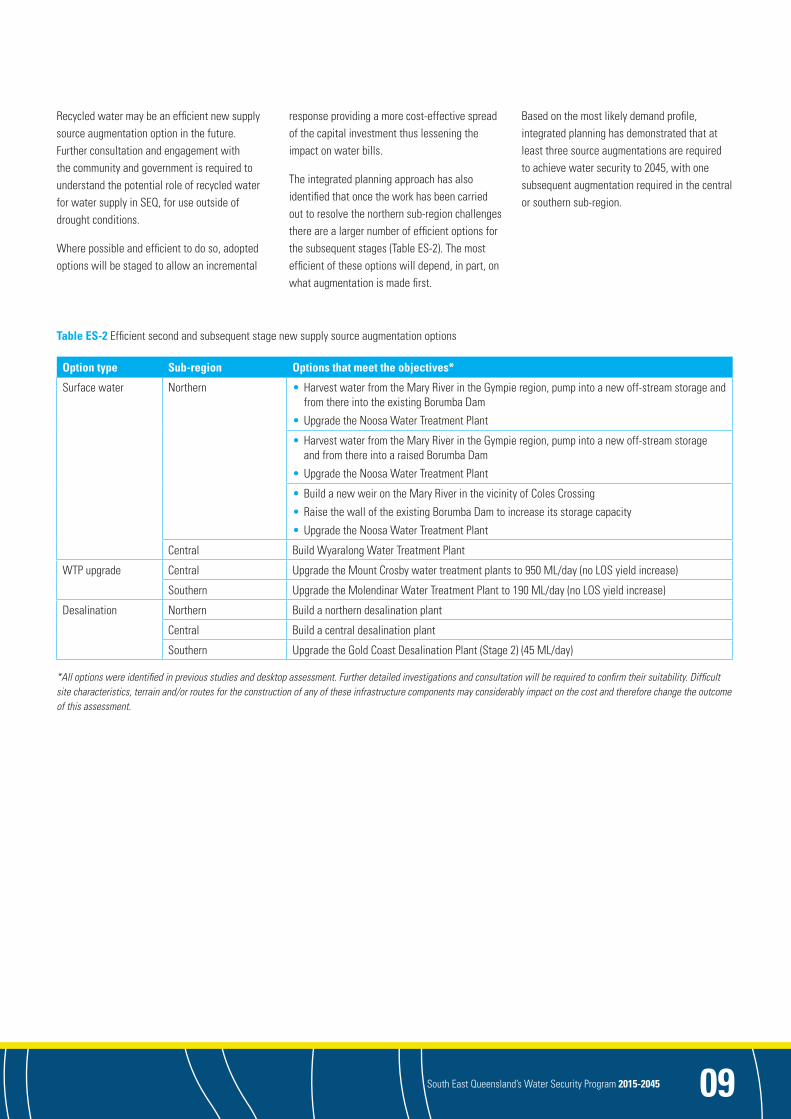
Recycled water may be an efficient new supply source augmentation option in the future. Further consultation and engagement with the community and government is required to understand the potential role of recycled water for water supply in SEQ, for use outside of drought conditions.
Where possible and efficient to do so, adopted options will be staged to allow an incremental
response providing a more cost-effective spread of the capital investment thus lessening the impact on water bills.
The integrated planning approach has also identified that once the work has been carried out to resolve the northern sub-region challenges there are a larger number of efficient options for the subsequent stages (Table ES-2). The most efficient of these options will depend, in part, on what augmentation is made first.
Based on the most likely demand profile, integrated planning has demonstrated that at least three source augmentations are required to achieve water security to 2045, with one subsequent augmentation required in the central or southern sub-region.
Table ES-2 Efficient second and subsequent stage new supply source augmentation options
Option type Sub-region Options that meet the objectives*
Surface water Northern • Harvest water from the Mary River in the Gympie region, pump into a new off-stream storage and from there into the existing Borumba Dam
• Upgrade the Noosa Water Treatment Plant
• Harvest water from the Mary River in the Gympie region, pump into a new off-stream storage and from there into a raised Borumba Dam
• Upgrade the Noosa Water Treatment Plant
• Build a new weir on the Mary River in the vicinity of Coles Crossing
• Raise the wall of the existing Borumba Dam to increase its storage capacity
• Upgrade the Noosa Water Treatment Plant
Central Build Wyaralong Water Treatment Plant
WTP upgrade Central Upgrade the Mount Crosby water treatment plants to 950 ML/day (no LOS yield increase)
Southern Upgrade the Molendinar Water Treatment Plant to 190 ML/day (no LOS yield increase)
Desalination Northern Build a northern desalination plant
Central Build a central desalination plant
Southern Upgrade the Gold Coast Desalination Plant (Stage 2) (45 ML/day)
*All options were identified in previous studies and desktop assessment. Further detailed investigations and consultation will be required to confirm their suitability. Difficult site characteristics, terrain and/or routes for the construction of any of these infrastructure components may considerably impact on the cost and therefore change the outcome of this assessment.
Water for life10
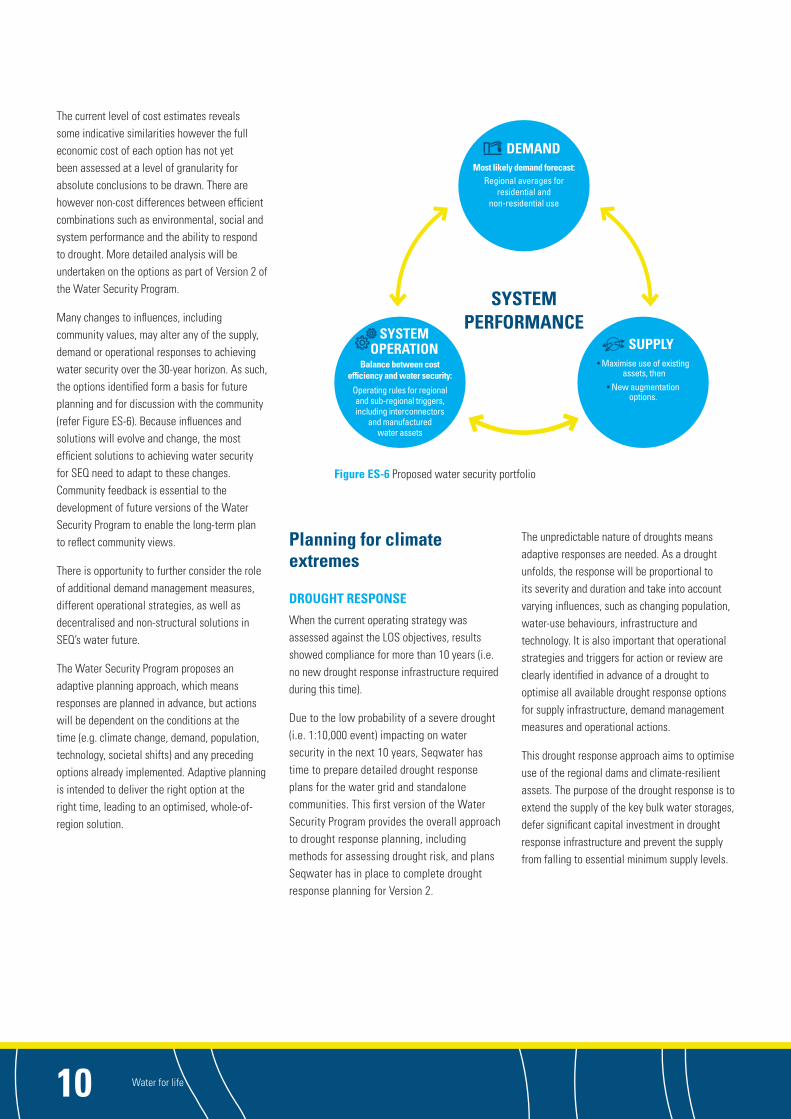
Figure ES-6 Proposed water security portfolio
SYSTEM PERFORMANCE
Most likely demand forecast:Regional averages for
residential and non-residential use
Balance between cost efficiency and water security:
Operating rules for regional and sub-regional triggers, including interconnectors
and manufactured water assets
• Maximise use of existing assets, then
• New augmentation options.
DEMAND
SYSTEM OPERATION SUPPLY
The current level of cost estimates reveals some indicative similarities however the full economic cost of each option has not yet been assessed at a level of granularity for absolute conclusions to be drawn. There are however non-cost differences between efficient combinations such as environmental, social and system performance and the ability to respond to drought. More detailed analysis will be undertaken on the options as part of Version 2 of the Water Security Program.
Many changes to influences, including community values, may alter any of the supply, demand or operational responses to achieving water security over the 30-year horizon. As such, the options identified form a basis for future planning and for discussion with the community (refer Figure ES-6). Because influences and solutions will evolve and change, the most efficient solutions to achieving water security for SEQ need to adapt to these changes. Community feedback is essential to the development of future versions of the Water Security Program to enable the long-term plan to reflect community views.
There is opportunity to further consider the role of additional demand management measures, different operational strategies, as well as decentralised and non-structural solutions in SEQ’s water future.
The Water Security Program proposes an adaptive planning approach, which means responses are planned in advance, but actions will be dependent on the conditions at the time (e.g. climate change, demand, population, technology, societal shifts) and any preceding options already implemented. Adaptive planning is intended to deliver the right option at the right time, leading to an optimised, whole-of-region solution.
Planning for climate extremes
DROUGHT RESPONSE
When the current operating strategy was assessed against the LOS objectives, results showed compliance for more than 10 years (i.e. no new drought response infrastructure required during this time).
Due to the low probability of a severe drought (i.e. 1:10,000 event) impacting on water security in the next 10 years, Seqwater has time to prepare detailed drought response plans for the water grid and standalone communities. This first version of the Water Security Program provides the overall approach to drought response planning, including methods for assessing drought risk, and plans Seqwater has in place to complete drought response planning for Version 2.
The unpredictable nature of droughts means adaptive responses are needed. As a drought unfolds, the response will be proportional to its severity and duration and take into account varying influences, such as changing population, water-use behaviours, infrastructure and technology. It is also important that operational strategies and triggers for action or review are clearly identified in advance of a drought to optimise all available drought response options for supply infrastructure, demand management measures and operational actions.
This drought response approach aims to optimise use of the regional dams and climate-resilient assets. The purpose of the drought response is to extend the supply of the key bulk water storages, defer significant capital investment in drought response infrastructure and prevent the supply from falling to essential minimum supply levels.

South East Queensland’s Water Security Program 2015-2045 11
Figure ES-7 Approach to drought response planning in South East Queensland
Notes:
1. Actions nominated for each level will not commence, regardless of the percentage level being reached, until a review has been completed which considers at least the climatic conditions, population growth, demand, status of supply infrastructure and network operations
2. Percentages are based on the volumes of the SEQ key bulk water storages
3. Targets are SEQ regional averages.
The triggers for drought action are based on the combined key bulk water supply storage volumes as a percentage of the combined capacity. This method was chosen as it is easily measurable, representative of water security, and reflects that the key bulk water storages are part of a connected water grid that can transport water between areas to maintain continuity of supply.
The triggering of different actions taken when specified regional dam capacities are reached also prepares the community for future measures so they are informed and ready to conserve water when required. Figure ES-7 provides an outline of the drought response approach, based on declining levels in the bulk water storages. Following further modelling, detailed drought response options, including reviews of triggers, will be prepared for inclusion in Version 2 of the Water Security Program.
Drought response options include measures to increase climate-resilient supply, decrease demand, and change the operation of the water grid to optimise available water resources.
INTERFACE WITH FLOOD MITIGATION
SEQ has experienced a number of floods over the years, most recently in 2011 and 2013. These weather events have impacted water supply via sudden changes in raw water quality that reduces water treatment capacity, equipment failure, broken water mains and power failure, which in turn constrains water treatment and transport.
There is potential for flood mitigation measures (e.g. lowering of full supply levels) to influence water security. Seqwater will continue to work cooperatively with SEQ water service providers and other government agencies to continuously evaluate and improve responses to address potential impacts from floods on current operations, demand management responses and understand any trade-offs between flood mitigation and water security.
Seqwater will also continue to provide input and feedback on any future SEQ flood mitigation planning including appropriate considerations of implications for water security.
Next steps
The iterative nature of the Water Security Program enables Seqwater to proactively and rigorously plan for the short, medium and long-term. Version 1 identifies options to meet water security objectives until 2045, and shows that, with the exception of a severe drought occurring, urban water demand in SEQ can be met comfortably over the first 15 years by optimising the existing water grid.
The demand, supply and system operations options presented in Version 1 can be combined in many ways to achieve water security objectives, with each individual option and combination of options having different trade-offs. Therefore, choices need to be made to shape the water future of SEQ.
Community and stakeholder input, targeted planning, further research, and ongoing monitoring
and review will enable continual refinement of the blueprint so that it remains adaptive to external influences and community expectations.
COMMUNITY ENGAGEMENT
The current high level of water security provides the ideal window of opportunity for Seqwater, the region’s water service providers and the community to work together on the direction for SEQ’s long-term water security.
Version 1 of the Water Security Program presents a range of possible options for selecting a preferred water future on which Seqwater will actively seek feedback from interested stakeholders. Engagement outcomes will enable Seqwater to prepare Version 2 of the Water Security Program to reflect community preferences, and engender community ownership of the region’s water future.
100%
70%
60%
50%
40%
30%
20%15%10%
Water efficiency awareness
Drought readiness
Drought response
Drought contingency
Essential minimum supply volume (TBA)
Regional triggers
Minimum operating level
100%
General water efficiency messaging
Business as usual operational measures
70% Increase in general water efficiency messaging in preparation for drought
50% Target 150 L/p/day residential demand Initial drought response messaging and non-residential voluntary programs
SEQ water service providers may consider implementing alternative demand management programs (e.g. pricing signals)
40% Target 140 L/p/day residential demand Medium level messaging and medium level water restrictions
Appropriate residential rebate or retrofit program
30% Target 130 L/p/day residential demand Medium level messaging and non-residential requirements
Drought contingency water infrastructure commences
20% Target 120 L/p/day residential demand High messaging with appropriate industry partners, high level water restrictions and extension of rebate program
15% Target 100 L/p/day residential demand Strong messaging and extreme level water restrictions
5-10% Target 100 L/p/day (residential and non-residential) Strong messaging and emergency water restrictions
Essential minimum supply measures
Infrastructure planning, land
acquisition, approvals
D – Gold Coast Desalination Plant
33% production
C – Western Corridor Recycled Water
Scheme and Gold Coast Desalination
Plant 100% production
B – Construction trigger
Approximately 30-month construction period
A – Infrastructure available 5%
Water for life12
The community will be engaged through adaptive consultative techniques that provide multiple channels and opportunities for South East Queenslanders to have their say on choices to be made in achieving water security for SEQ. Engagement will be underpinned by independent research that identifies the water security topics that are of most interest to the community, the desired level of consultation, and any challenges likely to be faced. Later research will test changes in attitudes and understanding, and the level of acceptance of water security planning as a result of engagement activities. A phased approach to engagement will support the development and ongoing implementation of the Water Security Program. It supports the cyclical nature of engagement – from information to consultation to evaluation. Community feedback will be incorporated as the Water Security Program progresses through its regular reviews and reiterations.
FURTHER INVESTIGATIONS
While detailed research and modelling has been undertaken to inform the Water Security Program, there is more work to be undertaken. This version has considered the more traditional approaches to supply, demand and system operations. Further investigation is required into opportunities to innovate, including demand management incentives, decentralised solutions and non-structural options. These options will require collaboration with the community, water service providers, state and local government, and other stakeholders.
Changes to planning assumptions made as part of the assessment over the 30-year period of the Water Security Program are inevitable. It is therefore important that the Water Security Program remains adaptable, and does not preclude potential future options from consideration.
While not required for some time, Seqwater will start detailed site investigations for future bulk water supply options, with the objective of securing land for potential future sites. This prudent approach will enable those options to be considered as the region grows and develops.

South East Queensland’s Water Security Program 2015-2045 13
Table of contents
Chairman’s foreword . . . . . . . . . . . . . . . . . . . 01
Independent Review Panel . . . . . . . . . . . . . 02
Executive summary . . . . . . . . . . . . . . . . . . . . 04
1 . Introduction to SEQ’s water supply . . . 17
1.1 About Seqwater . . . . . . . . . . . . . . . . 17
1.2 Seqwater’s customers . . . . . . . . . . . 17
1.3 SEQ’s bulk water supply system . . . 17
1.4 About the Water Security Program . 23
1.5 Planning for water security . . . . . . . 27
2 . Influences . . . . . . . . . . . . . . . . . . . . . . . . 29
2.1 Climate . . . . . . . . . . . . . . . . . . . . . . . 30
2.2 Policy and regulation . . . . . . . . . . . . 30
2.3 Society . . . . . . . . . . . . . . . . . . . . . . . 31
2.4 Resource competition . . . . . . . . . . . 31
2.5 Environment . . . . . . . . . . . . . . . . . . . 32
2.6 Economy . . . . . . . . . . . . . . . . . . . . . . 33
2.7 Technology . . . . . . . . . . . . . . . . . . . . 33
2.8 Megatrends . . . . . . . . . . . . . . . . . . . 34
3 . Demand for drinking water . . . . . . . . . 35
3.1 Historical SEQ water demand . . . . . 35
3.2 Efficient water use . . . . . . . . . . . . . 36
3.3 Current SEQ water demand . . . . . . . 38
3.4 Future SEQ water demand . . . . . . . . 39
4 . Water supply . . . . . . . . . . . . . . . . . . . . . . 43
4.1 Existing supply capacity . . . . . . . . . 43
4.2 Water treatment . . . . . . . . . . . . . . . 44
4.3 Water transport . . . . . . . . . . . . . . . . 45
4.4 Assessing system capacity . . . . . . . 45
4.5 LOS yield . . . . . . . . . . . . . . . . . . . . . 46
4.6 Potential new sources of supply . . . 47
5 . Operating strategy for the water grid . 49
5.1 Development of operating rules . . . 49
5.2 Asset modes of operation . . . . . . . . 51
5.3 Long-term 30-year operational planning . . . . . . . . . . . . . . . . . . . . . . 52
5.4 Medium-term operational planning . 53
5.5 Opportunities for future improvement . 54
6 . Planning for climate extremes . . . . . . 55
6.1 Introduction . . . . . . . . . . . . . . . . . . . 55
6.2 Planning for drought. . . . . . . . . . . . . 55
6.3 Planning for floods . . . . . . . . . . . . . . 62
7 . Planning for the future . . . . . . . . . . . . . . 65
7.1 Integrated planning . . . . . . . . . . . . . 65
7.2 Assessment approach . . . . . . . . . . . 65
7.3 Options for demand management . . 66
7.4 Options for supply . . . . . . . . . . . . . . 68
7.5 Options for the operating strategy . 69
7.6 Augmentations to existing assets . . 70
7.7 Efficient supply options – next new supply source augmentation . . . . . . 71
7.8 Supply option combinations . . . . . . 75
8 . Water futures . . . . . . . . . . . . . . . . . . . . . . 79
8.1 Assessments undertaken . . . . . . . . . 79
8.2 Water security portfolio . . . . . . . . . 80
8.3 Resilience to change . . . . . . . . . . . . 82
8.4 Adaptive planning . . . . . . . . . . . . . . 83
9 . Planning for standalone communities . 85
9.1 Standalone community prioritisation. . . 86
9.2 Assessment limitations . . . . . . . . . . 86
9.3 Beaudesert water supply scheme . . 87
9.4 Canungra water supply scheme . . . 89
9.5 Lowood water supply scheme . . . . . 91
9.6 Standalone community drought responses . . . . . . . . . . . . . . . . . . . . . 92
10 . Next steps . . . . . . . . . . . . . . . . . . . . . . . . 93
10.1 Engaging the community . . . . . . . . . 93
10.2 Version 2 completion . . . . . . . . . . . . 94
10.3 Annual assessment and report . . . . 95
10.4 Targeted investigations . . . . . . . . . . 96
10.5 Research, monitoring and integrated planning . . . . . . . . . . . . . 96
10.6 Five-yearly review . . . . . . . . . . . . . . 98
11 . References, Glossary, Acronyms & abbreviations . . . . . . . . . . . . . . . . . . . 99
12 . Appendices . . . . . . . . . . . . . . . . . . . . . . 107

Water for life14
List of figures
Figure 1-1 Seqwater’s bulk water supply system . . . . . . . . . . . . . . . . . . . . . . . . . . 21
Figure 1-2 Sub-regions of the water grid . . . . 22
Figure 1-3 Impact of interconnection on overall water grid yield . . . . . . . . . . . . . . . . . . . . . . . . . 23
Figure 1-4 SEQ region covered by the Water Security Program . . . . . . . . . . . . . . . . . . . . . . . . 25
Figure 1-5 Interdependent levers of water security . . . . . . . . . . . . . . . . . . . . . . . . . . . . . . 26
Figure 2-1 Interrelationships between Water Security Program and external influences . . . . 29
Figure 3-1 System performance – demand . . . 35
Figure 3-2 Historical water production trend (as an indicator of water consumption trend) . . . . . . . . . . . . . . . . . . . . . . 36
Figure 3-3 Breakdown of overall water consumption . . . . . . . . . . . . . . . . . . . . . . 38
Figure 3-4 Breakdown of residential and non-residential consumption . . . . . . . . . . . 38
Figure 3-5 Annual average daily per capita demand (total of residential and non-residential) . . . . . . . . . . . . . . . . . . . . . . . . . 39
Figure 3-6 Low, most likely, and high demand forecasts . . . . . . . . . . . . . . . . . . . . . . . 40
Figure 3-7 30-year most likely average daily demand forecast per LGA . . . . . . . . . . . . . . . . . 41
Figure 4-1 System performance – supply . . . . 43
Figure 4-2 Percentage of storage capacity Wivenhoe, Somerset and North Pine dams, 2005-2015. . . . . . . . . . . . . . . . . . . . . . . . 43
Figure 4-3 Relative make up of different supply sources pre- and post-drought . . . . . . . 44
Figure 4-4 Estimated preliminary LOS yield-demand. . . . . . . . . . . . . . . . . . . . . . . . . . . 46
Figure 5-1: System performance – system operation. . . . . . . . . . . . . . . . . . . . . . . . 49
Figure 5-2 Mode of operation–cost profile and description . . . . . . . . . . . . . . . . . . . . . . . . . 51
Figure 6-1 Actual and six- year simulated key bulk water storage levels . . . . . . . . . . . . . . 57
Figure 6-2 Drought response framework . . . . 58
Figure 6-3 Approach to drought response planning for the water grid in South East Queensland . . . . . . . . . . . . . . . . . . . . . . . . . . . . 59
Figure 7-1 Demand management option development process . . . . . . . . . . . . . . . . . . . . 66
Figure 7-2 Effect of demand management on supply infrastructure augmentation. . . . . . . 67
Figure 7-3 Options development and assessment process . . . . . . . . . . . . . . . . . . . . . 68
Figure 7-4 Most likely demands and LOS yield for augmentations to existing assets. . . . 70
Figure 7-5 Most likely maximum monthly and average day demands, and treated water capacity. . . . . . . . . . . . . . . . . . . . . . . . . . 71
Figure 7-6 Most likely demands and LOS yield for augmentations to existing assets and LOS upgrades . . . . . . . . . . . . . . . . . . . . . . . 72
Figure 7-7 Revised infrastructure program to meet planning criteria. . . . . . . . . . . . . . . . . . 72
Figure 7-8 Revised infrastructure program to meet LOS and planning criteria objectives . . . . 73
Figure 7-9 Relative water security contribution of hypothetical new desalination plants as first augmentation . . . . 73
Figure 8-1 Augmentations to existing assets – first phase of potential water future for SEQ . . 80
Figure 8-2 Proposed water security portfolio . 81
Figure 9-1 Standalone communities serviced by Seqwater . . . . . . . . . . . . . . . . . . . . 85
Figure 9-2 Existing and proposed bulk supply needs for Beaudesert . . . . . . . . . . . . . . . . . . . . 87
Figure 9-3 Beaudesert water supply scheme demand growth profile . . . . . . . . . . . . . . . . . . . 88
Figure 9-4 Canungra – existing and proposed bulk supply system . . . . . . . . . . . . . . . . . . . . . . 89
Figure 9-5 Canungra water supply scheme demand growth profile . . . . . . . . . . . . . . . . . . . 90
Figure 9-6 Lowood – proposed 30-year bulk supply needs . . . . . . . . . . . . . . . . . . . . . . . . . . . 91
Figure 9-7 Lowood water supply scheme demand growth profile . . . . . . . . . . . . . . . . . . . 92
Figure 10-1 Phased approach to community engagement . . . . . . . . . . . . . . . . . . 94

South East Queensland’s Water Security Program 2015-2045 15
Table 1-1 Water restriction schedule during the Millennium Drought. . . . . . . . . . . . . 18
Table 1-2 LOS objectives assessed using Regional Stochastic Model . . . . . . . . . . . 24
Table 1-3 Compliance approach for remaining LOS objectives . . . . . . . . . . . . . . . . . 25
Table 2-1 Breakdown of catchment land in South East Queensland owned by Seqwater . . 32
Table 2-2 Summary of CSIRO megatrends . . . 34
Table 3-1 Ongoing demand management measures/programs in South East Queensland . . . . . . . . . . . . . . . . . 37
Table 5-1 Factors that contribute to operating rules . . . . . . . . . . . . . . . . . . . . . . . . . 49
Table 5-2 Regional triggers – operational and pre-operational triggers . . . . . . . . . . . . . . . 50
Table 6-1 LOS objectives – compliance assessment with and without Western Corridor Recycled Water Scheme . . . . . . . . . . . 56
Table 6-2 Cumulative probability of the key bulk water storages reaching trigger levels . . . 56
Table 6-3 Drought response levels . . . . . . . . . 58
Table 6-4 Key demand management measures in response to drought . . . . . . . . . . . 61
Table 6-5 Key bulk water storage trigger levels for operating Gold Coast Desalination Plant and Western Corridor Recycled Water Scheme . . . . . . . . . . . . . . . . . . . . . . . . . 62
Table 7-1 Efficient first stage augmentation options beyond 2030 . . . . . . . . . . . . . . . . . . . . . 74
Table 7-2 Efficient second stage augmentation options . . . . . . . . . . . . . . . . . . . . 75
Table 7-3 Potential criteria for supply options assessment . . . . . . . . . . . . . . . . . . . . . 76
Table 8-1 Potential water security portfolio 2015 to 2030 . . . . . . . . . . . . . . . . . . . . . . . . . . . 80
Table 8-2 Potential water security portfolio – 2015 to 2045 . . . . . . . . . . . . . . . . . . . . . . . . . . . 81
Table 8-3 Key triggers for action . . . . . . . . . . . 83
Table 9-1 High priority standalone communities . . . . . . . . . . . . . . . . . . . . . . . . . . . 86
Table 10-1 Annual water security assessment and reporting process . . . . . . . . . . 95
List of tables

Water for life16
Appendix A: Level of service objectives. . . . 108
Appendix B: Modelling summary . . . . . . . . . 109
Appendix C: Overview of demand forecast . 113
Appendix D: Asset summaries . . . . . . . . . . . 115
Appendix E: Operational plan and approach . 118
Appendix F: Drought risk assessment . . . . . 124
Appendix G: Summary of planning criteria . 129
Appendix H: Supply and demand options summary . . . . . . . . . . . . . . . . . . . . . . . 131
Appendix I: Scenario analysis and sensitivity testing . . . . . . . . . . . . . . . . . . . . . . 142
Appendix J: Standalone communities risk assessment. . . . . . . . . . . . . . . . . . . . . . . . 145
Appendix K: Standalone communities – drought response plans. . . . . . . . . . . . . . . . . . 159
List of appendices
01. Introduction to SEQ’s w
ater supply
Introduction to SEQ’s water supply01

South East Queensland’s Water Security Program 2015-2045 17
Introduction to SEQ’swater supply01
1 .1 About Seqwater
Seqwater is the Queensland Government statutory authority responsible for providing a safe, secure and cost-effective water supply for South East Queensland (SEQ), today and into the future. Seqwater is the sole bulk supplier of treated and untreated (raw) water in SEQ. Seqwater’s role is to source, store, treat and supply water from catchments and alternative sources, and provide reliable, fit-for-purpose water to customers.
Seqwater also provides essential flood mitigation services through the operation of Somerset, Wivenhoe and North Pine dams, and irrigation services to more than 1,200 customers, and allows the community to enjoy recreation activities on and around many of its water storages. More than 2.75 million people visited Seqwater recreation areas in 2014.
Seqwater is one of Australia’s largest water businesses, with a large geographical spread and a diverse asset base, with operations extending from the New South Wales border to the base of the Toowoomba ranges and north to Gympie.
Seqwater manages $11.4 billion of water supply infrastructure and parts of the natural catchments of the region’s major water supply sources. Assets include dams, weirs, bores, water treatment plants, reservoirs, pumps and pipelines, as well as the Gold Coast Desalination Plant and the Western Corridor Recycled Water Scheme.
Water gives and sustains life. It supports healthy communities and a prosperous SEQ. It is an essential service that Seqwater proudly provides to more than 3.1 million people across the region every day.
1 .2 Seqwater’s customers
Seqwater’s major customers, the SEQ water service providers, source treated drinking water from bulk water supply points and deliver it to households, businesses and industry. The water service providers distribute treated drinking water to end water users via local reservoirs, pump stations, mains pipes and reticulation systems.
While the City of Gold Coast, Redland City Council, and Logan City Council provide reticulated water to their respective Local Government Areas, Unitywater and Queensland Urban Utilities reticulate water to more than one Local Government Area, as follows:
• Unitywater supplies the Noosa, Sunshine Coast and Moreton Bay council areas.
• Queensland Urban Utilities supplies the Brisbane, Scenic Rim, Ipswich, Somerset and Lockyer Valley council areas.
The reticulated water system supplies both residential (people’s homes and gardens) and non-residential customers (commercial and industrial).
Other direct customers of Seqwater include power stations, Toowoomba Regional Council (drought contingency supply only), Gympie Regional Council, and more than 1,200 irrigation customers in seven water supply schemes.
1 .3 SEQ’s bulk water supply system
Seqwater owns and operates the bulk water supply system for SEQ. This system comprises a range of supply sources, and a network of treatment facilities, conventional bulk pipelines and two-directional pipelines that enable treated water to be transported around the region in an operationally efficient way.
The Millennium Drought exposed the vulnerability of SEQ’s water supplies, which at the time were managed by 17 local government authorities. It is important to understand the impact of the Millennium Drought and the region’s response, in order to understand the bulk water supply system in place today.
1 .3 .1 MILLENNIUM DROUGHT
The Millennium Drought (2001 to 2009) was the longest and most severe drought in SEQ since European settlement. The accumulated rainfall deficit over the eight-year period was 1,530 mm. Previously, the five-year Federation Drought (1898 to 1903), with an accumulated rainfall deficit of 1,278 mm, was the benchmark for drought planning in the region.
The Millennium Drought came at a time when SEQ was experiencing unprecedented population growth. Between 1971 and 2011, the SEQ population grew by 2.5% per annum (BITRE, 2013).
The severity of the drought combined with a rapidly increasing population and high consumption rates put enormous pressure on the region’s water supplies. In early 2005, three of

Water for life18
SEQ’s major storages – Wivenhoe, Somerset and North Pine dams – had fallen to approximately 50% of their combined full capacity. By mid-2007, that figure had decreased to around 20%. The region’s largest storage, Wivenhoe Dam, dropped to around 15% of its water supply capacity in July 2007.
Had it not been for support from every sector of the community to conserve water, the water shortage could have been much worse. The following measures were implemented as a result of the Millennium Drought.
1 .3 .1 .1 How consumption was reduced
The implementation of the following demand management measures significantly reduced residential and non-residential water consumption. The region achieved a reduction in residential water consumption from an average of 300 litres per person per day (L/p/day) to around 140 L/p/day.
a) Water restrictions
Table 1-1 outlines the six levels of water restrictions imposed when combined dam levels reached trigger points.
b) Marketing communication
• Mass media campaign (TV, radio, newspaper); including Target 140 call to action
Table 1-1 Water restriction schedule during the Millennium Drought
Restriction Dam level trigger Schedule
Level 1 ~40% Watering times
Level 2 35% Watering three days per week at set times by hose
Level 3 30% Bucket watering only
Level 4 25% Timed bucket watering
Level 5 20% Timed bucket watering only, vehicles spot clean only
Target 140 campaign
Level 6 15% Focus on further business restrictions
• Distribution of four-minute shower timers
• Billboards, brochures and giveaways, such as shirts, face washers and magnets.
c) Home WaterWise Service
• Home service provided to 170,000 households to complete a water efficiency audit, replace showerheads and install flow restrictors in taps
• The service saved 21 kilolitres (kL)/house/annum and cost $38 million.
d) One-to-one and high user programs
• Letters sent to about 80,000 households, which were using more than 800 litres (L)/day each
• Household customers given information on their water use compared to averages for their area, how to check for leaks, and how to save water.
e) Rebates and subsidies
• $238 million in subsidies to bring forward the take-up of water-efficient devices in the home
• For the non-residential sector, more than $3 million in rebates, the Business Water Efficiency Program and water audits.
f) Water efficiency management plans (non-residential consumers)
• Water efficiency management plans (WEMPs) targeted at specific industries, e.g. plant nurseries, public swimming pools, buildings with cooling towers (air conditioning systems), and businesses which used more than 10 megalitres/annum (ML/a)
• WEMPs aimed to achieve a 25% reduction in consumption or best practice.
g) Pressure and leakage management
• State Government regulation
• All local governments involved
• Saved 60 ML/day (about 22,000 ML/a) and cost $90 million.
1 .3 .1 .2 How supply capacity was increased
Significant capital investment (around $6 billion) was made to increase regional water supply in a very short timeframe. Major pipelines were constructed to interconnect existing and new supply sources and transport water around the region, as follows:
• Gold Coast Desalination Plant
• Western Corridor Recycled Water Scheme (comprising advanced water treatment plants to produce purified recycled water (PRW) and pipelines)
• Northern Pipeline Interconnector
• Southern Regional Water Pipeline
• Eastern Pipeline Interconnector
• Hinze Dam raising
• Wyaralong Dam
• Bromelton Off-stream Storage
• Cedar Grove Weir
• Bribie Island and Brisbane aquifer treatment plants.
South East Queensland’s Water Security Program 2015-2045 19
By the end of the Millennium Drought, SEQ had an unrivalled network of diverse water supply sources that could be operated in an integrated way to deliver water across the region. This interconnected network is known as the SEQ Water Grid or the water grid.
1 .3 .1 .3 Institutional reform
To facilitate this change, the State Government assumed responsibility for SEQ’s bulk water supplies. The Queensland Water Commission was established in 2006 to deliver drought response projects, as well as to prepare a long-term regional water security strategy. At that time, the South East Queensland Water Corporation had responsibility for supplying untreated bulk water from Wivenhoe, Somerset, and North Pine dams to local governments and major industries.
In 2008, local government bulk water supply assets, including dams, weirs and water treatment plants, were transferred to State Government ownership, and a number of new statutory authorities were established to manage components of the water grid. Local governments assumed the role of retailers of urban water to residential and non-residential customers (refer to Section 1.2 for more information). The statutory authorities and their key functions upon establishment in 2008 were:
• Water Grid Manager – responsible for operational decisions relating to the water grid, and selling bulk water to retail customers
• Seqwater – owner of most bulk water supply infrastructure, i.e. dams, weirs, groundwater infrastructure and water treatment plants
• WaterSecure – owner of the Gold Coast Desalination Plant and Western Corridor Recycled Water Scheme
• LinkWater – owner of the major regional pipeline interconnectors.
Following the Millennium Drought, WaterSecure merged with Seqwater in 2011. The Queensland Water Commission and remaining statutory authorities were abolished on 1 January 2013, with the establishment of the Queensland Bulk Water Supply Authority, trading as Seqwater. The new Seqwater assumed the key functions of the former authorities. Seqwater now owns and operates the region’s bulk water supply, treatment and transport assets, and is also responsible for long-term water security planning.
1 .3 .2 TODAY’S BULK WATER SUPPLY SYSTEM
The majority of the SEQ population serviced by the bulk water supply system is supplied by the water grid. There are also a small number of rural towns that are not connected to the water grid, but form part of the bulk water supply system. About 53,000 people live in communities with reticulated drinking water that is supplied from a diverse range of local sources. These communities differ in size and population growth and are known as standalone communities, serviced by standalone water supply schemes.
In addition, there are about 186,000 SEQ residents who are without reticulated drinking water and are reliant on rainwater tanks and private bores. Some people live in villages, with the remainder dispersed across rural and rural residential developments. In times of low rainfall, carting of water from the bulk water supply system to rainwater tanks supplements their water supplies. Residents are responsible for organising and paying for carting. These independent water supplies are outside of the scope of this Water Security Program.
The bulk water supply system is shown in Figure 1-1.

Water for life20
* Recreation water treatment plant.
Water Treatment Plants (WTP)
1 Amity Point WTP
2 Atkinson Dam WTP*
3 Banksia Beach WTP
4 Beaudesert WTP
5 Boonah Kalbar WTP
6 Borumba Dam WTP*
7 Canungra WTP
8 Capalaba WTP
9 Dayboro WTP
10 Dunwich WTP
11 East Bank (Mount Crosby) WTP
12 Enoggera WTP
13 Esk WTP
14 Ewen Maddock WTP
15 Hinze Dam WTP*
16 Image Flat WTP
17 Jimna WTP
18 Kenilworth WTP
19 Kilcoy WTP
20 Kirkleagh WTP*
21 Kooralbyn WTP
22 Landers Shute WTP
23 Linville WTP
24 Lowood WTP
25 Maroon Dam WTP*
26 Molendinar WTP
27 Moogerah Dam WTP*
28 Mudgeeraba WTP
29 Noosa WTP
30 North Pine WTP
31 North Stradbroke Island WTP
32 Petrie WTP
33 Point Lookout WTP
34 Rathdowney WTP
35 Somerset Dam (Township) WTP
36 West Bank (Mt Crosby) WTP
37 Wivenhoe Dam WTP*
Western Corridor Recycled Water Scheme
38 Bundamba Advanced Water Treatment Plant (AWTP)
39 Gibson Island AWTP
40 Luggage Point AWTP
Desalination Plant
41 Gold Coast Desalination Plant
Reservoirs
42 Alexandra Hills Reservoirs
43 Aspley Reservoir
44 Camerons Hill Reservoir
45 Ferntree Reservoir
46 Green Hill Reservoirs
47 Heinemann Road Reservoirs
48 Holts Hill Reservoir
49 Kimberley Park Reservoirs
50 Kuraby Reservoir
51 Lumley Hill Reservoir
52 Molendinar Reservoir
53 Mt Cotton Reservoir
54 Narangba Reservoirs
55 North Beaudesert Reservoirs
56 Robina Reservoir
57 Sparkes Hill Reservoirs
58 Stapylton Reservoir
59 Wellers Hill Reservoirs
Seqwater major assetsLegend
Northern Pipeline Interconnector
Western Corridor Recycled Water Scheme
Southern Regional Water Pipeline
Eastern Pipeline Interconnector
Network Integration Pipeline
Other bulk water pipelines connecting the SEQ water grid
Local government boundary
Reservoirs
Water treatment plants
Western Corridor Recycled Water Scheme
Desalination plant

South East Queensland’s Water Security Program 2015-2045 21
Figure 1-1 Seqwater’s bulk water supply system
Sunshine Coast Regional Council
Somerset Regional Council
Noosa Shire Council
Gympie Regional Council
Moreton Bay Regional Council
Toowoomba Regional Council
Lockyer Valley Regional Council
Ipswich City Council
Scenic RimRegional Council
City ofGold CoastLogan City
Council
Redland CityCouncil
Brisbane CityCouncil
Seqwater major assets
54
43
57
46
59
42
53
49
55
50
47
58
52
56
45
4448
51
34
28
26
157
4
33
31
811
36
24
237
35
20
23
17
6
18
19
13
12
11
32
3
14
22
16
29
30
9
1
10
38
39
40
21
25
5
27
41
Baroon Pocket Dam(Lake Baroon)
Ewen Maddock Dam
Poona Dam
Cooloolabin Dam(Lake Cooloolabin)
Borumba Dam(Lake Borumba) Wappa
Dam
Somerset Dam(Lake Somerset)
North Pine Dam(Lake Samsonvale)
Wivenhoe Dam(Lake Wivenhoe)
Atkinson Dam
Gold Creek DamClarendon Dam
(Lake Clarendon)
Bill Gunn Dam(Lake Dyer)
Hinze Dam(Advancetown Lake)
Leslie Harrison Dam(Tingalpa Reservoir)
Wyaralong Dam
Gold CoastDesalination Plant
Moogerah Dam(Lake Moogerah)
Maroon Dam(Lake Maroon) Little Nerang Dam
Six Mile Creek Dam(Lake Macdonald)
Sideling Creek Dam(Lake Kurwongbah)
Bromelton Dam(Bromelton Weir)
Cabbage Tree Creek Dam(Lake Manchester)
Cedar Pocket Dam
Enoggera Dam(Enoggera Reservoir)
NindooinbahDam

Water for life22
Figure 1-2 Sub-regions of the water grid
Before the interconnection of the water grid, the region was supplied from eight discrete water supply zones, each with different catchment characteristics and without the ability to share available water. At that time these water supply zones had differing levels of reliability and different owners and operators. The lack of connectivity meant water restrictions could be applied in some parts of the region while dams in other parts were full or overflowing. Similarly, operational issues often had to be managed on a local scale, without access to supplies in surrounding areas.
Although the region is interconnected, the water grid is operated to a large extent at a sub-regional level. Each of the sub-regions – Northern, Central, Eastern and Southern – are centred around a specific water storage and provides the means to balance cost efficiency and water security (Chapter 5 provides more information on how the water grid is operated). The sub-regions are defined below and shown in Figure 1-2.
• Northern sub-region – bulk water supply assets from Noosa to North Pine Water Treatment Plant; interface with the Central sub-region
• Central sub-region –areas supplied by Wivenhoe and Somerset dams via the Mount Crosby Water Treatment Plants (i.e. Brisbane, Ipswich, Beaudesert and Logan)
• Eastern sub-region – assets from the transfer interface between the Central sub-region through to Capalaba and North Stradbroke Island Water Treatment Plant
• Southern sub-region – encompasses the Gold Coast supply area and interfaces with the Central sub-region.
With interconnection of the water supply systems, the total yield of the water grid is now greater than the yield of individual systems operating independently. When one supply source is being depleted, the water grid can be operated to allow other supply sources to be substituted, resulting in a higher overall yield.
Figure 1-3 illustrates the comparative yield of the system with and without the regional interconnectors. For example, with all water grid assets available and operating, the yield is about 415,000 ML/annum, and without interconnection the yield drops to about 350,000 ML/annum. This means that the interconnected supply
system can meet growing demand for considerably longer, thus delaying the need for additional water supply infrastructure.
Sunshine Coast Regional Council
Somerset Regional Council
Noosa Shire CouncilGympie
Regional Council
Moreton Bay Regional Council
Toowoomba Regional Council
Lockyer Valley Regional Council
Ipswich City Council
Scenic RimRegional Council
City of Gold Coast
Logan CityCouncil
Redland CityCouncil
Brisbane CityCouncil
Southern DownsRegional Council
Southern Burnett Regional Council
Local Government Area
Northern Region
Central Region
Eastern Region
Southern Region

South East Queensland’s Water Security Program 2015-2045 23
Figure 1-3 Impact of interconnection on overall water grid yield
The State Government sets the price for bulk treated water. For historical reasons, bulk water prices vary from council to council; however by 2020, a single common price is expected to apply across SEQ. In setting the price for bulk water, the State Government considers detailed information on the costs of water production prepared by the Queensland Competition Authority, an independent economic regulator. Seqwater strives to contain these costs by enhancing operational efficiency and working closely with customers.
The SEQ water service providers set their own retail water prices. The retail price includes the bulk water charge, which accounts for approximately 30% of an average household’s water and sewerage bill. The Queensland Competition Authority reviews the retail prices when requested by the State Government and makes recommendations on whether there has been any misuse of their market power. To date, no such recommendations have been made.
1 .4 About the Water Security Program
Following Seqwater’s re-establishment on 1 January 2013, the new authority assumed the responsibility for long-term water security planning for SEQ. The Water Act 2000 requires Seqwater to develop a Water Security Program ‘to facilitate the achievement of the desired level of service objectives for water security for the SEQ region’, for the next 30 years.
The Water Security Program must include information about arrangements, strategies or measures for:
a) operating the designated water security entity’s assets for providing water services in the region or part of the region to which the water security program relates; and
b) addressing future infrastructure needs, including building new infrastructure or augmenting existing infrastructure; and
c) managing the infrastructure relevant to the designated water security entity’s operations; and
d) managing demand for water; and
e) responding to drought conditions; and
f) any other matter prescribed under a regulation.
Seqwater’s Water Security Program supersedes the South East Queensland Water Strategy, released in 2010 by the Queensland Water Commission. The Water Security Program will remain in force until such time as it is updated through a review. A review must occur at least every five years.
The United Nations (UN) defines water security as ‘the capacity of a population to safeguard sustainable access to adequate quantities of acceptable quality water for sustaining livelihoods, human well-being, and socio-economic development, for ensuring protection against water-borne pollution and water-related disasters, and for preserving ecosystems in a climate of peace and political stability’.
Seqwater will work in partnership with Government, stakeholders and the community towards the UN definition of water security.
1 .4 .1 LEVEL OF SERVICE OBJECTIVES
The State Government provides guidance on the long-term objectives for water security planning through a regulatory framework—the level of service (LOS) objectives. The LOS objectives, established by the Water Regulation 2002 via an amendment in July 2014, provide a measure of performance that the bulk water supply system must meet. The Water Security Program is Seqwater’s blueprint for achieving those objectives.
LOS frameworks are now the accepted industry standard for water security planning. The LOS framework used to determine the supply yield for SEQ takes a risk-based approach, in which the supply and demand models are based on projections for a much wider range of potential inflows as well as how often these may occur. This approach enhances water security because planning is based on theoretical droughts worse than those previously experienced by the region.
0
100,000
200,000
300,000
400,000
500,000
600,000
Sout
h Ea
st Q
ueen
slan
d de
man
d M
L/an
num
Water demand projection System yield with no regional interconnectors 350,000 ML/annumSystem yield with regional interconnectors 415,000 ML/annum
Time

Water for life24
Seqwater uses a tool called the Regional Stochastic Model to assess which demand, supply, and operational options achieve the LOS objectives and determine when the LOS objectives cannot be met.
Before the Millennium Drought, long-term water supply planning in Queensland was based on a concept called ‘historical no failure yield’ (HNFY), which assessed future water availability using historical stream flows and the resultant behaviour of water storages. The disadvantage of the HNFY approach is that it does not consider possible inflow sequences that have not yet been recorded in historical data.
The LOS objectives (refer Appendix A for more information) prescribe three key outcomes:
• The bulk water supply system must be able to supply enough water to meet the projected regional average urban demand. (Note that urban demand is made up of residential (people’s homes) and non-residential (commercial and industrial premises) water uses, and applies to both water grid-connected and standalone water supply communities).
• As the region enters a drought, the water grid must be able to supply enough water so that medium level restrictions on residential water use will not happen more than once every 10 years, on average, and under those restrictions, the system will still be able to supply at least 140 litres of water to each person each day.
• The probability that any of the following three dams would run out of water must be no greater than a one-in-10,000 probability each year:
– Wivenhoe Dam
– Hinze Dam
– Baroon Pocket Dam.
1 .4 .2 ASSESSING COMPLIANCE WITH THE LOS OBJECTIVES
The bulk water supply system consists of a number of subsystems each with its own characteristic hydrology. Before 2009 these subsystems operated independently and simulation of operation of each system used the Integrated Quantity Quality Model (IQQM). Since 2009 the northern, southern, central and eastern systems have been interconnected by the water grid. A model was therefore required that could simulate the operation of multiple interconnected water supply systems. The WATHNET simulation program was customised to develop the Regional Stochastic Model, which encompasses all the major storages, major demand zones, manufactured water sources and interconnecting pipelines in the water grid. The Regional Stochastic Model has been constructed using simplified IQQM models of individual systems and calibrated to these models.
Another driver for the creation of the Regional Stochastic Model was the adoption of a LOS approach to yield estimation, which requires statistical data on the operation of the system. As WATHNET can perform simulations using a large number of replicates of climate data, it can generate the large amount of data required for the LOS yield determinations (refer to Section 4.5 for more information about LOS yield).
The Regional Stochastic Model is used to obtain the average recurrence interval statistics for operation of the system with a fixed annual demand and infrastructure composition. The LOS objectives that are assessed for compliance using these statistics are shown in Table 1-2. For further information about the Regional Stochastic Model, refer to Appendix B.
Compliance assessments for the remainder of the LOS objectives are detailed in Table 1-3.
Table 1-2 LOS objectives assessed using Regional Stochastic Model
LOS objective Average recurrence interval statistic
Complying value
Medium level water restrictions will not occur more often than once every 10 years
Frequency of key bulk water storages reaching 40%
>10 years
The bulk water supply system will not be reduced to supplying the essential minimum supply volume more frequently than once in 10,000 years
Frequency of key bulk water storages reaching essential minimum supply volume trigger
>10,000 years
The Brisbane system storages will not reach minimum operating level more frequently than once in 10,000 years
Frequency of Brisbane system storages reaching minimum operating level
>10,000 years
Baroon Pocket Dam will not reach minimum operating level more frequently than once in 10,000 years
Frequency of Baroon Pocket Dam reaching minimum operating level
>10,000 years
Hinze Dam will not reach minimum operating level more frequently than once in 10,000 years
Frequency of Gold Coast system storages reaching minimum operating level
>10,000 years
Medium level restrictions will last no longer than one year on average
Average duration the key bulk water storages remain below 40%
<12 months
Source: Water Regulation 2002 via an amendment in July 2014

South East Queensland’s Water Security Program 2015-2045 25
Figure 1-4 SEQ region covered by the Water Security Program
Table 1-3 Compliance approach for remaining LOS objectives
LOS objective Value Compliance
The bulk water supply system can meet the projected average residential and non-residential demand
LOS yield Planning will be completed to augment supply at an appropriate time before projected demand will exceed the LOS yield
Medium level restrictions will not restrict the average water use for the SEQ region to less than 140 L per person per day
Medium level restrictions residential target rate
Set to keep it at or above 140 L per person per day
The bulk water supply system will be able to supply the essential minimum supply volume
Compliance assessment to be completed for Version 2 of the Water Security Program.
Seqwater has developed this Water Security Program in compliance with the LOS objectives, with all proposed approaches compliant with the LOS objectives.
1 .4 .3 PROGRAM SCOPE
The Water Security Program addresses the requirements of the Water Security Program for South East Queensland – guideline for development (DEWS 2015), issued to Seqwater by the Department of Energy and Water Supply (DEWS).
The Water Security Program applies to a defined SEQ geographical region comprising the following Local Government Areas (LGAs) as shown in Figure 1-4.
• Brisbane City Council
• City of Gold Coast
• Ipswich City Council
• Lockyer Valley Regional Council
• Logan City Council
• Moreton Bay Regional Council
• Noosa Shire Council
• Redland City Council
• Scenic Rim Regional Council
• Somerset Regional Council
• Sunshine Coast Regional Council.
Sunshine Coast Regional Council
Somerset Regional Council
Noosa Shire CouncilGympie
Regional Council
Moreton Bay Regional Council
Toowoomba Regional Council
Lockyer Valley Regional Council
Ipswich City Council
Scenic RimRegional Council
City ofGold Coast
Logan CityCouncil
Redland CityCouncil
Brisbane CityCouncil
Southern DownsRegional Council
Southern Burnett Regional Council
Local Government Area
SEQ Region
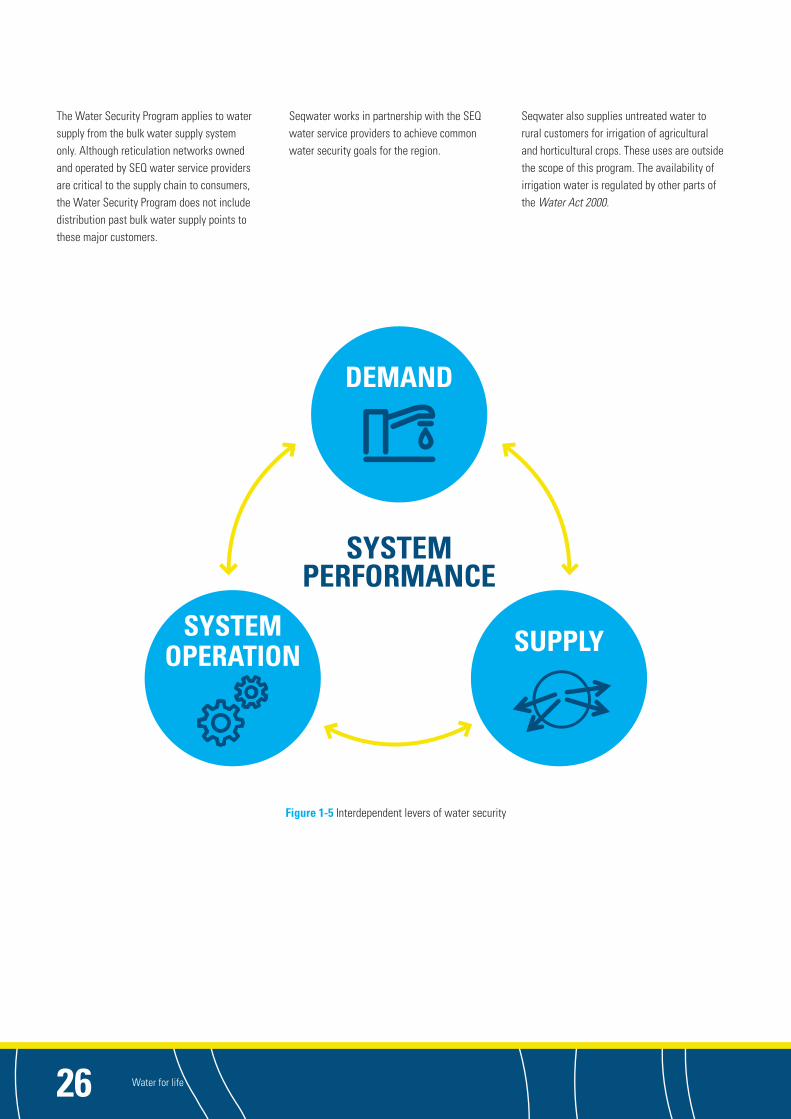
Water for life26
SYSTEM OPERATION
SYSTEM PERFORMANCE
DEMAND
SUPPLY
The Water Security Program applies to water supply from the bulk water supply system only. Although reticulation networks owned and operated by SEQ water service providers are critical to the supply chain to consumers, the Water Security Program does not include distribution past bulk water supply points to these major customers.
Figure 1-5 Interdependent levers of water security
Seqwater works in partnership with the SEQ water service providers to achieve common water security goals for the region.
Seqwater also supplies untreated water to rural customers for irrigation of agricultural and horticultural crops. These uses are outside the scope of this program. The availability of irrigation water is regulated by other parts of the Water Act 2000.

South East Queensland’s Water Security Program 2015-2045 27
1 .5 Planning for water security
1 .5 .1 KEY ELEMENTS OF WATER SECURITY
Within the context of SEQ’s bulk water supply system, water security is driven by overall system performance, which is made up of three interdependent levers (Figure 1-5 – demand, supply and system operation). There is the ability to change system performance by changing any one or a combination of these three levers.
Demand for water is directly influenced by:
• how much water every individual uses
• how the SEQ population changes over time
• how much water is lost during storage, treatment, and distribution
• changing needs of large industries
• development and uptake of water-efficient technologies and building standards.
Supply is directly influenced by:
• the amount of rainfall collected in dams and weirs
• evaporation from dams and weirs
• the condition and capacity of water treatment and transport infrastructure
• the availability of recycled and desalinated water.
By managing the system operation, Seqwater:
• optimises the water grid to meet daily demands across the region and within sub-regional supply zones
• uses the most efficient supply sources at any given time
• can incrementally upgrade particular supply infrastructure to meet growing demands in particular supply zones, thus enhancing overall system performance and delaying the need for expensive new infrastructure.
The direct influences on demand, supply and system operation are further influenced by a range of social, economic, environmental, political and technological factors. These factors are discussed in Chapter 2, and highlight the interdependency of water with all aspects of community members’ lives, and the challenges of long-term water security planning.
1 .5 .2 WATER SECURITY PROGRAM, VERSION 1 – JULY 2015
The Water Act 2000 specifies the broad content of the Water Security Program. The DEWS developed a guideline to provide guidance to Seqwater with the preparation of the Water Security Program. The guideline acknowledges the less-than-ideal short legislated timeframe (one year) for completion of the program, and allows Seqwater to deliver the full program in a staged approach.
This report details the first stage, or Version 1 (July 2015), of the Water Security Program. This version (Version 1) of the Water Security Program provides:
• the projected demand for bulk water supply in SEQ
• a detailed strategy for the bulk water supply system, including information on new bulk water supply sources for the water grid, and water supply shortfall risks for standalone communities
• information on the arrangements for operating bulk water supply infrastructure
• a broad outline of demand management measures
• an overview of drought risk and drought preparedness activities.
Version 2 of the Water Security Program is currently planned to be finalised by early 2017 and will include:
• incorporation of customer and community feedback on options and potential water futures
• detailed strategies for all standalone communities
• information on the operations and management of infrastructure
• detailed demand management strategies
• detailed drought response planning.
Future versions of the Water Security Program, planned for five-yearly updates or earlier as required, will integrate the long term strategy for the bulk water supply system with the drought response plan, as well as the more aspirational position outlined by the UN.
The methodology used to determine potential options is described in the sections that follow. Proposed solutions are underpinned by extensive hydrologic, hydraulic, economic and financial modelling and analysis.

Water for life28
Unlike the SEQ Water Strategy 2010, the Water Security Program integrates operational planning of water supply with long-term water supply planning. There is considerable benefit in this integration, as it allows robust operational management of the bulk water supply system to maximise efficiency before major augmentation of water supplies.
1 .5 .3 CUSTOMER AND COMMUNITY ENGAGEMENT
Seqwater is committed to engaging with its customers and the SEQ community to achieve a shared vision for the region’s water future.
Section 355 of the Water Act 2000 requires Seqwater to ‘make reasonable endeavours to consult with each of the designated water security entity’s customers likely to be affected by the water security program’. In the context of the Water Act 2000, Seqwater’s customers are the SEQ water service providers (refer Section 1.2). The SEQ water service providers have been consulted in the development of Version 1 of the Water Security Program, and will continue to be involved during preparation of Version 2 and beyond.
The staged delivery of the Water Security Program, as outlined in Section 1.5.2, enables Seqwater to seek the views of the community on the potential water futures outlined later in this report, and gain a deeper understanding of whole-of-community benefits and costs associated with various demand, supply and system operation options. Such a participatory approach is considered leading practice for water security planning, and Seqwater looks forward to engaging with the SEQ community on these matters.
1 .5 .4 INDEPENDENT REVIEW PANEL
To assist Seqwater in developing the Water Security Program, in 2014, Seqwater invited a group of seven esteemed industry professionals to provide independent advice on the approaches being taken and progressive outcomes of the planning work.
Panel members played a very important role in challenging Seqwater’s thinking and sharing experiences of similar water security planning processes in other large cities in Australia and overseas. Their varied backgrounds—water utilities, universities, water sensitive cities, economic development, engineering, social and environmental organisations—were invaluable in helping Seqwater to better understand the competing demands for water now and in the future, as well as providing insights into different assessment methodologies.

02. Influences
Influences02
South East Queensland’s Water Security Program 2015-2045 29
Influences02
Figure 2-1 Interrelationships between Water Security Program and external influences
Water supply to cities is under increasing pressure from a range of local and global factors. As populations grow in major urban centres, water and all other natural resources become increasingly scarce and more expensive to obtain, process and distribute. This results in the need for trade-offs if society wishes to maintain a high standard of living. This chapter outlines the key influences on the delivery of a
safe, secure and cost-effective water supply to SEQ. An understanding of these influences is needed to fully appreciate the complexity faced by decision-makers in predicting future demand and evaluating the benefits and costs of different supply sources, demand management measures and operating strategies.
The Water Security Program is fundamentally a regulatory document. However, it is also well positioned to contribute to broader planning processes and overall liveability in SEQ in areas such as climate adaptation, land use, agricultural and commercial development, public health, ecosystem services, recreation and visual and social amenity. Figure 2-1 illustrates the interrelationships between the Water Security Program and some of the factors (described in more detail below) that influence demand, supply and system operation over time.
WATER SECURITY PROGRAM
POLICY & REGULATION
SOCIETY
RESOURCE COMPETITIONENVIRONMENT
ECONOMY
TECHNOLOGY
CLIMATE
SYSTEM OPERATION
DEMAND
SUPPLY

Water for life30
2 .1 Climate
Ongoing climate changes and day-to-day weather affect the demand and supply sides of the water balance equation. For example, higher temperatures lead to increased water usage by individuals, businesses and industries, while reducing overall water availability due to higher evaporation rates from surface water storages. This combination clearly impacts how long existing supplies can last while continuing to meet the LOS objectives.
Australia has always had a variable climate, and SEQ is no exception. Traditionally, dams and weirs capture and store water during rainy seasons for use over ensuing drier periods. Some dams, such as Wivenhoe and Somerset, are also designed to accommodate excess floodwater flows, thus acting as a buffer during weather events. There is a limit to the long-term security of current water supply volumes in SEQ because the population continues to grow. This situation is exacerbated by increasingly variable weather patterns, characterised by longer dry periods between inflow events, more severe rain events, and higher average temperatures. Research institutions have developed a number of climate models that provide a range of climate change predictions for SEQ. For example, modelling by CSIRO (2014) predicts the following changes:
• an average annual temperature rise of 1°C (to 21.5 °C) by 2030 and by a further 0.6 °C to 2.1 °C (to between 22.1 °C and 23.6 °C) by 2070
• an increase in the average number of days per year hotter than 35°C from one per year (1971–2000) to two per year by 2030 and between three and 21 per year by 2070
• a 7% decrease in average annual rainfall by 2030 (from 1971–2000 average), and up to 9% decrease by 2070
• more intense rainfall when rain does occur, resulting in more flood events and deterioration in raw water quality
• fewer tropical cyclones overall, but a greater proportion in the more intense categories (three to five); by 2030 a 60% increase in storm intensity is projected, and by 2070 this rises to 140%
• a 200 km southward shift in the zone that generates cyclones, resulting in a greater impact on southern Queensland and northern New South Wales.
A rise in sea level is also predicted to increasingly impact on the SEQ coastline. A higher mean sea level elevates the risks of coastal inundation and, under the highest sea-level rise modelled, inundations that previously occurred once every 100 years could occur several times a year by the middle of this century (Australian Government, 2009).
Longer dry periods and higher temperatures increase the risk and potential severity of bushfires, which, if occurring in storage catchments, can have a significant impact on raw water quality.
Inherent weather variability and longer-term climate trends send a strong message to planners that SEQ’s bulk water supply system should be:
• less reliant on rainfall as the predominant source of supply
• suitably located and robust enough to withstand multiple impacts or environmental stressors
• resilient enough to resume normal operation after weather events.
2 .2 Policy and regulation
The viability of different water supply options relies on policies and regulations that support their implementation. As technology advances at a rapid rate, new regulations may be needed to facilitate their safe inclusion in the water source, treatment, distribution, demand management or system operating mix.
Community expectations, degree of integration and complexity are constantly changing in terms of health, lifestyle, economy and the environment. Policy and regulatory frameworks will therefore evolve to reflect these changes. The timing of such policy or regulatory changes may impact the feasibility of certain options and therefore must be considered when developing and revising the Water Security Program.
Long-term water security planning must be adaptive to accommodate an evolving policy and regulatory landscape. Seqwater also has a role in influencing policy change toward achieving safe, secure and reliable water supply to meet broader regional outcomes.
South East Queensland’s Water Security Program 2015-2045 31
2 .3 Society
The serviced population of SEQ is set to grow from its current (2015) level of 3.14 million to about 5.12 million in 2045. The pattern of growth is unlikely to be uniform across the region. This will result in demand for water and other municipal services increasing significantly in greenfield development areas, e.g. the Caloundra South, Caboolture West, Flagstone, Yarrabilba and Ripley residential communities, and state development areas such as Bromelton, as prescribed by the South East Queensland Regional Plan 2009-2031 (Queensland Government, 2009).
Urban infill and replacement of single dwellings with multiple-unit apartments/townhouses, particularly in the Brisbane City Council area, may cause incremental increases in residential water demand over the long term, especially if there is an associated increase in homes with only one occupant. However, that potential increase may be offset to some degree by the accompanying reduction in garden space requiring watering. Ongoing research is required to quantify the water demand impacts of urban infill and densification.
Demographics are also predicted to change due to an ageing population. Research has found that households containing older people tend to use more water (Urban Water Alliance, 2011).
During the Millennium Drought, government programs to manage water scarcity realised an unprecedented community response to reducing water consumption. Public information campaigns, coupled with the installation of water-efficient appliances, led to a significant fall in per capita daily demand. When the drought ended, consumption was predicted to rebound to near pre-drought levels. This has not eventuated, indicating a shift in the SEQ community’s attitude to water as a scarce resource and permanent behaviour change in actual usage.
2 .4 Resource competition
Although the Water Security Program is designed to meet LOS objectives for urban and industrial water, there are other important sectors in SEQ that rely on SEQ’s water resources.
The agricultural and horticultural industries provide essential produce for local consumers and for interstate and overseas export. As SEQ’s population increases, so does its need for food as well as water. There is also a growing demand trend for locally-grown produce instead of mass-produced commodities that are transported large distances by air, sea, road and rail for distribution throughout Australia. The current food production model is heavily reliant on fossil fuels for large-scale storage and transportation stages, the costs of which will increase over time and add to the nation’s greenhouse gas emissions.
Higher demand for food production in SEQ raises the possibility of additional water demand beyond the current planning parameters for the Water Security Program. In future, there may come a time when society is asked to make a call on who bears the cost of water supply to the agricultural sector.
Tourism and recreation also influence bulk water supply in several ways. Long-term growth in tourism and peak tourist seasons impact the Water Security Program in terms of overall annual demand, and the capability of water treatment plants to handle increasing seasonal peak loads for drinking water production. Seqwater must also balance community recreation on and around its surface water storages with maintaining raw water quality that is treatable by specific water treatment plant technology in each catchment to safe drinking water standards.
In the urban context, water management is very much about enhancing liveability. The concepts of ‘integrated urban water management’ and ‘water sensitive cities’ are growing in acceptance in Australia’s cities. Most new residential and commercial developments include some aspect of water design, e.g. greywater recycling through third or ‘purple’ pipe systems, stormwater collection for later use in watering green spaces or urban farms, and artificial wetlands to treat run-off before it enters natural waterways. These approaches not only reduce demand on the bulk water supply system, but provide other benefits such as visual amenity and urban cooling, the latter having the added advantage of reducing energy demand for cooling buildings. A cooperative approach that includes private developers and local government planning agencies is essential for Seqwater to adaptively plan for long-term water supply.
The interrelationship between water and energy is becoming increasingly apparent as the demands and costs of both water and energy production increase. Growth in demand for electricity will increase demand for water if traditional energy sources, such as coal-fired power stations, remain dominant. Renewable energy sources use much less water. Traditional water supplies from dams use much less energy than manufactured water from recycling and desalination processes; suggesting water and energy demands should be planned in parallel.
Even within the current system there is a need to balance the competing interests of flood mitigation and water security. Flood mitigation measures can reduce water stored in dams, which may impact adversely on water security. Striking the right balance between flood mitigation and water security is critical to long-term regional sustainability under all climatic conditions.

Water for life32
2 .5 Environment
SEQ’s water supply catchments play a critical role in Seqwater’s business, mainly because most of the bulk water supply is sourced from surface water run-off captured in lakes behind dams and weirs. Approximately 70% of the region’s land is in a drinking water catchment and of this, Seqwater owns only 4% (Table 2-1).
Table 2-1 Breakdown of catchment land in South East Queensland owned by Seqwater
Land Area (hectares)
SEQ region 2,280,000
Storage catchment area 1,660,000
Seqwater-owned land 73,500 (19,000 under water)
To add to this challenge, Seqwater manages predominantly open catchments, where people live and where intensive livestock production and processing, recreation and resource extraction take place. Some catchments, for example the Hinze Dam catchment in the Gold Coast hinterland, are relatively well-forested. However, most catchments, including those of the largest water supply storage dams—Wivenhoe and Somerset—receive run-off from intensively used land.
Catchments are the first step in the multiple-barrier approach to water treatment. The role of natural vegetation in filtering run-off enhances that first step, and has led to it being described as ‘green infrastructure’. Catchment land use clearly influences raw water quality that Seqwater monitors and treats in order to maintain stringent drinking water quality standards. Current catchment conditions are in need of improvement to improve raw water quality. If development and/or land degradation increases over time, there is potential for an incremental decline in raw water quality, which may require upgrades to existing water treatment plants so they produce the same or greater volume of drinking water. Ongoing research and data collection will inform this issue, as well as on-ground rehabilitation projects implemented under programs such as the Resilient Rivers Initiative (CoMSEQ, 2014).
Catchment land use and the stability of creek and river banks in particular, have a major influence on the transport of sediment and associated nutrient loads into surface water storages. Silting of dams and weirs can reduce storage volumes over time, thus impacting the assumed water available for supply modelling of the Water Security Program. A better understanding of both gradual and event-based siltation trends, forms part of Seqwater’s long-term adaptive planning.
The risk to raw water quality in open drinking water catchments was highlighted in January 2013 when a deluge from ex-Tropical Cyclone Oswald caused massive sediment transport into the mid-Brisbane River that temporarily shut down the region’s largest water treatment plants at Mount Crosby.
The natural environment is an important consideration in evaluating water supply infrastructure. All infrastructure options have potential environmental impacts that require mitigating, managing, or at worst, offsetting. For example, building new dams or raising the walls of existing dams inundates land that may lead to loss of biodiversity, cultural heritage, productive land and people’s livelihoods. Additional in-stream barriers can have a major impact on aquatic ecosystems, including fish movement and habitat for a range of species.
Manufactured water, i.e. desalinated seawater or purified recycled water creates other environmental impacts, such as disposal of highly saline or nutrient-laden by-products to fresh water or marine ecosystems, as well as high energy demands and the associated greenhouse gas emissions.
New groundwater development can put groundwater-dependent ecosystems at risk via the excessive lowering of water tables and seawater intrusion in coastal or offshore island aquifers.

South East Queensland’s Water Security Program 2015-2045 33
2 .6 Economy
The economics of water supply are interlinked with political, social and environmental considerations at the local, national and global levels, and also depend on community aspirations for related government services. Some of the complex economic influences on long-term water security are:
• balance of trade, value of the Australian dollar, and demand for commodities/products grown or manufactured in SEQ
• availability of finance for large infrastructure; government may need to increase expenditure on disaster recovery as a result of climate change impacts, e.g. bushfires, severe storms or flooding, thus raising pressure on global lending institutions
• diversity of financing sources
• the true economic value of both direct and indirect water use
• water pricing and cost recovery models, and how well they reflect ‘willingness to pay’ assessments
• affordability and productivity impacts on regional demand
• impact of unemployment on the community’s actual capacity to pay for water
• significant impacts of changes in energy prices on the cost of operating the bulk water supply system
• whether there is a price on carbon
• viability of water trading.
2 .7 Technology
Over time, advances in technology and associated cost efficiencies have the potential to increase the viability of certain water supply options, such as manufactured water production.
Increasing automation of control systems and real-time data monitoring of bulk water supply system performance can enhance operational efficiency and reduce ongoing costs.
At the consumer end, water-efficient technologies in homes and businesses can change the demand profile over time.
Greater sophistication and accessibility of instantaneous communication will enable households to better understand their individual water use and influence ongoing behaviour. The bulk water supplier could also use these technologies to update the community on demand management measures during normal and drought periods. Additionally, increased sophistication and reliability of weather forecasting will assist operational planning and communication with customers.
Technological criteria were important in assessing the various supply and demand options for the Water Security Program. These included:
• overall impacts of technology on cost of developing and maintaining infrastructure
• influence of renewable energy on the design, size and costs (capital and operating) of water infrastructure, particularly the energy-intensive sources
• the role of water-efficient devices in reducing demand
• how technological advances can enhance understanding of existing assets, how they are currently used, and how they may be better used to improve efficiency and extend asset life
• the impact of technology on the reliability of water supply assets
• how technology can improve dam safety and potentially reduce the costs of dam upgrades
• the potential for increases in cyber security risk.

Water for life34
2 .8 Megatrends
Many of the above influences can be termed ‘megatrends’. A megatrend is ‘a significant shift in social, environmental, economic, technological or geopolitical conditions that has the potential to reshape the way an organisation, industry,
or society operates in the future’ (CSIRO, 2014). Seqwater commissioned CSIRO to scan evidence-based megatrends and identify the implications for water security in SEQ. Results are summarised in Table 2-2.
Table 2-2 Summary of CSIRO megatrends
Megatrend Implications for SEQ
Climate change
− higher temperatures
− less rainfall
− sea level rise
− more severe droughts and floods
• increased risk and uncertainty in supply security, reliability and quality
• need for greater diversification in supply portfolio that includes climate-independent sources
• increase in residential water use
Population growth • increase in overall demand for water
Smaller households and ageing population • less efficient water use in the residential sector
Customer and community engagement • future direction for water management needs the buy-in of all stakeholder groups to better understand the true value of water to the community
• engagement helps improve water use efficiency and aids public acceptance of new infrastructure
Economic growth • increased development in catchments, whether urban, peri-urban, agricultural or resource extraction, challenges source water quality and yield
• increased tourist visitation will exacerbate peak demand pressure in specific locations and increase overall demand
Food production • increased demand for fresh produce grown in SEQ will place greater pressure on the region’s water resources
Liveability and sustainability • liveability of cities is being increasingly measured and monitored; effective water management adds significant value to integrated planning for enhanced liveability
• sustainability demands of water sensitive cities increasingly drive the need to adopt holistic water management
Technology and innovation • appliances that use less water can reduce per capita demand
• advances in sensor technologies and autonomous vehicles assist with detection of faults in buried infrastructure thus help prolong their life and reduce costs
• remote technologies and instantaneous data sharing improve decision-making and overall performance of the bulk water supply system
• greater automation increases risk of cyber attack
Energy demand • greater demand for electricity from the growing region may drive increased water demand for its production unless alternative energy sources are used
• climate-independent supplies and greater use of technology require more energy
Policy and regulation • a high level of collaboration is required between water providers and policy makers to smooth the impact of any short or long-term regulatory changes
• increased regulatory complexity can increase costs and time to implement projects
Private sector investment • greater private sector financing of water infrastructure will increase the importance of evaluating the holistic social returns on investment before projects proceed

03. Demand for drinking w
ater
Demand for drinking water03

South East Queensland’s Water Security Program 2015-2045 35
SYSTEM OPERATION
SYSTEM PERFORMANCE
DEMAND
SUPPLY
03 Demand fordrinking water
As outlined in Section 1.5.1, demand is one of the three interdependent levers that can be used to influence system performance (refer Figure 3-1). It is critical to have a thorough understanding of water demand, available water supplies and water grid operation because these interdependent components of the bulk water supply system underpin its overall performance.
Figure 3-1 System performance – demand
Before the Millennium Drought, SEQ residents were consuming up to 300 litres per person per day (L/p/day) and the non-residential sector consumed an equivalent of 156 L/p/day. Since the Millennium Drought, SEQ residents continue to use water efficiently, with current average residential consumption of 169 L/p/day. Research shows that water consumption inside the home is about 120-150 L/p/day, indicating a low level of outdoor water use.
Given this sustained residential water efficiency, assuming no significant change in community water conservation attitudes, the future total volume of water consumed within SEQ is likely to be driven by population growth. By 2045, the SEQ population connected to the bulk
water supply system (i.e. supplied by the water grid and standalone water supply schemes) is forecast to be about 5.1 million, 65% higher than at July 2014. Approximately 4% of the SEQ community will continue to rely on their own sources of supply, e.g. rainwater tanks, farm dams, groundwater bores.
Water consumption varies depending on factors such as temperature, uptake of water-efficient devices, tourist visitation to the region and behavioural norms. Therefore it is necessary to be prepared with appropriate responses to manage water security at all times. Robust water demand projections are a key input to short- and long-term planning for the efficient use of water.
To maintain confidence in the long-term demand forecast, Seqwater will continue to work collaboratively with the SEQ water service providers to monitor population growth, usage patterns, changes in water-efficient technologies and their take-up by consumers.
As at 1 January 2014, there were 1,099,009 water accounts in SEQ. Of this total, 1,044,518 were residential accounts. The balance was held by industry, businesses and government (non-residential users), which also contribute to water demand.
While agricultural and horticultural users typically draw raw water from the same sources, and are also customers of Seqwater, their water is not included in demand data for the purposes of achieving LOS objectives. Irrigation water is assigned a lower priority than urban water under Queensland’s regulatory framework and its availability from year to year is determined by specific water-sharing rules. Application of the rules typically results in earlier and more severe reductions in water provided for irrigation when storages fall below certain levels, compared to urban water.
This chapter outlines water use trends, plans for management of future water consumption and also explains how robust demand forecasts are generated and used for bulk water supply planning.
3 .1 Historical SEQ water demand
Before the Millennium Drought, there were less major incentives for urban and industrial users to reduce consumption because SEQ’s water storages contained sufficient volume to provide supplies to most of the region.
In response to demand management measures introduced during the Millennium Drought, there was a significant reduction in total daily water use (Figure 3-2). The community played a major role by adhering to water restrictions and implementing voluntary water-saving measures. Lasting change in water consumption behaviour is illustrated by an absence of rebound to pre-drought consumption levels in the ensuing years.
With the lifting of water restrictions in December 2009, water consumption stabilised during the period of permanent water conservation measures (i.e. low level water conservation restrictions including garden watering times and outdoor water efficiencies). A slight increase in average water consumption has occurred since 1 January 2013 when permanent water conservation measures were removed.

Water for life36
Figure 3-2 Historical water production trend (as an indicator of water consumption trend)
3 .2 Efficient water use
Managing water demand is key to water efficiency. Demand management is the proactive management of end use water consumption. It requires community participation and support to be successful. There are many benefits, including:
• delaying the need for new bulk water supply infrastructure
• reducing peak demands therefore delaying operational and infrastructure investment costs
• extending the period before drought response triggers are reached
• reducing water business operational costs, such as electricity pumping costs and pump maintenance
• providing customers with a greater understanding of their water use and the ability to make informed choices about how they use water.
The success of any demand management measure proposed for the Water Security Program will be reliant upon the support of the SEQ water service providers. Because the SEQ water service providers have direct connection with the end using water customers, it is critical that Seqwater works closely with the SEQ water service providers to develop, agree and implement demand management measures. The SEQ water service providers have worked collaboratively with Seqwater to that end, including preliminary drought response planning for this version of the Water Security Program.
There is a range of ongoing demand management measures being implemented in SEQ by various organisations. These measures (Table 3-1) help maintain the water-efficient behaviours developed during the Millennium Drought.
Seqwater understands that some of the requirements at the State and Australian Government level may be removed. Following the outcome of those governments’ reviews and the possible removal of the measures, demand management options in the Water Security Program will be reviewed to assess their impact. Revised demand management options will be detailed in future versions of the Water Security Program, if required.
0
20
40
60
80
100
120
140
160
180
0
200
400
600
800
1,000
1,200
1,400
Permanent water conservation measures
Level 1 restrictions
Level 2 restrictions
Level 3 restrictions
Level 4 restrictions
Level 5 restrictions
Level 6 restrictions
High level restrictions
Medium level restrictions
Prod
uctio
n (M
L/da
y)
Observed rainfall (Brisbane) (MM) Average fortnightly production (ML/day) Observed max temperature (Brisbane) (°C)
Jan-0
5Ju
l-05
Jan-0
6Ju
l-06
Jan-0
7Ju
l-07
Jan-0
8Ju
l-08
Jan-0
9Ju
l-09
Jan-1
0Ju
l-10
Jan-1
1Ju
l-11
Jan-1
2Ju
l-12
Jan-1
3Ju
l-13
Jan-1
4Ju
l-14
Jan-1
5
Observed rainfall (mm
) or observed max tem
p (°C)

South East Queensland’s Water Security Program 2015-2045 37
Table 3-1 Demand forecast – assumptions, uses and outputs
Organisation Demand management measures/programs
Seqwater • funding support for the smart metering program
• school and community education program
SEQ water service providers
• community education information about outdoor watering and indoor water efficiency
• pressure and leakage management (no targets but driven by operational efficiency)
• metering and billing
• water carter facilities such as fixed fill stations and metered hydrant standpipes to account for water use
State Government • water-efficient taps and showers–requirements in all new residential dwellings
• water-efficient toilets in all new buildings
• adopt a user-pays approach to water use billing for residential tenancies
• Bulk Water Supply Code requirements for coordinated planning.
State Government legislation for:
• SEQ water service providers’ existing customer billing and information requirements around water use and efficiency
• SEQ water service providers’ NetServ plans and requirement to include demand management. (NetServ is the SEQ water service providers’ legally required strategic planning document for water and wastewater for at least the next 20 years)
• SEQ water service providers’ ability to place a Water Efficiency Management Plan on their customers
Australian Government
Water Efficiency Labelling and Standards (WELS) Scheme (Australian Government, 2015). WELS is Australia’s water efficiency labelling scheme that requires certain products to be registered and labelled with their water efficiency in accordance with the standard set under the national Water Efficiency Labelling and Standards Act 2005

Water for life38
Figure 3-4 Breakdown of residential and non-residential consumption
The 18% increase in total water production volume after the drought can be attributed to both population growth and an increase in residential consumption rates. Removal of permanent water conservation measures from 1 January 2013 was also a contributing factor. Consumption rates during the severe restrictions were very low and some degree of rebound is not unexpected.
Figure 3-5 shows the overall SEQ water consumption soon after the drought broke in 2008-09 and later in the year 2013-14. This includes a sub-regional breakdown to illustrate how water consumption varies across SEQ. The variability in average per capita water use reflects several factors including:
• density of population – inner-city areas have increasing density with more unit complexes being constructed
• residential lot size – greenfield areas with more land availability may differ from inner-city areas where more infill and lot-splitting leads to smaller lot sizes
• differential soil types – sandy soils around coastal areas do not hold water as readily as areas with more clay-based soils. This may require a higher volume of outdoor watering to sustain gardens
• level of prior restrictions imposed for each area – Redland and the Sunshine Coast were not subject to the State Government restrictions imposed during the Millennium Drought
• differential uptake rates of prior rebate programs for implementation of water efficient devices.
3 .3 Current SEQ water demand
3 .3 .1 WATER CONSUMPTION
Residential users account for about 75% of the water consumed in SEQ, with the remainder predominantly consumed by non-residential users (Figure 3-3).
A further breakdown of residential and non-residential users is provided to illustrate the major water consumers within each of the residential and non-residential groups (Figure 3-4).
In 2013-14, the total water produced by Seqwater for consumption by households, industry and businesses was 285,569 ML. This was 18% higher than in 2008-09, at the time when severe water restrictions were removed (refer Figure 3-2). When severe water restrictions were in force, residential and non-residential water use was restricted to extremely low levels.
Figure 3-3 Breakdown of overall water consumption
74.8%
23.9%
1.3%
Multi dwelling property – residential Rural residential
Single dwelling property – residential
26%
25% 20%
12%
8%
6%
3%
Commercial Industrial Large manufacturing industrial
Tourism Rural Irrigation Government
74.8%
23.9%
1.3%
Multi dwelling property – residential Rural residential
Single dwelling property – residential
26%
25% 20%
12%
8%
6%
3%
Commercial Industrial Large manufacturing industrial
Tourism Rural Irrigation Government
75.5%
23.9%
0.6%
Residential Land use not givenNon-residential

South East Queensland’s Water Security Program 2015-2045 39
Figure 3-5 Annual average daily per capita demand (total of residential and non-residential)
3 .4 Future SEQ water demand
Forecasting demand is critical to planning future water supply. It involves a number of assumptions and a robust methodology, including continuous assessment and review. This section describes key aspects of the methodology, and the demand forecast adopted for the Water Security Program. More detail about the demand forecast is provided in Appendix C.
3 .4 .1 DEMAND FORECASTING METHODOLOGY
Key aspects of the demand forecasting methodology are:
• taking a building-block principles approach, considering the principal drivers of demand and assuming the level of efficiency brought about by ongoing demand management will continue
• constructing the demand forecast through main input factors, such as forecast residential and non-residential per capita usage, population growth and potential consumption growth driven by changes to water use behaviours
• employing robust historical demand analysis to determine cyclical usage patterns to forecast monthly demand
• forecasting demand at the LGA level using specific input factors for each LGA and then totalling these for a consolidated SEQ demand profile
• taking a consistent and structured approach to distribution of the LGA-based demand forecasts to a level of granularity that allows planning at the individual water treatment plant level. This is undertaken using the SEQ water service providers’ Geographic Information Systems (GIS) databases
• assessing sub-regional demand to develop appropriate monthly operational peaking factors to inform operational system modelling
• seeking agreement and validation of the demand forecast by the SEQ water service providers
• practising quality control measures and quality assurance to achieve robust demand forecasts.
The main components of the most likely demand forecast for SEQ are:
• population increase—the population forecast information used by Seqwater is sourced from the Queensland Government Statistician’s Office (QGSO). After consultation with the QGSO, the medium series population forecast was adopted
50
100
150
200
250
SEQ Northern Central Eastern Southern
Aver
age
daily
con
sum
ptio
n L/
p/da
y
2008-09 Residential 2008-09 Non-residential 2013-14 Residential 2013-14 Non-residential

Water for life40
• forecast per capita consumption—based on the best available information it is anticipated that there will be some level of rebound in consumption by the residential sector. For each LGA there is an expected post-rebound per capita value for both the residential and non-residential sectors. Historically, across multiple Australian jurisdictions, there has been some level of rebound in water consumption after periods of restrictions. It is expected that per capita consumption will increase until the end of 2018-19 and then stabilise
• system losses—Seqwater has to produce sufficient bulk water to meet the total demand of SEQ residents and the non-residential sector. This means that the demand forecast needs to incorporate the total bulk and retail network delivery loss volume, so that the net water produced actually meets the end consumers’ needs
• power station and Toowoomba demand—the SEQ power stations and Toowoomba Regional Council have supply contracts with Seqwater that allow them to take up to a specified volume of water from the bulk water supply system should they need it. While their short-term forecast demand is nil, Seqwater needs to set aside capacity to supply these customers should they need it in the future.
3 .4 .2 DEMAND FORECASTS (MOST LIKELY, HIGH AND LOW DEMAND)
Adopting the methodology outlined above, Seqwater has developed three urban water demand forecasts. The ‘most likely’ demand forecast is used as the primary forecast for Water Security Program assessments, while ‘low’ and ‘high’ demand forecasts are used for undertaking sensitivity analysis in case the actual demand differs from what has been
forecast as most likely to occur. The low and high demand profiles have been based on potential changes to per capita consumption. A number of other factors could also influence the demand forecast, and these will be assessed in future versions of the Water Security Program.
By 2045 the forecast most likely total bulk water demand for SEQ is 516,377 ML. This figure is 227,498 ML higher than the 2013-14 demand, an increase of 79% over 30 years. The average per capita usage is forecast to increase over the next few years from 169 L/p/day to 185 L/p/day for the residential sector, which is predicted to stabilise by 2018-19. The forecast for the non-residential sector (inclusive of power station demand and accounting for network losses) is forecast to stabilise at 100 L/p/day from 2018-19.
Figure 3-6 shows the low, most likely, and high demand forecasts for SEQ, expressed as water consumption in ML per annum.
Figure 3-6 Low, most likely, and high demand forecasts
100,000
200,000
300,000
400,000
500,000
600,000
Sout
Eas
t Que
ensl
and
dem
and
(ML/
annu
m)
Most likely demandLow demand High demand
2015
2016
2017
2018
2019
2020
2021
2022
2023
2024
2028
2029
2030
2034
2035
2036
2037
2025
2026
2027
2031
2032
2033
2038
2042
2043
2044
2045
2039
2040
2041
Demand profile 2015 2016 2017 2018 2045
Resi
dent
ial
(L/p
/day
) Low demand 171 171 171 171 171
Most likely 177 179 182 185 185
Upper demand 183 188 194 200 200
Non
-re
side
ntia
l (L
/p/d
ay) Low demand 86 86 86 86 86
Most likely 90 92 94 96 96
Upper demand 90 92 94 96 96
Pow
er
stat
ions
(L
/p/d
ay)
All profiles 4 4 4 4 4

South East Queensland’s Water Security Program 2015-2045 41
Figure 3-7 30-year most likely average daily demand forecast per LGA
The annual demand forecast for the whole region has been reached by totalling the daily projected demand for each LGA. The demand for each LGA has been derived by multiplying the forecast population and the forecast per capita demand. By 30 June 2019 the demand profile is built on an assumption that the per capita consumption rebounds to the figures identified in Figure 3-6 and remains constant thereafter.
The relative contributions of each LGA to total annual demand over the 30-year planning horizon are shown in Figure 3-7.
3 .4 .3 SEQ WATER SERVICE PROVIDER ENDORSEMENT OF THE DEMAND FORECAST
Throughout 2014, Seqwater and the SEQ water service providers worked closely to develop
the building-block principles and generate the most likely SEQ demand forecast. The SEQ water service providers formally agreed with the assumptions and regional average per capita demand used to calculate the forecast demand profile. Seqwater is committed to ongoing collaboration with SEQ water service providers to proactively plan for any changes to the regional and LGA-based demand forecast.
0
100,000
200,000
300,000
400,000
500,000
600,000
Tota
l ann
ual d
eman
d M
L/an
num
Brisbane Gold Coast Ipswich Sunshine Coast Moreton Bay Regional Logan Redland Noosa Lockyer/Scenic Rim/Somerset Power stations
2015
2020
2025
2030
2035
2040
2045
Water for life42
3 .4 .4 ONGOING MONITORING OF WATER DEMAND
Ongoing monitoring and assessment is a key to maintaining the currency of demand forecasts. Seqwater continues to monitor consumption trends using Seqwater water production data and account level consumption data provided by the SEQ water service providers. This information is compared to monthly demand forecasts to track the robustness of the most likely demand forecast.
To maintain a robust long-term demand forecast profile, Seqwater will continue to monitor and review the following three drivers of demand.
3 .4 .4 .1 Potential rebound in forecast per capita residential demand by each LGA
The long-term most likely demand forecast assumes that residential per capita consumption is increasing from 169 L/p/day and then stabilising at a regional SEQ average of 185 L/p/day in 2018-19. Each individual LGA within SEQ has specific forecast per capita consumption levels that when combined, represent the 185 L/p/day forecast in 2018-19. It has been assumed that over time, households will change their water-use behaviour having been subjected to severe water restrictions during the Millennium Drought. Seqwater is actively tracking the weekly per capita usage to see if there is any trending that supports or challenges this assumption. Seqwater and the SEQ water service providers will be also using smart metering technology to monitor detailed water usage patterns and behaviour for an increasing number of residential properties throughout the region.
3 .4 .4 .2 Forecast per capita non-residential demand growth
Constant per capita demand for the non-residential sector has been assumed for the SEQ demand forecast. Analysis of historical demand for the entire non-residential sector since the Millennium Drought has shown very stable per capita consumption. It is likely this stable pattern is the result of permanent structural water-saving measures that many businesses introduced during and after the Millennium Drought. Due to a lack of predictive information on long-term industry and business growth, the forecast growth in non-residential accounts and associated volume has been linked to the SEQ population forecast. This approach means non-residential demand growth is estimated to rise as a fixed volumetric proportion of the overall demand forecast. Seqwater will continue to work with the SEQ water service providers to determine better ways of forecasting demand in the non-residential sector, and will revise forecasts if required in future versions of the Water Security Program.
3 .4 .4 .3 SEQ forecast population growth distribution
To assess the ongoing ability of the bulk water supply system to supply water where it is needed, Seqwater assigns the forecast most likely demand for each LGA to supply nodes—the points at which Seqwater transfers responsibility to the SEQ water service providers for distribution of water to end users. This process generates a region-wide picture of ‘nodal demand’, and relies on information provided by the SEQ water service providers on specific locations where population growth may be concentrated. To maintain accuracy of the nodal demand predictions, Seqwater will continue to work with SEQ water service providers.
It is important to regularly review population growth distribution and the impacts on nodal demand. For example, increasing demand in a particular nodal area, above what was initially forecast, may trigger the need to amend plans for future planned supply augmentations.
04. Water supply
Water supply04

South East Queensland’s Water Security Program 2015-2045 43
SYSTEM OPERATION
SYSTEM PERFORMANCE
SUPPLY
DEMAND
04 Watersupply
Figure 4-2 Percentage of storage capacity Wivenhoe, Somerset and North Pine dams, 2005-2015
As outlined in Section 1.3, Seqwater owns and operates a bulk water supply system with diverse sources of supply. Seqwater treats and transports water from these sources to meet demand and influence system performance (Figure 4-1). This section provides an overview of the sources available for drinking water supply.
4 .1 Existing supply capacity
Seqwater owns and operates 26 dams for both irrigation and urban water supply. Appendix D provides details of the dams related to urban water supply. Some of these underpin the region’s bulk water security and are known as key bulk water storages. The total combined storage capacity of the key bulk water storages for water supply purposes is 2,185,488 ML. This capacity is equivalent to 874,000 Olympic-sized swimming pools. In addition to the surface water storages, Seqwater also owns and operates two groundwater borefields located on North Stradbroke Island and Bribie Island (Appendix D).
Figure 4-1 System performance – supplyThe Millennium Drought significantly reduced the water supply storage levels of the main dams that supply a large proportion of the population in South East Queensland. Figure 4-2 shows the decline in combined storage capacity of Wivenhoe, Somerset and North Pine dams during the worst of the drought (2005 to 2008) and after the drought to January 2015. The extent of the Millennium Drought changed the thinking of government as well as water users, highlighting the need for efficient use of water and diverse sources of supply.
In response to the Millennium Drought, two climate-resilient water sources, the Gold Coast Desalination Plant and the Western Corridor Recycled Water Scheme were built. These sources are able to contribute to supply under certain operational conditions (refer Chapter 5).
The Gold Coast Desalination Plant is both a source of water and a water treatment plant, and the Western Corridor Recycled Water Scheme provides additional source water that requires treatment using existing water treatment plant capacity.
The Gold Coast Desalination Plant provides additional system resilience (it has been and will continue to be used to supply SEQ in times of drought and flood), and capacity to supply the region. It is operated in a hot-standby mode to balance cost and water security (refer Chapter 5).
The Western Corridor Recycled Water Scheme comprises advanced water treatment plants at Bundamba, Gibson Island and Luggage Point, which treat water using micro-filtration, reverse osmosis and advanced oxidation processes.
0%
10%
20%
30%
40%
50%
60%
70%
80%
90%
100%
*Maximum full supply level shown is 100%. Levels above this relate to the �ood storage compartment.
Full
supp
ly le
vel
Combined storage % of full supply level (Wivenhoe, Somerset and North Pine)
Jan-0
5Ju
n-05
Nov-05
Apr-06
Sep-06
Feb-07
Jul-0
7Dec-
07
May-08
Oct-08
Mar-09
Aug-09
Jun-1
0
Nov-10
Sep-11
Feb-12
Jul-1
2Dec-
12
May-13
Aug-14
Jan-1
5
Jan-1
0Apr-
11Oct-
13
Mar-14

Water for life44
Figure 4-3 Relative make up of different supply sources pre- and post-drought
The Western Corridor Recycled Water Scheme connects the advanced water treatment plants to Wivenhoe Dam and provides the ability to pump purified recycled water (PRW) to Wivenhoe Dam to supplement SEQ drinking water supplies.
In addition to supplementing drinking water supplies, the Western Corridor Recycled Water Scheme supplies PRW for industrial use.
POWER STATIONS
The Western Corridor Recycled Water Scheme was designed to also supply recycled water to the Swanbank, Tarong and Tarong North power stations for use as cooling water.
The Swanbank power station was traditionally supplied from Wivenhoe Dam and Moogerah Dam, and the Tarong power stations from Wivenhoe Dam and Boondooma Dam (outside SEQ). The supply of recycled water replaced the use of surface water extracted from these dams in 2007 and continued until December 2013.
The Swanbank power station’s demand for cooling water reduced significantly when it was converted from coal-fired to gas-fired. Water-use efficiencies are being implemented at the Tarong power stations to reduce demand for water. While the improved water efficiencies have reduced water demand, it is understood that under drought scenarios, demand for water will increase.
When the drought ended, the Western Corridor Recycled Water Scheme ceased production of PRW and has been placed in care-and-maintenance mode, owing to the higher cost of this source compared with surface water sources in SEQ. Based on assessments to date, the most efficient use of the Western Corridor Recycled Water Scheme is to maintain its
function as a drought response asset. It will be recommissioned to supply the power stations and supplement drinking water supplies by pumping into Wivenhoe Dam when water security is low and the combined volume of the SEQ key bulk water storages reaches 40%. The Western Corridor Recycled Water Scheme will remain a significant potential contributor to water supply in future droughts and is included in drought response planning for the Water Security Program (refer Section 6.2.4).
The makeup of supply capacity before and after the Millennium Drought is illustrated in Figure 4-3. The greater diversity and interconnection of the region’s supply sources today (indicated in the pie chart on the right) enables Seqwater to better adapt to changing demand and supply needs when compared with pre-drought times, when the region was 98% reliant on surface water storages (refer to the pie chart on the left). The volumes that are supplied from these sources are different to the capacity, as a result of the operating strategy in place at the time.
4 .2 Water treatment
All water requires treatment before use as drinking water. Once captured, raw (untreated) water is released or pumped from dams, underground aquifers, or the sea and transported to water treatment plants where it undergoes physical and chemical treatment processes, including disinfection.
Seqwater applies a ‘multi-barrier’ approach to producing safe drinking water. There are three major stages in the water production process, which provide opportunities to introduce a barrier. These are source water protection (drinking water catchments), drinking water treatment and the drinking water distribution system.
The multi-barrier approach to the protection, production and distribution of drinking water takes local conditions and challenges into account while offering an integrated system of procedures, processes and tools to reduce the risk of, or prevent, contamination of drinking water supplies.
Most of SEQ’s drinking water is harvested from surface water sources in open catchments; that is, catchments where the use of land and access to this land is not strictly limited or prohibited to the public. Water sourced from open catchments can be more susceptible to variations in quantity and quality. This means in SEQ, water treatment begins at the source—the catchments. Healthy catchments aid in reducing treatment costs and benefit the community.
98%
2%
Surface Groundwater Surface Desalination Recycled Groundwater
79%
11%
8%
2%
Before the Millennium Drought Today

South East Queensland’s Water Security Program 2015-2045 45
Seqwater works in partnership with government, neighbours and the broader community to promote a whole-of-catchment approach to water quality and environmental management.
The next step in the multi–barrier approach is the water treatment systems and processes. Seqwater’s water treatment plants are located throughout the region (refer Figure 1-1). The processes and technologies used to remove contaminants from raw water and to improve and protect water quality are similar to those used all around the world. The most widely applied water treatment process, known as conventional treatment, is used by the majority of Seqwater’s water treatment plants to treat surface water and groundwater. Appendix D provides a summary of Seqwater’s water treatment plants.
Innovative water treatment technologies are becoming increasingly important in responding to the challenges associated with some of Seqwater’s raw water sources. Advanced water treatment, comprising conventional treatment and additional process streams such as ozonation and biological activated carbon filtration, enhance the removal of toxins, organic matter, pesticides and disinfection by-products. These advanced treatment processes are used at the Landers Shute, Ewen Maddock and Noosa water treatment plants on the Sunshine Coast and at Banksia Beach Water Treatment Plant on Bribie Island.
Membrane treatment processes, typically used for desalination and recycled water treatment, remove finer particles and molecules, including salt in the case of reverse osmosis membranes. These treatment processes produce water of a consistent quality and are the focus of much research, largely aimed at reducing energy requirements and improving membrane life. Membranes are used at the Gold Coast Desalination Plant and to treat recycled water at the three advanced water treatment plants at Bundamba, Luggage Point and Gibson Island, which together make up the Western Corridor Recycled Water Scheme.
Drinking water treated at Seqwater’s plants meets the stringent standards set by the Australian Drinking Water Guidelines (NHMRC, NRMMC (2011)), which have been endorsed by the World Health Organization.
4 .3 Water transport
4 .3 .1 BULK WATER TRANSPORT NETWORK
The bulk water transport network is the final physical barrier in the multi-barrier approach. After treated water leaves the water treatment plant, water is disinfected. Disinfection residuals are then maintained through the bulk water system for ongoing protection.
Regional interconnectors are a feature of Seqwater’s water grid (refer Appendix D). The interconnectors efficiently transport bulk water to distribution networks owned and operated by the SEQ water service providers. The transfer of responsibility to the water service providers occurs at designated bulk water supply points.
The water grid is particularly important when long-term supply is challenged (i.e. during drought), or when there are short-term supply disruptions (e.g. where water quality issues arise or the water level of storages has been lowered for operational or maintenance reasons). This allows supplementation of water from sources that are more secure to locations where supplies are low.
Water quality management across the region benefits from multiple sources of supply. This integrated operation is a significant change from the traditional approach, where there is a dependency on individual water treatment plants.
The integrated structure of the water grid has translated into significant increases in the reliability and resilience of SEQ’s water supply. Seqwater’s integrated planning approach and outcomes are discussed in more detail in Chapter 7.
4 .3 .2 RETICULATED SUPPLIES TO END USERS
SEQ water service providers are responsible for the distribution and sale of treated drinking water to end users, including standalone communities with reticulated water supplies, as outlined in Section 1.2.
Treated water is conveyed by gravity or pumped through bulk water supply pipelines to service reservoirs, which are strategically located on hills. Service reservoirs maintain a constant supply and pressure of water to the mains that distribute water to households and businesses. The SEQ water service providers are responsible for maintaining water quality throughout their reticulation networks.
4 .4 Assessing system capacity
When developing operating strategies for the bulk water supply system, it is essential to have a good understanding of the capability of existing infrastructure. Most Seqwater water treatment plants were designed at a time when water quality legislation was not as stringent as it is today and the original design capacity of many of these plants is greater than that which can actually be achieved while complying with water quality standards.
Seqwater has undertaken extensive investigations to develop accurate and consistent asset information to be used for current and future planning and in managing risks. These investigations have included:
• a review of existing asset information and technical reports
• assessment of the capacity of the assets
• assessment of the capability of the assets to meet the required performance for drinking water quality and quantity
• identification of critical attributes of infrastructure relevant to assessment of major process limitations.

Water for life46
Figure 4-4 Estimated preliminary LOS yield-demand
There is a strong relationship between the condition of catchments and the reliable capacities of the water treatment plants which source water from each catchment, particularly during high rainfall events. For example:
• Hinze and Little Nerang dams have catchments that are assessed as being in ‘good’ condition. Consequently Mudgeeraba and Molendinar water treatment plants benefit from relatively stable raw water quality and are rarely subject to events that significantly affect plant capacity
• the Mount Crosby water treatment plants source water from ‘poor’ condition catchments (Somerset, Wivenhoe, mid-Brisbane River and Lockyer) and therefore experience significant variations in raw water quality which can considerably reduce plant capacity (as evidenced during the January 2011 floods and the January 2013 weather event associated with ex Tropical Cyclone Oswald).
Catchment land use and its relationship with water quality and quantity materially affect the capability and performance of the bulk water supply system (refer Section 2.5 for further discussion). Seqwater’s adaptive planning approach includes ongoing assessments of the condition of the regional water supply catchments, including the potential for active intervention in catchment decline through management and improvement programs.
4 .5 LOS yield
The LOS yield is the maximum annual average volume of water that can be supplied to urban and industrial customers by the bulk water supply system every year, while meeting the desired LOS objectives. The LOS yield assumes all water supply assets are operating at full capacity. It is dependent on, among other factors, the LOS objectives themselves, the supply infrastructure and demand forecast, but is independent of current storage levels. Its determination considers the widest variability in inflows possible (i.e. stochastic data) using the historical record as a basis. The Regional
Stochastic Model is used to test a large number of demand, supply and operational scenarios and determines whether they meet the LOS objectives.
The LOS yield is determined by undertaking supply system modelling that incrementally increases the annual average demand volume, until any of the LOS objectives fail. The modelling keeps the existing infrastructure constant and therefore tests the system capability to meet demand without incorporating system augmentations.
When the above modelling approach was applied for the existing infrastructure, the Baroon Pocket Dam minimum operating level was the first LOS objective to fail. Based on this failure, the total annual average demand volume that can be met is estimated to be about 415,000 ML/annum. Therefore 415,000 ML/annum represents the derived LOS yield.
The modelling demonstrates that in order to be compliant with the LOS objectives and meet demand greater than 415,000 ML/annum, system augmentations will be required. Modelling results for LOS statistics for the existing system are provided in Appendix D.
Figure 4-4 shows the outcome of the supply demand analysis for the LOS yield of 415,000 ML/annum with a range of demand scenarios. Only the LOS yield line for the existing infrastructure, system operation and the most likely demand forecast is plotted. It shows that if water consumption tracks along the most likely demand forecast, infrastructure augmentation would likely be required around 2028. A higher water consumption rate would bring this year closer to 2025 and a lower consumption rate would push it out to around 2035.
The slight lowering of yield when compared to previous estimates of 430,000 ML/annum (DEWS, 2013) can be attributed to the combined effects of the following key variables:
• a new version of the Regional Stochastic Model
• the extension of the historical inflow data sequence to include the final years of the Millennium Drought
• updated infrastructure arrangements and associated transfer rules
• updated demand distributions throughout the region.
0
100,000
200,000
300,000
400,000
500,000
600,000
700,000
Sout
h Ea
st Q
ueen
slan
d de
man
d M
L/an
num
High demand Most likely demand Low demand LOS yield 415,000 ML/annum
Possible augumentation of supply
2015
2017
2019
2021
2023
2025
2027
2029
2033
2035
2037
2039
2041
2045
2031
2043

South East Queensland’s Water Security Program 2015-2045 47
4 .6 Potential new sources of supply
As demand for water grows in the future, new sources of water supply will be required within 30 years to continue to achieve the LOS objectives. This section provides a high level overview of potential new water supply sources.
4 .6 .1 SURFACE WATER
Rainfall in a catchment is conveyed by creeks and rivers to dams where it is stored. Using surface water is the conventional method of supplying water, and the most common in SEQ. This form of supply is susceptible to weather-related changes including floods, droughts and changes to run-off, in addition to changes in catchment conditions.
Treating surface water is generally lower in cost and uses less energy than treating other sources. However, it can produce more solid waste, particularly during wet weather events when sediment loads can increase markedly. Solid waste production is generally a secondary consideration compared to energy intensity and operating costs.
The State of Queensland, under the Water Act 2000, holds all rights to water resources, and grants access to users through water allocations or water licences. The sustainable limits for use are specified in water resource plans, which are subordinate legislation to the Water Act 2000.
Four water resource plans are in place in SEQ—Mary basin, Moreton basin, Logan basin, and Gold Coast. Each plan sets flow objectives for maintaining aquatic environments while recognising existing water allocations and, in some cases, volumes reserved for future water requirements.
Seqwater’s raw water operations are guided by resource operations licences for each water supply scheme. The rules contained in these licences enable Seqwater to meet the objectives of each water resource plan, including adherence to water allocation limits and releasing flows from storages to meet environmental needs.
The Mary basin plan contains a strategic reserve of 150,000 ML/annum, and the Logan basin plan reserves 37,000 ML/annum for future use. The Moreton and Gold Coast basins have little opportunity for further allocation of surface water. Chapter 7 provides detailed options on potential future surface water supply sources that are consistent with water resource plan objectives for servicing future demand.
4 .6 .2 GROUNDWATER
Groundwater is sourced through bores and usually requires less treatment than water obtained from other water sources owing to its higher quality. However, it is challenging to predict the long-term sustainable yield of groundwater sources, and the impact of extraction on groundwater-dependent ecosystems is an important consideration. The main groundwater sources in SEQ are aquifers beneath:
• Moreton Island
• North Stradbroke Island
• Bribie Island
• Cooloola-Teewah sand mass.
These and other smaller groundwater areas were thoroughly investigated during the Millennium Drought for potential additional supply. The investigations found considerable constraints to developing these resources. However, for completeness of the Water Security Program, all previous work was revisited and formed part of the supply options assessment (refer to Chapter 7).
4 .6 .3 SEAWATER DESALINATION
Seawater desalination is the process of removing salt from seawater and is carried out using reverse osmosis membranes or distillation. Desalination is an energy-intensive process, however, it reliably produces drinking water under most conditions. The Gold Coast Desalination Plant, a reverse osmosis plant, provided emergency back-up supply to the water grid following the 2011 flood and 2013 weather event. Those events compromised production from some conventional water treatment plants supplying the bulk water supply system, and demonstrated the benefits of diverse and climate-resilient sources of supply and system interconnection.
Desalination plants are typically constructed on the coast and are therefore susceptible to sea level rise, high tides and storm surges. These risks can be mitigated through design. Innovations in desalination are resulting in the process becoming more energy efficient and less expensive, potentially enhancing desalination as a future supply source.
4 .6 .4 PURIFIED RECYCLED WATER (PRW)
An effective way to get the most out of a water supply or any resource is to use the resource more than once, if at all possible. Recycled water is dependent on the amount of feed water available and is less energy intensive than desalination, but requires more energy for treatment than surface water sources. Recycling water can also result in reduced nutrient discharge to receiving waterways and thus provides an additional environmental benefit compared to other water sources.
Recycled water has many potential uses, and supplies typically fall into three categories:
• non-potable reuse
• indirect potable reuse
• direct potable reuse.
4 .6 .4 .1 Non-potable reuse
Non-potable recycled water supply schemes are designed to supply recycled water for purposes other than drinking or primary contact. Such schemes require a distribution system in addition to the water and wastewater networks and are often referred to as ‘third pipe’ schemes. The type and degree of recycled water treatment within such schemes is matched to the end use and referred to as ‘fit-for-purpose’.
There are now many different uses for recycled water as a key component of the water supply, ranging from residential to agricultural and industrial uses, and irrigation of green open spaces.
The intended use of the water drives the level of treatment required and therefore the cost. As with any end use, it is important that recycled water quality meets the requirements of the purpose for which it is intended.

Water for life48
Non-potable reuse typically reduces the demand on drinking water supplies. Non-potable reuse schemes can also provide sustainable solutions for end users in the face of a drought.
4 .6 .4 .2 Indirect potable reuse
Indirect potable reuse (IPR) refers to schemes in which recycled water is supplied to an existing raw water supply, generally a storage dam or aquifer. Here it is blended with the raw water supply before treatment at a water treatment plant and then distributed through the water supply network.
Unplanned IPR
Unplanned IPR already occurs in many places in the world, including SEQ. It generally occurs when a town or city discharges its treated wastewater into a river, stream or aquifer upstream of another town or city, which then extracts water from that same water source for its drinking water supplies.
A prime example of this is London, which is supplied with drinking water extracted from the Thames River downstream of towns such as Oxford.
Planned IPR
Planned IPR involves the intentional inclusion of purified recycled water to the community’s supplies by mixing the recycled water with existing supply in raw water storages such as dams or aquifers, then treating the blended raw water and supplying it as drinking water to the community. Recycled water is purified using advanced water treatment processes before being introduced to raw water storages.
Globally, IPR schemes have been implemented (or are currently planned) in a small, but rapidly growing number of communities.
Purified recycled water is more expensive to produce than surface water, which results in reduced utilisation when water security is high if cheaper sources are available. The higher cost and need for available storage in dams renders IPR options most suitable for drought response rather than contributing to base supply.
4 .6 .4 .3 Direct potable reuse
Direct potable reuse (DPR) refers to schemes in which recycled water is supplied either directly to a water treatment plant or directly into the water supply network. Similar to IPR, DPR is used to augment drinking water supplies. One benefit of supplying recycled water directly into the network is that schemes are not reliant on storages that are subject to evaporation and fluctuating capacity. Another benefit of DPR schemes is that they generally require less pumping than IPR schemes, as the water does not need to be transferred to raw water storages, which can be far away.
The Windhoek scheme in Namibia has been operating since 1969, and contributes up to 50% of the potable water supply.
More recently, as surface and groundwater supplies have become stressed and less reliable, the need for DPR has increased. There are two full-scale DPR schemes in the USA, one in Big Spring, Texas, which has been operating since 2013; the other in Wichita Falls, Texas, which has been in operating since 2014. A third DPR scheme in Cloudcroft, New Mexico, is scheduled for completion in 2015. Two more Texan communities are now planning for direct potable reuse.
DPR schemes are in their relative infancy, with the exception of the Windhoek scheme in Namibia. As such, knowledge and experience about the long-term performance and reliability of such schemes is growing. DPR schemes are currently not allowed in Queensland under the Public Health Regulation 2005.
Given that a new supply to meet long term-demand is not required until beyond 2030, it is likely that knowledge and long-term operational experience may render the DPR options more attractive which may result in the removal of regulatory barriers by the time the next new source is required.
4 .6 .5 DECENTRALISED SCHEMES
Decentralised water supply schemes provide water for localised uses and thus can reduce demand on the bulk water supply system.
Options include local collection of stormwater and rainwater, sewer mining, and recycled water for specific uses. These supply options require a sound regulatory framework and the commitment of various parties (e.g. state and local governments, property developers, and the bulk and retail water supply authorities) to be holistically planned, constructed appropriately and maintained over the long term. These schemes often provide other benefits, including environmental improvements, community well-being, visual amenity, improved system resilience, and/or local flood reduction.
4 .6 .6 UNCONVENTIONAL WATER SUPPLIES
Unconventional water supplies include options such as covering surface water storages to reduce evaporation, and cloud seeding. These options are generally less favourable because of their high cost, lack of proven effectiveness and/or the small volume of water they produce.
4 .6 .7 NON-STRUCTURAL OPTIONS
Non-structural options are those that can affect system performance (either with direct supplies or by reducing demand) by means other than physically extracting or producing water. Changes to planning or building regulations, for example, can facilitate greater uptake of water-efficient systems and technologies at the household or community level, thereby reducing residential demand. Other examples of non-structural options include trading water between different sectors, water pricing and cost-sharing arrangements, water governance frameworks that apportion responsibility differently, recycled water policy, and policies on environmental flows versus consumptive allocations.

05. Operating strategy for the water grid
Operating strategy for the water grid05
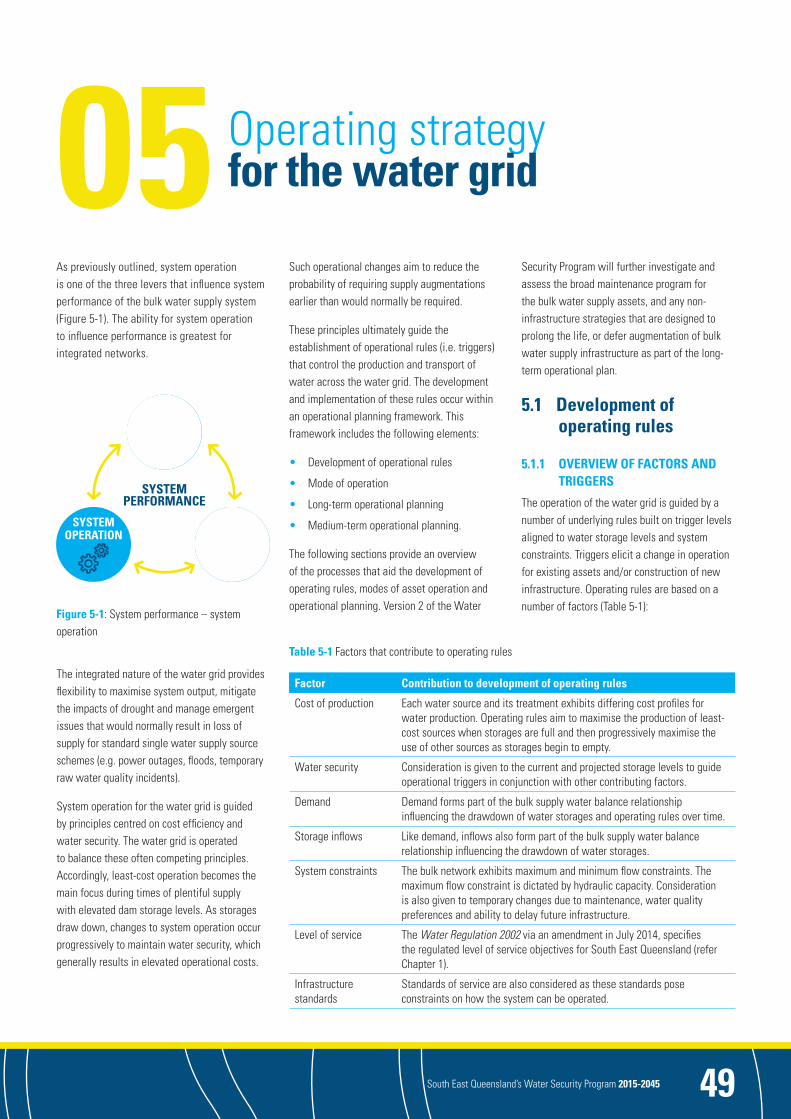
South East Queensland’s Water Security Program 2015-2045 49
SYSTEM OPERATION
SYSTEM PERFORMANCE
SUPPLY
DEMAND
05 Operating strategyfor the water grid
As previously outlined, system operation is one of the three levers that influence system performance of the bulk water supply system (Figure 5-1). The ability for system operation to influence performance is greatest for integrated networks.
The integrated nature of the water grid provides flexibility to maximise system output, mitigate the impacts of drought and manage emergent issues that would normally result in loss of supply for standard single water supply source schemes (e.g. power outages, floods, temporary raw water quality incidents).
System operation for the water grid is guided by principles centred on cost efficiency and water security. The water grid is operated to balance these often competing principles. Accordingly, least-cost operation becomes the main focus during times of plentiful supply with elevated dam storage levels. As storages draw down, changes to system operation occur progressively to maintain water security, which generally results in elevated operational costs.
Such operational changes aim to reduce the probability of requiring supply augmentations earlier than would normally be required.
These principles ultimately guide the establishment of operational rules (i.e. triggers) that control the production and transport of water across the water grid. The development and implementation of these rules occur within an operational planning framework. This framework includes the following elements:
• Development of operational rules
• Mode of operation
• Long-term operational planning
• Medium-term operational planning.
The following sections provide an overview of the processes that aid the development of operating rules, modes of asset operation and operational planning. Version 2 of the Water
Figure 5-1: System performance – system operation
Security Program will further investigate and assess the broad maintenance program for the bulk water supply assets, and any non-infrastructure strategies that are designed to prolong the life, or defer augmentation of bulk water supply infrastructure as part of the long-term operational plan.
5 .1 Development of operating rules
5 .1 .1 OVERVIEW OF FACTORS AND TRIGGERS
The operation of the water grid is guided by a number of underlying rules built on trigger levels aligned to water storage levels and system constraints. Triggers elicit a change in operation for existing assets and/or construction of new infrastructure. Operating rules are based on a number of factors (Table 5-1):
Table 5-1 Factors that contribute to operating rules
Factor Contribution to development of operating rules
Cost of production Each water source and its treatment exhibits differing cost profiles for water production. Operating rules aim to maximise the production of least-cost sources when storages are full and then progressively maximise the use of other sources as storages begin to empty.
Water security Consideration is given to the current and projected storage levels to guide operational triggers in conjunction with other contributing factors.
Demand Demand forms part of the bulk supply water balance relationship influencing the drawdown of water storages and operating rules over time.
Storage inflows Like demand, inflows also form part of the bulk supply water balance relationship influencing the drawdown of water storages.
System constraints The bulk network exhibits maximum and minimum flow constraints. The maximum flow constraint is dictated by hydraulic capacity. Consideration is also given to temporary changes due to maintenance, water quality preferences and ability to delay future infrastructure.
Level of service The Water Regulation 2002 via an amendment in July 2014, specifies the regulated level of service objectives for South East Queensland (refer Chapter 1).
Infrastructure standards
Standards of service are also considered as these standards pose constraints on how the system can be operated.
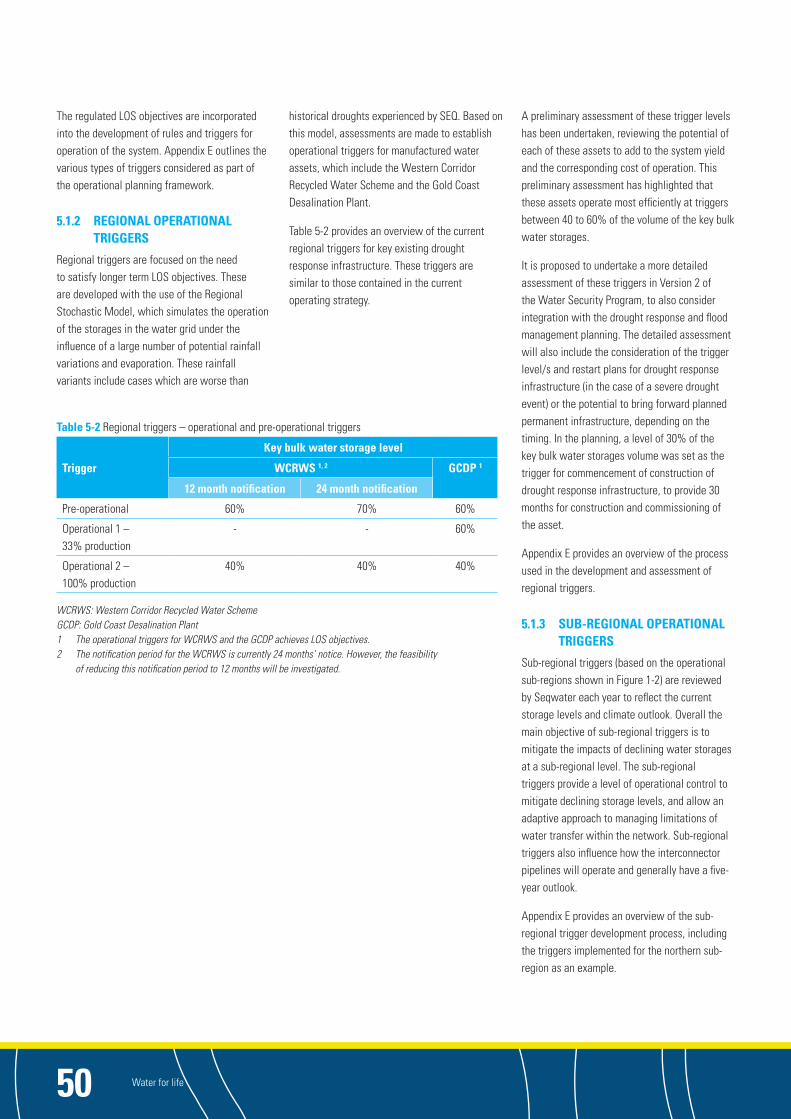
Water for life50
Table 5-2 Regional triggers – operational and pre-operational triggers
Trigger
Key bulk water storage level
WCRWS 1, 2 GCDP 1
12 month notification 24 month notification
Pre-operational 60% 70% 60%
Operational 1 – 33% production
- - 60%
Operational 2 – 100% production
40% 40% 40%
WCRWS: Western Corridor Recycled Water Scheme GCDP: Gold Coast Desalination Plant 1 The operational triggers for WCRWS and the GCDP achieves LOS objectives. 2 The notification period for the WCRWS is currently 24 months’ notice. However, the feasibility
of reducing this notification period to 12 months will be investigated.
The regulated LOS objectives are incorporated into the development of rules and triggers for operation of the system. Appendix E outlines the various types of triggers considered as part of the operational planning framework.
5 .1 .2 REGIONAL OPERATIONAL TRIGGERS
Regional triggers are focused on the need to satisfy longer term LOS objectives. These are developed with the use of the Regional Stochastic Model, which simulates the operation of the storages in the water grid under the influence of a large number of potential rainfall variations and evaporation. These rainfall variants include cases which are worse than
historical droughts experienced by SEQ. Based on this model, assessments are made to establish operational triggers for manufactured water assets, which include the Western Corridor Recycled Water Scheme and the Gold Coast Desalination Plant.
Table 5-2 provides an overview of the current regional triggers for key existing drought response infrastructure. These triggers are similar to those contained in the current operating strategy.
A preliminary assessment of these trigger levels has been undertaken, reviewing the potential of each of these assets to add to the system yield and the corresponding cost of operation. This preliminary assessment has highlighted that these assets operate most efficiently at triggers between 40 to 60% of the volume of the key bulk water storages.
It is proposed to undertake a more detailed assessment of these triggers in Version 2 of the Water Security Program, to also consider integration with the drought response and flood management planning. The detailed assessment will also include the consideration of the trigger level/s and restart plans for drought response infrastructure (in the case of a severe drought event) or the potential to bring forward planned permanent infrastructure, depending on the timing. In the planning, a level of 30% of the key bulk water storages volume was set as the trigger for commencement of construction of drought response infrastructure, to provide 30 months for construction and commissioning of the asset.
Appendix E provides an overview of the process used in the development and assessment of regional triggers.
5 .1 .3 SUB-REGIONAL OPERATIONAL TRIGGERS
Sub-regional triggers (based on the operational sub-regions shown in Figure 1-2) are reviewed by Seqwater each year to reflect the current storage levels and climate outlook. Overall the main objective of sub-regional triggers is to mitigate the impacts of declining water storages at a sub-regional level. The sub-regional triggers provide a level of operational control to mitigate declining storage levels, and allow an adaptive approach to managing limitations of water transfer within the network. Sub-regional triggers also influence how the interconnector pipelines will operate and generally have a five-year outlook.
Appendix E provides an overview of the sub-regional trigger development process, including the triggers implemented for the northern sub-region as an example.

South East Queensland’s Water Security Program 2015-2045 51
Mode 1 – OperationalAsset is used day-to-day to supply required demand.
Mode 2 – Hot standbyAsset can be made available at short notice
and is usually used as a contingency measure. The notification period to elevate to operational mode is asset specific.
Mode 3 – Care and maintenance (cold standby)Asset is able to have a longer notice period before being required. This mode optimises maintenance
costs when the asset is not required.
Mode 4 – Decommission/retireAsset is no longer required for water security or other reasons and a more cost-effective alternative
is available, a decision is made to retire or decommission it.
Diminishing operational cost
Figure 5-2 Mode of operation–cost profile and description
5 .2 Asset modes of operation
The mode of operation of assets has a direct influence on the operation and maintenance costs of the bulk water supply system. For this reason it is important to establish an acceptable mode of operation for an asset to achieve optimal value over the longer term, with consideration of both water security and cost efficiency.
The following modes of operation are considered by Seqwater across its asset portfolio:
• Operational
• Hot standby
• Care and maintenance (Cold standby)
• Decommission/retire.
The most efficient assets are used to minimise costs and the less efficient ones are in either hot standby or cold standby, with other inefficient assets decommissioned/retired. A description of each of these modes is provided in Figure 5-2.
The decision on the mode of operation is based on financial and non-financial assessments (e.g. risk and time to reach operational triggers). Examples of where this process has been applied are:
• Mount Crosby water treatment plants – base load operational assets required to achieve day-to-day supply needs for the region
• Gold Coast Desalination Plant – hot standby with a notification period of 48 hours for 100% production capability. The dominant
purpose of this mode of operation is system reliability and resilience, which requires a short notification period. The reliability need has been demonstrated during flood events over the last five years, which required the operation of the plant to supplement drinking water supply to SEQ
• Ewen Maddock and Banksia Beach water treatment plants – care and maintenance mode of operation with a six-month notification period is applied to these assets. Both treatment plants are designated as drought response measures at a sub-regional level, allowing for longer notification periods

Water for life52
• Western Corridor Recycled Water Scheme – care and maintenance mode of operation is adopted with a 24-month notification period. The Western Corridor Recycled Water Scheme forms a regional drought response measure and therefore a longer notification period is currently adopted.
The notification period for the different modes of operation is an important consideration when scheduling renewal and maintenance work. Such works need to be accommodated within the agreed notification period so the respective assets will be available if required. This approach allows for reduced operational cost under various modes of operation.
The decision to decommission/retire an asset is ultimately based on a number of considerations, outlined further in Appendix E. Seqwater considers the mode of operation for an asset as part of its ongoing business operations.
5 .3 Long-term 30-year operational planning
To understand the long-term operation of the water grid, Seqwater is developing a 30-year operational plan. This plan will incorporate the outcomes of this Water Security Program, operational cost considerations, network constraints, storage inflows, operating rules and future demand. The operational plan will help guide infrastructure investment along with the demand and supply elements influencing system performance.
The benefits to be gained from a 30-year operational plan include most notably that it:
• contributes to the comparison between infrastructure options based on operational cost
• identifies various operational modes to achieve supply of water at least cost
• enables understanding of the operational modes for the network under fair weather and drought conditions to allow for network infrastructure planning that considers the need to operate the network in a certain manner and maintain adequate capacity into the future
• assists with understanding network constraints that can be addressed to further improve operational performance.
A key aspect of the 30-year operational plan is the consideration of the following two inflow sets as part of the modelling. These inflows are derived from the stochastic inflow set and include:
• fair weather – the fair weather inflow represents a case with regional dam storages at elevated levels (i.e. high water security). Under this situation the bulk supply system operation is reflective of least-cost considerations. To mimic this outcome, the stochastic inflow set has been reviewed and an inflow sequence representing the 50th percentile has been chosen
• drought – to gain an understanding on how the bulk supply system responds during drought, a drought inflow sequence has been derived from the stochastic inflow set. For this purpose the probability of a one in 1,000-year drought inflow sequence was chosen.
The process for developing the long-term operational plan is outlined in Appendix E.

South East Queensland’s Water Security Program 2015-2045 53
5 .4 Medium-term operational planning
The raw water sources, treatment facilities and network that make up the water grid can be operated in a range of ways on a regional and sub-regional scale to achieve a range of objectives.
Since the construction of the water grid, the balance of water security versus cost efficiency has generally led to a ‘cost-minimisation mode’ of operation. This means that when water security is at a high level (i.e. high water storage volumes), the system can be operated in a way that minimises costs. In this mode, production volumes from water treatment plants with the lowest cost production are maximised without adversely impacting on water security.
As storage levels decrease, focus will begin to shift towards water security drivers, to avoid adverse effects of drought and potentially delay future augmentations. Trigger levels are developed for particular storages, which once reached, will reduce production from that source and will be supplemented with the next least-cost option for supply.
These concepts are captured as part of the medium-term operational strategy for the water grid. This strategy aims to facilitate the following:
• develop, review and monitor triggers that maintain water security, quality, reliability and cost considerations
• mitigate risks to water supply security
• delay and offset the need to invest in capital infrastructure solutions
• provide operational protocols so drought response measures are implemented when required.
A key focus of medium-term operational planning is sub-regional triggers. This level of planning also looks at the current and future mode of operation for assets and their notification period(s) to determine relevant pre-operational triggers, which are additional to their operational triggers (i.e. when the asset is physically required to operate). This is critical to making specific drought response infrastructure available when required.
A medium-term operational plan is produced annually and is reviewed twice a year to operate the water grid effectively.

Water for life54
5 .5 Opportunities for future improvement
The operational framework will improve over time; future iterations of the Water Security Program will capture new knowledge and the outputs of more sophisticated modelling tools, as outlined below.
Current modelling tools used for cost optimisation currently only have the capacity to assess single rainfall/inflow events. Understanding how the system can respond across a spectrum of inflow cases would provide an enhanced understanding of system operations.
A critical consideration of operational planning is the cost of water production by water source. Current information is sufficiently accurate to allow for qualitative comparison, however further assessment of these cost factors will be required for optimal results.
Demands will fluctuate over time as projections are based on the best available information at the time of their development. Annual reviews of operations aim to capture changes that may influence system operations over the medium term (i.e. one- to five-year period).
In parallel with the development of this program (Version 1) studies are underway in preparation for future revisions. These studies have focused on identifying opportunities relating to existing surface water and treatment assets to assist in achieving improved system performance. Initial studies identified that the following opportunities require further detailed assessment:
• Six Mile Creek Dam (Lake Macdonald) – Based on a recent allocation increase from 3,495 ML/day to 5,000 ML/day, there is an opportunity to increase capacity at the Noosa Water Treatment Plant to improve the system yield position. The application of sub-regional operational controls in the assessment may further assist this position
• Cooloolabin/Wappa Dam System – Additional yield is available in the Cooloolabin/Wappa system, which is currently restricted by water treatment plant capacity. An increment to treatment capacity in conjunction with sub-regional operational controls may provide benefits in achieving higher yield outcomes
• Ewen Maddock Dam – The existing licence allocation should be reviewed in light of the currently proposed operation of the storage. As the dam has regional application as a drought response, the ability to draw down the storage over a shorter period may have merit. Therefore, the current licence allocation position should be reviewed to establish the feasibility of this proposition
• Baroon Pocket Dam (Lake Baroon) – The inclusion of sub-regional triggers in the long-term yield assessment may provide opportunities to extend yield for the integrated bulk supply system and delay significant capital expenditure
• Wivenhoe Dam – Lockyer Creek flows, from both stream and groundwater into the Brisbane River system below Wivenhoe Dam, should be assessed to understand how this source can be more efficiently used to support urban water supply needs.
More detailed assessments of the above opportunities will be considered to further gauge the ability of existing assets to contribute to regional yield outcomes.

06. Planning for climate extrem
es
Planning for climate extremes06

South East Queensland’s Water Security Program 2015-2045 55
06 Planning forclimate extremes
6 .1 Introduction
Australia is a country of extremes, particularly when it comes to climate. The SEQ region has experienced both extremes in the past decade, from the Millennium Drought to the floods of 2011 and 2013.
Water security is paramount to the health and prosperity of the region. It is therefore important that the SEQ bulk water supply system can perform both in the face of extreme climatic conditions and operate efficiently under normal climatic conditions.
6 .2 Planning for drought
Due to the low probability of a severe drought (i.e. 1:10,000 event) impacting on water security in the next 10 years, Seqwater has time to prepare detailed drought response plans for the water grid and standalone communities. This first version of the Water Security Program provides the overall approach to drought response planning, including methods for assessing drought risk, and plans Seqwater has in place to enable completion of drought response plans.
6 .2 .1 THE IMPACT OF DROUGHT
Drought impacts all aspects of the water cycle, from reducing the availability of supplies in surface water storages as a result of reduced rainfall and increased evaporation, through to increasing the demand for water, particularly for outdoor use as soils become drier and plants require additional water to survive.
The interconnection of the SEQ bulk water supply system in response to the Millennium Drought has improved the water security of the region (refer Section 1.3.1 for more information), however, a drought will occur in the future, and it could be more severe than previously experienced. Therefore a proactive and responsible approach
to long-term water security planning that accommodates community input is vital for SEQ.
Experience has shown that every drought is different, and that the response needs to be adaptive and tailored to the conditions at the time. The response to drought will depend on where the effects of the drought are experienced and when. For example, if a drought leads to lower water storages in only part of the region, the water grid may have enough capacity to transport water from other parts.
The LOS objectives prescribe minimum system performance requirements for drought through setting the probability of reaching minimum dam operating levels, the essential minimum supply volume and applying medium level restrictions for the SEQ region. Seqwater has developed an adaptive drought response approach to achieve the LOS objectives across a range of drought conditions, with consideration of supply, demand and operational responses.
Most communities in SEQ are connected to a water supply from the key bulk water storages, however there are some standalone communities that have their own raw water supply sources. The actions taken for the water grid will be different to those for standalone communities, however all plans target achievement of the LOS objectives. The drought response for standalone communities is addressed in Section 9.6.
In developing an adaptive drought response approach, it is crucial to understand the risk associated with declining water storages as population grows. As part of this version of the Water Security Program, the probability of declining water storages within the next 5, 10 and 20 years has been assessed.
Version 2 will provide greater detail on the drought response for key bulk water storages based on the approach outlined below.
6 .2 .2 DROUGHT RISK ASSESSMENT
The Regional Stochastic Model provides information on the statistics of operation of the bulk water supply system. This information is used to assess levels of risk associated with drought occurring over the next 5, 10 and 20 years based on the existing system and its current operational strategy.
The assessments include:
• assessing the compliance of the current drought response with the LOS objectives
• determining the cumulative probability of storages reaching key response levels
• monitoring the actual drawdown of the storages against the drawdown of the storages assuming Millennium Drought inflows.
Seqwater has to operate the bulk water supply system so that the LOS objectives are complied with at all times. The Regional Stochastic Model was used to determine how long the current operating strategy could maintain compliance with the LOS objectives. Results of the assessment (shown in Table 6-1) indicate that the current operating strategy is likely to continue to comply for more than 10 years because an annual demand of 400,000 ML/annum passed all the LOS objectives. The assessment indicates that with the current operating strategy, the probability of reaching drought response levels is low.
Without the Western Corridor Recycled Water Scheme, an annual demand of 390,000 ML passed the LOS objectives. However, even at this lower demand the drought risk is much greater as there is a higher frequency of the key bulk water storages reaching 30% and 5%, and the Brisbane system and Baroon Pocket Dam reaching minimum operating level.

Water for life56
Table 6-1 LOS objectives – compliance assessment with and without Western Corridor Recycled Water Scheme
LOS objectiveCurrent operating strategy
with WCRWSCurrent operating strategy
with no WCRWS
LOS yield 400,000 ML/annum 390,000 ML/annum
CriteriaLOS objective
statistic*Value achieved Value achieved
Medium level restrictions >10 47 52
Essential minimum supply volume >10,000 >100,000 22,197
Brisbane storages minimum operating level >10,000 >100,000 36,995
Baroon Pocket Dam minimum operating level >10,000 13,875 11,100
Gold Coast storages minimum operating level >10,000 >100,000 >100,000
Duration in medium level restrictions (months) <12 8 9
WCRWS: Western Corridor Recycled Water Scheme * See Table 1-2 for details of LOS criteria and complying values
Compliance with the LOS objectives does not mean storages will never reach drought response levels. It means the frequency of reaching them on average will be no greater than the specified LOS objectives in the regulation. More information on when storages could be expected to reach drought response levels over the next 20 years is obtained from cumulative probability modelling.
The Regional Stochastic Model was used to simulate the behaviour of the bulk water supply system and assess the risk of drought occurring. Table 6-2 shows the cumulative probability of key bulk water storages (combined) reaching 60%, 40% and 30% over the next 20 years. The probability analysis started with a regional storage level of 95.9%, following rainfall associated with Tropical Cyclone (TC) Marcia in February 2015 and operation of the system according to Seqwater’s current operating strategy.
Table 6-2 Cumulative probability of the key bulk water storages reaching trigger levels
Within (years) Probability of reaching 60%
Probability of reaching 40%
Probability of reaching 30%
5 7% 0.35% 0.02%
10 22% 2.9% 0.3%
15 38% 6.7% 1.0%
20 53% 11.3% 2.0%
Before TC Marcia dumped more than 330 millimetres (mm) of rain on the Sunshine Coast and 65 mm in the Lockyer Valley, the SEQ key bulk water storage capacity was 83%, and was tracking a similar trajectory to the first 18 months of the Millennium Drought. Figure 6-1 shows simulated storage levels from August 2013 to November 2019 (blue line) if Millennium Drought inflow patterns were repeated, and also shows actual storage levels (orange line).
Monitoring of storage levels against drought inflows can illustrate that even though the cumulative probability of reaching drought response levels may be low, it is still possible that storages could drop to these levels in the medium term.

South East Queensland’s Water Security Program 2015-2045 57
Figure 6-1 Actual and six- year simulated key bulk water storage levels
The drawdown of the storages depends on a range of factors including inflows, rainfall, evaporation, catchment conditions, system operation and demand. Figure 6-1 clearly shows how significantly water security can change as a result of either long-term or short-term weather events.
Further information on the modelling and assessment for drought risk is provided in Appendix F.
6 .2 .3 APPROACH TO DROUGHT RESPONSE
Adaptive responses need to be made to droughts, due to their unpredictable nature. This means that as a drought unfolds, the response is proportional to severity and duration, and also takes into account varying influences such as changing population, water-use behaviours, infrastructure, and technology. It is also important that operational strategies
and triggers for action or review are clearly identified in advance of a drought situation, in order to develop a plan to optimise all available drought response options, for supply infrastructure, demand management measures and operational actions.
Key lessons learned during the Millennium Drought about drought response measures included the importance of being well prepared for drought and the need to work together consistently across the region on any drought response.
This is reflected in the drought response framework (Figure 6-2) and the approach to SEQ bulk water storage response and the response for standalone supply schemes (Chapter 9).
The following principles have been developed in collaboration with the SEQ water service providers and underpin drought response planning in SEQ:
• Drought response will be developed collaboratively with relevant stakeholders including the SEQ water service providers who will work together to complete demand management measures to achieve the best value for the SEQ community.
• The principles of transparency and accountability for making decisions will be observed throughout the drought response process.
• Drought response planning will be adaptive, enabling flexibility to adjust the approach and measures to accommodate characteristics of the drought event.
• While the LOS is applied equally across SEQ, the drought response measures to meet the LOS may differ to suit local circumstances.
• Drought response measures will consider public health.
• Communications and educational materials that encourage voluntary demand management measures are to be implemented prior to water restrictions.
• Drought responses for standalone communities will be developed using the above principles in addition to consideration of water carting to the community.
0%
10%
20%
30%
40%
50%
60%
70%
80%
90%
100%
Full
supp
ly le
vel
Key bulk water storages with Millennium Drought inflows commencing in September 2013 Recorded storage levels
Aug-13
Nov-13
Feb-14
May-14
Aug-14
Nov-14
Feb-15
May-15
Aug-15
Nov-15
Feb-16
May-16
Nov-16
Feb-17
Aug-17
Nov-17
Feb-18
May-18
Aug-18
May-19
Aug-19
Aug-16
May-17
Nov-18
Feb-19
Nov-19
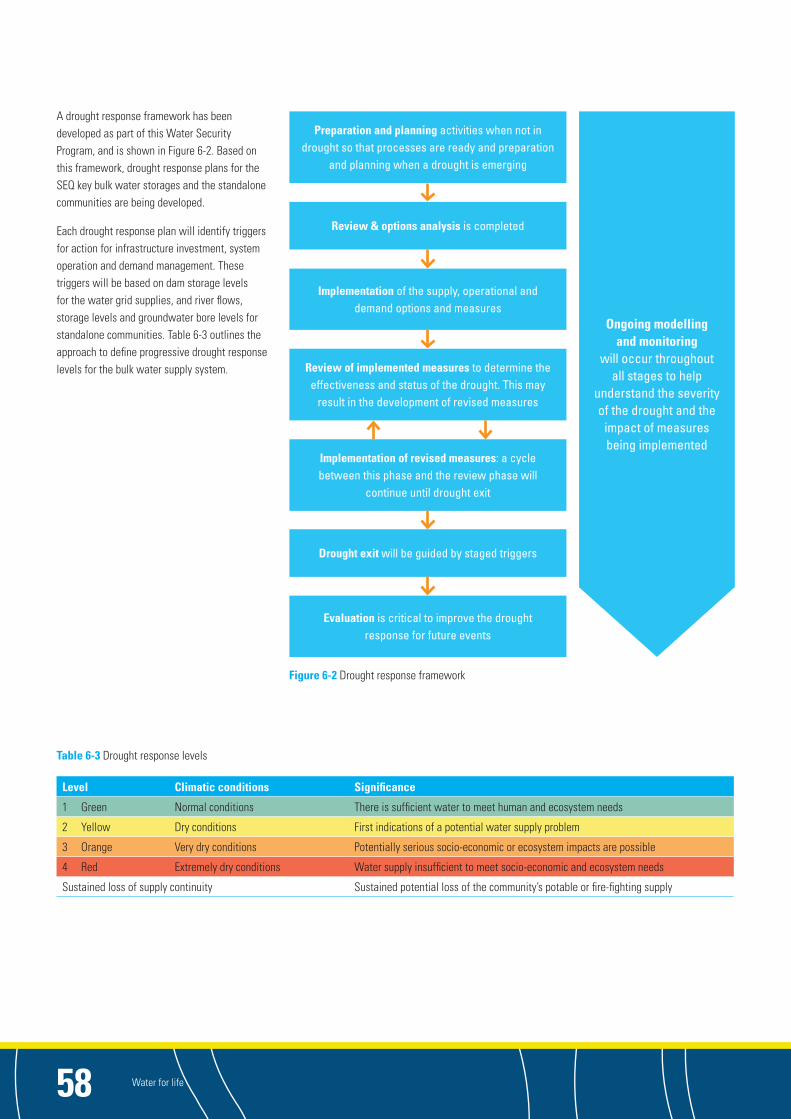
Water for life58
Figure 6-2 Drought response framework
A drought response framework has been developed as part of this Water Security Program, and is shown in Figure 6-2. Based on this framework, drought response plans for the SEQ key bulk water storages and the standalone communities are being developed.
Each drought response plan will identify triggers for action for infrastructure investment, system operation and demand management. These triggers will be based on dam storage levels for the water grid supplies, and river flows, storage levels and groundwater bore levels for standalone communities. Table 6-3 outlines the approach to define progressive drought response levels for the bulk water supply system.
Table 6-3 Drought response levels
Level Climatic conditions Significance
1 Green Normal conditions There is sufficient water to meet human and ecosystem needs
2 Yellow Dry conditions First indications of a potential water supply problem
3 Orange Very dry conditions Potentially serious socio-economic or ecosystem impacts are possible
4 Red Extremely dry conditions Water supply insufficient to meet socio-economic and ecosystem needs
Sustained loss of supply continuity Sustained potential loss of the community’s potable or fire-fighting supply
Preparation and planning activities when not in drought so that processes are ready and preparation
and planning when a drought is emerging
Review & options analysis is completed
Ongoing modelling and monitoring
will occur throughout all stages to help
understand the severity of the drought and the
impact of measures being implemented
Implementation of the supply, operational and demand options and measures
Review of implemented measures to determine the effectiveness and status of the drought. This may
result in the development of revised measures
Implementation of revised measures: a cycle between this phase and the review phase will
continue until drought exit
Drought exit will be guided by staged triggers
Evaluation is critical to improve the drought response for future events

South East Queensland’s Water Security Program 2015-2045 59
A drought response plan for the water grid will aim to optimise use of the regional dams and climate-resilient assets. The purpose of the drought response is to extend the supply of the key bulk water storages, defer significant capital investment of drought response infrastructure and prevent the supply from falling to essential minimum supply levels. As specified in the LOS objectives, at essential minimum supply level, there may be only 100 L/p/day available for combined residential and non-residential use.
The triggers for drought action are based on the combined key bulk water supply storage volumes as a percentage of the combined capacity. This was chosen as it is easily measurable, representative of water security, and reflects that the key bulk water storages are part of a connected water grid that can transport water between areas to maintain continuity of supply.
The triggering of different actions taken when specified regional dam capacities are reached
also prepares the community for future measures so they are informed and ready to respond when required to conserve water. Figure 6-3 provides an outline of the drought response approach, based on declining levels in the bulk water storages. Following further modelling, detailed drought response options, including reviews of triggers, will be prepared for inclusion in Version 2 of the Water Security Program.
A range of staged and planned measures will be implemented to achieve reductions in demand, consistent with Figure 6-3 in times of drought.
Figure 6-3 Approach to drought response planning for the water grid in South East Queensland
100%
70%
60%
50%
40%
30%
20%15%10%
Water efficiency awareness
Drought readiness
Drought response
Drought contingency
Essential minimum supply volume (TBA)
Regional triggers
Minimum operating level
100%
General water efficiency messaging
Business as usual operational measures
70% Increase in general water efficiency messaging in preparation for drought
50% Target 150 L/p/day residential demand Initial drought response messaging and non-residential voluntary programs
SEQ water service providers may consider implementing alternative demand management programs (e.g. pricing signals)
40% Target 140 L/p/day residential demand Medium level messaging and medium level water restrictions
Appropriate residential rebate or retrofit program
30% Target 130 L/p/day residential demand Medium level messaging and non-residential requirements
Drought contingency water infrastructure commences
20% Target 120 L/p/day residential demand High messaging with appropriate industry partners, high level water restrictions and extension of rebate program
15% Target 100 L/p/day residential demand Strong messaging and extreme level water restrictions
5-10% Target 100 L/p/day (residential and non-residential) Strong messaging and emergency water restrictions
Essential minimum supply measures
Infrastructure planning, land
acquisition, approvals
D – Gold Coast Desalination Plant
33% production
C – Western Corridor Recycled Water
Scheme and Gold Coast Desalination
Plant 100% production
B – Construction trigger
Approximately 30-month construction period
A – Infrastructure available 5%
Notes:
1. Actions nominated for each level will not commence, regardless of the percentage level being reached, until a review has been completed which considers at least the climatic conditions, population growth, demand, status of supply infrastructure and network operations
2. Percentages are based on the volumes of the SEQ key bulk water storages
3. Targets are SEQ regional averages.

Water for life60
6 .2 .4 POTENTIAL ACTIONS FOR DROUGHT RESPONSE
Drought response actions include measures associated with increasing climate-resilient supply, decreasing demand, as well as changing the operation of the water grid to optimise available water resources.
In times of drought, demand management may provide a better value-for-money solution than the development of new climate-resilient infrastructure. However, if the drought is sustained and severe it will be necessary to implement an operational supply response and/or develop new contingency infrastructure to avoid reaching the essential minimum supply volume. Detailed drought response actions will be included in Version 2.
6 .2 .4 .1 Demand management response
Experience from the Millennium Drought showed that it was necessary to keep the community informed and allow sufficient time to change
water-use habits. Hence it is important to maintain the message of the importance of water efficiency as a foundation upon which to build greater efficiency as water security declines.
The demand management response to drought has been developed collaboratively with the SEQ water service providers through a series of workshops and reviews. The response is a logically stepped approach, increasing measures from voluntary to regulatory with consistent messaging throughout. The approach also encourages consistency across the region supplied by the SEQ key bulk water supply storages.
While the SEQ water service providers were involved in the development of this approach, they have expressed concern about the implementation of water restrictions. It was agreed that given the need to meet the requirements of the LOS objectives, restrictions were a sound approach to responding to drought. However, the SEQ water service providers at the time of approaching drought may choose
to implement alternative demand management measures to reduce demand to targeted levels, including pricing signals.
Seqwater and the SEQ water service providers are working with DEWS to develop a framework to achieve consistency across the region well before drought water restrictions are required, and will be seeking input from the community prior to finalising demand management response measures.
The key demand management measures proposed for the key bulk water storages are presented in Table 6-4. A home retrofit-style program commences at a similar time to implementing drought response infrastructure, and non-residential programs occur in line with residential programs to encourage shared responsibility for demand reduction across all sectors.

South East Queensland’s Water Security Program 2015-2045 61
Table 6-4 Key demand management measures in response to drought
Dam level response trigger
Actions
100-70% • Residential water efficiency program
– Garden program – Outdoor cleaning program – Indoor program• Note other ongoing measures such as pressure and leakage management, metering, losses programs, etc. are assumed to
remain active
70-50% • Increased residential water efficiency program
– Garden program
– Outdoor cleaning program
– Indoor program
• Non-residential voluntary measures on-line
• Non-residential voluntary programs for specific user groups
50-40% • Pre-drought messaging
• Non-residential voluntary programs – on-site water audits
• Non-residential voluntary program – for specific user groups
• SEQ water service providers may consider implementing alternative demand management programs (e.g. pricing signals)
40-30% • Drought messaging target 140 L/p/day
• Medium level water restrictions (target 140 L/p/day residential demand)
• Rebate for a leak detection device
• Home retrofit style service
30-20% • Drought response messaging target 130 L/p/day
• Joint messaging with other relevant entities (i.e. energy service providers) re peak time demand
• Water efficiency management plans (WEMPs)
20-15% • Drought response messaging target 120 L/p/day
• High level water restrictions (target 120 L/p/day residential demand)
15-10% • Drought response messaging target 115 L/p/day
• Extreme level water restrictions (target 100 L/p/day residential demand)
10-5% • Drought response messaging target 100 L/p/day (emergency response)
• Emergency level water restrictions (target 100 L/p/day combined residential and non-residential).
Note: a range of emergency measures will take place at this point and will be developed over time in consultation with the SEQ water service providers – detail not required for Version 1 of Water Security Program
Essential minimum supply volume
The detail of this component of the drought response plan will be developed as part of Version 2 of the Water Security Program. Discussions will be held with the Incident and Emergency teams across Seqwater and the SEQ water service providers.

Water for life62
6 .2 .4 .2 Supply response
The drought risk assessment, undertaken in Section 6.2.2, has shown that the probability of triggering the need for drought contingency infrastructure is very low within the next 10 years. Noting this, the drought contingency supply options (including triggers for implementation) will be developed as part of Version 2 of the Water Security Program.
6 .2 .4 .3 Operational response
Seqwater is prepared for drought through the following operational strategies:
• having a plan in place to be able to restart the Western Corridor Recycled Water Scheme when required; it is currently in care-and-maintenance mode (refer Section 5.2)
• maintaining the Gold Coast Desalination Plant in hot standby mode so it is ready to increase production within days. This standby mode is needed primarily because the plant may be required to provide emergency back-up supplies at short notice; however, it will also be of benefit for longer-term drought response
• continually reviewing the operation of the regional pipeline interconnectors, to achieve optimum sub-regional performance.
Operating rules have been developed to manage the existing drought response infrastructure, specifically the Gold Coast Desalination Plant and the Western Corridor Recycled Water Scheme. The current triggers for these assets are shown in Table 6-5.
Table 6-5 Key bulk water storage trigger levels for operating Gold Coast Desalination Plant and Western Corridor Recycled Water Scheme
Key bulk water storage level
Gold Coast Desalination Plant operation
Western Corridor Recycled Water Scheme operation
60% 33% 0
40% 100% 100%
These triggers will be further tested through modelling and analysis for Version 2 of the Water Security Program.
6 .2 .5 DROUGHT EXIT
Due to uncertainties surrounding drought severity and duration, it is not possible to prescribe specific drought exit arrangements. Similar to the drought response approach, drought exit will have staged triggers, however implementation will adapt to conditions at the time. This will be further developed for Version 2 of the Water Security Program.
6 .2 .6 FUTURE DROUGHT RESPONSE PLANNING
Prior to the release of Version 2 of the Water Security Program, Seqwater will carry out further modelling to understand the impact of current operations, potential contingency supply infrastructure and impact of demand management measures.
Seqwater will also consider the essential minimum supply volume and develop a planning approach in the unlikely event such a level is reached. This work will be completed in collaboration with the SEQ water service providers.
6 .3 Planning for floods
6 .3 .1 THE IMPACT OF FLOODS
Every flood event is unique and the challenge is to be prepared, to plan for, and adapt responses to best serve water supply and flood mitigation needs of the SEQ community. These responses can include real-time flood management, temporary lowering of dam supply levels or more permanent solutions where dam design incorporates both water supply security and flood management objectives (as is the case for some SEQ bulk water storages).
Water supply catchments that have been modified by human activity i.e. removal of vegetation, are vulnerable to degradation by floods, resulting in increased erosion and transfer of sediments to river systems. This detrimentally impacts raw water quality and can reduce or even disrupt the capability of water treatment plants to produce drinking water for a period of time. Therefore planning for wet weather events will require consideration of reliability, resilience, water quality and catchment management practices.
SEQ has experienced a number of floods over the years, most recently in 2011 and 2013. These weather events have impacted water supply via sudden changes in raw water quality that reduces water treatment capacity, equipment failure, broken water mains and power failure, which in turn constrain water treatment and transport.
South East Queensland’s Water Security Program 2015-2045 63
6 .3 .2 FLOOD MANAGEMENT INVESTIGATIONS
6 .3 .2 .1 WSDOS and NPDOS
While the primary purpose of Seqwater’s storages is to provide secure water supplies where rainfall is inherently variable, Somerset and Wivenhoe dams were both originally designed to provide joint functions of water supply security and flood management (through the provision of additional flood storage compartments above their drinking water storage capacity).
The North Pine Dam, although it does not have additional flood storage capacity, mitigates flow into the dam through controlled gate releases which result in lower rates of outflows from the dam.
In response to the widespread flooding that occurred in the 2011 flood event, the Queensland Floods Commission of Inquiry was established to review all aspects of flood events across Queensland in 2011. The Commission’s final report released in 2012 (QFCI, 2012) contained recommendations covering a broad range of issues, including dam management.
To address recommendations that are specific to the operation of the Somerset, Wivenhoe and North Pine dams, the Wivenhoe and Somerset Dam Optimisation Study (WSDOS) and the North Pine Dam Optimisation Study (NPDOS) were undertaken by the Department of Energy and Water Supply with other partners, including Seqwater.
WSDOS investigations extended beyond alternative flood operations of the Somerset and Wivenhoe dams and considered potential alternative water supply operations for the existing SEQ system which included various reductions of Wivenhoe Dam’s full supply level in order to also investigate the impacts on water supply security. Similarly, the NPDOS included a range of future alternative operational options for the North Pine Dam (such as reductions in full supply level) with a view to making better use of existing infrastructure.
THE FLOOD EVENTS OF 2011 AND 2013
The 2011 flood was the largest experienced at Wivenhoe, Somerset and North Pine dams since 1974 and had a significant impact on the SEQ community. Owing to above-average rainfall preceding the flood event, catchments were saturated and run-off was a high percentage of rainfall, carrying significant sediment loads into the Brisbane and Pine River systems. The resultant high turbidity had significant impact on Mount Crosby water treatment plants and North Pine Water Treatment Plant, reducing their treatment capacity. In addition, Mount Crosby East Bank Water Treatment Plant raw water pump station was damaged by floodwater, further affecting treatment capacity.
The January 2013 event involved heavy rainfall from ex-Tropical Cyclone Oswald and gale force winds. The storm caused widespread damage to water supply infrastructure and persistent loss of power and telecommunications. Catchment conditions in 2013 were much drier than in 2011. A combination of rainfall and a highly degraded Lockyer Creek catchment that was still recovering from the impact of the 2011 flood event created circumstances that produced very poor raw water conditions. The key impact was lost production at the Mount Crosby water treatment plants. Production rates at several other water treatment plants were also restricted due to a combination of deteriorating raw water quality and localised power outages.
When there were short-term supply disruptions during these events, Seqwater (and its predecessor organisations) in collaboration with SEQ water service providers continued to deliver water supplies to the SEQ region through implementing demand management, and using the Gold Coast Desalination Plant and the interconnected Grid.
These studies included an integrated assessment of operational options involving consideration of trade-offs between increasing or reducing flood mitigation measures, water supply security, dam safety and the extent of disruption to the downstream community by bridge and road inundation and closures.
The WSDOS study led to pre-feasibility investigations into potential flood storage infrastructure that could provide flood mitigation benefits for properties downstream of Wivenhoe Dam in major population centres of the Brisbane and Bremer River catchments. The primary outcome from the WSDOS study was new flood operation rules that provide improved urban flood mitigation primarily at the expense of rural transport.
Based on investigations that included assessment of a wide range of flood events, the NPDOS recommended that the North Pine Dam be lowered to 90% of its full supply level for up to 20 years (i.e. semi-permanent) representing small improvements to flood mitigation and dam safety, and providing a better balance of short-term benefits without a long-term risk to water supply security.
6 .3 .2 .2 Flood storage infrastructure study
Based on the findings of the WSDOS and NPDOS studies, the Queensland Government carried out a pre-feasibility study into potential new dams and the raising of Wivenhoe Dam to further mitigate future flooding in SEQ (DEWS, 2014a). Potential flood mitigation options were narrowed down for more detailed investigations to occur. As part of that study, water security implications associated with alterations to the full supply volume and options for addressing any implications were identified.
6 .3 .3 FLOOD RESPONSE
Floods can occur at any time, although they are more common in the wet season, generally accepted to be from November to May, although recent floods have occurred in October and June.

Water for life64
To prepare for a potential flood, Seqwater conducts pre-summer risk assessments of all its assets to identify issues of resilience, reliability and capacity constraints so that appropriate control mechanisms can be put in place prior to an event.
A key aspect of responding to floods in the context of supplying safe, secure and reliable water supplies is managing potential risks to water supply and their consequences. Many lessons were learnt during the recent floods and key learnings from these experiences have resulted in continuously improving how Seqwater and the SEQ water service providers respond to such events. Actions to address impacts from floods on water security can take the form of a demand, supply or an operational response or a combination of these depending on the severity of impact on water security. This is described in more detail below.
6 .3 .3 .1 Demand response
Experience of past floods showed it is necessary to keep the community well informed about using water responsibly if treated water production is reduced or disrupted. Managing demand will slow the consumption of treated water stored in suburban reservoirs and reduce the likelihood of them emptying. Demand responses that will be implemented include general messaging through media requesting consumers to conserve water, followed by SEQ water service providers exercising their emergency powers under the Water Supply (Safety and Reliability) Act 2008 to implement water restrictions. The timing for implementation of these responses will depend on the criticality of the event. Implementation will meet agreed media and communication protocols in conjunction with SEQ water service providers.
6 .3 .3 .2 Supply response
As floods can cause short-term water supply disruptions via impacts to supply infrastructure, the resilience of critical infrastructure is continually reviewed.
6 .3 .3 .3 Operational response
As described throughout this report, the interconnected water grid provides the ability to distribute water where it is needed the most, and its value is further highlighted in times of floods.
Seqwater’s operational preparedness is achieved through:
• increasing treated water storage in central SEQ to address any vulnerability caused by a failure of supply from Mount Crosby water treatment plants
• maintaining the Gold Coast Desalination Plant in hot standby mode so it is ready to commence operation to provide back-up supplies at short notice
• maintaining a thorough understanding of system performance through real-time modelling and distributing limited bulk water produced at the time to satisfy demand. This involves timely reversal of flows in interconnectors
• undertaking joint training and emergency response exercises, which allow staff to experience emergency management scenarios
• having short term supply disruption plans in place for each standalone community.
Seqwater also operates a 24-hour control centre to monitor the bulk water supply system, as well as a flood operations centre, and works closely with the Bureau of Meteorology to enable timely responses to supply issues and minimise downstream impacts to the extent possible from dam operations. While impacts to water supply infrastructure have the potential for short-term supply risks, the proven resilience of the water grid is a strength afforded to SEQ in responding to such extremes.
In response to the 2011 floods, the Queensland Government amended the Water Supply (Safety and Reliability) Act 2008 to include provisions for the Minister to declare temporary alterations to the full supply levels of dams that have an approved flood mitigation manual. This provides one mechanism for preparedness prior to a flood, increasing the flood storage capacity of Wivenhoe and North Pine dams through planned releases to maintain the supply to predetermined levels that sit below normal full supply level.
6 .3 .4 FUTURE WORK
Seqwater will continue to work cooperatively with SEQ water service providers and other government agencies to continuously evaluate and improve responses to address potential impacts from floods on current operations, demand management responses and understand requirements for new contingency supply infrastructure to maintain water security.
Seqwater will also continue to provide input and feedback on any future SEQ flood mitigation planning including appropriate considerations of implications for water security.

07. Planning for the future
Planning for the future07

South East Queensland’s Water Security Program 2015-2045 65
07 Planning forthe future
7 .1 Integrated planning
WHAT IS INTEGRATED PLANNING?
Integrated planning considers all of the key objectives for water supply security in parallel with one another to identify the most efficient options to achieve all of these objectives.
The purpose of integrated planning is also to determine the most efficient make-up of the different water supply types in SEQ by gauging how different combinations perform. For example, the use of desalination for drinking water is independent of climate and provides excellent drought security; however, is relatively expensive when being used in normal years to meet outdoor water use during summer (e.g. to top up swimming pools). Conversely, surface water options (dams, weirs and off-stream storages) are relatively inexpensive to operate, but are inherently dependent on rainfall so are vulnerable to drought.
The integrated planning approach is consistent with leading practice for water utilities and a crucial process that underpins the adaptive planning approach. By considering the critical infrastructure investment drivers and system operating strategies in parallel, options that are best able to contribute holistically to the existing and future system are clearly identified.
There are two primary drivers for long-term water supply security planning:
• achieving the LOS objectives to sustain the bulk water supply system, including during times of drought
• being able to treat, store and transport enough water of an appropriate quality to provide water ‘on demand’ at all times, and particularly during very high consumption periods, usually during the hotter summer months.
These objectives have been defined as planning criteria, and are outlined in Appendix G.
Other objectives that are considered include the efficient operation of the system and the ability to provide resilience to shock events (flood, bushfires and water quality issues).
Traditionally, bulk water supply planning considered the two primary objectives in isolation and developed options to respond to each separately. For the first time in the SEQ region, this Water Security Program considers these objectives in parallel, which allows optimisation of the long-term plan for water security. This has been achieved through a structured process where the integrated planning approach asks the following questions:
1. How do we best meet our long term water security requirements and achieve the LOS objectives?
2. When consumption is very high, e.g. during peak demand periods daily and seasonally, what is the most efficient way to treat water to meet quality expectations and to store and transport this water to where it is needed?
The best answer to each of these individual questions may not be the same if the questions are considered together. For example, a primary constraint may emerge whereby, despite the system being able to provide the long-term forecast, peaks in demand may be experienced in areas where the infrastructure is at full capacity. In this case, the system is unable to supply sufficient volumes of treated water.
Integrated planning will consider demand management options, new supply and bulk transport options as well as operational strategies to move water from areas that may have a surplus to where it is needed.
Seqwater has integrated the planning for meeting long-term LOS objectives with peak demand requirements in this Version 1 of the Water Security Program. Future revisions will extend this to integrate other key water planning objectives such as short-term system reliability, dam safety and catchment management, in addition to decentralised and non-structural options.
7 .2 Assessment approach
The Water Security Program is required to identify an appropriate balance of demand, supply and operational options that are based on efficiency principles for achieving the greatest value for the SEQ community. Options are also assessed against non-financial criteria including social and environmental impacts. Meeting the planning criteria relevant to treatment plant capacity is considered a mandatory requirement in developing SEQ’s long-term water supply plan, and combines with meeting LOS objectives to form Seqwater’s water security objectives.

Water for life66
Figure 7-1 Demand management option development process
Blue sky list
Medium list
Short list
Preferred options list and demand drought response portfolio development
Preferred demand management options including drought response approach
Selecting the most efficient supply, demand, and operational options to achieve the required level of system performance follows a structured process of:
• identifying potential options
• assessing how these options perform individually
• assessing how these options perform as part of an integrated system.
The assessment of options has been against cost (initial capital investment, operational and maintenance costs over time) plus social, environmental and system performance. Seqwater has undertaken extensive whole-of-system modelling and analysis to determine how the system responds to various combinations of supply and demand options and operational strategies. Based on the information gained through this assessment, trade-offs of various combinations of options can be understood.
WHAT IS A TRADE-OFF?
A trade-off refers to the benefits and costs associated with a single option or a particular combination of water security options. It is unlikely that any one option or combination thereof will achieve outstanding performance against all areas including the ability to respond to drought, economic, environmental, social, and system performance. Some will perform better in drought but not so well economically where others may be lower in cost but have a higher social impact.
Some of these trade-offs are site-specific and subject to future detailed site investigations. Others require community input to fully understand the values of each of the trade-offs. Seqwater will be actively seeking input from the community to better understand the values and how to rank these trade-offs.
7 .3 Options for demand management
Efficient water use via demand management is an integral part of long-term water supply planning. While current demand management measures are accounted for in the forecast demand, there is opportunity to further target demand management in the future to provide best value outcomes for the community.
7 .3 .1 METHOD
Seqwater and the SEQ water service providers collaborated to identify and develop the most effective demand management options for the SEQ region.
The process commenced with a review of historical information and demand management measures in other jurisdictions. Particular consideration was given to the effectiveness of demand management measures, e.g. water restrictions and rebate/retrofit programs implemented during the Millennium Drought.
A ‘blue sky’ list of possible demand management options was generated from the initial review. That list was passed through a series of assessment ‘gates’ to arrive at a short list of preferred demand management options, including the drought response approach. Figure 7-1 outlines the option development process. Further details on the assessment process, including screening criteria, are provided in Appendix H.
To be included on the short list, each option was assessed against the effective demand saving it could achieve (in ML/day), the estimated cost of implementation, and environmental and social impacts. Any options more expensive than the levelised cost of $8/kL were removed from the list, as that figure was used to exclude inefficient supply options. Further analysis of community costs and willingness to pay will be incorporated in Version 2 of the Water Security Program.
GATE 1: PRELIMINARY REVIEW AND COARSE SCREEN
GATE 2: REVIEW OF COSTED OPTIONS AND POTENTIAL DEMAND SAVINGS
GROUPING PHASE
GATE 3: DEMAND DROUGHT RESPONSE PORTFOLIO COSTED OPTIONS AND POTENTIAL DEMAND SAVINGS
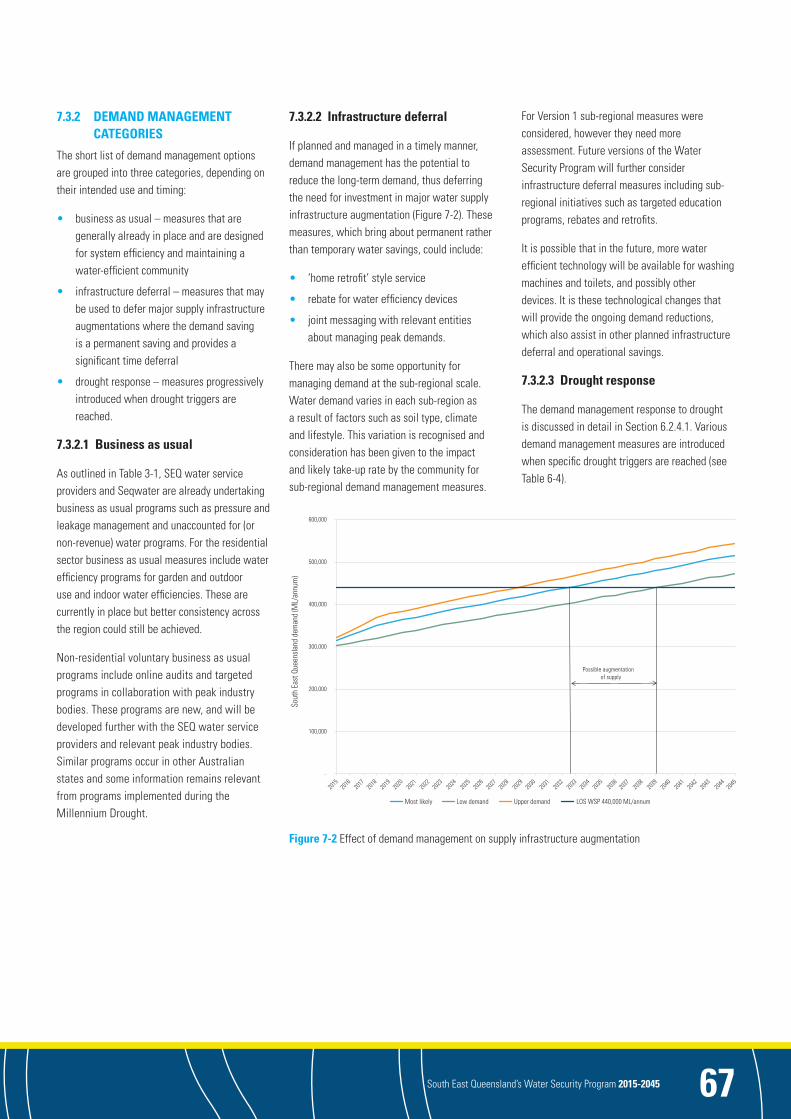
South East Queensland’s Water Security Program 2015-2045 67
Figure 7-2 Effect of demand management on supply infrastructure augmentation
7 .3 .2 DEMAND MANAGEMENT CATEGORIES
The short list of demand management options are grouped into three categories, depending on their intended use and timing:
• business as usual – measures that are generally already in place and are designed for system efficiency and maintaining a water-efficient community
• infrastructure deferral – measures that may be used to defer major supply infrastructure augmentations where the demand saving is a permanent saving and provides a significant time deferral
• drought response – measures progressively introduced when drought triggers are reached.
7 .3 .2 .1 Business as usual
As outlined in Table 3-1, SEQ water service providers and Seqwater are already undertaking business as usual programs such as pressure and leakage management and unaccounted for (or non-revenue) water programs. For the residential sector business as usual measures include water efficiency programs for garden and outdoor use and indoor water efficiencies. These are currently in place but better consistency across the region could still be achieved.
Non-residential voluntary business as usual programs include online audits and targeted programs in collaboration with peak industry bodies. These programs are new, and will be developed further with the SEQ water service providers and relevant peak industry bodies. Similar programs occur in other Australian states and some information remains relevant from programs implemented during the Millennium Drought.
7 .3 .2 .2 Infrastructure deferral
If planned and managed in a timely manner, demand management has the potential to reduce the long-term demand, thus deferring the need for investment in major water supply infrastructure augmentation (Figure 7-2). These measures, which bring about permanent rather than temporary water savings, could include:
• ‘home retrofit’ style service
• rebate for water efficiency devices
• joint messaging with relevant entities about managing peak demands.
There may also be some opportunity for managing demand at the sub-regional scale. Water demand varies in each sub-region as a result of factors such as soil type, climate and lifestyle. This variation is recognised and consideration has been given to the impact and likely take-up rate by the community for sub-regional demand management measures.
For Version 1 sub-regional measures were considered, however they need more assessment. Future versions of the Water Security Program will further consider infrastructure deferral measures including sub-regional initiatives such as targeted education programs, rebates and retrofits.
It is possible that in the future, more water efficient technology will be available for washing machines and toilets, and possibly other devices. It is these technological changes that will provide the ongoing demand reductions, which also assist in other planned infrastructure deferral and operational savings.
7 .3 .2 .3 Drought response
The demand management response to drought is discussed in detail in Section 6.2.4.1. Various demand management measures are introduced when specific drought triggers are reached (see Table 6-4).
-
100,000
200,000
300,000
400,000
500,000
600,000
Sout
h Ea
st Q
ueen
slan
d de
man
d (M
L/an
num
)
Most likely Low demand Upper demand LOS WSP 440,000 ML/annum
Possible augmentation of supply
2015
2016
2017
2018
2019
2020
2021
2022
2023
2024
2028
2029
2030
2034
2035
2036
2037
2025
2026
2027
2031
2032
2033
2038
2042
2043
2044
2045
2039
2040
2041

Water for life68
Figure 7-3 Supply options development and assessment process
Development of blue sky list of bulk water supply options
GATE 1: YIELD AND INDICATIVE COST ASSESSMENT
Consolidated long list of water supply options
GATE 2: NON-COST CRITERIA COMPARATIVE ASSESSMENT
Potential short list of efficient bulk water supply options
The triggers are based on declining combined capacity of the key bulk water storages and aim to reduce demand to achieve specific regional consumption targets. The measures are largely based on behavioural change and transition from voluntary to mandatory as drought intensifies. Some of the measures can also facilitate permanent water savings.
In summary, drought response measures comprise
• communications (pre-drought messaging followed by stronger drought messaging to promote achievement of specified demand targets, e.g. 140 L/p/day)
• rebates and retrofits to increase the uptake of water-efficient appliances
• restrictions – various levels according to drought severity
• increased non-residential demand management programs.
7 .3 .3 MANAGING SHORT-TERM (PEAK) DEMANDS
Water use varies with season, day of the week and time of day. For example, peak annual demands occur in the summer months in SEQ and are primarily related to increased outdoor residential water use and/or increased transient/tourist populations.
Given that a primary role of the bulk water supply system is to provide a safe and secure water supply, managing variability in water consumption is a core function of the system. Accommodating peak water demands also drives investment in water supply infrastructure.
Seqwater will also be working with SEQ water service providers to better understand peak demand. Peak daily demand centres on times before consumers go to school and work and after they come home. This is generally due to showering, clothes washing, kitchen activities and garden watering. Peak daily demands are often a driver for new infrastructure or upgrades to existing assets.
They can be smoothed with demand management in order to reduce the stress on the water supply system thus reducing the need for investment in infrastructure to meet these peaks.
Some smoothing has occurred following the Millennium Drought due to the increase in water efficient devices. Additional investigation is required into suitable demand management to further assist in this smoothing of the peak. This may include education programs to encourage activities outside of peak times, working with other utilities such as electricity providers who also have to manage similar peak demand times, and review of other peak demand management programs throughout Australia and internationally. These investigations will be ongoing and the outcomes will be detailed in future versions of the Water Security Program.
7 .4 Options for supply
Although demand management can delay the need for new infrastructure, there will come a time when new sources of supply or augmentations to the existing bulk supply system will be required to secure water for a growing population.
7 .4 .1 METHOD
An extensive range of existing studies and investigations were used as the starting point for the preliminary identification and assessment of potential supply options.
Information that was considered outdated, incomplete or no longer applicable was updated and some new water supply options were identified from proposals by Seqwater, industry professionals, stakeholder groups, external parties and members of the community.
A structured assessment process identified the options that can efficiently contribute to the integrated planning objectives.
Figure 7-3 provides an overview of the process for selecting the most efficient supply options. Seqwater started by identifying a wide range of options for water supply for the region and then systematically reduced this list based on technical feasibility, cost-efficiency and social and environmental considerations.
Each water supply option had to pass through a series of assessment ‘gates’ to determine if it was able to efficiently contribute to the water security of the region. Appendix H details results from these gateway assessments.

South East Queensland’s Water Security Program 2015-2045 69
7 .4 .2 ‘BLUE SKY’ LIST OF OPTIONS
To start the options selection process, a ‘blue sky’ list of all potential options was developed under the following supply categories:
• surface water (dams, weirs and off-stream storages)
• desalination
• groundwater
• purified recycled water
• decentralised water supplies (includes domestic rainwater tanks etc.)
• ‘unconventional’ (for example water tankering, cloud seeding)
• water treatment plant upgrades
• network augmentations.
Each category has different characteristics for contributing to the water security of the region. Integrated planning using an adaptive approach is structured to consider the broad range of option types and to determine their ability to contribute to the bulk water supply system performance under different conditions.
To avoid ruling out options too early in the assessment because of their cost; only those options that were clearly inefficient, technically not viable or not consistent with water resource plans and environmental protection objectives were removed at this stage.
The blue sky list of options comprised 131 individual supply options. All blue sky list options were assessed against the key selection criteria of levelised cost (cost per unit volume produced) to develop a long list which was assessed against key selection criteria, including environmental, societal and risk outcomes. The assessment resulted in a short list of viable bulk water supply options.
7 .4 .3 SHORT LIST OF OPTIONS
The options short list included opportunities from all of the supply categories, and comprised 70 individual options. Each option was assessed in greater detail to determine how it would best contribute to long-term water security.
Some of the options were identified for further investigation, as they may prove valuable in certain conditions, such as drought response or during local system improvements. Other options were identified for further investigation to allow more detailed assessment in the future or as emerging technologies improve. Examples of the options earmarked for further investigation include:
• Decentralised schemes: These include local development options such as reclaimed stormwater schemes which can reduce water required from the bulk water supply system. In isolation, these options generally only represent a small volume. However, when considered collectively they can represent a meaningful overall reduction in the required supply. These schemes are usually most cost-effective when installed as part of new development in major greenfield areas. Seqwater will work with other water service providers and the development industry to determine where and when it is most efficient for decentralised schemes to be implemented.
• Temporary drought facilities: Droughts are cyclical, and are therefore expected to end when followed by periods of high rainfall. Emerging technologies in portable desalination plants may provide future cost-effective options for temporary facilities for short-term localised droughts. Temporary drought response is not the focus of Version 1 of the Water Security Program. Subsequent versions will address the most efficient responses to drought in the region.
• Supplies from outside SEQ: Supplies from north-eastern New South Wales, such as the Tweed, Brunswick, Clarence, Richmond and Wilson river catchments were considered as future bulk water supply opportunities for SEQ. Previous studies have found that these options are generally more costly compared to projects within SEQ and create numerous social and environmental issues. These may be options to revisit as part of the adaptive planning approach. Future planning could also consider two-way water transfers between the states.
The options identified for further investigation will be incorporated into future versions of the Water Security Program.
A more detailed review of the options short list identified a list of efficient options to carry forward to the integrated planning stage. This review also identified a small number of options that are ‘highly efficient’ in delivering the integrated planning objectives. Highly efficient options have the ability to generate a significant increase in overall system performance through minor expenditure such as pipework reconfigurations or treatment capacity upgrades at SEQ region’s largest water treatment plants (Mount Crosby and North Pine). These highly efficient options have been demonstrated to be far more effective than any other options under consideration and have been included in the augmentations to existing assets (refer Section 7.6).
7 .5 Options for the operating strategy
In an integrated system, the adopted operating strategy is one important element of system performance. In ‘normal’ climatic conditions (i.e. non-drought) when regional raw water security is high, the water grid operating strategy aims to minimise operating costs while maintaining water quality and system resilience. This strategy is outlined in Section 5 and involves:
• minimising the use of the Gold Coast Desalination Plant but maintaining it in a hot standby mode
• minimising the use of the Western Corridor Recycled Water Scheme by placing it into care-and-maintenance mode with a recommissioning plan based on a defined trigger if the region enters drought
• using all available surface water sources (dams, weirs, rivers, etc.) subject to their water resource entitlement
• minimising or eliminating the use of the smaller, higher cost water treatment plants
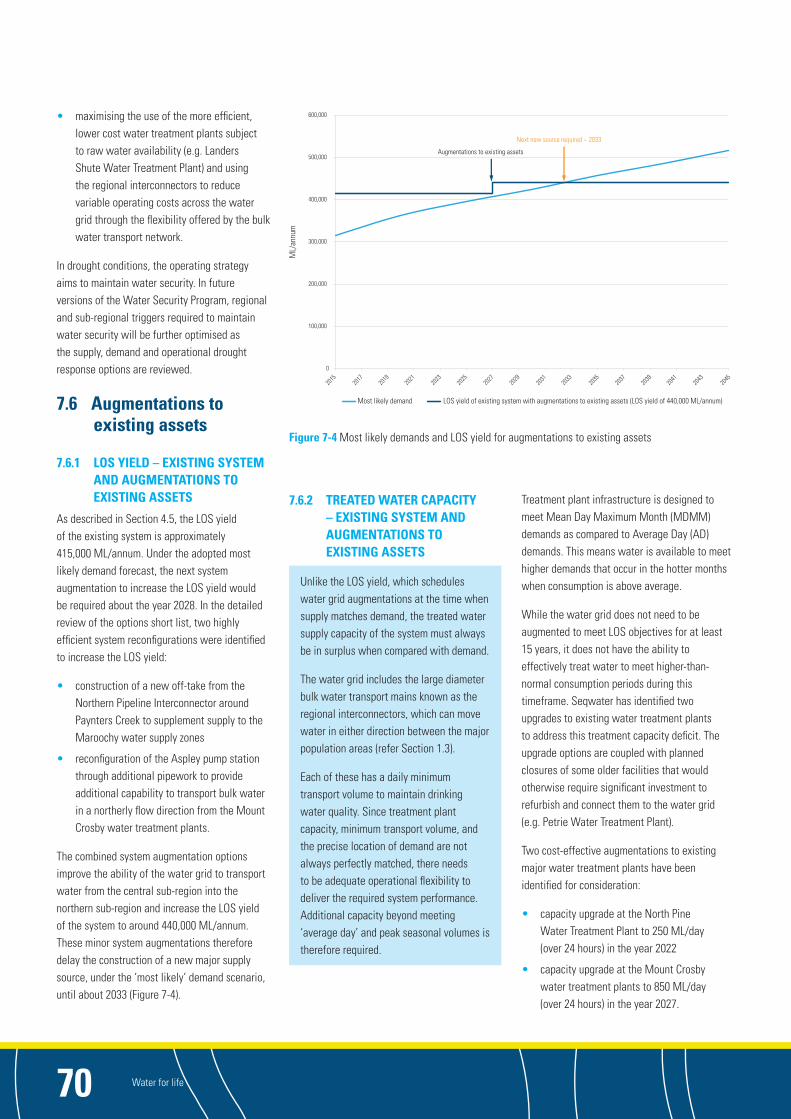
Water for life70
Figure 7-4 Most likely demands and LOS yield for augmentations to existing assets
• maximising the use of the more efficient, lower cost water treatment plants subject to raw water availability (e.g. Landers Shute Water Treatment Plant) and using the regional interconnectors to reduce variable operating costs across the water grid through the flexibility offered by the bulk water transport network.
In drought conditions, the operating strategy aims to maintain water security. In future versions of the Water Security Program, regional and sub-regional triggers required to maintain water security will be further optimised as the supply, demand and operational drought response options are reviewed.
7 .6 Augmentations to existing assets
7 .6 .1 LOS YIELD – EXISTING SYSTEM AND AUGMENTATIONS TO EXISTING ASSETS
As described in Section 4.5, the LOS yield of the existing system is approximately 415,000 ML/annum. Under the adopted most likely demand forecast, the next system augmentation to increase the LOS yield would be required about the year 2028. In the detailed review of the options short list, two highly efficient system reconfigurations were identified to increase the LOS yield:
• construction of a new off-take from the Northern Pipeline Interconnector around Paynters Creek to supplement supply to the Maroochy water supply zones
• reconfiguration of the Aspley pump station through additional pipework to provide additional capability to transport bulk water in a northerly flow direction from the Mount Crosby water treatment plants.
The combined system augmentation options improve the ability of the water grid to transport water from the central sub-region into the northern sub-region and increase the LOS yield of the system to around 440,000 ML/annum. These minor system augmentations therefore delay the construction of a new major supply source, under the ‘most likely’ demand scenario, until about 2033 (Figure 7-4).
7 .6 .2 TREATED WATER CAPACITY – EXISTING SYSTEM AND AUGMENTATIONS TO EXISTING ASSETS
Unlike the LOS yield, which schedules water grid augmentations at the time when supply matches demand, the treated water supply capacity of the system must always be in surplus when compared with demand.
The water grid includes the large diameter bulk water transport mains known as the regional interconnectors, which can move water in either direction between the major population areas (refer Section 1.3).
Each of these has a daily minimum transport volume to maintain drinking water quality. Since treatment plant capacity, minimum transport volume, and the precise location of demand are not always perfectly matched, there needs to be adequate operational flexibility to deliver the required system performance. Additional capacity beyond meeting ‘average day’ and peak seasonal volumes is therefore required.
Treatment plant infrastructure is designed to meet Mean Day Maximum Month (MDMM) demands as compared to Average Day (AD) demands. This means water is available to meet higher demands that occur in the hotter months when consumption is above average.
While the water grid does not need to be augmented to meet LOS objectives for at least 15 years, it does not have the ability to effectively treat water to meet higher-than-normal consumption periods during this timeframe. Seqwater has identified two upgrades to existing water treatment plants to address this treatment capacity deficit. The upgrade options are coupled with planned closures of some older facilities that would otherwise require significant investment to refurbish and connect them to the water grid (e.g. Petrie Water Treatment Plant).
Two cost-effective augmentations to existing major water treatment plants have been identified for consideration:
• capacity upgrade at the North Pine Water Treatment Plant to 250 ML/day (over 24 hours) in the year 2022
• capacity upgrade at the Mount Crosby water treatment plants to 850 ML/day (over 24 hours) in the year 2027.
0
100,000
200,000
300,000
400,000
500,000
600,000
ML/
annu
m
Most likely demand LOS yield of existing system with augmentations to existing assets (LOS yield of 440,000 ML/annum)
Augmentations to existing assets
Next new source required ~ 2033
2015
2017
2019
2021
2023
2029
2035
2037
2025
2027
2031
2033
2043
2045
2039
2041

South East Queensland’s Water Security Program 2015-2045 71
Figure 7-5 Most likely maximum monthly and average day demands, and treated water capacity
Both water treatment plant augmentations increase treated water throughput and will reduce ongoing water quality risks under a range of raw water conditions. Figure 7-5 shows the impact these water treatment plant augmentations have on the treated water capacity.
By augmenting existing assets with the options described above, the most likely demand forecasts can be met for at least the first 15 years of the 30-year planning horizon of the Water Security Program.
Identification of options to augment existing assets to meet LOS objectives and bulk treated water capacity also highlights that the parallel constraints in LOS yield and the bulk treated water capacity are predicted to align around the year 2033. This emphasises the importance of integrated planning and the efficiency opportunities it creates.
7 .7 Efficient supply options – next new supply source augmentation
Due to the interconnectedness of the water grid and assuming the efficient options identified to augment existing assets are selected as preferred and subsequently implemented, no new water sources are required until beyond 2030 (excluding drought conditions). The need for drought response infrastructure is assessed and discussed in Chapter 6.
There are many changes to influences, including community values, which may alter any of the supply, demand or operational responses to achieving water security over the 30-year period. There are also decentralised and non-structural solutions to consider.
The options identified form a basis for future planning. They have been assessed at a strategic level and are subject to change with community feedback and further assessment. Influences and solutions will evolve and change, and subsequently the most efficient response to achieving water security for SEQ will adapt with these changes. Community feedback will be central to the development of future versions of the Water Security Program to enable the long-term plan to reflect community views.
7 .7 .1 HOW INTEGRATED PLANNING IS APPLIED
The focus of Version 1 of the Water Security Program has been in selecting and assessing efficient supply options and combinations of these options. The most likely demand forecast and a common approach to system operations has been used for this assessment.
Efficient supply options were assessed to understand how they can best contribute to the integrated plan for the water grid, based on how they influence system performance both as individual options and in combination.
Once a new option has been implemented, whether it is a supply, demand or operational response, system performance is altered and a new status quo is established. Subsequent new options then need to be assessed on the basis of how they improve the new status quo for system performance.
This means that timing and sequencing of different options has a significant effect on system performance. It can create a situation where an option may not be efficient at one time (e.g. as the first system augmentation) but becomes much more efficient in the future. Similarly, an option may not appear to be efficient in isolation but it becomes so when considered with others.
0
200
400
600
800
1000
1200
1400
1600
1800
2000
2200
2015 2020 2025 2030 2035 2040 2045
ML/
day
Most likely MDMM demand Augmentations to existing assets — treated water capacity Most likely AD demand
Augmentations to existing assets
Next new source required ~ 2033
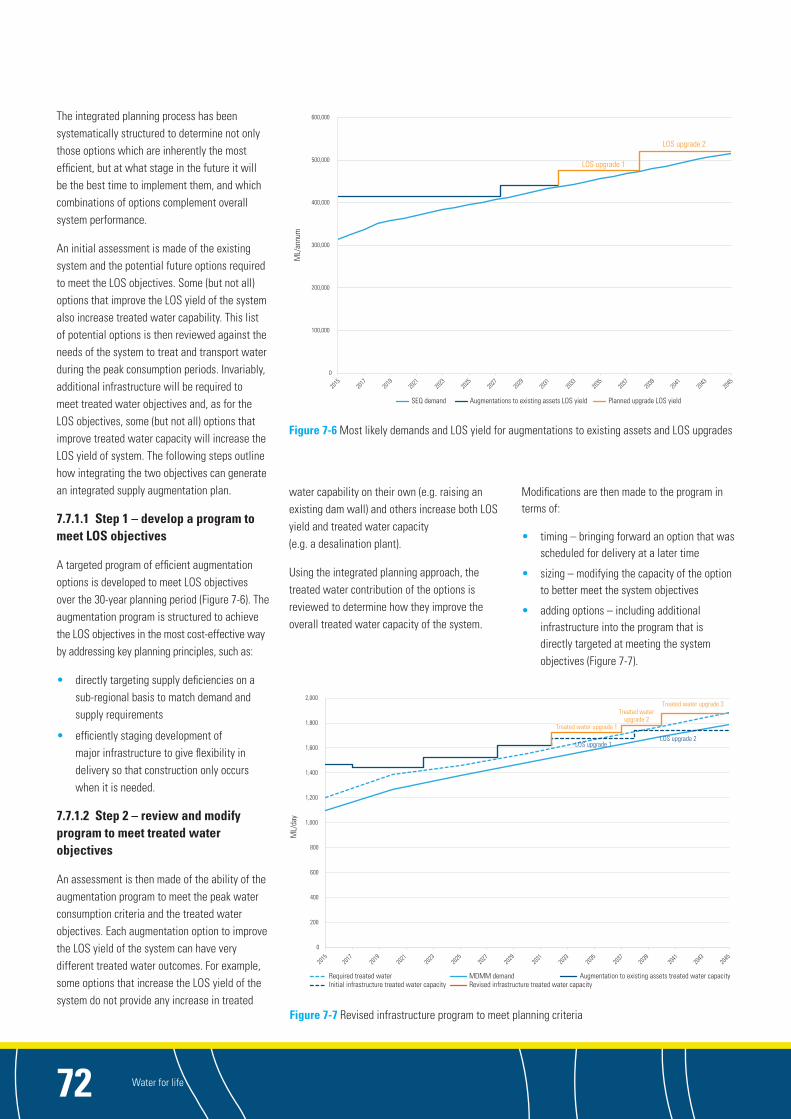
Water for life72
Figure 7-6 Most likely demands and LOS yield for augmentations to existing assets and LOS upgrades
Figure 7-7 Revised infrastructure program to meet planning criteria
The integrated planning process has been systematically structured to determine not only those options which are inherently the most efficient, but at what stage in the future it will be the best time to implement them, and which combinations of options complement overall system performance.
An initial assessment is made of the existing system and the potential future options required to meet the LOS objectives. Some (but not all) options that improve the LOS yield of the system also increase treated water capability. This list of potential options is then reviewed against the needs of the system to treat and transport water during the peak consumption periods. Invariably, additional infrastructure will be required to meet treated water objectives and, as for the LOS objectives, some (but not all) options that improve treated water capacity will increase the LOS yield of system. The following steps outline how integrating the two objectives can generate an integrated supply augmentation plan.
7 .7 .1 .1 Step 1 – develop a program to meet LOS objectives
A targeted program of efficient augmentation options is developed to meet LOS objectives over the 30-year planning period (Figure 7-6). The augmentation program is structured to achieve the LOS objectives in the most cost-effective way by addressing key planning principles, such as:
• directly targeting supply deficiencies on a sub-regional basis to match demand and supply requirements
• efficiently staging development of major infrastructure to give flexibility in delivery so that construction only occurs when it is needed.
7 .7 .1 .2 Step 2 – review and modify program to meet treated water objectives
An assessment is then made of the ability of the augmentation program to meet the peak water consumption criteria and the treated water objectives. Each augmentation option to improve the LOS yield of the system can have very different treated water outcomes. For example, some options that increase the LOS yield of the system do not provide any increase in treated
water capability on their own (e.g. raising an existing dam wall) and others increase both LOS yield and treated water capacity (e.g. a desalination plant).
Using the integrated planning approach, the treated water contribution of the options is reviewed to determine how they improve the overall treated water capacity of the system.
Modifications are then made to the program in terms of:
• timing – bringing forward an option that was scheduled for delivery at a later time
• sizing – modifying the capacity of the option to better meet the system objectives
• adding options – including additional infrastructure into the program that is directly targeted at meeting the system objectives (Figure 7-7).
0
100,000
200,000
300,000
400,000
500,000
600,000
ML/
annu
m
SEQ demand Augmentations to existing assets LOS yield Planned upgrade LOS yield
LOS upgrade 1
LOS upgrade 2
2015
2017
2019
2021
2023
2029
2035
2037
2025
2027
2031
2033
2043
2045
2039
2041
0
200
400
600
800
1,000
1,200
1,400
1,600
1,800
2,000
ML/
day
Required treated water MDMM demand Augmentation to existing assets treated water capacityInitial infrastructure treated water capacity Revised infrastructure treated water capacity
LOS upgrade 1 LOS upgrade 2
Treated water upgrade 1
Treated water upgrade 2
Treated water upgrade 3
2015
2017
2019
2021
2023
2029
2035
2037
2025
2027
2031
2033
2043
2045
2039
2041

South East Queensland’s Water Security Program 2015-2045 73
Figure 7-8 Revised infrastructure program to meet LOS and planning criteria objectives
7 .7 .1 .3 Step 3 – review impacts of treated water upgrades on LOS yield
Step 3 in the integrated planning process is the review of the impacts that these infrastructure program changes have on the LOS yield of the system to determine if there are opportunities to deliver better whole-of-system outcomes (Figure 7-8). A change in the size or timing of a plant that has been made to meet the treated water objectives may change the original program that was developed in Step 1 to meet the LOS objectives.
The integrated planning approach is structured to determine the combinations of options that are most efficiently able to meet long-term water supply requirements for the region for water security (i.e. LOS objectives) and for meeting periods of very high consumption.
7 .7 .2 NEW SUPPLY AUGMENTATION
A systematic assessment framework is used to consider future infrastructure options and compile them as part of a staged program of augmentation works.
Beyond augmentations to existing assets, the first LOS objective that cannot be met is the Baroon Pocket Dam minimum operating level. This failure is attributed to high population growth in the northern sub-region, with limited local major bulk supply sources.
The northern sub-region will be the first area to require a new supply augmentation to address both LOS objectives and the treated water
capacity during high consumption periods. The options selection and integrated planning process show the most efficient means of addressing this deficiency is through a northern water supply solution that can achieve both of these outcomes.
For example, Seqwater modelled hypothetical desalination plants of different capacities and in different sub-regions to test their relative contribution to water security in the northern sub-region. Because of the way the water grid operates, a desalination plant in the northern sub-region would make the greatest contribution at least cost compared with plants located further south (Figure 7-9).
0
10,000
20,000
30,000
40,000
50,000
60,000
70,000
80,000
50 ML/day northerndesalination site
100 ML/day northerndesalination site
50 ML/day centraldesalination site
100 ML/day centraldesalination site
45 ML/day Gold CoastDesalination Plant upgrade
Tota
l wat
er p
rodu
ctio
n (M
L/an
num
)
Figure 7-9 Relative water security contribution of hypothetical new desalination plants as first augmentation
0
200
400
600
800
1,000
1,200
1,400
1,600
1,800
2,000
ML/
day
Required treated water MDMM demand Augmentation to existing assets − treated water capacity LOS upgrade treated water capacity
Final upgrade 1 Final upgrade 2
Final upgrade 3
2015
2017
2019
2021
2023
2029
2035
2037
2025
2027
2031
2033
2043
2045
2039
2041
0
100,000
200,000
300,000
400,000
500,000
600,000
ML/
annu
m
SEQ demand Augmentation to existing assets − LOS yield New source augmentations – LOS yield
Upgrade 1 Upgrade 2
Upgrade 3
2015
2017
2019
2021
2023
2029
2035
2037
2025
2027
2031
2033
2043
2045
2039
2041

Water for life74
Of note is the reduced benefit of increasing the size of the augmentation, with the 100 ML/day desalination plant contributing only a marginally greater system yield than the 50 ML/day plant.
This outcome demonstrates there is an efficient limit to the size of the augmentation, above which the ability to use the additional capacity in the northern sub-region is limited. This is because network constraints limit the transfer of water from and to the northern sub-region.
It is also apparent that no single option efficiently meets water security needs or integrated planning requirements for the 30-year planning period for most likely demand projections. Therefore multiple options are required.
Two water source types in the northern sub-region have been identified as possible first new supply augmentations that meet the required objectives (Table 7-1). These are surface water options on the Mary River (with and without the raising of Borumba Dam wall) or a desalination plant located in the northern sub-region.
Recycled water may be an efficient new supply source augmentation option in the future. Further consultation and engagement with the community and Government is required to understand the potential role of recycled water for water supply in SEQ, for use outside of drought conditions.
Table 7-1 Efficient first stage augmentation options beyond 2030
Option type Sub-region Options that meet the objectives*
Surface water Northern • Harvest water from the Mary River in the Gympie region, pump into a new off-stream storage and from there into the existing Borumba Dam
• Upgrade the Noosa Water Treatment Plant
• Harvest water from the Mary River in the Gympie region, pump into a new off-stream storage and from there into a raised Borumba Dam
• Upgrade the Noosa Water Treatment Plant
• Build a new weir on the Mary River in the vicinity of Coles Crossing
• Raise the wall of the existing Borumba Dam to increase its storage capacity
• Upgrade the Noosa Water Treatment Plant
Desalination Build a northern desalination plant
*All options were identified in previous studies and desktop assessment. Further detailed investigations and consultation will confirm their suitability. Difficult site characteristics, routes and/or terrain for the construction of any of these infrastructure components may considerably impact on the cost and therefore change the outcome of this assessment.

South East Queensland’s Water Security Program 2015-2045 75
7 .7 .3 SECOND AND SUBSEQUENT SUPPLY SOURCE AUGMENTATIONS
The integrated planning approach also identifies that once the first new supply source augmentation has been implemented and the northern sub-regional constraints have been resolved, there are a larger number of efficient
Table 7-2 Efficient second stage augmentation options
Option type Sub-region Options that meet the objectives*
Surface water
Northern • Harvest water from the Mary River in the Gympie region, pump into a new off-stream storage and from there into the existing Borumba Dam
• Upgrade the Noosa Water Treatment Plant
• Harvest water from the Mary River in the Gympie region, pump into a new off-stream storage and from there into a raised Borumba Dam
• Upgrade the Noosa Water Treatment Plant
• Build a new weir on the Mary River in the vicinity of Coles Crossing
• Raise the wall of the existing Borumba Dam to increase its storage capacity
• Upgrade the Noosa Water Treatment Plant
Central Build Wyaralong Water Treatment Plant
WTP upgrade
Central Upgrade the Mount Crosby water treatment plants to 950 ML/day (no LOS yield increase)
Southern Upgrade the Molendinar Water Treatment Plant to 190 ML/day (no LOS yield increase)
Desalination Northern Build a northern desalination plant
Central Build a central desalination plant
Southern Upgrade the Gold Coast Desalination Plant (Stage 2 upgrade of 45 ML/day)
*All options were identified in previous studies and desktop assessment. Further detailed investigations and consultation will confirm their suitability. Difficult site characteristics, routes and/or terrain for the construction of any of these infrastructure components may considerably impact on the cost and therefore change the outcome of this assessment.
options for the second (and later) stages (Table 7-2). The most efficient of these will depend, in part, on what option is implemented first. The timing for implementation of the second and subsequent supply source augmentations will also be dependent of the option implemented first.
Within these options there are numerous opportunities for sizing and staging to achieve the most efficient outcomes, as explored in Section 7.8. The sizing and staging of the first augmentation option will invariably determine what options are better if implemented later.
7 .8 Supply option combinations
Many efficient bulk water supply options can be considered as future supply options. None of these options alone efficiently meets water security objectives, so options must be combined.
Just as there are many efficient bulk water supply options, there are also many potential supply option combinations to choose from.
As there is no need for a new water source for about 15 years, there is time to adapt the response to accommodate any changes which will ultimately influence the response over this time. The efficiency of the supply options may also change with the results from detailed site investigations in Version 2 of the Water Security Program and the integration with the detailed drought response plan in subsequent versions.
Assembling supply option combinations involves selecting one of the identified efficient supply options as the first augmentation and determining the appropriate timing, staging and characteristics of subsequent bulk supply augmentations. When assembling the bulk supply option combinations, it became clear that the first bulk supply augmentation sets the blueprint for the remaining investment choices. Any one option, once implemented, has a strong influence on which options are efficient for the second, third and in some cases fourth augmentations required to achieve the integrated planning objectives.
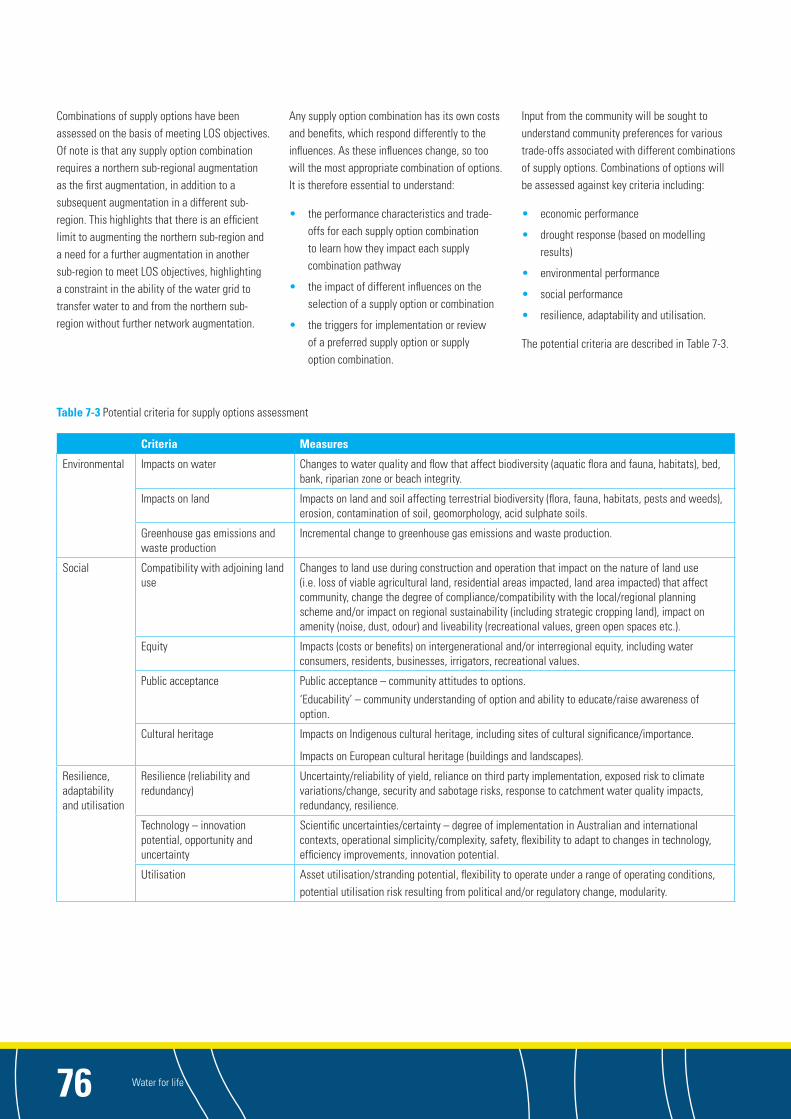
Water for life76
Combinations of supply options have been assessed on the basis of meeting LOS objectives. Of note is that any supply option combination requires a northern sub-regional augmentation as the first augmentation, in addition to a subsequent augmentation in a different sub-region. This highlights that there is an efficient limit to augmenting the northern sub-region and a need for a further augmentation in another sub-region to meet LOS objectives, highlighting a constraint in the ability of the water grid to transfer water to and from the northern sub-region without further network augmentation.
Table 7-3 Potential criteria for supply options assessment
Criteria Measures
Environmental Impacts on water Changes to water quality and flow that affect biodiversity (aquatic flora and fauna, habitats), bed, bank, riparian zone or beach integrity.
Impacts on land Impacts on land and soil affecting terrestrial biodiversity (flora, fauna, habitats, pests and weeds), erosion, contamination of soil, geomorphology, acid sulphate soils.
Greenhouse gas emissions and waste production
Incremental change to greenhouse gas emissions and waste production.
Social Compatibility with adjoining land use
Changes to land use during construction and operation that impact on the nature of land use (i.e. loss of viable agricultural land, residential areas impacted, land area impacted) that affect community, change the degree of compliance/compatibility with the local/regional planning scheme and/or impact on regional sustainability (including strategic cropping land), impact on amenity (noise, dust, odour) and liveability (recreational values, green open spaces etc.).
Equity Impacts (costs or benefits) on intergenerational and/or interregional equity, including water consumers, residents, businesses, irrigators, recreational values.
Public acceptance Public acceptance – community attitudes to options.
‘Educability’ – community understanding of option and ability to educate/raise awareness of option.
Cultural heritage Impacts on Indigenous cultural heritage, including sites of cultural significance/importance.
Impacts on European cultural heritage (buildings and landscapes).
Resilience, adaptability and utilisation
Resilience (reliability and redundancy)
Uncertainty/reliability of yield, reliance on third party implementation, exposed risk to climate variations/change, security and sabotage risks, response to catchment water quality impacts, redundancy, resilience.
Technology – innovation potential, opportunity and uncertainty
Scientific uncertainties/certainty – degree of implementation in Australian and international contexts, operational simplicity/complexity, safety, flexibility to adapt to changes in technology, efficiency improvements, innovation potential.
Utilisation Asset utilisation/stranding potential, flexibility to operate under a range of operating conditions, potential utilisation risk resulting from political and/or regulatory change, modularity.
Any supply option combination has its own costs and benefits, which respond differently to the influences. As these influences change, so too will the most appropriate combination of options. It is therefore essential to understand:
• the performance characteristics and trade-offs for each supply option combination to learn how they impact each supply combination pathway
• the impact of different influences on the selection of a supply option or combination
• the triggers for implementation or review of a preferred supply option or supply option combination.
Input from the community will be sought to understand community preferences for various trade-offs associated with different combinations of supply options. Combinations of options will be assessed against key criteria including:
• economic performance
• drought response (based on modelling results)
• environmental performance
• social performance
• resilience, adaptability and utilisation.
The potential criteria are described in Table 7-3.

South East Queensland’s Water Security Program 2015-2045 77
The criteria are a key component of selecting a preferred investment pathway to achieve water security for SEQ. While the criteria presented here in Version 1 of the Water Security Program have been developed by Seqwater with input from the SEQ water service providers, they are yet to include feedback from the community.
The efficiency, scale and integrated nature of the water grid has resulted in trade-offs for the SEQ community that are different to other regions. The current level of cost estimates reveals some indicative similarities however the full economic cost of each option has not yet been assessed at a level of granularity for absolute conclusions to be drawn. There are, however, material differences in environmental, social and system performance and the ability to respond to drought.
Seqwater recognises the importance of gathering community feedback on the criteria and community values to better reflect community views when assessing options to achieve water security for the region. Seqwater will ask the community for their views and incorporate the feedback in Version 2 of the Water Security Program.
Using the criteria and the information obtained from detailed site-specific assessments, each supply option will be comparatively assessed against the broad elements of economic, social, environmental, performance (resilience, adaptability and utilisation) and ability to respond to drought. Community feedback will allow Seqwater to potentially assign weightings to those elements considered more or less important by South East Queenslanders.
The criteria and preferences for options are key elements of selecting a preferred combination of options for which Seqwater is seeking community feedback. The final preference of how SEQ secures water over the long term will be subject to community feedback and further assessment.

Water for life78
7 .8 .1 SUMMARY
• Planning to achieve the LOS objectives and the ability to treat and transport water to meet demand across SEQ for the next 30 years is complex and subject to a range of influences which can alter the response.
• Supply options have been assessed at a strategic level due to the nature and number of potential options and are subject to change following community feedback.
• No single option efficiently meets SEQ water supply needs over the next 30 years.
• Version 1 of the Water Security Program has focused on identifying efficient supply options for the planning period.
• There are multiple supply option pathways available and the preferred pathway depends on a range of conditions.
• If existing asset augmentation options are implemented, it will be about 15 years until a new supply source is required to meet LOS objectives. Many influences can change in this time. However, there is time to adapt a preferred response to accommodate these changing influences.
• The first supply augmentation sets the blueprint for the remaining supply options.
• Due to the order of accuracy of the costs at this strategic stage of assessment, and the potential range that the costs may fall within, efficient supply options can be combined so that there is no material difference expected in the range of net present costs (NPCs).
• Key differences between supply options include the impacts and benefits (social and environmental impacts, the ability to respond to drought and broader system performance measures) of the options.
• Understanding the performance and trade-offs of supply option investment pathways enables selection of preferred pathways for specific conditions.
• Changes in the influences (Chapter 2) will alter the selection of a preferred pathway as will incorporation of demand, system operation, decentralised and non-structural options.
• Seqwater will engage the community to build on the findings of Version 1 of the Water Security Program and incorporate community feedback on criteria and community values in Version 2 of the Program.
• Seqwater will also undertake detailed site investigations to better understand the specific impacts (e.g. social and environmental) and trade-offs of individual options and combinations thereof and will incorporate these findings into Version 2 of the Water Security Program.
• As it will be about 15 years until the next new source of water is required, Seqwater has time to plan more holistically to maintain water security for SEQ.
Version 1 presents a base for future planning and will evolve as broader solutions, more detailed site-specific information and community feedback are incorporated in the assessment process, and as the influences on water security evolve over the next 15 years before a new supply source is required.

08. Water futures
Water futures08

South East Queensland’s Water Security Program 2015-2045 79
08 Water futures
The Water Security Program must be adaptable to change, including being able to respond to and reflect community views and values as they evolve. Seqwater will engage with the community so future versions reflect community feedback and ideas.
Options for consideration in developing the water future of SEQ for the next 30 years are outlined in Chapter 7. There are multiple variations of supply, demand and system operation options that can be implemented to achieve the region’s water security objectives. When combined, these options form a ‘portfolio’. Due to the large number of options that exist, a range of portfolios is available, each with the potential to reflect different values and trade-offs, and representing different water futures. For example:
• one possible water future could be heavily focused on changing water-use behaviour and reducing water consumption, therefore pulling strongly on the demand lever to influence system performance
• an alternative water future could pull strongly on the supply lever, allowing increased consumption for households and businesses but requiring a larger number of water supply augmentations
• another variation could be heavily weighted towards operational strategies, maximising the use of existing water grid assets regardless of operational efficiency or system resilience outcomes (e.g. using desalination plants as a priority water source to maintain high levels of water security, compared to using desalination as a drought response asset)
• further variations could include greater adoption of decentralised solutions and/or non-structural solutions, such as policy reform, which may alter the water security objectives that need to be met, including the LOS objectives.
The diversification of supply, demand and system operation options to provide an adaptive water future is the key to achieving water security under a range of conditions. Seqwater’s proposed portfolio comprises a combination of supply, demand and system operation options. Additional considerations for future versions of the Water Security Program include decentralised and non-structural solutions. Community input is required to understand which levers the community favours to meet the water security objectives, so that their views and desired trade-offs can be reflected and the proposed portfolio continuously improved.
8 .1 Assessments undertaken
As outlined in Chapter 7, a range of assessments have been undertaken at a strategic level to determine the proposed options for the levers of system performance (i.e. supply, demand and system operation). Understanding community preferences on all three levers is essential to determine the preferred portfolio of options.
Overall, an efficient balance between system operating strategies, business as usual demand management measures and staging of water supply options has resulted in little differentiation in the economic performance when combining efficient supply options, even when tested against changing energy prices and discount rates.
The key areas of difference between the various portfolios can be measured using the following criteria:
• system performance under average conditions
• ability to respond to drought
• ability to respond to changing demand and/or climate change
• broader resilience such as ability to respond to floods, bushfire, water quality issues, etc.
• performance against social criteria
• performance against environmental criteria.
Community views will be sought to confirm criteria, which criteria are most important, preferences for trade-offs between these criteria, as well as how the community considers various portfolios perform against these criteria.
Further work will be undertaken to fully understand the options available to manage demand in SEQ, and therefore the opportunities available for demand to influence system performance.
Further work is also required to understand the potential influence of decentralised systems on system performance. Decentralised systems can both add to supply (e.g. localised treatment for drinking water purposes) and/or reduce demand on existing water supplies (e.g. localised recycled water schemes for irrigation of green space).
Recycled water for use as a water supply outside of drought conditions also requires further consultation and assessment.

Water for life80
Figure 8-1 Augmentations to existing assets – first phase of potential water future for SEQ
SYSTEM PERFORMANCE
Most likely demand forecast:Includes business as usual
demand management measures
Assumes regional average of 185 L/p/day for residential use
and 100 L/p/day for non-residential use
Balance between cost efficiency and water security:
Operating rules for regional and sub-regional triggers, including interconnectors
and manufactured water assets
Augmentations to existing assets:• Northern Pipeline
Interconnector Offtake• Aspley Pump Station upgrade• North Pine Water Treatment
Plant upgrade• Mount Crosby water
treatment plants upgrade
DEMAND
SYSTEM OPERATION
SUPPLY
8 .2 Water security portfolio
Based on information available today, Seqwater presents a portfolio that includes a mix of supply, demand and system operation options. This portfolio combines:
• an efficient set of measures that maximises existing water grid assets, and minimises the requirement for major capital expenses for more than 15 years
• the most likely demand forecast and associated business as usual demand management measures
• system operation strategies based on a balance between cost minimisation and water security
• a staged approach to implementation of efficient bulk water supply options which includes augmentations to existing assets followed by efficient supply option augmentations.
8 .2 .1 AUGMENTATIONS TO EXISTING ASSETS
By assessing system performance and examining options available for supply, demand and system operation, Seqwater has identified options that provide an efficient strategy using augmentations to existing assets as the first step. Seqwater expects water security objectives will be maintained with these system augmentations from 2015 to 2033, based on the current assumptions for a number of factors including system capability and operating strategies, demand projections, climate and consumer response to restrictions. The options for augmenting existing assets present the first phase of a potential water future for SEQ, as shown in Figure 8-1 and Table 8-1.
Table 8-1 Potential water security portfolio 2015 – 2030
System performance Key attributes
Demand Most likely demand forecast:
• includes business as usual demand management measures
• the QGSO medium series population forecast has been adopted
• it is expected that per capita consumption will increase until the end of 2017-18 and then stabilise
• from 2017-18 Seqwater assumes a regional average of 185 L/p/day for residential use and 100 L/p/day for non-residential use.
Supply Augmentations to existing assets:
• Northern Pipeline Interconnector Offtake
• Aspley Pump Station upgrade
• North Pine Water Treatment Plant upgrade
• Mount Crosby water treatment plants upgrade.
System operation • Gold Coast Desalination Plant – hot standby with regional operating triggers
• Western Corridor Recycled Water Scheme – care and maintenance with regional operating triggers
• sub-regional triggers.

South East Queensland’s Water Security Program 2015-2045 81
SYSTEM PERFORMANCE
Most likely demand forecast:Regional averages for
residential and non-residential use
Balance between cost efficiency and water security:
Operating rules for regional and sub-regional triggers, including interconnectors
and manufactured water assets
• Maximise use of existing assets, then
• New augmentation options.
DEMAND
SYSTEM OPERATION SUPPLY
Figure 8-2 Proposed water security portfolio
8 .2 .2 NEW SUPPLY AUGMENTATIONS
There are multiple future pathways available to maintain water security in SEQ to 2045, comprising thousands of combinations of options using supply, demand and operational strategy levers to influence system performance.
Figure 8-2 provides an overview of the choices available for supply, demand and system operation, each leading to a different water future. Determining the preferences for supply, demand and system operation options will be a focus of Version 2 of the Water Security Program.
Table 8-2 summarises the key aspects of a potential water security portfolio from 2015 to 2045.
8 .2 .3 POTENTIAL WATER SECURITY PORTFOLIO – 2015 TO 2045
Table 8-2 Potential water security portfolio – 2015 to 2045
System performance Key attributes
Demand Most likely demand forecast:
• includes business as usual demand management measures
• uses the QGSO medium series population forecast
• assumes a residential per capita consumption
• estimates non-residential use.
Supply Augmentations to existing assets:
• Northern Pipeline Interconnector Offtake
• Aspley Pump Station upgrade
• North Pine Water Treatment Plant upgrade
• Mount Crosby water treatment plants upgrade.
New supply augmentation options :
• Northern sub-region new source augmentation
• second and subsequent augmentation options.
System operation • development of operational rules
• modes of operation
• short-term operational planning
• medium-term operational planning
• long-term operational planning.

Water for life82
8 .3 Resilience to change
It is also important that the water security portfolio is able to adapt to change over time. As noted previously, changes to planning assumptions made as part of the assessment over the 30-year period of the Water Security Program are inevitable. These include changes from current projections for:
• the total population, including where people live, how many people live in a single dwelling, and the types of housing (e.g. higher density urban communities or multi-dwelling properties such as apartments and units)
• how the community and businesses use water
• climate variability, including the frequency, severity and duration of extreme events
• environmental protection policies
• drinking water quality standards
• technology and water efficiency improvements
• political and economic drivers of the region
• community views on environmental, social, economic and system performance characteristics, including LOS objectives
• community attitudes to different water supplies (e.g. the use of recycled water).
Further research is required to understand the potential shifts in trends for the above factors. While there were many influences that may impact on system performance (as described in Chapter 2), the timeframes of assessment limited the analysis to two critical influences on future water security—demand and climate change. As part of this version of the Water Security Program, Seqwater has undertaken scenario analysis to test the impact of climate variation and water consumption rates on system performance.
For example, changes to the rate of growth in demand will impact on the timing and potentially the size of infrastructure required. However, changes to rainfall patterns which either increase the frequency and intensity
of rainfall events or reduce the amount of rainfall, may trigger a change in the choice of supply augmentation from a surface water source to a climate-independent source such as seawater desalination.
To inform a plan that can adapt to future change, the scenario analyses were undertaken on a sample of bulk water supply option combinations, to test their robustness under a range of changing conditions and therefore better demonstrate system performance characteristics. Sensitivity analyses were also undertaken to test the response of different supply combinations to changes in energy prices and discount rates.
Subsequent versions of the Water Security Program will review a broader range of scenarios to provide a greater understanding of how the different water futures respond to changing conditions, including influences on system operating strategies and demand.
Appendix I provides further detail on the approach taken to scenario analysis and sensitivity testing.
8 .3 .1 SCENARIO ANALYSIS AND SENSITIVITY TESTING FINDINGS
The scenario analysis and sensitivity testing showed that supply options are affected by changes in water consumption rates and climate variation, as follows:
• General results from changing demand demonstrated that a reduction in demand to the low demand series delayed the first augmentation. Based on low demand projections, only one supply augmentation was required over the 30-year period. Conversely, an increase in demand brought forward the augmentations and increased the quantity and sizing of the new water supplies required to achieve LOS objectives.
• Low inflows to the water storage dams resulting from climate change brought forward augmentations considerably and increased the quantity and sizing of new supplies required.
• The combination of low inflows and high demand brought the first augmentation forward by about eight years. Conversely, low demand delayed the first augmentation by about seven years.
• To be robust against climate change and high demand, the region needs more manufactured water supplies (e.g. desalination) in its water future. In this scenario, the capacity of the manufactured water assets required for the region exceeds the volume achieved by increasing the capacity of the Gold Coast Desalination Plant (i.e. SEQ will require an additional water source).
• Energy price escalation could significantly change the NPC of any water future. Low to medium rates of escalation do not provide any differentiation between varying supply option combinations.
The findings from the scenario analysis and sensitivity testing provide information on system performance, and how this changes with changes to influences. Further scenario analysis and sensitivity testing will provide an improved understanding of potential adaptive planning triggers.
Understanding community preferences on supply, demand and operating strategy options, as well as willingness to incorporate system resilience into water futures is essential to determining the preferred portfolio over time.
Over the 30-year period of this Water Security Program, there will be many changes to forecast trends, including potential changes to the LOS expectations of the community. This reinforces the benefit of options that can be staged and therefore adapted to changes in influences on water security. What is certain is that drought will occur again in SEQ, leading to declining water security. Climate-resilient supplies will be required at some point in the future to achieve LOS objectives. SEQ’s ability to respond to drought will be further assessed in the next phase of the Water Security Program.

South East Queensland’s Water Security Program 2015-2045 83
8 .4 Adaptive planning
The Water Security Program is underpinned by an adaptive planning approach that allows it to respond to future changes. Adaptive planning captures future issues that will influence system performance by acknowledging that there are currently multiple pathways to achieve the water security objectives over the next 30 years. Each of these pathways represents different portfolios, with different characteristics and suitability to possible future conditions and choices for shaping the water future of SEQ.
The region must have a plan to achieve water security objectives over the long term. As part of this plan, triggers for action need to be identified and appropriate actions taken to enable an optimal long-term outcome (e.g. securing land for potential future water sources). The plan needs to recognise shifts in trends and conditions for review, and be ready to adapt to change that is difficult to predict.
8 .4 .1 TRIGGERS FOR ACTION
As noted earlier, community input is required to determine the composition of supply, demand, system operation and non-structural options and therefore the preferred portfolio. Feedback from the community will be incorporated into choosing a preferred water security portfolio, and may trigger actions to occur in the next five years (e.g. changes to demand management measures or operating strategies, implementation of decentralised or non-structural solutions). Table 8-3 outlines the key triggers for action that have been identified in this Water Security Program. These triggers are based on current planning forecasts, and are subject to change.
Table 8-3 Key triggers for action
Timeframe Action Prerequisite actions
Within two years Update Water Security Program to reflect community preferences and integrate drought response options
Community input
Within five years Secure land to remain adaptable for future water supply augmentations
Detailed site investigations
Ongoing Monitor trends in consumption, population, climate variability, technology, policies and standards, and continue to implement business as usual demand management measures
Proactively seek outcomes to improve system performance in these areas
Every five years Adapt Water Security Program to reflect changes in community feedback and trends. This may change dates and/or actions outlined below
Fast-track if material changes to trends are identified
8 .4 .2 PREPAREDNESS
The influences on water security are vast and numerous. Any of these influences alone or in combination may impact on system performance, and therefore the preferred water security portfolio.
The options for developing a water security portfolio will be reviewed if any of the following conditions are realised:
• site-specific assessments incorporating social, environment and engineering assessments, identify issues with the efficient supply options outlined in Section 7.7
• prolonged drought occurs, bringing forward the need for investment in climate-resilient sources
• climate change results in reduced rainfall (and thus water availability) and/or increasingly intense rainfall events which may impact on water quality, reducing the ability of the system to treat and supply surface water
• innovations in manufactured water treatment significantly reduce the cost of these options while maintaining or increasing their reliability
• drinking water quality requirements change significantly, which may impact on treatment requirements and thus costs of surface water supplies to a greater degree than manufactured water supplies
• demand growth distribution changes significantly such that a different sub-region of SEQ has a greater degree of vulnerability
• demand behaviours change, affecting sub-regional performance against water security objectives to differing degrees
• policy or climate variability reduces the surface water allocations available over time
• an increased prevalence of decentralised solutions and/or integrated regional planning alters the distribution and degree of growth in demand

Water for life84
• changing availability of land and/or incompatible investment in neighbouring land
• government policy removes an option from consideration.
There are limited potential new surface water sources remaining in SEQ. There will be another drought and, as the population grows, there will be a need for additional climate-resilient water sources to respond to drought. Further, the northern sub-region is currently the most vulnerable and will require an augmentation in the next 30-year period under any of the conditions assessed.
The availability of suitable land to accommodate any future augmentations is becoming increasingly limited. Seqwater will therefore progress site investigations with the aim of securing land for possible future augmentations to remain adaptable and responsive to future water security needs.
Preservation of sites and obtaining approvals as early as possible will enable flexibility to respond to changing conditions and influences. It will also enable sites to be secured for future water supply needs beyond the 30-year horizon.
Remaining adaptable and seeking community views through ongoing consultation will be critical to delivering an efficient, robust and secure water future for this region that best reflects the views of South East Queenslanders.

Planning for standalone communities09
9. Planning for standalone com
munities

South East Queensland’s Water Security Program 2015-2045 85
09 Planning for standalone communities
Figure 9-1 Standalone communities serviced by Seqwater
A standalone community is defined as an urban community supplied by a water source that is not connected to the water grid. Seqwater provides bulk water to 16 standalone community water supply schemes, supplied by the following treatment plants (also shown in Figure 9-1).
• Amity Point
• Beaudesert
• Boonah-Kalbar
• Canungra
• Dayboro
• Dunwich
• Esk
• Jimna
• Kenilworth
• Kilcoy
• Kooralbyn
• Linville
• Lowood
• Point Lookout
• Rathdowney
• Somerset Dam.
Version 1 of the Water Security Program outlines the infrastructure planning arrangements for standalone community water supply schemes identified as having a high priority for intervention due to the risk of a water supply shortfall within the next five years. Version 2 will assess future infrastructure needs for all remaining standalone communities and include the development of a methodology to assess the performance of standalone community water supply schemes against LOS objectives.
Planning for all standalone communities will be undertaken to allow each of these schemes to meet the LOS objectives by the completion of Version 2 of the Water Security Program.
Sunshine Coast Regional Council
Somerset Regional Council
Noosa Shire CouncilGympie
Regional Council
Moreton Bay Regional Council
Toowoomba Regional Council
Lockyer Valley Regional Council
Ipswich City Council
Scenic RimRegional Council
City ofGold Coast
Redland CityCouncil
Brisbane CityCouncil
Southern DownsRegional Council
Southern Burnett Regional Council
Kooralbyn
Rathdowney
Canungra
BeaudesertBoonah-Kalbar
Dunwich
AmityPoint Point Lookout
Lowood
Dayboro
Kilcoy
Esk
SomersetDam
Linville
Jimna
Kenilworth
Logan CityCouncil
Local Government Area
Standalone community water treatment plant
City of Gold Coast
Logan City Council
Queensland Urban Utilities
Redland City Council
Unitywater
Water service providers:

Water for life86
9 .1 Standalone community prioritisation
Prioritisation of standalone community water supply schemes is based on whether a risk of water supply shortfall has been identified in the next five years. A community is considered to be high priority if one or more of the following factors are possible within the next five years:
• water allocation is insufficient to accommodate proposed average day demands over the initial five-year period
• treatment plant capacity does not meet future persistent peak demand over the next five years
• the quality or reliability of raw water sources are considered to be at significant risk.
Using the above risk assessment criteria, three standalone communities have been identified as high priority—Beaudesert, Canungra and Lowood. Table 9-1 summarises the risk assessment outcomes for those communities.
Table 9-1 High priority standalone communities
Standalone community
Supply risk Summary of risk assessment
Beaudesert Treatment capacity shortfall
There is indication that the Beaudesert peak demand (based on MDMM) will reach treatment plant capacity within the next five years.
Canungra Treatment capacity shortfall
Based on demand projection information, the water treatment plant is highly likely to require an augmentation in the next five years. Due to the size of the community, supply can be supplemented through water carting in the interim if required.
Lowood Treatment capacity shortfall
The Lowood Water Treatment Plant is expected to surpass its intended operational capacity within the next five years, placing Lowood at risk of supply shortfall.
Appendix J provides a detailed overview of the assessment undertaken as part of this prioritisation and other water security considerations over the next five years. For each of the standalone communities identified as high priority, the risks identified were already being addressed through short-term works, contingency plans and long-term planning.
9 .2 Assessment limitations
The following key inputs were used to understand and evaluate the risk of supply and subsequent development of 30-year water supply strategies for at-risk schemes:
• previous studies and their associated infrastructure planning outcomes
• demand projections provided by SEQ water service providers
• source water availability, quality and reliability
• treatment plant capacity.
There is a limited understanding of influences on current demand trends for the standalone community water supply schemes due to limited data being available at the time of this study. Further investigation will be required to gauge the dominant drivers to any increases in demand, which may include population growth, behavioural changes or other factors including system leakage and external usage (i.e. standpipe extraction for water carting to areas not connected to urban water supply infrastructure).

South East Queensland’s Water Security Program 2015-2045 87
Figure 9-2 Beaudesert – existing and proposed bulk supply system
9 .3 Beaudesert water supply scheme
The Beaudesert water supply scheme sources raw water from the Logan River for treatment at the Beaudesert Water Treatment Plant and supply of drinking water to the town of Beaudesert. Raw water is released from Maroon Dam to the Logan River system for environmental flows, irrigation and for treated urban supply for Rathdowney, Kooralbyn and Beaudesert. Treated water from the water treatment plant is delivered to the distribution network operated by Queensland Urban Utilities (Figure 9-2).
During the risk assessment and prioritisation process, the Beaudesert water supply scheme was assigned a high priority rating due to peak demand levels approaching the current water treatment plant supply capacity. Significant demand growth is projected within the service area. The water security of the Beaudesert water
supply scheme has been under assessment for a number of years and numerous planning studies have been completed by Seqwater and the former Queensland Water Commission. The favoured strategy involves construction of a pipeline to connect Beaudesert to the water grid via Logan City Council’s water supply network. Implementation of this strategy depends on the timing of projected growth in both the Beaudesert and Logan City areas.
The investigation carried out as part of the Water Security Program has reviewed the previous and ongoing planning studies. In addition, this investigation has reviewed the demand projections, source water availability, quality and reliability, and treatment plant capacity to identify the need for any augmentations to meet the water supply security needs of the scheme within a 30-year planning horizon.
A summary of background information sourced from previous studies which has been considered in this investigation is provided below:
• The Beaudesert Water Treatment Plant has an existing capacity of 2.9 ML/day and is meeting current demands.
• A water quality-driven upgrade to the water treatment plant is in the process of being commissioned which will see an increase in capacity to 3.3 ML/day based on a 20-hour operation (4 ML/day 24 hour operation).
• The raw water quality can be described as turbid, coloured and has constant potential to contain pathogens due to an array of land uses throughout the catchment. The raw water quality is consistent during dry periods and highly inconsistent during periods of rainfall. The Resource Operations Plan (ROP) states that when the water level in Maroon Dam is at or below 193.23 m Australian Height Datum (AHD) (10,000 ML or 22% of full supply volume) water must not be released to supply medium priority water allocations, therefore improving the security situation substantially for urban supply.
VE R E S D A L E
WYA R A L O NGD A M
NIND O O INB A HD A M
B R O ME LT O NO F F S T R E A M S TO R A G E
B U C C A N
B A H R SSC R U B
C A NU NG R A
C E D A RC R E E K
C E D A RG R O V E
C E D A RVA L E
C O U L S O N
B O Y L A ND G U A NA B A
G R E E NB A NK
C L A G IR A B A
C R Y NA
G O O L MA N
B E NO B B L E
A L L E NV IE W
B E A U D E S E R T
A L L A ND A L E
B ID D A D D A B A
B IR NA M
B R O ME LT O N
SO U T HMA C L E A N
TA MB O R INEMO U NTA IN
TA MB O R INE
SO U T HR IP L E Y
WA S H P O O L
WO L F F D E NE
WO NG AWA L L A N
WO NG L E P O NG
WO O D H IL LWO O L O O MA N
U ND U L L A H
WO O NG O O L
WYA R A L O NG
YA R R A B IL B A
YATA L A
WIT H E R E N
U P P E RC O O ME R A
VE R E S D A L ESC R U B
WIL L O WVA L E
G L E NE A G L E
K A G A R U
JO S E P H V IL L E
MA U D S L A ND
L O G A NVIL L A G E
K ING S H O L ME
L U S C O MB E
JIMB O O MB A
LY O NSPE A KC R O S S ING
NO R T HMA C L E A N
O R ME A UNO R W E L L
MU ND O O L U N
MU NR U B E N
O R ME A UH IL L S
O X E NF O R D
PA C IFPINE S
NE R A NG
NE WB E IT H
MO U NTNAT H A N
PIMPA MA
TA B R A G A L B A
STA P Y LT O N
ST O C K L E IG H
Loga
n
Riv
er
Tevi
o t
Bro
o k
Co
om
era
R iv er
Al bert R ive r
MO
UN
TLIN
DE
SAYHIGHWAY
Existing Logan distribution pipework requires augmentation
Future Seqwater pipeline to be constructed
4 ML/day water quality upgrade
Logan City
Ipswich City
Scenic RimRegional
Gold CoastCity
Chambers Flat
Woodhill
Coomera
Birnam RangeBeaudesert WTP
Stapylton
Water treatment plants
Reservoirs
Pump station
Major distribution reservoirs
Future major distribution pipeline
Future Seqwater pipeline
Bulk water pipelines
Beaudesert Supply Scheme
Local Government Areas
City of Gold Coast
Logan City Council
Queensland Urban Utilities
Redland City Council
Unitywater
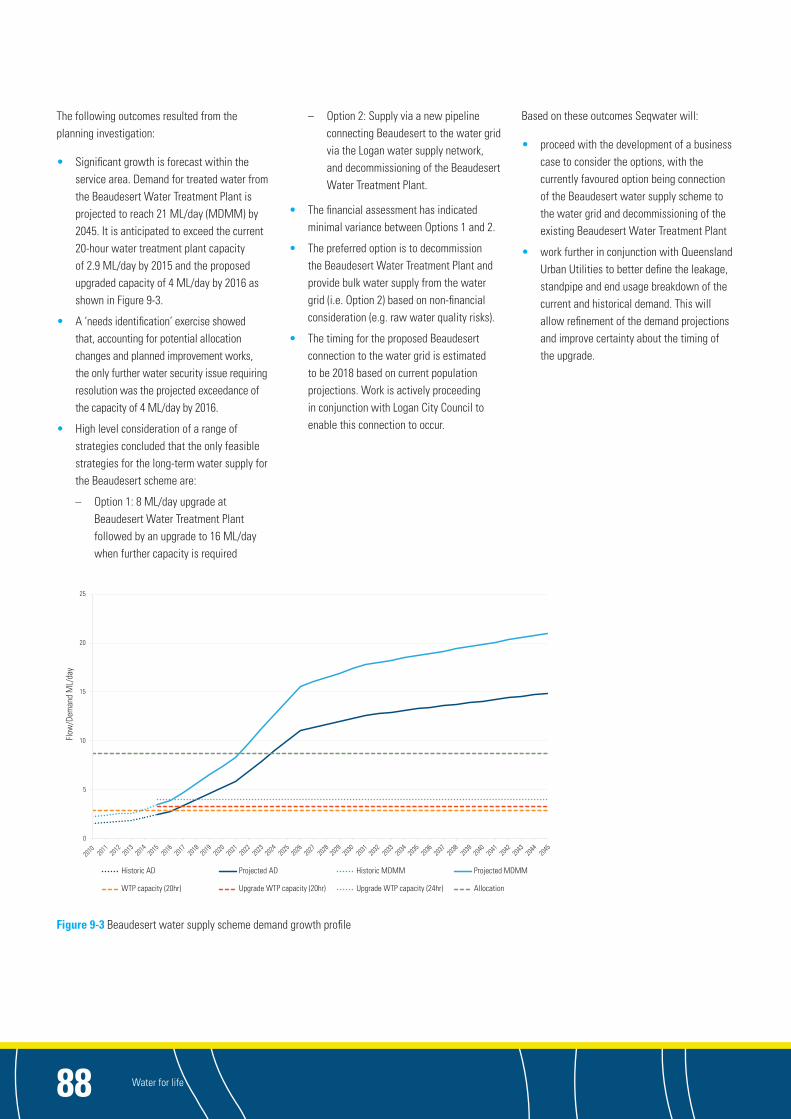
Water for life88
The following outcomes resulted from the planning investigation:
• Significant growth is forecast within the service area. Demand for treated water from the Beaudesert Water Treatment Plant is projected to reach 21 ML/day (MDMM) by 2045. It is anticipated to exceed the current 20-hour water treatment plant capacity of 2.9 ML/day by 2015 and the proposed upgraded capacity of 4 ML/day by 2016 as shown in Figure 9-3.
• A ‘needs identification’ exercise showed that, accounting for potential allocation changes and planned improvement works, the only further water security issue requiring resolution was the projected exceedance of the capacity of 4 ML/day by 2016.
• High level consideration of a range of strategies concluded that the only feasible strategies for the long-term water supply for the Beaudesert scheme are:
– Option 1: 8 ML/day upgrade at Beaudesert Water Treatment Plant followed by an upgrade to 16 ML/day when further capacity is required
– Option 2: Supply via a new pipeline connecting Beaudesert to the water grid via the Logan water supply network, and decommissioning of the Beaudesert Water Treatment Plant.
• The financial assessment has indicated minimal variance between Options 1 and 2.
• The preferred option is to decommission the Beaudesert Water Treatment Plant and provide bulk water supply from the water grid (i.e. Option 2) based on non-financial consideration (e.g. raw water quality risks).
• The timing for the proposed Beaudesert connection to the water grid is estimated to be 2018 based on current population projections. Work is actively proceeding in conjunction with Logan City Council to enable this connection to occur.
Figure 9-3 Beaudesert water supply scheme demand growth profile
Based on these outcomes Seqwater will:
• proceed with the development of a business case to consider the options, with the currently favoured option being connection of the Beaudesert water supply scheme to the water grid and decommissioning of the existing Beaudesert Water Treatment Plant
• work further in conjunction with Queensland Urban Utilities to better define the leakage, standpipe and end usage breakdown of the current and historical demand. This will allow refinement of the demand projections and improve certainty about the timing of the upgrade.
0
5
10
15
20
25
Flow
/Dem
and
ML/
day
Historic AD Projected AD Projected MDMM
Upgrade WTP capacity (24hr)
Historic MDMM
Upgrade WTP capacity (20hr) AllocationWTP capacity (20hr)
2010
20
1120
1220
1320
1420
1520
1620
1720
1820
1920
2320
2420
2520
2920
3020
3120
3220
2020
2120
2220
2620
2720
2820
3320
3720
3820
3920
4020
3420
3520
3620
4320
4420
4520
4120
42

South East Queensland’s Water Security Program 2015-2045 89
9 .4 Canungra water supply scheme
The Canungra water supply scheme (Figure 9-4) supplies potable water to the township of Canungra, and to surrounding properties when required, via tanker companies accessing a standpipe located outside the Canungra Water Treatment Plant. The Canungra Water Treatment Plant extracts raw water from Canungra Creek. Treated water from the plant is delivered to the distribution network operated by Queensland Urban Utilities.
Raw water for the Canungra Water Treatment Plant is sourced through run-of-river flows from Canungra Creek. This source does not provide the level of reliability normally required. However, due to the small size of the community, any raw water shortfall affecting potable supply to the
Canungra community can be remedied by carting water, which has been successfully employed in the past in line with the water supply scheme’s drought response plan.
During the prioritisation exercise described in previous sections, the Canungra water supply scheme was assigned a high priority rating due to peak demand levels approaching the existing water treatment plant capacity. Significant demand growth is projected within the service area. Various planning and design studies have, and are being undertaken by Seqwater to improve the performance of the scheme over time. The investigation carried out as part of the Water Security Program has reviewed the previous and ongoing studies. In addition, this investigation has reviewed the demand projections, source water availability, quality and reliability, and treatment plant capacity to identify the need for any augmentations to meet the water supply security needs of the scheme within a 30-year planning horizon.
A summary of background information, which was sourced from previous studies and has been considered in this investigation is provided below:
• The existing capacity of the Canungra Water Treatment Plant is approximately 330 kL/day based on a 20-hour operation.
• Current production need is estimated to be approximately 380 kL/day (MDMM), which is above the 20-hour operational capacity of 330 kL/day but within the plant’s 24-hour operational capacity of 400 kL/day.
• At peak demand times when there is an operational shortfall due to water treatment plant capacity, water carting can supplement supply as required. However, as demand increases supply shortfalls are expected to become more frequent, which would result in carting becoming more frequent. Therefore, carting to address water treatment plant capacity shortfalls is only considered to be a short-term solution.
Can
ungr
aC
reek
Co o
me
raR
i ver
C L A G IR A B A
B E NO B B L E
B ID D A D D A B A
TA MB O R INEMO U NTA IN
WIT H E R E N
L O WE RB E E C H MO NTNIND O O INB A H
B E AUDE SE R T N E RA
NG
RO
AD
L A MIN
GTON
NAT IONA L PA R K
R OAD
BE
EC
HM
ON
T
R O A D
U PPE
R
CO
OM
ERA
R
O AD
C A NU NG R A
BackCre
ek
Future upgrade to 1.5 ML/day capacity and construct off-stream storage on Canungra Creek
Logan City
Scenic RimRegioinal
City of Gold Coast
Canungra WTP
Water treatment plants
Roads
Canungra Supply Scheme
Local Government Areas
City of Gold Coast
Logan City Council
Queensland Urban Utilities
Redland City Council
Unitywater
Figure 9-4 Canungra – existing and proposed bulk supply system

Water for life90
Figure 9-5 Canungra water supply scheme demand growth profile
• Previous studies identified the need to upgrade the Canungra Water Treatment Plant in the near future as demand increases. Consequently, a design for the treatment plant upgrade has already been completed to allow the project to start once demand levels reach the appropriate trigger for the upgrade.
The following were the outcomes of the planning investigation:
• Significant growth is forecast within the service area. Demand for treated water from the Canungra Water Treatment Plant is projected to reach 0.97 ML/day by 2045. Although the adopted projections suggest that peak demand (measured as MDMM) is anticipated to exceed the current water treatment plant capacity of 0.33 ML/day in 2015, the achievement of such growth in such a small township is highly dependent on individual developments, standpipe usage and consumer behaviour. Demand is expected to exceed the water treatment plant capacity at some time within the next few years. Demand growth and development activity will be monitored closely by Seqwater in conjunction with Queensland Urban Utilities and Scenic Rim Regional
Council. The projected demand growth is shown in Figure 9-5.
• A needs identification exercise found that, accounting for recent allocation changes and pending improvement works, the only water security issue requiring resolution was the projected exceedance of the water treatment plant capacity in the next few years.
• High level consideration of a range of options concluded that the only feasible strategies for long-term water supply for the Canungra scheme are:
− Option 1: Supply to Canungra via a new pipeline from Beaudesert. The Canungra Water Treatment Plant would be decommissioned
− Option 2: 1.5 ML/day upgrade at Canungra Water Treatment Plant along with an off-stream storage for drought resilience.
• Option 2 is the preferred strategy based on cost. A review of the demand projection will be undertaken as a priority, considering current population and standpipe usage in the Canungra water supply scheme area.
The following recommendations are made as a result of this investigation:
• Work further in conjunction with Queensland Urban Utilities to better define the leakage, standpipe and end usage breakdown of the current and historical demand. This will allow refinement of the demand projections and improve certainty about the timing of the upgrade.
• Based on the review of the demand, the timing and/or trigger for the Canungra Water Treatment Plant augmentation is to be reviewed.
• In the interim, planning for the upgrade should be based on a 2018 timeframe to enable implementation if the review of the demand projection justifies the project over the short term.
• The proposed off-stream storage is required by 2021 according to current demand projections. Although the timing of delivery may change slightly in light of further review of the demand projections, detailed planning for this storage should begin given the time required to deliver such a project.
0.2
0.4
0.6
0.8
1
1.2
2010
20
1120
1220
1320
1420
1520
1620
1720
1820
1920
2320
2420
2520
2920
3020
3120
3220
2020
2120
2220
2620
2720
2820
3320
3720
3820
3920
4020
3420
3520
3620
4320
4420
4520
4120
42
Historic AD Projected AD Historic MDMM Projected MDMMWTP capacity (20hr) AllocationWTP capacity (24hr)
Flow
/Dem
and
ML/
day

South East Queensland’s Water Security Program 2015-2045 91
Figure 9-6 Lowood – existing and proposed bulk supply system
9 .5 Lowood water supply scheme
The Lowood water supply scheme supplies drinking water to the townships of Lowood and Fernvale in the Somerset Regional Council area and the townships of Laidley, Plainland, Gatton, Grantham, Helidon and Withcott in the Lockyer Valley Regional Council area, as well as a number of isolated users between these townships (Figure 9-6). The Lowood Water Treatment Plant extracts raw water from the Brisbane River, which is primarily supplied by releases from Wivenhoe Dam with some contribution from Lockyer Creek. Treated water from the plant is delivered to the distribution network operated by Queensland Urban Utilities.
During the prioritisation exercise, the Lowood water supply scheme was assigned a high risk rating due to peak demand levels approaching the current water treatment plant capacity.
Significant demand growth is projected within the service area. Various planning and design studies have, and are being undertaken by Seqwater to improve the performance of the scheme over time. The investigation undertaken as part of the Water Security Program has reviewed the previous and ongoing studies. In addition, this investigation has reviewed the demand projections, source water availability, quality and reliability, and treatment plant capacity to identify the need for any augmentations to meet the water supply security needs of the scheme within a 30-year planning horizon.
A summary of background information sourced from previous studies which has been considered in this investigation is provided below.
• The existing capacity of the Lowood Water Treatment Plant is 14.6 ML/day based on a 20-hour operation or 17.5 ML/day based on a 24-hour operation. Peak demands are approaching the water treatment plant capacity.
• The Lowood water supply scheme has excellent reliability given the supply from Wivenhoe Dam. However, raw water quality in the Brisbane River can be significantly reduced during and after floods.
The following outcomes resulted from the planning investigation:
• Significant growth is forecast within the service area, particularly within the larger townships of Fernvale, Lowood, Laidley and Gatton.
• Demand for treated water from the Lowood water supply scheme is projected to reach 32 ML/day by 2045 (refer Figure 9-7). The peak demand needs are anticipated to exceed the current Lowood Water Treatment
3Q
B
WIC HC IT Y
o u n t C r
Bu n
WIVE NH O EDAM
Lo ckyer C reek
Br is
ba n
eR
ive r
L aid
l ey
Cre
ek
Bri
sba n
eR
iver
Wa
rri l l
Cre
ek
L o c k y er C r eek
B re
mer
River
M
ur phy s C reek
C o oby Cre e k
W
AR W
ICK
RO
AD
WA R R E G O H IG HWAY
CU
NN
ING
HA
MH
IG
H W
AY
BR
ISB
AN
EVA
LL
EY
HIG
HW
AY
G AT T O N
TA R A MPA
H E L ID O N
L O WO O D
MIND E N
F u tu re up g rade to 32 ML /d cap acity
Future upgrade to 32 ML/day capacity
Water treatment plants
Roads
Lowood Supply Scheme
Local Government Areas
City of Gold Coast
Logan City Council
Queensland Urban Utilities
Redland City Council
Unitywater
Somerset RegionalToowoomba Regional
Lockyer Valley Regional
Ipswich City
Scenic Rim Regional
Lowood WTP

Water for life92
Plant capacity of 14.6 ML/day by 2015, but can be managed over the next two years to allow for augmentation works to proceed via extended water treatment plant operation (i.e. 24-hour operation achieves 17.5 ML/day).
• High-level consideration of a range of strategies concluded that the only feasible strategy for the long-term water supply for the Lowood scheme is to continue the current supply strategy with the upgrade of the Lowood Water Treatment Plant to meet demand as required.
• The Lowood Water Treatment Plant should be upgraded to a total capacity of 32 ML/day to meet projected demand to 2045, following further investigation of the demand projections to confirm the project timing.
Based on these outcomes of the water supply planning Seqwater will aim to:
• work further in conjunction with Queensland Urban Utilities to better define the leakage, standpipe and end usage breakdown of current and historical demand. This information will allow refinement of the demand projections and improve certainty about the timing of the upgrade
Figure 9-7 Lowood water supply scheme demand growth profile
• begin work on a business case for the Lowood Water Treatment Plant upgrade to consider in further detail how the upgrade is to be achieved and refine the timing of delivery
• prepare a contingency plan to determine what actions should be taken if demand were to exceed the capacity of the water treatment plant before the upgrade.
9 .6 Standalone community drought responses
A drought response plan is being developed for each standalone community not connected to the bulk water supply storages (excludes Kilcoy, Lowood, Esk and Somerset as they draw their water supply from the bulk water supply storages). These plans have been developed collaboratively with the relevant SEQ water service provider in accordance with the Drought Response Framework.
Dayboro and Canungra water supplies triggered drought responses during the summer of 2014-15. The drought responses for each respective standalone community water supply scheme were used effectively during these times.
The standalone drought responses completed to date are provided in Appendix K. This appendix contains a table for each standalone community showing the drought response triggers, key actions and targeted demands where appropriate for each response level. Some drought responses exclude response levels due to the size of the standalone community, the unpredictable nature of the water supply or the ability to cart water easily from a nearby water supply scheme. Version 2 of the Water Security Program will present drought response plans for all applicable standalone communities.
Seqwater assesses the level of drought risk for each standalone community at the start of each summer and considers current supply levels, demand and Bureau of Meteorology forecasts. Where there is a medium or high risk of drought that summer, increased monitoring, including advice to the relevant SEQ water service provider, begins at that time.
Seqwater will continue to collaborate with the relevant SEQ water service providers to implement effective drought responses for all standalone communities. Each drought response will be reviewed after a drought event and at the regular Water Security Program review.
5
10
15
20
25
30
35
40
2010
20
1120
1220
1320
1420
1520
1620
1720
1820
1920
2320
2420
2520
2920
3020
3120
3220
2020
2120
2220
2620
2720
2820
3320
3720
3820
3920
4020
3420
3520
3620
4320
4420
4520
4120
42
Historic AD Projected AD Historic MDMM Projected MDMM WTP capacity (20hr) WTP capacity (24hr) Allocation
Flow
/Dem
and
ML/
day

10. Next Steps
Next steps10

South East Queensland’s Water Security Program 2015-2045 93
10 NextSteps
The iterative nature of the Water Security Program enables Seqwater to proactively and rigorously plan over short-, medium- and long-term planning periods. Version 1 establishes a blueprint for water security until 2045, and shows that, with the exception of severe drought, urban water demand in SEQ can be met comfortably over the first 15 years by improving efficiencies in the existing integrated supply system and through continued implementation of business as usual demand management options.
Seqwater has outlined efficient supply options for consideration in developing a preferred portfolio to provide clarity for long-term planning and community consultation.
Community and stakeholder input, targeted planning, further research, and ongoing monitoring and review will enable continual refinement of the blueprint so that it remains adaptive to external influences and community expectations. This section describes the steps Seqwater will take to progress the Water Security Program over the different planning horizons while continuing to meet statutory obligations and timeframes.
10 .1 Engaging the community
The current high level of water security provides the ideal window of opportunity for Seqwater, the SEQ water service providers and the community to work together now to develop a preferred future for the region’s long-term water security.
Version 1 of the Water Security Program presents a range of possible options for developing the water future of SEQ on which Seqwater will actively seek feedback from all interested stakeholders. There are trade-offs associated with all of the options for managing demand, augmenting supply, and optimising efficient operation of the bulk water supply system which need to be considered for choices to be made. It is critical that the community understands the holistic benefits and costs of each option, and has the opportunity to engage with Seqwater to develop a collective understanding of how the community values water as well as the trade-offs that South East Queenslanders are prepared to accept. Engagement outcomes will enable Seqwater to prepare Version 2 of the
Water Security Program to reflect community preferences, and engender community ownership of the region’s water future.
The SEQ community will be engaged through adaptive consultative techniques that provide multiple channels and opportunities for them to have their say. Over time, Seqwater will be asking the community for its views on the criteria used to assess water supply options and potential water futures as outlined in Chapter 8, and drought response plans, including demand management measures such as water restrictions. Seqwater will continue to work closely with the SEQ water service providers and key stakeholders throughout the community consultation process and beyond, to enable an integrated, whole-of-supply system approach.
The engagement approach will be underpinned by independent research that identifies the Water Security Program topics that are of most interest to the community, the desired level of consultation, and any challenges likely to be faced. Later research will test changes in attitudes and understanding, and the level of

Water for life94
acceptance of water security planning as a result of engagement activities. A phased approach to engagement (Figure 10-1) will support the continued development and ongoing implementation of the Water Security Program. It supports the cyclical nature of engagement—from information to consultation to evaluation. Community feedback will be incorporated as the Water Security Program progresses through its regular reviews and reiterations, shaping SEQ’s water future.
10 .2 Version 2 completion
Staging of the first version of the Water Security Program is introduced in Section 1.5.2. Seqwater will be preparing Version 2 concurrently with engagement on Version 1, and will incorporate community feedback into the assessment of options and further refinement of alternative water futures. Activities required to complete Version 2 by early 2017 include:
• review the demand forecast
• conduct further modelling to better understand current operations and how demand management measures may impact the need for and/or timing of contingency supply infrastructure
• conduct further modelling to consider the essential minimum supply volume and develop a planning approach, in collaboration with SEQ water service providers, to deal with the unlikely event that such a level is reached
• conduct further modelling to test different future scenarios such as greater variation to inflow patterns, more severe inflow events, and variable raw water quality
• work with SEQ water service providers and other stakeholders to identify demand management measures that would defer major infrastructure augmentations under predicted growth trends (both region-wide and sub-regionally), and measures that would form part of the region’s response to drought
Figure 10-1 Phased approach to community engagement
PHASE 1
Water Security Program development
PHASE 2
Community consultation
ONGOING
Review and reiterations
(every 5 years)
PHASE 3
Delivery of Water Security
Program
Draft/review the Water Security Program and prepare for community engagement
Undertake research, targeted community consultation
and deliberative engagement (online
and workshops)
Continue community dialogue to inform planning decisions
Collate community feedback and incorporate
into next version of the Water Security Program
• conduct preliminary assessments of potential new infrastructure sites
• review the potential contribution of decentralised schemes
• update the 30-year operations plan
• complete a detailed plan for the management and maintenance of infrastructure
• develop a high level water restrictions schedule in partnership with SEQ water service providers
• finalise drought response options for the SEQ bulk water supply system, including drought response triggers, infrastructure, demand management and operational strategies
• finalise drought response plans (also known as water supply disruption plans) for each standalone community water supply scheme.

South East Queensland’s Water Security Program 2015-2045 95
10 .3 Annual assessment and report
The Water Security Program Guideline formalises assessment and reporting requirements that are already integral to Seqwater’s processes as a responsible water supply authority. The operating environment constantly changes, which means Seqwater monitors and reviews a range of influencing factors, from water consumption
Table 10-1 Annual water security assessment and reporting process
Assessment item Seqwater’s approach
Bulk water supply system status
List the current bulk water supply system assets and their individual capacities.
Describe any changes to the asset base and/or capacities during the year, and the rationale behind those changes.
Readiness of manufactured water assets
Provide information about the status of the desalination and purified recycled water assets, such as current standby mode, actions needed to bring the assets online, and time needed to reach staged production capacities.
Annual water usage and comparison with previous years
Provide a breakdown of the water demand into annual and monthly volumes and per capita usage and present an analysis of water use trends over time.
Annual assessment of the SEQ regional water demand forecast
Conduct an assessment of the long-term demand forecast used for the Water Security Program in conjunction with the SEQ water service providers and using the latest population forecast data from the QGSO.
Report the key findings of the annual demand forecasting assessment, including comparison with past years’ actual consumption, and any changes to the inputs used for the long term SEQ regional demand forecast, e.g. population growth. If the results of the assessment indicate a 10% or greater variation from the current demand forecast, a full review will be triggered. Appendix C contains further information on the assessment process.
SEQ regional water balance
Review the LOS yield and projected date when future demand equals planned supply capacity, i.e. the water balance.
Assess and report on the probabilities of reaching specific storage trigger level percentages.
Relevant drawdown scenarios
Based on the prevailing regional water balance, including the past year’s drawdown scenarios, assess and report on projected storage drawdown scenarios for the coming year.
trends (daily, monthly, annually) and dam inflow patterns in the shorter term, to changes in population, technology, economic, environmental and social factors in the longer term.
Seqwater is required to conduct an annual water security assessment and publish a report containing the outcomes. The aspects to be assessed and Seqwater’s approach to preparing the report each year are summarised in Table 10-1.
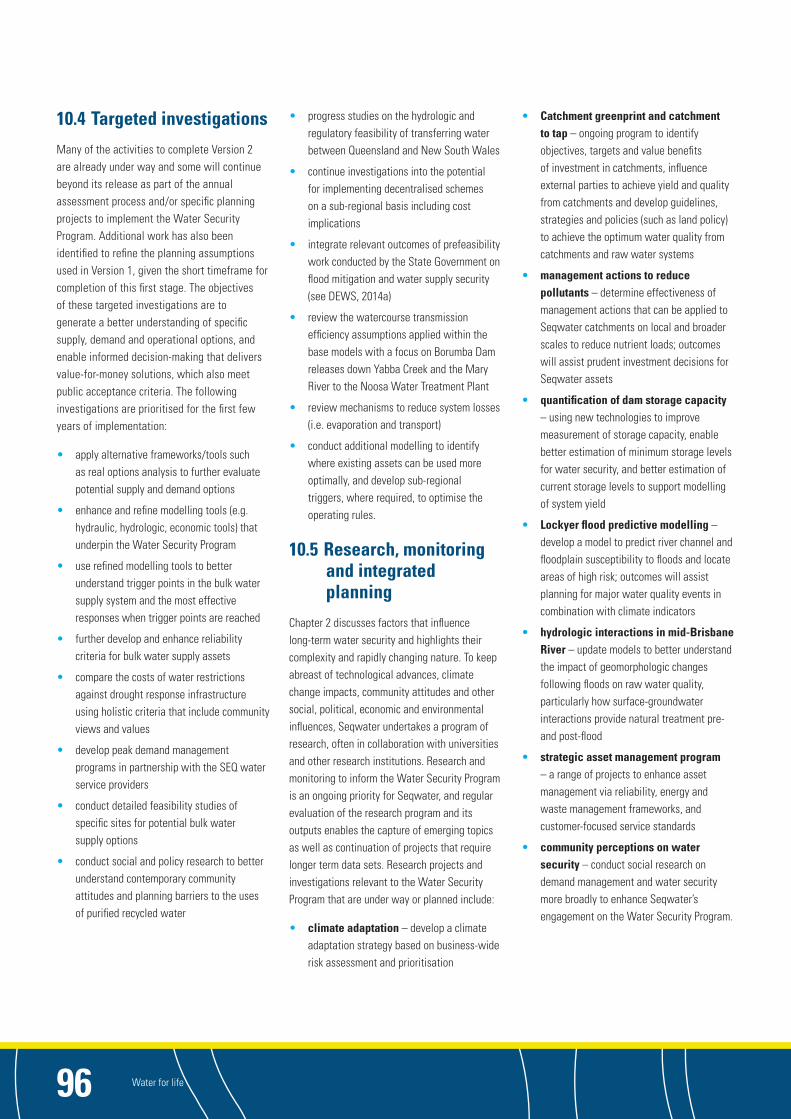
Water for life96
10 .4 Targeted investigations
Many of the activities to complete Version 2 are already under way and some will continue beyond its release as part of the annual assessment process and/or specific planning projects to implement the Water Security Program. Additional work has also been identified to refine the planning assumptions used in Version 1, given the short timeframe for completion of this first stage. The objectives of these targeted investigations are to generate a better understanding of specific supply, demand and operational options, and enable informed decision-making that delivers value-for-money solutions, which also meet public acceptance criteria. The following investigations are prioritised for the first few years of implementation:
• apply alternative frameworks/tools such as real options analysis to further evaluate potential supply and demand options
• enhance and refine modelling tools (e.g. hydraulic, hydrologic, economic tools) that underpin the Water Security Program
• use refined modelling tools to better understand trigger points in the bulk water supply system and the most effective responses when trigger points are reached
• further develop and enhance reliability criteria for bulk water supply assets
• compare the costs of water restrictions against drought response infrastructure using holistic criteria that include community views and values
• develop peak demand management programs in partnership with the SEQ water service providers
• conduct detailed feasibility studies of specific sites for potential bulk water supply options
• conduct social and policy research to better understand contemporary community attitudes and planning barriers to the uses of purified recycled water
• progress studies on the hydrologic and regulatory feasibility of transferring water between Queensland and New South Wales
• continue investigations into the potential for implementing decentralised schemes on a sub-regional basis including cost implications
• integrate relevant outcomes of prefeasibility work conducted by the State Government on flood mitigation and water supply security (see DEWS, 2014a)
• review the watercourse transmission efficiency assumptions applied within the base models with a focus on Borumba Dam releases down Yabba Creek and the Mary River to the Noosa Water Treatment Plant
• review mechanisms to reduce system losses (i.e. evaporation and transport)
• conduct additional modelling to identify where existing assets can be used more optimally, and develop sub-regional triggers, where required, to optimise the operating rules.
10 .5 Research, monitoring and integrated planning
Chapter 2 discusses factors that influence long-term water security and highlights their complexity and rapidly changing nature. To keep abreast of technological advances, climate change impacts, community attitudes and other social, political, economic and environmental influences, Seqwater undertakes a program of research, often in collaboration with universities and other research institutions. Research and monitoring to inform the Water Security Program is an ongoing priority for Seqwater, and regular evaluation of the research program and its outputs enables the capture of emerging topics as well as continuation of projects that require longer term data sets. Research projects and investigations relevant to the Water Security Program that are under way or planned include:
• climate adaptation – develop a climate adaptation strategy based on business-wide risk assessment and prioritisation
• Catchment greenprint and catchment to tap – ongoing program to identify objectives, targets and value benefits of investment in catchments, influence external parties to achieve yield and quality from catchments and develop guidelines, strategies and policies (such as land policy) to achieve the optimum water quality from catchments and raw water systems
• management actions to reduce pollutants – determine effectiveness of management actions that can be applied to Seqwater catchments on local and broader scales to reduce nutrient loads; outcomes will assist prudent investment decisions for Seqwater assets
• quantification of dam storage capacity – using new technologies to improve measurement of storage capacity, enable better estimation of minimum storage levels for water security, and better estimation of current storage levels to support modelling of system yield
• Lockyer flood predictive modelling – develop a model to predict river channel and floodplain susceptibility to floods and locate areas of high risk; outcomes will assist planning for major water quality events in combination with climate indicators
• hydrologic interactions in mid-Brisbane River – update models to better understand the impact of geomorphologic changes following floods on raw water quality, particularly how surface-groundwater interactions provide natural treatment pre- and post-flood
• strategic asset management program – a range of projects to enhance asset management via reliability, energy and waste management frameworks, and customer-focused service standards
• community perceptions on water security – conduct social research on demand management and water security more broadly to enhance Seqwater’s engagement on the Water Security Program.

South East Queensland’s Water Security Program 2015-2045 97
The value of research and monitoring not only lies in improving Seqwater’s ability to make cost-effective investment decisions for water supply, but in positioning Seqwater as a key contributor to integrated planning in SEQ. A range of non-structural measures to enhance liveability, which includes how water is used and valued, have been identified in the literature. Seqwater will work in partnership with the SEQ community to progress non-structural measures which, in many cases, are enablers of certain water supply sources, and require an integrated approach with other planning agencies. Examples of non-structural measures within Seqwater’s sphere of influence are:
• total water cycle solutions – working with regulators, local government, SEQ water service providers and developers on mechanisms that encourage and support cost-effective total water cycle solutions, such as decentralised schemes that provide community benefits beyond water supply
• water governance arrangements – exploring ways to engender clearer ownership of managing water usage and forecasting future demand, given the separation of responsibility between Seqwater, the bulk water supplier and SEQ water service providers as the retailers
• economic regulatory arrangements – optimising economic regulatory arrangements to drive prudent and efficient investment in water supply and demand management and monitoring prices so they are equitable and cost-reflective across the entire water supply chain
• water pricing – considering alternative bulk and retail tariff structures such as two-part tariffs, inclining block tariffs, nodal pricing, or customer water plans linked to levels of service as means of encouraging efficient use and providing customers with greater choice and flexibility in the water purchasing decisions
• funding demand management – exploring innovative mechanisms that facilitate funding of cost-effective demand management measures by its beneficiaries
• cost benefit analysis of water restrictions – researching the financial, social and environmental costs and benefits of water restrictions, developing a model that enables water restrictions to be effectively compared to water supply options and facilitating timely and effective decisions for drought response
• building and plumbing regulations – promoting to regulators the role of these regulations in take-up rates of water efficiency measures and rainwater tanks, given the anticipated higher marginal cost of future bulk water supply options in SEQ
• rating schemes and product labelling – supporting the continuation and expansion of schemes such as WELS, WaterMark and Greenstar to encourage water-efficient buildings, fittings and appliances
• barriers to demand management – identifying and addressing barriers to demand management including examining current institutional arrangements
• metering – promoting the importance of customer metering, sub-metering and tenant billing in driving efficient water use
• catchment land use planning – improving the effectiveness of land use planning and development control mechanisms for protecting water supply catchments
• Water resource planning – optimising water resource planning processes including water trading, environmental flows, and the proportion of water allocated to high and medium priority groups
• Dam safety and flood management – continuing to optimise the management and operation of dams for the multiple priorities of dam safety, flood management and water supply.
Water for life98
10 .6 Five-yearly review
The outcomes of all of the above planning and research will be used to inform full reviews of the Water Security Program. Under the Water Act 2000 the Water Security Program must be reviewed at least every five years beyond 2017. Notwithstanding the above, the Water Act 2000 requires Seqwater to review its Water Security Program earlier if there is a significant change in any matter affecting, or likely to affect, the achievement of the desired LOS objectives for water security. If there are no significant matters that would compromise achievement of the desired LOS objectives, the first major review post-Version 2 in early 2017 will be in 2022.
Community engagement and collaboration with SEQ water service providers and regulatory agencies will be integral to future reviews and updates of the Water Security Program. As presented in Chapter 8, a number of possible portfolios could achieve the LOS objectives as the SEQ population grows. Demand, supply and operational options are presented as a starting point for community discussion. All the various supply augmentation options – desalination, recycled water, groundwater, surface water, and decentralised supplies – are equally open
to consideration and evaluation. Similarly, varying levels of residential and non-residential demand play a critical role in determining when additional supply may be needed. Seqwater is keen to gauge the community’s inclination to proactively manage demand as part of the system performance mix. Operation of the water grid and the development of triggers at the regional and sub-regional levels also need to be refined and adapted to meet community expectations.
The people of SEQ will have a real opportunity to shape their water future. Seqwater will incorporate community views and values to adapting the Water Security Program to meet the region’s needs and aspirations, and deliver water for life.

11. References, Glossary, Acronym
s & Abbreviations
References, Glossary, Acronyms & Abbreviations11

South East Queensland’s Water Security Program 2015-2045 99
Australian Government (2009) Climate Change Risks to Australia’s Coast – a first pass national assessment, Department of Climate Change http://www .environment .gov .au/climate-change/adaptation/publications/climate-change-risks-australias-coasts
Australian Government (2015) Water Efficiency Labelling and Standards (WELS) Scheme, http://www .waterrating .gov .au
Bureau of Infrastructure, Transport and Regional Economics (BITRE), 2013, Population growth, jobs growth and commuting flows in South East Queensland, Report 134, Canberra ACT.
CoMSEQ (2014) Resilient Rivers Initiative – web brochure, December 2014, Council of Mayors South East Queensland, http://www .councilofmayorsseq .qld .gov .au/News/Publications .aspx
CSIRO (2014) The future of water supply – megatrends shaping water supply and security in South East Queensland (report prepared for Seqwater, September 2014), CSIRO Futures and Water for a Healthy Country Flagship.
DEWS (2008) Water Quality Guidelines for Recycled Water Schemes, Department of Energy and Water Supply, State of Queensland, 2013.
DEWS (2013) South East Queensland Water Strategy – Annual Report 2013, Department of Energy and Water Supply, State of Queensland, 2013.
DEWS (2014a) Prefeasibility Investigation into Flood Mitigation Storage Infrastructure – Report for the Brisbane River Catchment, Department of Energy and Water Supply, State of Queensland, 2014.
DEWS (2014b) Planning Guidelines for Water Supply and Sewerage – April 2010 (Chapter 6 amended March 2014), Department of Energy and Water Supply, State of Queensland, 2014.
DEWS (2015) Water Security Program for South East Queensland – guidelines for development (made 7 November 2014 and amended May 2015), Department of Energy and Water Supply, State of Queensland.
NHMRC, NRMMC (2011) Australian Drinking Water Guidelines Paper 6 National Water Quality Management Strategy. National Health and Medical Research Council, National Resource Management Ministerial Council, Commonwealth of Australia, Canberra.
References
NRMMC, EPHC and AHMC (2006) Australian Guidelines for Water Recycling: managing health and environmental risks (phase 1) National Resource Management Ministerial Council, Environment Protection and Heritage Council, and Australian health Ministers Conference, Commonwealth of Australia, Canberra.
Public Health Regulation 2005 (Qld), retrieved from www .legislation .qld .gov .au/Acts_SLs/Acts_SL_P .htm
QFCI (2012) Queensland Floods Commission of Inquiry – Final Report March 2012 – Queensland Floods Commission of Inquiry 2012.
Queensland Government (2009) South East Queensland Regional Plan 2009-2031, State of Queensland (Queensland Department of Infrastructure and Planning) 2009, http://www .statedevelopment .qld .gov .au/regional-planning/seq-regional-plan .html
SEQ-SP (2013) SEQ Water Supply and Sewerage Design and Construction Code, SEQ Water Service Providers, July 2013, www .seqcode .com .au
Urban Water Alliance (2011) Project in focus – Study illuminates end use of water, Urban Water Security Research Alliance Newsletter, Issue 4, March 2011. http://www .urbanwateralliance .org .au/newsletters/2011/march/End_Use_Sub .html
Water Act 2000 (Qld), retrieved from www .legislation .qld .gov .au/Acts_SLs/Acts_SL_W .htm
Water Regulation 2002 via an amendment in July 2014 (Qld), retrieved from www .legislation .qld .gov .au/SL_AsMade/SL_AsMade_ALPHA_2014 .htm
Water Efficiency Labelling and Standards Act 2005 (Qld), retrieved from www .legislation .qld .gov .au/Acts_SLs/Acts_SL_W .htm
Water Regulation 2002 (Qld), retrieved from www .legislation .qld .gov .au/Acts_SLs/Acts_SL_W .htm
Water Supply (Safety and Reliability) Act 2008 (Qld), retrieved from www .legislation .qld .gov .au/Acts_SLs/Acts_SL_W .htm
WSAA (2014) Project Report – Drinking Water Source Assessment and Treatment Requirements: Manual for the Application of Health-based Treatment Targets – Release No. 1, August 2014, Water Services Association of Australia.

Water for life100
Term Definition
accumulated rainfall deficit Difference between rainfall over the period of a drought and the average rainfall
advanced water treatment plant A treatment plant which incorporates additional steps of ozone and/or biologically activated carbon to provide additional treatment, compared to conventional water treatment plants
aquifer An underground body of porous rock that is able to store and yield water.
average day demand Average of daily water demands for the region or each water demand zone over a period of years, months or days. Usually calculated as total demand for the year divided by 365.
blue sky A conceptual term used to describe a list of things that are theoretically possible, but where economic, social, environmental, hydrologic, etc. considerations have not yet been applied.
borefield A collection of bores in a particular location which extract groundwater from one or more aquifers.
bulk water customer SEQ water service provider; or an entity declared under a regulation to be a bulk water customer for this part. Including:
a) Queensland Urban Utilities
b) Unitywater
c) Redland City Council
d) Logan City Council
e) City of Gold Coast
f) Toowoomba Regional Council
g) Stanwell Corporation Limited
Bulk Water Supply Code Bulk Water Supply Code as made by the Minister under section 360M of the Water Act 2000.
bulk water supply system The infrastructure for supplying water to bulk water customers in the SEQ region, including:
a) Baroon Pocket Dam, Cooloolabin Dam, Ewen Maddock Dam, Hinze Dam, Lake Kurwongbah, Lake McDonald, Leslie Harrison Dam, Little Nerang Dam, North Pine Dam, Somerset Dam, Wappa Dam and Wivenhoe Dam
b) the Western Corridor Recycled Water Scheme, and the South East Queensland (Gold Coast) Desalination Plant
c) the main connecting pipelines (the Northern Pipeline Interconnector, Southern Regional Water Pipeline and Eastern Pipeline Interconnector).
bundle A group of activities/actions from single option type (e.g. only demand management options list) that rely on each other to function effectively.
capability The extent of a water storage, supply or treatment infrastructure’s ability to perform under given operating conditions (e.g. raw water containing a nephelometric turbidity unit (NTU) of 0.3)
capacity The performance output of a water storage, supply or treatment infrastructure under specific conditions (e.g. design capacity).
Glossary

South East Queensland’s Water Security Program 2015-2045 101
Term Definition
category A particular type of option (bulk water supply or demand management) Includes:
a) desalination
b) surface water
c) groundwater
d) recycled water – direct potable reuse
e) recycled water – indirect potable reuse
f) recycled water – non-potable reuse
g) decentralised schemes
h) unconventional supplies
i) network augmentation
j) water treatment plant augmentation
k) restrictions
contingency supplies Additional water supplies which will be implemented immediately in response to emergency drought conditions at defined storage levels.
cumulative probability The probability of an event being less than or equal to a given value
dead volume (aka dead storage volume) The volume of water remaining at the bottom of a storage that cannot be accessed for water supply because it is below the level of outlet/release mechanisms. The dead volume is at or below the designated minimum operating level for the storage.
demand management Includes:
a) maintaining demand
b) reducing demand for water
c) increasing the efficiency of water supply works
d) increasing the efficiency of the use of water by end users
e) substituting one water resource for another.
Direct Potable Reuse (DPR) The addition of purified recycled water (i.e. potable water recovered from treated sewage effluent) directly into the potable water supply distribution system.
diurnal consumption profile Cyclic nature of water consumption over a 24-hour period which typically sees consumption peaks in the mornings and evenings, steady consumption during the day and minimal consumption during the night.
drought (Water Supply) A period of time for when the combined bulk water storages within the South East Queensland region are at or below the drought response level.
A prolonged, abnormally dry period when the region receives a deficiency in its water supply, whether atmospheric, surface or groundwater.
drought response An action applied to bring forward commissioning of new infrastructure, system operation, or demand management measures as a result of supply shortfalls in the bulk water supply system, due to the length of drought.
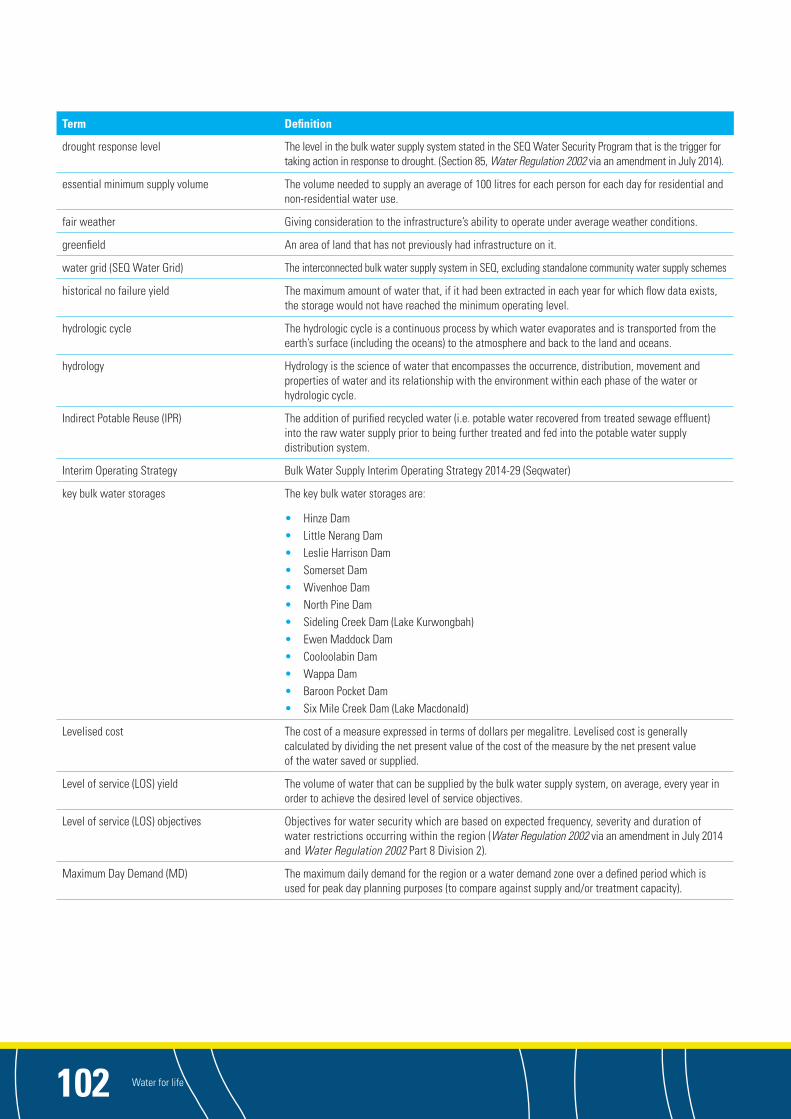
Water for life102
Term Definition
drought response level The level in the bulk water supply system stated in the SEQ Water Security Program that is the trigger for taking action in response to drought. (Section 85, Water Regulation 2002 via an amendment in July 2014).
essential minimum supply volume The volume needed to supply an average of 100 litres for each person for each day for residential and non-residential water use.
fair weather Giving consideration to the infrastructure’s ability to operate under average weather conditions.
greenfield An area of land that has not previously had infrastructure on it.
water grid (SEQ Water Grid) The interconnected bulk water supply system in SEQ, excluding standalone community water supply schemes
historical no failure yield The maximum amount of water that, if it had been extracted in each year for which flow data exists, the storage would not have reached the minimum operating level.
hydrologic cycle The hydrologic cycle is a continuous process by which water evaporates and is transported from the earth’s surface (including the oceans) to the atmosphere and back to the land and oceans.
hydrology Hydrology is the science of water that encompasses the occurrence, distribution, movement and properties of water and its relationship with the environment within each phase of the water or hydrologic cycle.
Indirect Potable Reuse (IPR) The addition of purified recycled water (i.e. potable water recovered from treated sewage effluent) into the raw water supply prior to being further treated and fed into the potable water supply distribution system.
Interim Operating Strategy Bulk Water Supply Interim Operating Strategy 2014-29 (Seqwater)
key bulk water storages The key bulk water storages are:
• Hinze Dam • Little Nerang Dam • Leslie Harrison Dam • Somerset Dam • Wivenhoe Dam • North Pine Dam • Sideling Creek Dam (Lake Kurwongbah) • Ewen Maddock Dam• Cooloolabin Dam • Wappa Dam • Baroon Pocket Dam • Six Mile Creek Dam (Lake Macdonald)
Levelised cost The cost of a measure expressed in terms of dollars per megalitre. Levelised cost is generally calculated by dividing the net present value of the cost of the measure by the net present value of the water saved or supplied.
Level of service (LOS) yield The volume of water that can be supplied by the bulk water supply system, on average, every year in order to achieve the desired level of service objectives.
Level of service (LOS) objectives Objectives for water security which are based on expected frequency, severity and duration of water restrictions occurring within the region (Water Regulation 2002 via an amendment in July 2014 and Water Regulation 2002 Part 8 Division 2).
Maximum Day Demand (MD) The maximum daily demand for the region or a water demand zone over a defined period which is used for peak day planning purposes (to compare against supply and/or treatment capacity).

South East Queensland’s Water Security Program 2015-2045 103
Term Definition
Mean Day Maximum Month (MDMM) Design parameter used in Queensland to reflect demand persistence in response to climatic conditions. Calculated as the highest 30-day moving average daily water demand during a year.
medium level water restrictions Water restrictions imposed on residential and non-residential water use in response to drought, when the level in the bulk water supply system is between the a) drought response level and b) safe minimum storage level. (Water Regulation 2002 via an amendment in July 2014 (Qld) section 85).
minimum operating level The lowest level within storage infrastructure (e.g. reservoir, dam) to which water supplies can be drawn down to (or released) under normal operating conditions. The minimum operating volume for any storage is included in the appropriate resource operations plan and might be referred to as the dead storage level. Water below the minimum operating level cannot be accessed with existing infrastructure.
non-residential water use Water use that is not residential water use (e.g. industry). Commercial and industrial only.
Off-stream storage A water storage structure, e.g. a ring tank, built adjacent to a watercourse into which water is pumped from the watercourse when flows are sufficiently high and stored for later use.
option Individual supply or treatment source, network augmentation or demand management measure that can form part of a portfolio which contributes towards long term water supply requirements.
Options Assessment Framework The framework that is applied to assessing portfolios of options against each other and in the scenario analysis phase to transparently and robustly choose a recommended portfolio.
ozonation In relation to drinking water treatment, ozonation refers to the use of ozone to disinfect and to break down large organic compounds which are then removed with the use of activated carbon. According to the Australian Drinking Water Guidelines (NHMRC, NRMMC, 2011), ‘ozone has a long history of use for disinfection, and for the control of taste, odour and colour’.
planning criteria Assessment parameters that broadly encompass the following areas:
• regulated level of service objectives
• network parameters that dictate capacity requirements (i.e. treatment, transport and network storage)
• water quality and catchments
Specific planning criteria are summarised within Appendix G.
portfolio A group of options (formed from either different or same categories) that together can be implemented in stages and in response to specific triggers to facilitate meeting the long term water supply requirements in South East Queensland.
projected regional average day urban demand The demand, expressed in litres for each person for each day, for residential and non-residential water use that is estimated for the South East Queensland region.
purified recycled water Wastewater that has been treated to a very high standard using the world’s best technology through an advanced water treatment process. The Public Health Regulation 2005 and the Australian Guidelines for Water Recycling for recycled water schemes specify the water quality standards that must be met for recycled water and drinking water.
Regional Stochastic Model The model developed using the Water Headworks Network (WATHNET) computer program, used to determine the system yield based on existing infrastructure being operated in a specified arrangement. Based on stochastically generated inflow sequences derived from historical data.
reliability The ability of the bulk water supply system to provide a reliable supply source in accordance with adopted planning criteria.
residential water use Water use at a residence or for other domestic purposes.
resilience The capability of the bulk water supply system to overcome failures in the system and to maintain reliability by returning quickly to its former state.

Water for life104
Term Definition
resource operations licence A licence issued by the State Government to a water supply scheme operator such as Seqwater. The licence specifies the infrastructure to which it applies, and a range of operating and water sharing rules to meet the flow objectives of the relevant water resource plan.
reticulated A piped water network (as opposed to individual supply sources such as household rainwater tanks).
robustness The degree to which the bulk water supply system can function correctly in the presence of multiple impacts or stressful environmental conditions.
safe minimum storage level The level in the bulk water supply system stated in the SEQ Water Security Program that is the trigger for taking more severe action in response to drought, to minimise the risk of reaching the minimum operating levels (Water Regulation 2002 via an amendment in July 2014 (Qld) section 85).
scenario A coherent, internally consistent and plausible description of a possible future state (e.g. environmental / social change) of the South East Queensland region.
scenario analysis The testing of portfolios to identify those which perform well against different scenarios (e.g. climate change, demand forecast).
sensitivity analysis The testing of portfolios to identify their robustness against external factors which have a wide range of influences (e.g. discount rate).
South East Queensland (SEQ) region Consists of –
(a) The Local Government Areas of the following local governments —
• Brisbane City Council
• City of Gold Coast
• Ipswich City Council
• Lockyer Valley Regional Council
• Logan City Council
• Moreton Bay Regional Council
• Redland City Council
• Scenic Rim Regional Council
• Somerset Regional Council
• Sunshine Coast Regional Council
(b) Any local government area, or part of a local government area, adjacent to a local government area mentioned in paragraph (a) and designated by gazette notice.
The SEQ region also includes Queensland waters adjacent to any of the Local Government Areas mentioned above.
Seqwater Queensland Bulk Water Supply Authority (South East Queensland Water (Restructuring) Act 2007)
SEQ water service provider Bulk water customer (see definition above – customers ‘a’ to ‘e’) which purchases bulk treated water from Seqwater and retails it to individual households and businesses via the urban reticulation system.
Standalone community water supply scheme An urban community supplied by a source that is not connected to the water grid so there is no ready alternative supply.
standpipe A freestanding pipe to which hoses can be connected to access treated water, e.g. for fire-fighting or filling a water tanker.

South East Queensland’s Water Security Program 2015-2045 105
Term Definition
stochastic Of or pertaining to a process involving a randomly determined sequence of observations each of which is considered as a sample of one element from a probability distribution.
strategic reserve A category of water in a water resource plan that is currently unallocated, but able to be allocated for consumptive use under certain conditions, for example, new water supply infrastructure is built by the State to access the water.
structured argument assessment The use of multiple assessment criteria (levelised cost, yield, environmental, social, technical, risk) to describe and assess the trade-offs between options and portfolios.
supply shortfall The inability of the bulk water supply system to meet water demand.
water security objectives Refers to LOS objectives and planning criteria
Water Security Program The bulk water supply authority’s water security program for the SEQ region (section 350, Water Act 2000).
Water service provider Owners of infrastructure related to water storage, treatment or supply as drinking water, including dam, recycled and desalinated raw water sources.
water supply demand zones A demand zone under a bulk water supply agreement to which the bulk water supply authority and the bulk water customer are parties.
yield The average annual volume that can be drawn from a supply source or a supply option to meet a specified demand at a specified probability of occurrence.

Water for life106
Acronym/abbreviation Expanded form
AD Average day
AHD Australian Height Datum
AWTP Advanced water treatment plant
DEWS Department of Energy and Water Supply
DPR Direct potable reuse
DRP Drought response plan
EPI Eastern Pipeline Interconnector
ERP Emergency response plan
FSL Full supply level
GCDP Gold Coast Desalination Plant
HNFY Historical no failure yield
IPR Indirect potable reuse
KBWS Key bulk water storages
kL Kilolitre (one thousand litres)
L/p/day Litres per person per day
L/s Litres per second
LOS Level of service
MD Maximum day
MDMM Mean day maximum month
ML Megalitre (one million litres)
ML/annum Megalitres per annum (year)
MOL Minimum operating level
NFD Northerly flow direction
NPC Net present cost
NPI Northern Pipeline Interconnector
QGSO Queensland Government Statistician’s Office (Department of Treasury)
PRW Purified recycled water
RAT Rapid Assessment Tool
RSM Regional Stochastic Model
SEQ South East Queensland
SFD Southerly flow direction
SPAM Stochastic Portfolio Assessment Model
SPAT Strategic Portfolio Assessment Tool
SRWP Southern Regional Water Pipeline
WCRWS Western Corridor Recycled Water Scheme
WEMP Water efficiency management plan
WTP Water treatment plant
Acronyms and abbreviations

12. Appendices
Appendices12

South East Queensland’s Water Security Program 2015-2045 107
Table of contents
Appendix A: Level of service objectives....................................................................................................................................................... 108
Appendix B: Modelling summary ................................................................................................................................................................. 109
Appendix C: Overview of demand forecast .................................................................................................................................................. 113
Appendix D: Asset summaries ..................................................................................................................................................................... 115
Appendix E: Operational plan and approach ................................................................................................................................................ 118
Appendix F: Drought risk assessment .......................................................................................................................................................... 124
Appendix G: Summary of planning criteria .................................................................................................................................................. 129
Appendix H: Supply and demand options summary .................................................................................................................................... 131
Appendix I: Scenario analysis and sensitivity testing ................................................................................................................................. 142
Appendix J: Standalone communities risk assessment .............................................................................................................................. 145
Appendix K: Standalone communities – drought response plans ............................................................................................................... 159
12 Appendices

Water for life108
Appendix A: Level of service objectives
The desired LOS objectives for SEQ are prescribed in the Water Regulation 2002. The regulation prescribes:
PROJECTED REGIONAL AVERAGE URBAN DEMAND FOR SEQ REGION
1) The bulk water supply system is to be able to supply enough water to meet the projected regional average urban demand.
2) The bulk water supply authority must—
a) work out the projected regional average urban demand in collaboration with the SEQ water service providers, and publicly publish the projection in the way stated in the SEQ water security program; and
b) assess annually whether the projected regional average urban demand or latest projected regional average urban demand is still current, and publicly publish the outcome of the assessment in the way stated in the SEQ water security program.
3) In this section—
projected regional average urban demand means the demand, expressed in litres for each person for each day, for residential and non-residential water use that is estimated for the SEQ region for each year over the next 30 years.
MINIMUM OPERATING LEVELS AND ESSENTIAL MINIMUM SUPPLY VOLUME
1) Each of the following dams will not reach its minimum operating level more than once in every 10,000 years on average—
a) Baroon Pocket Dam;
b) Hinze Dam;
c) Wivenhoe Dam.
2) The bulk water supply system—
a) will be able to supply the essential minimum supply volume; and
b) will not be reduced to being able to supply only the essential minimum supply volume more than once in every 10,000 years on average.
3) In this section—
essential minimum supply volume means the volume needed to supply an average of 100 L for each person for each day for residential and non-residential water use.
BULK WATER DROUGHT SUPPLY
1) The bulk water supply system is to be able to supply enough water so that medium level water restrictions on residential water use—
a) will not happen more than once every 10 years on average; and
b) will not restrict the average water use for the SEQ region to less than 140 L for each person for each day.
2) The bulk water supply system is to be able to supply enough water so that medium level water restrictions on non-residential water use that is incidental to the purpose of a business will not happen more than once every 10 years on average.
3) Medium level water restrictions on residential and non-residential water use are expected to last no longer than one year on average.
4) In this section—
drought response level is the level in the bulk water supply system stated in the SEQ water security program that is the trigger for taking action in response to drought.
medium level water restrictions means water restrictions imposed on residential and non-residential water use in response to drought, when the level in the bulk water supply system is between—
a) the drought response level; and
b) the safe minimum storage level.
safe minimum storage level is the level in the bulk water supply system stated in the SEQ water security program that is the trigger for taking more severe action in response to drought, to minimise the risk of reaching the minimum operating levels.

South East Queensland’s Water Security Program 2015-2045 109
This modelling framework appendix is divided into the following parts:
• an overview of the overall modelling framework that Seqwater has applied to select and assess the proposed augmentation options based on robust information and assessment processes
• a list and brief description of the key models used to provide water supply information about each option and complete the system performance, water security and economic assessments.
PART 1 – OVERALL MODELLING FRAMEWORK
Introduction
The Water Security Program modelling framework provides guidance and a structure to complete the modelling assessments of water security options, in order to meet the various objectives (LOS objectives and planning criteria) and assess trade-offs and other considerations.
The development of Version 1 of the Water Security Program required extensive modelling to be completed to provide input to its following five components:
• a demand management component that identifies demand management measures during normal operations and reasonable reductions in use under restrictions. This information was used as an input for the operations, infrastructure and drought response components
• a systems operations component that identifies the optimal strategy to operate infrastructure (bulk supply point service specification) and determines when the current system capacity is reached for consideration in the infrastructure component
Appendix B: Modelling summary
• a drought response component that identifies triggers for new infrastructure needs under drought conditions for use in the infrastructure component and triggers for demand management measures leading up to, during and exiting a drought
• an infrastructure component that identifies infrastructure needs (new and augmentation of existing assets) including capacity, location and timing. To determine infrastructure needs, a set of asset service specifications at the bulk supply point level are taken into consideration
• an infrastructure management and maintenance component that provides strategic guidance on maintaining the current assets.
Figure B–1 shows an overview of the modelling functions and corresponding information flows across the modelling functions in support of the five core components.

Water for life110
Figure B-1 Seqwater Water Security Program system modelling overview
Water Security Program
Demand management
System operation
Drought response
Infrastructure needs
Infrastructure management & maintenance
Demand model Network model Supply model Financial & economic model
Baseline demand
Business as usual demand
management options
Drought response demand
management options
Infrastructure deferral demand
management options
Desalination options
Surface water options
Ground water options
Recycled water options
Decentralised options
Network augmentation
options
Operational strategy options
demand m
anagement options
baseline demand
contingency
optimal operational strategy sizing & timing
scheduling
water security objective compliancedraw down & contingency au
gmen
tatio
n
options costing
Demand Supply Operational strategy

South East Queensland’s Water Security Program 2015-2045 111
WSP MODEL FRAMEWORK
DFM
Waterhub
WATHNET
MS
Exce
lBiarri optimisation
engine
DSS
RSMH20M
ap w
ater GIS network
modelling
MS
Exce
l
Hydraulic & water
quality modelling
SPAT
&
SPAM
RAT
Baseline most likely demand forecast
Water supply
security
(LOS) information
Storage drawdow
n
information
Storage level
trigger analysis
Grid system supply
capacity analysis
Demand management assessment
Optimal grid operation strategy
Optimised network operation information
Net p
rese
nt co
st inf
ormat
ionOp
tions
econ
omic
asse
ssmen
t
Treat
ment a
nd tr
ansp
ort
syste
m asse
ssmen
tGr
id tra
nsfe
r wat
er
balan
ce ca
lculat
ion
Approach
Considerations during the development of the modelling framework included the following:
• The LOS objectives and planning criteria form the mandatory objectives of the Water Security Program.
• Various operating strategies, infrastructure augmentation, demand management and supply options form the options available to achieve the mandatory objectives.
• The various trade-offs/considerations form the variable outcomes. For example, consider whether a bulk storage augmentation versus a bulk connected pipeline augmentation provides a better long-term water supply security solution considering economic, environmental, social and risk trade-offs.
Seqwater has completed extensive modelling to develop the Water Security Program. For example, minimising water cost while maximising water security and maintaining community values for SEQ water customers, results in objectives that are often conflicting. This means that a single solution does not exist that simultaneously optimises each objective, therefore the Water Security Program incorporates a ‘best fit’ solution.
The methodology adopted by the Water Security Program is interactive. For interactive methods, the process of reaching a solution is iterative and the decision-maker continuously interacts
with the method when searching for the most preferred solution. This interaction will include seeking community feedback on preferences for trade-offs.
PART 2 – MODELLING TOOLS
Seqwater has used seven key models to complete the modelling assessments, as highlighted in Figure B–2 below. This figure presents layered rings showing each model name (e.g. DFM), the platform supporting the model (e.g. Waterhub), the model information generated and the outer ring shows what component of the assessment the information was used to support.
Figure B-2 Seqwater water security modelling framework
Acronym
DFM Demand Forecasting ModuleDSS Decision Support SystemRAT Rapid Assessment ToolRSM Regional Stochastic ModelH20Map H20Map Water SPAT Strategic Portfolio Assessment ToolSPAM Stochastic Portfolio Assessment Model
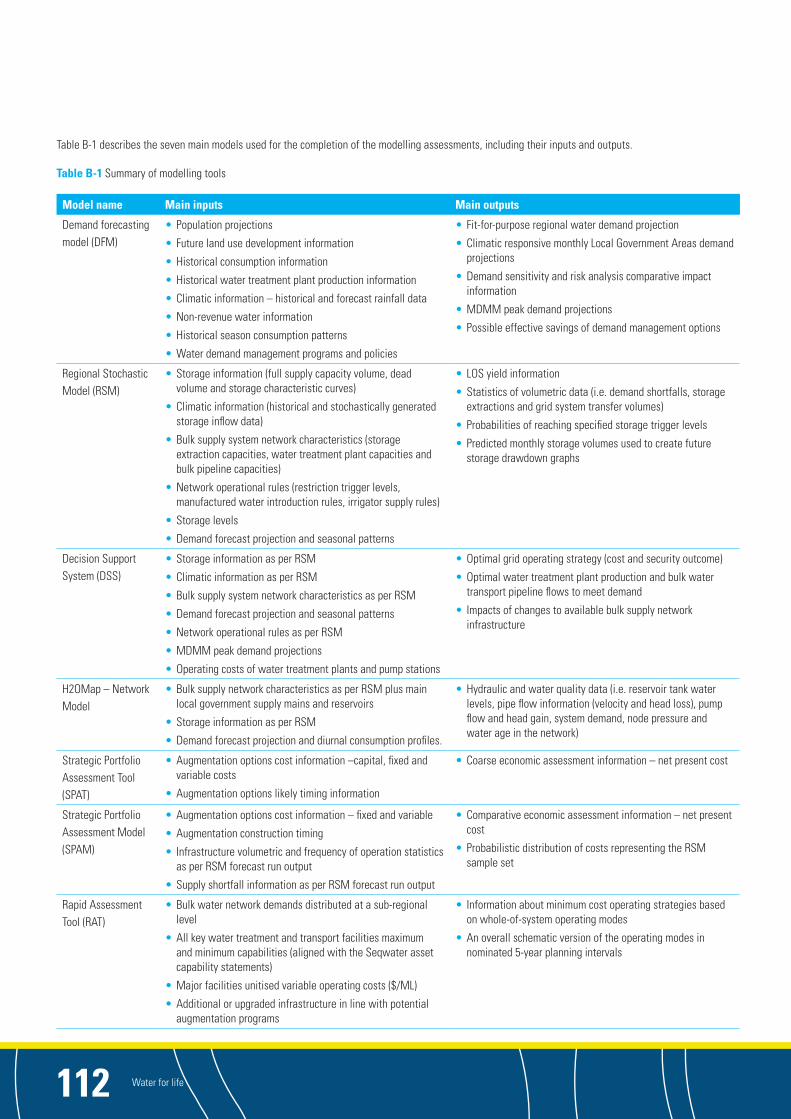
Water for life112
Table B-1 describes the seven main models used for the completion of the modelling assessments, including their inputs and outputs.
Table B-1 Summary of modelling tools
Model name Main inputs Main outputs
Demand forecasting model (DFM)
• Population projections
• Future land use development information
• Historical consumption information
• Historical water treatment plant production information
• Climatic information – historical and forecast rainfall data
• Non-revenue water information
• Historical season consumption patterns
• Water demand management programs and policies
• Fit-for-purpose regional water demand projection
• Climatic responsive monthly Local Government Areas demand projections
• Demand sensitivity and risk analysis comparative impact information
• MDMM peak demand projections
• Possible effective savings of demand management options
Regional Stochastic Model (RSM)
• Storage information (full supply capacity volume, dead volume and storage characteristic curves)
• Climatic information (historical and stochastically generated storage inflow data)
• Bulk supply system network characteristics (storage extraction capacities, water treatment plant capacities and bulk pipeline capacities)
• Network operational rules (restriction trigger levels, manufactured water introduction rules, irrigator supply rules)
• Storage levels
• Demand forecast projection and seasonal patterns
• LOS yield information
• Statistics of volumetric data (i.e. demand shortfalls, storage extractions and grid system transfer volumes)
• Probabilities of reaching specified storage trigger levels
• Predicted monthly storage volumes used to create future storage drawdown graphs
Decision Support System (DSS)
• Storage information as per RSM
• Climatic information as per RSM
• Bulk supply system network characteristics as per RSM
• Demand forecast projection and seasonal patterns
• Network operational rules as per RSM
• MDMM peak demand projections
• Operating costs of water treatment plants and pump stations
• Optimal grid operating strategy (cost and security outcome)
• Optimal water treatment plant production and bulk water transport pipeline flows to meet demand
• Impacts of changes to available bulk supply network infrastructure
H2OMap – Network Model
• Bulk supply network characteristics as per RSM plus main local government supply mains and reservoirs
• Storage information as per RSM
• Demand forecast projection and diurnal consumption profiles.
• Hydraulic and water quality data (i.e. reservoir tank water levels, pipe flow information (velocity and head loss), pump flow and head gain, system demand, node pressure and water age in the network)
Strategic Portfolio Assessment Tool (SPAT)
• Augmentation options cost information –capital, fixed and variable costs
• Augmentation options likely timing information
• Coarse economic assessment information – net present cost
Strategic Portfolio Assessment Model (SPAM)
• Augmentation options cost information – fixed and variable
• Augmentation construction timing
• Infrastructure volumetric and frequency of operation statistics as per RSM forecast run output
• Supply shortfall information as per RSM forecast run output
• Comparative economic assessment information – net present cost
• Probabilistic distribution of costs representing the RSM sample set
Rapid Assessment Tool (RAT)
• Bulk water network demands distributed at a sub-regional level
• All key water treatment and transport facilities maximum and minimum capabilities (aligned with the Seqwater asset capability statements)
• Major facilities unitised variable operating costs ($/ML)
• Additional or upgraded infrastructure in line with potential augmentation programs
• Information about minimum cost operating strategies based on whole-of-system operating modes
• An overall schematic version of the operating modes in nominated 5-year planning intervals

South East Queensland’s Water Security Program 2015-2045 113
Appendix C: Overview of demand forecast
Scenarios 1. Low demand 2. Most likely 3. Upper demand
FACTORS
Population QGSO most likely growth forecast1 QGSO most likely growth forecast1 QGSO most likely growth forecast1
Consumption residential
Observed current use Most likely use Most likely use
+/- adjustment for climatic conditions +/- adjustment for climatic conditions + impact of possible higher change in water use behaviour
+ impact of likely change in water use behaviour2
- impact of structurally efficient new accounts
- impact of structurally efficient new accounts
+ failure of water efficient structural devices
+ failure of water-efficient structural devices
Consider the impact of price increases and demand management initiatives
Consider the impact of price increases and demand management initiatives
Consumption non-residential
Contract demand
Observed current use
+ Forecast for customers under contract (having regard for current and future conditions)
Most likely use
+ impact of likely change in water use behaviour
+ Forecast for customers under contract (having regard for current and future conditions)
Most likely use
+ impact of possible higher change in water use behaviour3
+ Forecast for customers under contract (having regard for current and future conditions)
Network loss Total bulk and water service provider network loss
Total bulk and distributor-retailer network loss
Total bulk and distributor-retailer network loss
USED FOR • Water supply balance assessments
• Determining when infrastructure is needed to meet minimum demand
• Drought response planning (before restriction trigger point)
• Long-term water security sensitivity testing
• Water supply balance assessments
• Determining when infrastructure is needed to meet most likely demand
• Drought response planning (before restriction trigger point)
• Long-term planning preparedness
• Water supply balance assessments
• Determining when infrastructure could be needed to meet upper demand
• Drought response planning (before restriction trigger point)
• Long-term water security sensitivity testing
OUTPUTS Consumption (L/p/day)
Residential/Non-residential
171/91
Residential/Non–residential
185/1004,5
Residential/Non-residential
2006/100
1 The most likely growth forecast is determined by either seeking specific advice from the QGSO about the most likely forecast series that should be used, or by comparing prior observed population growth figures against what was previously forecast to see what series most closely align with the readings.
2 Based on an independent consultant’s review, stable underlying residential per capita demand may take up to five years to occur. Mainly attributable to slow behavioural change in residential water user over time after a heavy restriction period. This expected rebound end point timing is the 2018–19 financial year.
3 For non-residential water use it is not expected that there will be any difference between likely change and higher change in use in SEQ, due to the impacts of significant structural change and increasing water charges.
4 Incorporates reduced power station demand as advised by the electricity producers.
5 Incorporates reduced usage from 10 ML+/annum customers, due to the impact of water efficiency management plans.
6 Based on observed maximum daily water demand readings under permanent water conservation measures and during mid- to late-2013, when the weather was dry and temperatures were above average for a sustained period of time.
Table C-1 Demand forecast – assumptions, uses and outputs

Water for life114
Table C-2 Most likely demand forecast – input factor details
Input factor Input factor source/derivation
Actual annual demand starting point (residential and non-residential)
Measured recorded demand for the last financial year for each Local Government Area.
Demand rebound – residential It is possible that the residents of SEQ will increase their daily water use over time, since the removal of water restrictions and permanent water conservation measures. Water usage patterns in areas in SEQ that were not subjected to restrictions were analysed to provide information of possible rebound consumption levels. It is expected that residential per capita consumption will increase from around 170L/p/day to 185L/p/day. The most likely demand forecast also takes into consideration the lower usage levels of new housing stock with more efficient water-use devices installed.
Demand rebound – non-residential It is expected that the non-residential sector water use will remain fairly stable. This is due to the significant permanent water efficiency changes that were implemented by the sector (in particular the highest water users in SEQ) during the Millennium Drought. It is expected that the non-residential sector consumption will remain stable around 100L/p/day.
Unaccounted for water (system losses) Seqwater needs to produce sufficient water so that enough volume can be supplied by the SEQ water service providers to households and businesses. Some water is lost in the delivery through the vast length of bulk and retail supply pipelines. The overall estimated loss factor for the entire bulk and retail delivery network in SEQ is estimated as being about 11% per annum. The estimated loss volume is accounted for in the non-residential forecast component noted above.
Residential demand growth SEQ population will increase over the 30-year planning period and Seqwater needs to plan for this growth. The population growth profile used for the most likely demand forecast is the medium series population profile from the QGSO.
Non-residential demand growth The growth in the non-residential sector is linked to the population forecasts for SEQ due to the long term 30-year timeframe.
ANNUAL ASSESSMENT OF SOUTH EAST QUEENSLAND DEMAND
Each year the SEQ water service providers will submit their demand forecast to Seqwater. The revised Seqwater-generated demand forecast and the updated SEQ water service provider forecasts will be compared with the agreed forecast generated the prior year. If the demand forecasts do not exceed a 10% threshold variation trigger, then the prior forecast remains applicable for long-term planning with an extension of an additional year.
If the demand forecasts exceed a 10% variation trigger then Seqwater and the SEQ water service providers will review the factors that could be causing the variation. Any updates to the forecast are endorsed by Seqwater and SEQ water service providers.
Seqwater will also conduct an annual assessment to compare the annual demand recorded each year against the forecast demand for the same year. This allows for an assessment of trends in production data and retail billing information. This assessment will commence when retail data that incorporates actual usage over the financial year period becomes available. Outcomes of the assessment will be published on the Seqwater website.
If there are any material differences when comparing the actual demand against forecast demand, an analysis of the key reasons for any divergence will be conducted and the 30-year long-term demand forecast will be updated.
The SEQ water service providers and DEWS will be formally advised of the outcome of the annual assessment of demand. This will incorporate an update on the impact to the water balance position for SEQ, and potential implications for timing of infrastructure needs.

South East Queensland’s Water Security Program 2015-2045 115
Appendix D: Asset summaries
The SEQ bulk water supply system is designed to efficiently treat and transport potable water to bulk water customers for distribution to consumers. The SEQ bulk water supply system assets include:
• catchments and dams (surface water storage assets)
• bores (groundwater source assets)
• the Western Corridor Recycled Water Scheme and the Gold Coast Desalination Plant (manufactured water assets)
• raw water pipelines
• water treatment plants
• bulk transport pipelines
• pump stations
• reservoirs
• water quality management facilities.
Table D-1 Surface water storage assets1
Storage asset Full supply volume (ML) Dead volume (ML) Storage lowering
Little Nerang Dam* 6,705 203 None
Hinze Dam* 310,730 2,180 None
Maroon Dam 44,319 2,190 None
Cedar Grove Weir 1,139 100 None
Bromelton off-stream storage 8,210 735 None
Wyaralong Dam 103,000 260 None
Moogerah Dam 83,765 1,200 None
Leslie Harrison Dam* 24,868 787 Lowered to 53% FSL2
Enoggera Dam 4,567 2,557 None
Somerset Dam* 379,849 4,000 None
Wivenhoe Dam* 1,165,238 4,886 None
Cabbage Tree Creek Dam 26,409 2,652 None
Mount Crosby Weir 3,430 1,800 None
North Pine Dam* 214,302 2,100 Lowered to 90% FSL2
Sideling Creek Dam 14,370 197 Lowered to 60% FSL2
Ewen Maddock Dam* 16,587 542 None
Cooloolabin Dam* 13,800 670 Lowered to 59% FSL2
Wappa Dam* 4,694 75 None
Baroon Pocket Dam* 61,000 4,500 None
Borumba Dam 45,952 1,200 None
Six Mile Creek Dam* 8,018 36 None
Poona Dam* 655 - None
* key bulk water storages
Characteristics of the key bulk water supply system assets (as at late 2014) that supply, produce and deliver most of the treated water volume to meet SEQ demand are summarised in Tables D-1 to D-5.
1 Irrigation, recreation assets and minor weirs are excluded 2 FSL: Full supply level

Water for life116
Table D-2 Groundwater source assets
Water source asset Production capacity (ML/annum)
North Stradbroke Island Borefields 8,500
Bribie Island Borefields 1,387
Table D-3 Manufactured water source assets
Water source asset Production capacity (ML/annum)
Gold Coast Desalination Plant 45,625
Western Corridor Recycled Water Scheme 66,430
Table D-4 Water treatment plant assets1
LGA WTP Rated Capacity (ML/day)2
Connected to water grid
Brisbane City Mt Crosby – East BankMt Crosby – West BankEnoggera
500 250 6.3
City of Gold Coast MolendinarMudgeeraba
145 80
Redland City CapalabaNorth Stradbroke Island
24.2 49.2
Moreton Bay Regional PetrieNorth PineBanksia Beach AWTP
34.5150
4.5
Sunshine Coast Regional Landers Shute AWTPImage FlatEwen Maddock AWTP
14025.214.3
Noosa Shire Noosa AWTP 35
Standalone – not connected to water grid
Somerset Regional LowoodSomersetEskKilcoyLinville
17.50.3
1.3440.4
Redland City Point LookoutAmity PointDunwich
2.83.261.5
Scenic Rim Regional BeaudesertBoonah-KalbarKooralbynRathdowneyCanungra
3.53.31.90.40.4
Moreton Bay Regional Dayboro 1.2
Sunshine Coast Regional KenilworthJimna
0.530.18
1 Does not include recreational water treatment plants 2 Based on median raw water quality and 24-hour production
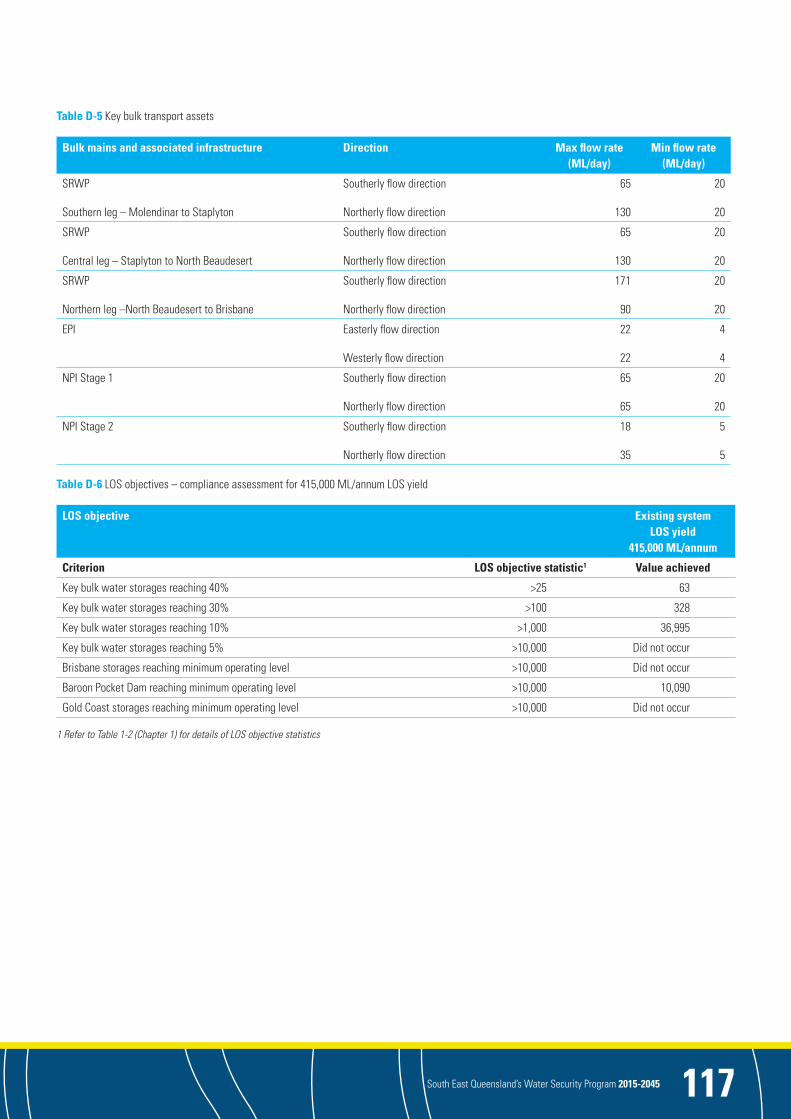
South East Queensland’s Water Security Program 2015-2045 117
Table D-5 Key bulk transport assets
Bulk mains and associated infrastructure Direction Max flow rate (ML/day)
Min flow rate (ML/day)
SRWP
Southern leg – Molendinar to Staplyton
Southerly flow direction
Northerly flow direction
65
130
20
20
SRWP
Central leg – Staplyton to North Beaudesert
Southerly flow direction
Northerly flow direction
65
130
20
20
SRWP
Northern leg –North Beaudesert to Brisbane
Southerly flow direction
Northerly flow direction
171
90
20
20
EPI Easterly flow direction
Westerly flow direction
22
22
4
4
NPI Stage 1 Southerly flow direction
Northerly flow direction
65
65
20
20
NPI Stage 2 Southerly flow direction
Northerly flow direction
18
35
5
5
Table D-6 LOS objectives – compliance assessment for 415,000 ML/annum LOS yield
LOS objective Existing system LOS yield
415,000 ML/annum
Criterion LOS objective statistic1 Value achieved
Key bulk water storages reaching 40% >25 63
Key bulk water storages reaching 30% >100 328
Key bulk water storages reaching 10% >1,000 36,995
Key bulk water storages reaching 5% >10,000 Did not occur
Brisbane storages reaching minimum operating level >10,000 Did not occur
Baroon Pocket Dam reaching minimum operating level >10,000 10,090
Gold Coast storages reaching minimum operating level >10,000 Did not occur
1 Refer to Table 1-2 (Chapter 1) for details of LOS objective statistics

Water for life118
Appendix E: Operational plan and approach
System operation is one of the core influencers of system performance. Chapter 5 deals with the development of operating rules, asset modes of operation, 30-year and medium-term operational planning and opportunities for future improvement.
This Appendix provides further information on the following elements, as a supplement to the main report, and as part of the operational planning framework:
• overview of triggers
• regional trigger development
• sub-regional trigger development
• asset mode of operation
• long-term (30-year) operational planning process.
OVERVIEW OF TRIGGERS
As highlighted in Chapter 5, regional triggers are focused on the need to satisfy longer term LOS objectives, while sub-regional triggers are used to mitigate the impacts of declining water storages, at a sub-regional level, based on an assessment of storage levels at the time and the short- to medium-term climate outlook.
The triggers of operation are usually planned to correspond to specified storage volumes, either as a percentage of the key bulk water storage volume in total (regional triggers) or as a percentage of the volume of an identified storage/s (sub-regional triggers).
In some cases, the operational change can be made in a short timeframe, at the specified trigger level. Where this cannot be achieved, it is possible that a pre-operational trigger will also be identified. This could occur in the following cases:
• for a complex operational change
• where it is planned to undertake re-commissioning of certain assets (this could also include a planning or review phase)
• where it is planned to design, construct and commission new assets (such as drought response infrastructure) before operation can commence. This can include concept planning and obtaining approvals.
REGIONAL TRIGGER DEVELOPMENT
Figure E-1 provides an overview of the process used in the development of regional triggers.
Figure E-1 Development of regional triggers
REGIONAL TRIGGERS
COST BENEFIT ASSESSMENT
Establish cost/benefit (cost/yield relationship, occurence probability, etc)
and refine triggers
ASSESS PERFORMANCE Assess the performance of regional
triggers to meet LOS objectives
KEY ASSUMPTIONS Establish key assumptions (triggers,
production cost, inflow sequences, planned augmentations, constraints, etc)
SYSTEM OPERATION Review current system
operation and plans

South East Queensland’s Water Security Program 2015-2045 119
SUB-REGIONAL TRIGGER DEVELOPMENT
The main objective of sub-regional triggers is to mitigate the impacts of drought at a sub-regional level, therefore these triggers have a short- to medium-term outlook.
Figure E-2 provides an overview of the process employed in the development of sub-regional triggers.
Figure E-2 Sub-regional trigger development process
SUB-REGIONAL TRIGGERS
STORAGE DRAWDOWN ASSESSMENT
Refine sub-regional triggers (desktop assessment) to guide
operation/strategy.
SOURCE PRIORITISATION Establish variable production cost
to prioritise water sources from least to highest cost
KEY ASSUMPTIONS Establish key assumptions
(capital delivery, production cost, inflow sequence, demand, etc)
SYSTEM OPERATION Review current system operation
and plans

Water for life120
As an example, the northern sub-region triggers (operational and pre-operational) for Lake Baroon, Lake Samsonvale, Landers Shute Water Treatment Plant and North Pine Water Treatment Plant are as follows:
Table E-1 Northern sub-region, Lake Baroon and Landers Shute water treatment plants – pre-operational and operational triggers
Lake Baroon storage level
Action Estimated Landers Shute Water Treatment Plant production
100% • Normal operation (i.e. full export to NPI as well as the local service area) with consideration to available annual allocation
100–120 ML/day 1
70% • Reduce export to the NPI to achieve minimum operational requirements in the NPI 100 ML/day 2
60% • Stop all exports to the NPI and operate NPI in northerly direction (i.e. 40 ML/day from North Pine / central sources)
60 ML/day 3
50% • Noosa Water Treatment Plant increases production to supply local Noosa demand and export 15 ML/day into the NPI in a SFD
• Eudlo pump station import of 15 ML/day to Landers Shute supply area from NPI
45 ML/day
1 Historic peak productions 2013–14 have ranged up to 118 ML/day, so normal operation at FSL or near FSL has capacity to be in this range. It should be noted that available resource allocation is of the order of 100 ML/day on average.
2 Observed flow prior to August 2014 (i.e. NPI operating in southerly flow direction (SFD))
3 Observed flow post-August 2014 (i.e. NPI operating in northerly flow direction (NFD))
Table E-2 Northern sub-region, Lake Samsonvale and North Pine Water Treatment Plant – pre-operational and operational triggers
Lake Samsonvale storage level
Action Estimated North Pine Water Treatment Plant production
100% • Normal Operation – NPI operating in a SFD
• Alternative Operation – NPI operating in a NFD (Lake Baroon level less than 60%)
100 ML/day 1
130 ML/day 2
60% (67%3) • Transfer flow from Mount Crosby water treatment plants across to North Pine (i.e. 60 ML/day)
70 ML/day
1 Observed flow/production prior to August 2014 (i.e. NPI operating in the SFD).
2 Observed flow/production post-August 2014 (i.e. NPI operating in the NFD).
3 The capacity of North Pine Dam temporarily decreased from 214,302 ML to 191,459 ML on Monday 8 December 2014. Percentages in brackets reflect this temporary change.
Table E-3 Northern sub-region – pre-operational and operational triggers at lower lake levels
Combined Lake Baroon and Lake Samsonvale storage level
Action Estimated water treatment plant production
40% (44%1) • Review Ewen Maddock and Banksia Beach water treatment plants operational need
-
35% (38%1) • Initiate hot standby operation planning for Ewen Maddock and Banksia Beach water treatment plants (i.e. 6-month notice period begins)
-
25% (27%1) 2 • Operate Ewen Maddock at 11 ML/day and reduce import from NPI by 5 ML/day
Landers Shute Water Treatment Plant 40 ML/day
North Pine Water Treatment Plant 65 ML/day
1 The capacity of North Pine Dam temporarily decreased from 214,302 ML to 191,459 ML on Monday 8 December 2014. Percentages in brackets reflect this temporary change.
2 At this trigger the Banksia Beach Water Treatment Plant should be operational provided sufficient aquifer storage is available.

South East Queensland’s Water Security Program 2015-2045 121
Process
Data/Information
Start/End
Decision point
Legend
Further optimisation and development of sub-regional triggers for all sub-regions will underpin the next iterations of the Water Security Program and will be prioritised according to the water security status of the sub-regions. The optimisation for the northern sub-region will also explore triggers aligned to the proposed existing asset augmentations including the bi-directional augmentation of Aspley pump station and the Paynters Creeks NPI offtake.
ASSET MODES OF OPERATION
Seqwater considers the following modes of operation across its asset portfolio:
• Operational: Under this mode the asset is used on a day-to-day basis so that supply meets demand
• Hot standby: In this mode, an asset can be made available at short notice and is usually linked to the asset being used as a contingency measure as its primary mode of operation. Assets maintained in the hot standby mode of operation are used in response to short-term supply disruptions (to maintain reliability, for example in response to an extreme weather event such as flooding in the catchments) and in responding to drought
• Care and maintenance (cold standby): Care and maintenance mode is where an asset or plant is considered to be in a long-term shutdown with defined maintenance and care considerations to allow for the agreed operational notification periods to be achieved. These assets still contribute to water security for the region, particularly in response to drought
• Decommission/Retire: An asset is considered to be no longer required. The decision to decommission/retire an asset is based on cost consideration and impact on regional water security.
The decision process to establish the preferred mode of operation for an asset or plant is illustrated in Figure E-3.
Figure E-3 Mode of operation – selection process
ASSET MODE OF OPERATION Asset Mode of Operation
Other investment drivers e.g. renewals, cost efficiency
Mode 1: OperationalMode 2: Hot stand-byMode 3: Care & maintenanceMode 4: Retire
New asset
Superseded asset
Option Assessment Identification of alternative solution
to the current asset with an enhanced cost / benefit outcome.
This would include an LOS yield assessment
Financial and non-financial assessment to determine most
cost effective mode of operation between Modes 2 to 4
LOS yield impact
assessment
Is there an alternative operational need i .e .
contingency?
Base load operation
Drought response
Contingent operation
Water Security Program Asset forms part of the strategy to
achieve LOS yield requirements
What is the operational purpose of the asset?
Yes
Yes
No
No
Water for life122
The decision to decommission/retire an asset is ultimately based on the following considerations as part of the process of establishing an asset’s mode of operation:
• need – a review of the asset is undertaken to determine if it has been considered as part of Seqwater’s infrastructure planning (i.e. under the Water Security Program or as required at the master planning level) or if the asset meets an operational need (i.e. redundancy or maintenance). If the asset does not fit into any of these categories it may be considered for decommissioning/retirement.
• alternative solution – at times an alternative solution may be considered, which provides an equivalent outcome to an existing asset, but is considered superior on financial and non-financial grounds. This could be triggered for a number of reasons including renewal and maintenance costs or a proposed augmentation need. The former asset may then be considered for potential decommissioning/retirement
• likely operation – assets that are classified as being required for a drought response or for a contingent operation (i.e. reliability) may also be considered for decommissioning/retirement if their likely future operation is limited.
The process shows that if an asset forms part of the day-to-day operations to supply water (i.e. base load operation), then the asset falls within Mode 1 Operational. However, if the asset is considered to be a contingency measure for reliability and or drought response, then the optimum mode of operation considering a financial and non-financial assessment is determined (i.e. hot standby, care and maintenance and/or retire). The non-financial
assessment is ultimately based on factors including risk, time to reach operational triggers, impacts on system yield, etc. Examples of where this process has been applied include:
• Gold Coast Desalination Plant – hot standby with a notification period of 48 hours
• Western Corridor Recycled Water Scheme – care and maintenance with a 24-month notification period
• Ewen Maddock and Banksia Beach water treatment plants – care and maintenance with a 6-month notification period
• Petrie Water Treatment Plant – proposed decommissioning with an alternative network solution to supply part of Unitywater’s network.
The notification period for assets under various modes of operation influences renewal and maintenance requirements and therefore can reduce operational cost. This is on the basis that any delay of work traditionally required for an operational asset (renewals, maintenance and other operational needs, etc.) can be ultimately accommodated within the agreed notification period so respective assets will be available.
LONG-TERM (30-YEAR) OPERATIONAL PLAN
The long-term (30-year) operational plan will aim to incorporate the outcomes of the Water Security Program (i.e. bulk source augmentations), variable operational cost considerations, bulk system constraints, storage inflows, regional triggers and future demand to establish the operational needs of the water grid.
The process for the development of this plan is presented in Figure E-4. The main variants of the process include the extended duration of the assessment and consideration to inflow sequences in the form of both a fair weather and drought sequence. Regional triggers for this assessment are generally drawn from the most recent annual operating strategy or from a direct update of triggers as part of this process.
The selection of the inflow sequences is based on a stochastic inflow sequence set developed for the purpose of assessing probability. The description of the inflow sequences is as follows:
• fair weather –a fair weather inflow is considered to be a 50th percentile inflow from the regional stochastic inflow data. When modelled, this inflow sequence will outline the system operation for when storage levels are high resulting in least-cost system operation.
• drought – for the purpose of the drought inflow sequence, an inflow representing a drought situation is considered. To date, the calculation has been based on a five-year duration 1:1,000 event repeated to form six discrete events over a 30-year duration to demonstrate how the water grid responds under drought conditions with increasing demand. A 1:10,000 inflow event will be considered under future versions of the Water Security Program in a similar manner. Under these conditions water storages are stressed resulting in the system operating in a water security mode.
The assessment outlines water production, operational cost, various modes of operation, informs medium-term operational planning and identifies the likely need for manufactured water production over time within the model over the 30-year duration for both fair weather and drought conditions.

South East Queensland’s Water Security Program 2015-2045 123
Figure E-4 Long-term (30-year) operational planning process
LONG TERM OPERATIONAL
PLAN
SYSTEM ANALYSIS Review modelling output and establish long-term
operational plan
ASSESS LONG-TERM SYSTEM OPERATION Optimisation modelling
KEY ASSUMPTIONS Establish key assumptions
(triggers, production cost, inflow sequences, planned augmentations, etc)
SYSTEM OPERATION Review current and potential
sub-regional triggers

Water for life124
Appendix F: Drought risk assessment
Drought risk assessment modelling was undertaken to assess the probability that a drought will occur within the next 5, 10 or 20 years. The information provides:
• a broad overview of how the level of risk is calculated
• the probability that a drought will occur within the next 5, 10 or 20 years.
CALCULATING THE LEVEL OF RISK
As discussed in Section 6.3, the level of risk that drought response levels will be reached is calculated using the statistics obtained from RSM modelling.
The level of risk depends on the:
• probability of the event occurring
• consequences or implications of the event occurring.
While no formal classification has been made as to what constitutes low, medium or high risk levels, an example of a high risk level would be an assessment showing the probability of reaching minimum operating level within two years as 1%.
The risk level on the sub-regional scale is also assessed as it may differ from that on the regional scale, due to differences for example in demand and/or rainfall patterns.
Potential changes to the water supply are also assessed for their ability to affect the level of risk posed by drought.
At some stage storage levels will decline to the point where the probability of reaching drought response levels is assessed as high risk. Drought conditions cannot be avoided, which is why drought response measures are in place so the risk of running out of water is negligible.
ASSESSMENT OF RISK THAT DROUGHT WILL OCCUR
The probability of the key bulk water storages, Gold Coast system (Hinze and Little Nerang dams), Brisbane system (Somerset and Wivenhoe dams) and Baroon Pocket Dam reaching trigger levels over the next 20 years is shown in Tables F-1 to F-4 below. As more time elapses since the initial storage levels, the information on the cumulative probability of reaching these levels becomes more uncertain. In addition, changes over time will be required in the operation and possibly infrastructure of the system to meet demand and possibly respond to droughts which have not been accounted for in the modelling.
As Leslie Harrison Dam is being maintained at a lower level temporarily, the cumulative probability of reaching trigger levels is very high, i.e. a 100% probability of reaching 60% capacity within the next year. Because of this, the cumulative probabilities for this storage have not been reported.
Table F-1 below shows the cumulative probability of the key bulk water storages reaching 60%, 40% and 30% capacity over the next 20 years. Over the next 10 years the cumulative probability of reaching 60% is above 20% but as the consequences of reaching 60% are not major, the level of risk is relatively low. The consequences of reaching 40% and 30% are greater than for 60%. However, as the probability of reaching these triggers is very low so is the level of risk.
Table F-1 Cumulative probability of the key bulk water storages reaching trigger levels
Within (years) Probability of reaching 60%
Probability of reaching 40%
Probability of reaching 30%
5 7% 0.35% 0.02%
10 22% 2.9% 0.3%
15 38% 6.7% 1.0%
20 53% 11.3% 2.0%

South East Queensland’s Water Security Program 2015-2045 125
Tables F-2 to F-4 show the cumulative probability of the sub-regions reaching 60%, 40% and 30% over the next 20 years. The Brisbane system has the highest chance of reaching 40% over the next 20 years; Baroon Pocket Dam has the highest probability of reaching 30%; and the Gold Coast’s system probability is the lowest for all triggers.
Table F-2: Cumulative probability of the Brisbane system storages reaching trigger levels
Within (years) Probability of reaching 60% Probability of reaching 40% Probability of reaching 30%
5 9% 0.54% 0.04%
10 25% 4.1% 0.45%
15 42% 8.8% 1.5%
20 56% 14.9% 2.95%
Table F-3 Cumulative probability of the Gold Coast system storages reaching trigger levels
Within (years) Probability of reaching 60% Probability of reaching 40% Probability of reaching 30%
5 5% 0.15% 0.01%
10 18% 1.8% 0.2%
15 33% 4.7% 0.6%
20 51% 8.8% 1.6%
Table F-4 Cumulative probability of the Baroon Pocket Dam reaching trigger levels
Within (years) Probability of reaching 60% Probability of reaching 40% Probability of reaching 30%
5 7% 0.30% 0.03%
10 22% 2.7% 0.5%
15 41% 7.0% 1.8%
20 62% 13.4% 3.8%

Water for life126
Exceedance percentile curves are shown for the key bulk water storages and the sub-regions in Figures F-3 to F-6. Storage exceedance curves plot the probability that a particular level will be exceeded at the date at which the level occurred. There is for example a 50% probability that storage levels will be above the 50th percentile exceedance curve at any time assuming initial storage levels of 95.9%.
As the levels for the 99.99th percentile exceedance curve are likely to be the lowest levels reached and no change in operation has been assumed for 20 years, the exceedance curves have only been extended to 10 years.
The 99.99th percentile exceedance curves for the key bulk water storages and the Gold Coast storages do not drop significantly below 20% over the 10-year period. Baroon Pocket Dam is at greater risk of reaching levels approaching 10% over the next 10 years.
Figure F-2 Comparison of cumulative probability of reaching 30%
Figure F-3 Key bulk water storage level exceedance curves – 10 years
Figures F-1 and F-2 compare the cumulative probability of reaching 40% and 30% within 20 years for the above regions and storages. These again show that the Brisbane system is more likely to reach 40% over the next 20 years while Baroon Pocket Dam is more likely to reach 30%.
0.0%
0.5%
1.0%
1.5%
2.0%
2.5%
3.0%
3.5%
4.0%
4.5%
Cum
ulat
ive
prob
abili
ty o
f sto
rage
s re
achi
ng 3
0%
Brisbane system Key bulk water storages Baroon Pocket dam Gold Coast
Mar-15
Nov-15
Jul-1
6
Mar-17
Nov-17
Jul-1
8
Mar-19
Nov-19
Mar-23
Nov-23
Jul-2
4
Mar-25
Nov-25
Jul-2
6
Mar-27
Mar-31
Nov-31
Jul-3
2
Mar-33
Nov-33
Jul-3
4Ju
l-20
Mar-21
Nov-21
Jul-2
2
Nov-27
Jul-2
8
Mar-29
Nov-29
Jul-3
0
0%
10%
20%
30%
40%
50%
60%
70%
80%
90%
100%
Key
bulk
wat
er s
tora
ge le
vel
99th percentile (1:100) 99.9th percentile (1:1,000) 99.99th percentile (1:10,000) Minimum operating level
Feb-15
Jun-1
5Oct-
15Feb
-16Ju
n-16
Oct-16
Feb-17
Jun-1
7Feb
-19Ju
n-19
Oct-19
Feb-20
Jun-2
0Oct-
20Feb
-21Feb
-23Ju
n-23
Oct-23
Feb-24
Jun-2
4Oct-
24Oct-
17Feb
-18Ju
n-18
Oct-18
Jun-2
1Oct-
21Feb
-22Ju
n-22
Oct-22
0%
2%
4%
6%
8%
10%
12%
14%
16%Cu
mul
ativ
e pr
obab
ility
of s
tora
ges
reac
hing
40%
Brisbane system Key bulk water storages Baroon Pocket Dam Gold Coast
Mar-15
Nov-15
Jul-1
6
Mar-17
Nov-17
Jul-1
8
Mar-19
Nov-19
Mar-23
Nov-23
Jul-2
4
Mar-25
Nov-25
Jul-2
6
Mar-27
Mar-31
Nov-31
Jul-3
2
Mar-33
Nov-33
Jul-3
4Ju
l-20
Mar-21
Nov-21
Jul-2
2
Nov-27
Jul-2
8
Mar-29
Nov-29
Jul-3
0
Figure F-1 Comparison of cumulative probability of reaching 40%

South East Queensland’s Water Security Program 2015-2045 127
Figure F-4 Brisbane system storage level exceedance curves – 10 years
Figure F-5 Gold Coast system storage level exceedance curves – 10 years
Figure F-6 Baroon Pocket Dam storage level exceedance curves – 10 years
0%
10%
20%
30%
40%
50%
60%
70%
80%
90%
100%Br
isba
ne s
yste
m c
ombi
ned
stor
age
leve
l
99th percentile (1:100) 99.9th percentile (1:1,000) 99.99th percentile (1:10,000) Minimum operating level
Feb-15
Feb-16
Feb-17
Feb-20
Feb-21
Feb-24
Feb-25
Feb-18
Feb-19
Feb-22
Feb-23
0%
10%
20%
30%
40%
50%
60%
70%
80%
90%
100%
Gold
Coa
st d
ams
com
bine
d st
orag
e le
vel
99th percentile (1:100) 99.9th percentile (1:1,000) 99.99th percentile (1:10,000) Minimum operating level
Feb-15
Feb-16
Feb-17
Feb-20
Feb-21
Feb-24
Feb-25
Feb-18
Feb-19
Feb-22
Feb-23
0%
10%
20%
30%
40%
50%
60%
70%
80%
90%
100%
Baro
on P
ocke
t dam
sto
rage
leve
l
99th percentile (1:100) 99.9th percentile (1:1,000) 99.99th percentile (1:10,000) Minimum operating level
Feb-15
Jul-1
5Dec-
15
May-16
Oct-16
Mar-17
Aug-17
Jan-1
8Feb
-20Ju
l-20
Dec-20
May-21
Oct-21
Mar-22
Aug-22
Feb-25
Jun-1
8
Nov-18
Apr-19
Sep-19
Jan-2
3Ju
n-23
Nov-23
Apr-24
Sep-24

Water for life128
INFLUENCE OF THE WESTERN CORRIDOR RECYCLED WATER SCHEME
Results of the assessment of the current operating strategy’s compliance with the LOS objectives shown in Table F-5 indicate that it is likely to continue to comply for another 12 years as a demand of 400,000 ML/annum passed all the LOS objectives. This demand is projected to be reached by about 2027.
Without the WCRWS, an annual demand of 390,000 ML passed the LOS objectives, however even at this lower demand the drought risk is much greater as there is a higher frequency of the key bulk water storages reaching 30% and 5% and the Brisbane system and Baroon Pocket Dam reaching minimum operating level (MOL). Supply shortfalls are also much higher without the WCRWS, representing about 10% of the total demand. As these shortfalls are occurring when the storages are below 10% and demand is already being restricted by 30%, the total restriction in demand when these shortfalls occur is 40%.
Table F-5 LOS objectives – compliance with and without WCRWS
LOS objective Current operating with WCRWS
Current operating strategy without
WCRWS
LOS yield 400,000 390,000
Criteria Complying ARI* Value achieved Value achieved
Medium level restrictions
>10 47 52
Essential minimum supply volume
>10,000 >100,000 22,197
Brisbane storages MOL
>10,000 >100,000 36,995
Baroon Pocket Dam MOL
>10,000 13,875 11,100
Gold Coast storages MOL
>10,000 >100,000 >100,000
* ARI = average recurrence interval
With existing infrastructure in place and the high storage levels, the current probability of reaching drought response levels over the next five years is very low and over the next 10 years is low. Ongoing monitoring of risk levels is required due to the heavy dependence of the probability of reaching drought response levels on initial storage levels. This level of security provides Seqwater with adequate time to plan effective drought response options for Version 2 of the Water Security Program.

South East Queensland’s Water Security Program 2015-2045 129
BULK WATER SUPPLY SYSTEM PLANNING
Adopted planning criteria
Planning criteria are a set of assessment parameters, which enable a balance between the requirement for a safe, secure, reliable, quality water supply and the desire for this service to be provided at minimal cost.
Table G-1 Preliminary planning criteria
Elements Planning criteria Notes
Average day (AD) demands 185 litres per person per day (L/p/day) residential
285 L/p/day total
Sensitivity assessments to be undertaken to determine the impact of any significant departures from this base case demand
Sustained peak persistence demands
Mean day maximum month (MDMM)
1.3–1.5 x AD
Based on demand zone analysisConsistent with Planning Guidelines for Water Supply and Sewerage (DEWS, 2014b) and SEQ Water Supply and Sewerage Design & Construction Code (SEQ-SP, 2013)
Short term peak persistence demands
Maximum day (MD)
1.6–1.9 x AD
Based on demand zone analysis
Consistent with Planning Guidelines for Water Supply and Sewerage (DEWS, 2014b)) and SEQ Water Supply and Sewerage Design & Construction Code (SEQ-SP, 2013)
Diurnal consumption profiles As a minimum residential and commercial water consumption patterns
Considered on a needs basis to support detailed operational and infrastructure planning outcomes
Large connected water treatment plants
(>100 ML/day)
23-hour availability
24/7 production
Demonstrated cost-effective staged integration between water treatment and network in line with the proposed water quality specification and at a low risk for water quantity outages
New water treatment plants
Desalination plants
Medium connected water treatment plants (10-100 ML/day)
20-hour availability
Production to meet demandSmall and unconnected water treatment plants
Bulk transport mains Gravity mains to transport MDMM over 24 hours System to be configured and operated above minimum flow to achieve
water quality objectivesPumped mains to transport MDMM over 20 hours
Bulk transport pump stations MDMM over 20 hours Standby pump capacity to match the largest single unit pump capacity
The application of planning criteria is an efficient way of assessing system performance and capability to inform future investment; however, they are not intended to preclude the consideration of innovative options or to diminish the goal of least-cost planning in promoting efficiency. Actual infrastructure delivery will still be underpinned by appropriate planning investigations and developing effective
investment triggers so all decisions meet the underlying service objectives in a demonstrably prudent and efficient manner.
In line with this requirement, the preliminary planning criteria provided in Table G-1 have been identified as being critical to progress integrated master planning and associated asset investment planning activities.
Appendix G: Summary of planning criteria

Water for life130
Elements Planning criteria Notes
Regional interconnector pipelines
Maximum operation in line with design basis
System to be configured and operated above minimum flow to achieve water quality objectives
Pump design basis 23 hours/day Standby pump capacity to match the largest single unit pump capacity.
Serve as MDMM mains for distribution along regional interconnector corridor
Fully metered, flow-controlled off takes to SEQ water service providers’ systems
A future assessment to be made as to appropriateness of the regional interconnectors for this purpose
Bulk network reservoirs
3 x (MD–MDMM) < Operating protocol effective reservoir operating volume
For direct service zone only
Maintain supply above operating protocol minimum operating level after 3 x MD
Minimum desired reservoir operating levels to provide the initial basis for the assessment bulk water supply network reservoir requirements.
Regional interconnectors reservoirsNo allowance for direct reservoir storage for demand zones
In accordance with design specifications
Extended period analysis for bulk system transport and treatment
3 x MDMM demandsReservoir initial levels to correspond to top operating level and reservoirs to have a net positive inflow each day
Extended period analysis for bulk system transport, treatment and reservoir storage
3 x MDMM demands followed by 3 x MD demands
Reservoirs cannot empty below minimum operating level
Water quantityRisk of outage to be planned as low risk under normal operation (i.e. non-contingency modes)
Aligned with consequence and probability parameters under Seqwater risk management system
LOS objectivesBased on nominated frequency, severity and duration of water restrictions across the region
As defined in the Water Regulation 2002, Part 8 Division 2, as amended
Water quality
Australian Drinking Water Guidelines (NHMRC, NRMMC, 2011) and health-based treatment targets for pathogens developed by Water Services Association of Australia (WSAA, 2014)
Current and emerging chemical and physical water quality parameters representing a low water quality risk approach, consistent with the catchment to tap philosophy
CatchmentInvestigations to address extreme and high risks currently in progress
Evaluation studies of efficacy and efficiency including risk mitigation and benefit analysis will be undertaken so the natural asset may better support reducing source water risks prior to the treatment process
Of note is that in addition to the planning criteria nominated in Table G-1, there are additional constraints on the bulk water supply system that must be considered and which drive operational outcomes (e.g. raw water bulk water allocations/entitlements).

South East Queensland’s Water Security Program 2015-2045 131
Appendix H: Supply and demand options summary
Seqwater has developed a tailored options assessment framework to strategically assess a range of water supply and demand options with the goal of achieving solutions that meet the requirements of the LOS objectives and provide regional water security.
The options assessment framework has been designed to allow options to be assessed against qualitative and quantitative criteria, as well as through scenario and sensitivity analyses. A key component of this exercise is a hydro-economic assessment to provide the LOS yield and associated economic impacts of options and groups of options over the assessment period.
The hydro-economic modelling, coupled with the assessment against social, environmental and other criteria culminate in a ‘structured argument’ approach in order to identify a portfolio of options to achieve water security for SEQ. This would form the basis for engaging with the community to shape the water future of the region.
The assessment framework needs to robustly and comprehensively demonstrate each option’s ability to meet the water supply needs of SEQ over the next 30 years. As such, assessment gateways were incorporated into the framework, which defined how options were assessed and how they progressed through the assessment framework.
The assessment framework has been designed to provide the flexibility for Seqwater to respond in the most efficient and cost-effective way to emerging supply requirements.
This appendix outlines further detail on the assessment gateways within the Water Security Program’s options assessment process.
Table H-1 provides a summary of the assessment gateways used for both supply and demand options.

Water for life132
Table H-1 Summary of assessment gateways
Gate Purpose Criteria Assessment method Supporting documents/tools
Number of options assessed
Number of options progressed
DEMAND
A Preliminary review and coarse screening
Social, economic and environmental criteria
Demand management network – value judgement informed by the available data and demand management network experience
Queensland Water Commission coarse screening tool
177 85
B Review of costed options and potential demand savings
$8/kL (the levelised cost criteria used to remove inefficient supply options)
Demand management network
Cost effectiveness analysis and value judgement informed by the available data and demand management network experience
Demand program model
85 (including
37 bundled options)
80
C Demand drought response portfolio -costed options and potential demand savings:
To understand the combined potential costs and savings of a bundle of demand drought response options
Drought response principles
Logical flow of measures from voluntary through to regulated as the regional dam level declines
Staggered resourcing requirements for the SEQ water service providers
Potential drought infrastructure triggers
Possible community perception (note this will be tested through the community engagement process)
Demand management network – value judgement informed by the available data and demand management network experience
Drought response principles
51 Business as usual options
35 Drought response options
11 infrastructure deferral options
SUPPLY
1 Coarse screening 1. Ability to generate yield estimate AND
2. Levelised cost <$8/kL
1. Mandatory criteria: Yes/No
2. Cost effectiveness analysis
Graph of levelised cost
131 110
2 Comparative options assessment
1. Meet Water resource plan objectives (surface water only) AND
2. Social, environmental, risk criteria
1. Mandatory criteria: Yes/No
2. Structured argument*
Options summaries
Summary table of qualitative assessment
110 70

South East Queensland’s Water Security Program 2015-2045 133
Gate Purpose Criteria Assessment method Supporting documents/tools
Number of options assessed
Number of options progressed
3 Screening 1. Too small to assess (LOS yield <7,500 ML/annum) OR
2. Reserved for drought (temporary solutions) OR
3. Insufficient information and further assessment required (e.g. hydrology for interregional transfers, sub-regional demand reduction i.e. decentralised schemes) OR
4. Already included as an efficient existing system augmentation
Yes/No RSM 70 41
4 Options screening Best in sub region
DPR $2.00/kL (Capex)
IPR $3.00/kL (Capex)
Option consolidation/consistency review (e.g. remove water treatment plant upgrades with no additional yield)
Sub-regional cost effectiveness analysis
Value judgement informed by the available data
Individual assessments of best in sub-regional (North/South/Central)
Graphs
41 26
5 Inefficient option removal
Cost-efficient contribution to LOS Clear judgement call on a small number of options
RSM 26 22
6 Inefficient staging removal (sequencing contribution)
Contribution to LOS as first augmentation <40,000 ML/annum
Net present cost (NPC)
Ability to meet planning objectives
Yes/No
Cost effectiveness analysis – preliminary
Yes/No
RSM
SPAT
RAT
22 13
* Structured argument: a systematic qualitative assessment against defined criteria (excluding weighting of criteria).
Water for life134
GATE A – DEMAND OPTIONS PRELIMINARY REVIEW AND COARSE SCREENING
A blue-sky list of demand management options was developed by Seqwater and SEQ water service providers by assessing current experience together with experience gained during the Millennium Drought, a jurisdictional review, current demands, and a Millennium Drought restrictions review. This process produced 177 demand management options for consideration.
The options were assessed in a preliminary review, which aimed to remove duplication, consolidate options where appropriate and clarify the detail of options. The options were screened against potential savings, and social, economic and environmental criteria. Options were removed due to cost, available technology, learnings from the Millennium Drought and current water reform. Some options excluded at this stage of the assessment can be considered in future versions of the Water Security Program should influences change.
Following the preliminary review and coarse screening, the remaining options included:
• 37 bundled options
• 25 non-costed options (activities of minimal cost, which focused on building critical relationships required to achieve effective implementation of future demand management options)
• 23 options that were set aside for future consideration (further research and assessment required and therefore to be considered in future revisions of the Water Security Program).
Options removed included water efficiency campaigns and education programs (i.e. industry-specific education programs):
• web-based or app-based options (i.e. water efficiency videos on the website)
• rebates
• water efficiency programs (e.g. in hospitals)
• policy or regulatory options (i.e. introducing new regulations that require mandatory specific water-efficient requirements to be incorporated into new residential, commercial and industrial developments).
GATE B –REVIEW OF DEMAND OPTIONS
Seqwater assessed the potential water savings of the 37 bundled options to derive a levelised cost (cost per unit volume of water saved). These are only costs to implement the option, and don’t include any broader economic costs to the community or willingness to pay considerations.
Any option with a higher cost than the marginal cost of desalination was removed at this gate. The $8/kL levelised cost was chosen as an appropriate benchmark against which supply options were compared and if inefficient, removed from further assessment. Demand management options with a higher cost than inefficient water supply options were not considered effective. A total of five options were removed:
• Permanent water conservation measures
• Pre-drought water restrictions
• Landscaper water efficiency training programs
• Irrigation workshops
• Irrigation guide development for the non-residential sector.
The potential savings for each option were calculated through a demand program model, using a series of assumptions such as estimated take-up rate and volume savings per activity. For example, the replacement of a 20 L/minute shower rose with a 9 L/minute water-efficient shower rose would save approximately 44 L per four-minute shower. Estimates of take-up rates were based on a percentage of remaining homes assumed to be without a water-efficient shower rose. This was based on data obtained from Home WaterWise, State Government rebate programs, and the Climate Smart program, coupled with development requirements for new homes. The demand program model calculates a possible saving for a device within those parameters. By grouping the measures and processing them through the model, potential savings were counted once, i.e. there was no double counting of potential demand savings.
GATE C – GROUPING OF DEMAND OPTIONS
To determine the appropriate use and timing of the preferred demand management options, the options were grouped into one of three demand management categories:
• business as usual (options designed to achieve system efficiency and generally already in place such as leakage management)
• infrastructure deferral (options designed to delay major investment in infrastructure solutions)
• drought response (options implemented when water security is declining).
This grouping resulted in 51 business as usual options, 35 drought response options and 11 infrastructure deferral options. Examples of the preferred options are listed in Table H-2.

South East Queensland’s Water Security Program 2015-2045 135
Table H-2 Sample of preferred demand management options
Preferred demand management option Demand management category
Residential outdoor water use efficiency program with relevant industry association. Low level consistent messaging using existing communications methods with the community (Stage one, estimated 100-70% regional water supply)
Business as usual
Residential outdoor water use efficiency program with relevant industry association. Increased outdoor water efficiency messaging (Stage two, estimated 70-50% regional water supply)
Business as usual
Residential outdoor water use efficiency (excluding gardening) messaging. Low level consistent messaging using existing communications methods with the community (Stage one, estimated 100-70% regional water supply)
Business as usual
Residential outdoor water use efficiency (excluding gardening) messaging. Increased outdoor water efficiency (Stage two, estimated 70-50% regional water supply)
Business as usual
Residential indoor water efficient messaging. Low level consistent messaging using existing communications methods with the community (Stage one, estimated 100-70% regional water supply)
Business as usual
Residential indoor water efficient messaging. Increased indoor water efficiency messaging (Stage two, estimated 70-50% regional water supply)
Business as usual
Non-residential water audits Business as usual
Non-residential water audits available on the internet with customers advised they are available as part of standard customer relations activities
Business as usual
Joint messaging with Energex re peak time demand for showering, dishwashers etc (i.e. use both water and energy).
Deferral of infrastructure (but will also be of benefit in drought)
General messaging with Energex even without peak times Deferral of infrastructure (but will also be of benefit in drought)
Joint messaging with Energex about peak demands in the heat of summer Deferral of infrastructure (but will also be of benefit in drought)
Retrofit-style service (exact make-up of product will depend on the technology available at the time). Deferral of infrastructure and drought response
Rebate for a leak detection device and installation. Note costs only include the device and rebate program. Deferral of infrastructure and drought response
Active playing surface guideline and workshop program Deferral of infrastructure and drought response
Non-residential water audits with assistance from the SEQ water service providers Deferral of infrastructure and drought response
Nursery water efficiency program working with relevant industry associations Deferral of infrastructure and drought response
Major sporting grounds water efficiency program Deferral of infrastructure and drought response
Water efficiency management plans (WEMPs) Drought response
Sub-regional targeted messaging Drought response
Sub-regional retrofit style program Deferral of infrastructure and drought response
Sub-regional targeted rebate program Deferral of infrastructure and drought response
Sub-regional gardening program to educate about irrigation needs in the area based on soil type and the types of plants generally in the area. Note, where this program is applied to more than one region the cost will reduce
Drought response

Water for life136
Preferred demand management option Demand management category
Pre-drought messaging on indoor and outdoor water use (including gardening). Messaging to focus on medium level water restriction (encouraged not enforced) along with shorter showers etc. to avoid drought response triggers. Target of 150 L/p/day
Drought response
Drought messaging target of 140 L/p/day. Drought messaging, including medium level water restrictions, likely four-minute showers and other stronger water efficiency messages (approx. 40-30% regional water supply)
Drought response
Drought response messaging target of 125 L/p/day. Stronger messages, still only medium level water restrictions (30-20% regional water supply)
Drought response
Drought response messaging target of 120 L/p/day (20-15% regional water supply) with stronger messages. Opportunity to impose high level water restrictions
Drought response
Drought response messaging target of 115 L/p/day (15-10% regional water supply) with stronger messages. Opportunity to continue high level water restrictions
Drought response
Drought response messaging target of 100 L/p/day (10-5% regional water supply – emergency response) with stronger messages. Opportunity to impose extreme level water restrictions.
Drought response
Medium level water restrictions (target of 140 L/p/day residential demand). This restriction would not be implemented until drought response was triggered. Note, there are no water restrictions prior to drought response, just messaging
Drought response
High level water restrictions (target of 120 L/p/day residential demand) Drought response
Extreme level water restrictions (target of 100 L/p/day residential demand) Drought response
Emergency level water restrictions (target of 100 L/p/day combined residential and non-residential) Drought response
GATE 1 – COARSE SCREEN OF SUPPLY OPTIONS
A preliminary blue sky list of 131 supply options was developed. The majority of these sources have been considered previously and in many cases were highlighted as potential initiatives for further assessment. Due to the nature and number of potential options, assessments have been at a strategic level and are subject to change pending community feedback.
The 131 supply options were divided into categories, namely:
• surface water
• desalination
• groundwater
• purified recycled water (indirect potable reuse and direct potable reuse)
• decentralised schemes
• water treatment plant upgrades
• network augmentations
• unconventional supply options (i.e. tankering, purchase of irrigation allocations, cloud seeding, etc.).
A coarse screen of the options was made based on the following criteria:
• A yield estimate can be generated and
• The indicative levelised (cost per unit volume produced) cost is less than $8/kL.
The process is summarised in Table H-3.

South East Queensland’s Water Security Program 2015-2045 137
Table H-3 Gate 1: Coarse screen supply options assessment
Blue sky 131 options
Additional information required
3
Removed 18
Long list 110
Options which did not progress through this gate either did not meet the levelised cost criterion, did not produce a yield or did not contain sufficient information to generate a yield, in which case the option was put aside for future assessment when more information is available for incorporation into future versions of the Water Security Program. The coarse screening of the blue sky list resulted in a long list of supply options for consideration. Options excluded from further assessment at this gate are listed in Table H-4.
Table H-4 Supply options excluded through gate 1 of the assessment process
Option Reason for exclusion
Small direct potable reuse options High levelised cost
Small indirect potable reuse options High levelised cost
Development of existing undersea aquifers
High levelised cost
Wivenhoe Dam to Borumba Dam bi-directional pipeline
High levelised cost
Inter-regional transfers from Burdekin Falls
High levelised cost
Towing icebergs High levelised cost
Water tankering High levelised cost
Sewer mining High levelised cost
Development of new aquifers No yield
Expansion of the Bromelton off-stream storage
Requires further information on yield contribution
Cloud seeding Requires further information (put aside for future assessments as technology develops and more information becomes available)
Development of managed aquifer recharge scheme
No opportunities identified (set aside for further assessment of new opportunities)

Water for life138
GATE 2 – COMPARATIVE SUPPLY OPTIONS ASSESSMENT
This gateway involved a comparative assessment of supply options within a category and sub-region. This step also included mandatory and non-mandatory criteria:
• mandatory criteria – compliance with Water Resource Plan objectives (relevant to surface water category only)
• non-mandatory criteria – comparative assessment against social, environmental and risk criteria.
Based on this comparative assessment, options which were best within a category and sub region progressed to gate 3. A summary of the gate 2 assessment process is presented in Table H-5. Options excluded at this gate are listed in Table H-6.
Table H-5 Gate 2: Summary of the supply options assessment process
Long list 110 options
Removed 40
Short list 70
Table H-6 Supply options excluded through gate 2 of the assessment process
Option category Number removed
Desalination 16
Surface water 15
Groundwater 4
Indirect potable reuse 0
Direct potable reuse 0
Decentralised schemes 0
Network augmentations 0
Treatment plant upgrades 2
Unconventional supply options
3
GATE 3 – FURTHER SUPPLY OPTIONS SCREENING
Further screening of the short list was based on the option’s contribution to the LOS yield within the regional stochastic model, the efficiency of the option and the type of solution presented by the option.
At this stage, desalination options were consolidated into northern, central and southern options, as the modelling of contribution to LOS yield would not differ between desalination options of the same size for a particular sub region. Table H-7 provides a summary of the gate 3 assessment process. Options that were identified as highly efficient (exceptionally more effective than any other alternatives under consideration) and related to augmentations of existing assets are assumed to be included in every case and thus removed from further assessment as an additional augmentation option.
Options were excluded from further assessment at this stage due to:
• the yield contribution (yields <7,500 ML/annum were too small to assess in the model and thus excluded from the assessment at this stage and considered for local optimisation)
• temporary solutions reserved for drought response, i.e. mobile desalination plants
• options that require further hydrologic assessment were set aside for future versions of the Water Security Program
• decentralised schemes (set aside for assessment in future versions of the Water Security Program once additional information is obtained).
Options removed at this gate are listed in Table H-8.
Table H-7 Gate 3: Summary of the supply options assessment process
Short list 70
Individual desalination sites merged within sub-region 6
Very efficient existing system augmentation options 4
Decentralised options Identified for further investigation 5
Drought response options 3
Local optimisation options 8
Additional information required through further investigations 3
Carried forward to options assembly 41

South East Queensland’s Water Security Program 2015-2045 139
Table H-8 Options excluded at gate 3 of supply options assessment process
Option Reason for Exclusion
NPI coastal mains offtake Already included in every case going forward, as is an efficient existing system augmentation
Aspley pump station northerly flow pumping Already included in every case going forward, as is an efficient existing system augmentation
Upgrade North Pine Water Treatment Plant Already included in every case going forward, as is an efficient existing system augmentation
Upgrade Mount Crosby water treatment plants Already included in every case going forward, as is an efficient existing system augmentation
Mobile desalination plants To be assessed as a drought response measure
Redevelop Brisbane aquifers To be assessed as a drought response measure
Remobilise Enoggera Water Treatment Plant To be assessed as a drought response measure
Raise Baroon Pocket Dam Minor yield contribution (<7,500 ML/annum)
Cedar Grove Weir Stage 2 Minor yield contribution (<7,500 ML/annum)
New connection from Lake Manchester to Mount Crosby Weir
Minor yield contribution (<7,500 ML/annum)
Raise Mount Crosby Weir Minor yield contribution (<7,500 ML/annum)
Replace connection from Lake Manchester to Brisbane River
Minor yield contribution (<7,500 ML/annum)
Coombabah IPR scheme to supplement environmental flows
Minor yield contribution (<7,500 ML/annum)
Water harvesting from Mary River off-stream storage to Noosa
Minor yield contribution (<7,500 ML/annum)
Cedar Grove DPR scheme Minor yield contribution (<7,500 ML/annum)
Propose dam at Linville Additional information required (outcomes from flood storage infrastructure studies (DEWS, 2014a))
Inter-regional transfers from Northern NSW Additional information required (hydrologic information of NSW water supplies)
Decentralised schemes Additional information required
Automated system to manage licence requirements downstream of Mount Crosby Weir
Additional information required (refinement of potential volumes saved and costs)
GATE 4 – SUPPLY OPTIONS ANALYSIS AND CONSOLIDATION
The options that progressed through gate 3 were further assessed to identify those that provide the ability for staging and contribute to an efficient outcome both regionally and sub-regionally. The assessment included modelling to determine the LOS yield contribution of the option as the first augmentation to be implemented after the efficient existing asset augmentation options are delivered. Options that did not align with program objectives (i.e. were
much larger than required) were also excluded at this gate. A summary of the gate 4 assessment process is included in Table H-9.
Two options (an additional option for staging upgrades to Mount Crosby water treatment plants and a pipeline from Lake Kurwongbah to North Pine Dam) were included as additional options and 18 options removed at this stage. Options excluded from further assessment are presented in Table H-10.

Water for life140
Table H-9 Gate 4: Summary of the supply options assessment process
Options assembly 41
Additional options 2
Total options assessed 43
Removed 18
Category options assembly 26
Table H-10 Options excluded at gate 4 of the supply options assessment process
Option Reason for exclusion
Various IPR schemes Small LOS yield contribution
Various DPR schemes
Small LOS yield contribution
Landers Shute Water Treatment Plant upgrade
Small LOS yield contribution
GATE 5 – INEFFICIENT SUPPLY OPTION REMOVAL
The 26 options that progressed to this gate were assessed for their sub-regional contribution and also their contribution to LOS yield as the first augmentation option. This assessment occurred using the RSM model. A summary of the assessment outcomes is provided in Table H-11.
This assessment identified that augmentations in the northern sub region contributed more significantly to LOS yield, primarily as they were addressing the system deficiencies in this more vulnerable region. Further, the size of the augmentation also defined the efficiency of the option. For example a 100 ML/day augmentation only had a marginal improvement to LOS yield compared with a 50 ML/day option, however incurred a greater cost. Thus a 50 ML/day plant that could be expanded as demand increased provided a more efficient outcome than building a bigger plant at the outset.
Note that while northern sub-regional augmentations were more efficient than augmentations in other sub-regions for the first augmentation, only two options were excluded at this stage. Other options remained, as their relative contribution to LOS yield as a second augmentation proved efficient once the initial augmentation occurred in the northern sub-region, resolving the vulnerability of that area.
Table H-11 Gate 5: Summary of the supply options assessment process
Category options assembly 26
Local optimisation 2
Removed 2
Category compilations 22
The two options that did not proceed further in the assessment process were deemed potentially suitable as local optimisation options due to their small contribution to LOS yield. These options included the NPI Railway Towns offtake and the Sparkes Hill to Aspley augmentation.
The two options excluded at this stage were the SRWP augmentation/duplication and the duplication of the Gold Coast Desalination Plant. Both options were inefficient for all augmentation stages.
GATE 6 – INEFFICIENT SUPPLY OPTION STAGING REMOVAL
This gate assessed the relative contribution of an option to LOS yield as a first, second, third or fourth augmentation within a category (i.e. desalination, surface water). Where the option did not contribute significantly to LOS yield for any augmentation, the augmentation was not cost effective and/or did not meet planning criteria, that option was removed. A summary of the Gate 6 assessment process is presented in Table H-12.
Twelve options were removed from further consideration at this stage as they were not cost-effective in any sequence of augmentation. Those removed included five desalination options, three DPR options, two IPR options, one surface water option and the option of constructing a pipeline from the Bromelton off-stream storage to Wyaralong.
The raising of the Wivenhoe Dam wall was set aside as it was being assessed within the Flood Storage Infrastructure Study (DEWS, 2014a).
The two options that did not proceed further in the assessment process due to small LOS contribution (less than 7,500 ML/annum) were deemed potentially suitable as local optimisation options. These were the Lake Kurwongbah to North Pine Dam pipeline and the upgrade of Image Flat Water Treatment Plant.
Four options were set aside for further investigation. These options included northern and central purified recycled water options. Further consultation and engagement with the Government is required regarding regulatory requirements, particularly relating to DPR options.
Table H-12 Gate 6: Summary of the supply options assessment process
Category compilations 22
Additional options from expanded staging opportunities
10
Total options assessed 32
Assessed separately 1
Local optimisation 2
Removed 12
Set aside for further investigation 4
Supply combination assembly 13

South East Queensland’s Water Security Program 2015-2045 141
All remaining options have been deemed efficient so they progressed to the assessment process for potential supply combinations required to meet water security requirements for SEQ. Efficient options remaining after this gate are listed in Table H-13.
Table H-13 Efficient supply options
Efficient supply options
Option type Region Option
Desalination
Northern Build a northern desalination plant – moderate size, no staging
Build a northern desalination plant – major facility, with staging
Build a northern desalination plant – major facility, no staging
Central Build a central desalination plant – moderate size, no staging
Build a central desalination plant – major facility, no staging
Southern Upgrade the Gold Coast Desalination Plant (Stage 2) (45 ML/day)
Surface water
Northern • Harvest water from the Mary River in the Gympie region, pump into a new off-stream storage and from there into the existing Borumba Dam
• Upgrade the Noosa Water Treatment Plant
• Build a new weir on the Mary River in the vicinty of Coles Crossing
• Raise the wall of the existing Borumba Dam to increase its storage capacity
• Upgrade the Noosa Water Treatment Plant
• Harvest water from the Mary River in the Gympie region, pump into a new off-stream storage and from there into a raised Borumba Dam
• Upgrade the Noosa Water Treatment Plant
Central Build Wyaralong Water Treatment Plant (inc Cedar Grove Connector) – local supply option
Build Wyaralong Water Treatment Plant (inc Cedar Grove Connector) – regional supply option
TreatmentCentral Upgrade the Mount Crosby water treatment plants to 950 ML/day (no LOS yield increase)
Southern Upgrade the Molendinar Water Treatment Plant to 190 ML/day (no LOS yield increase)
The supply options identified are subject to change with more detailed assessment and community consultation.
Detail regarding the specific impacts (e.g. social and environmental) associated with any of these options will be subject to site-specific investigations, with results incorporated into future versions of the Water Security Program.
Further investigation into the role of recycled water to augment water supplies outside of drought conditions will be undertaken in future versions of the Water Security Program.
Community feedback will also be incorporated into future assessments such that the assessment process and selection of a preferred water future for SEQ accurately reflects both the specific trade-offs associated with each option, in addition to community views.

Water for life142
Appendix I: Scenario analysis and sensitivity testing
1 . OVERVIEW
The scenario analysis and sensitivity testing carried out for this version of the Water Security Program (Version 1) has focused on testing how different combinations of supply options respond to changes to the key influences of demand and climate change. This approach was taken due to the limited time available for the development of this version.
Future versions of the Water Security Program will review a broader range of scenarios and sensitivities to better understand how the different portfolios respond to changing conditions, including influences on demand and system operating strategies.
2 . APPROACH TO SCENARIO ANALYSIS
2 .1 Demand
Demand is influenced by many factors including:
• end-user behaviour
• population growth
• demographics and housing characteristics
• distribution
• adoption of water saving technologies
• agricultural land use
• energy demand and the energy supply mix (fossil fuel-based sources require more water to produce electricity than renewable based energy sources such as solar power)
• changes to industrial and commercial growth/activity
• broader economic factors (i.e. lower exchange rates may increase tourism in the region and thus water consumption).
Due to the limited timeframe for analysis, the key demand influence assessed through the scenario analysis was per capita consumption of water. While most likely demand projections were incorporated into the base analysis, high and low projections were used for testing combinations of supply options and the associated changes to system performance.
The high and low demand forecasts vary either side of the most likely demand forecast. These represent forecasts based on differing assumptions regarding the per capita consumption of water, providing plausible upper and lower bounds respectively.
2 .2 Climate change
Climate change affects both the quality and quantity of raw water available for use, particularly from surface water sources, in addition to demand for water driven by changes to temperature and evaporation. The timing, frequency and duration of extreme weather events can be influenced by climate change and may drive investment where additional resilience is required within the supply system. This can range from changes to the frequency of peak demand days, influencing supply, treatment and transport capacity requirements, through to increased rainfall and run-off, which influence the extent to which the system is required to treat either poorer quality water or source water from climate-resilient sources.
The potential impact of climate change on the water grid yield was tested, by altering the evaporation and storage water inflow data used as input factors to the bulk water supply system yield model. The stepped approach undertaken is noted in Figure I-1 below.
Historical data(inflows and evaporation)
Apply monthly climate change factors from the selected global
circulation models
Climate change affected data
(inflows and evaporation)
Apply changed data to supply model
Potential impact of climate change on yield
Figure I-1 Approach to estimate of climate change impacts

South East Queensland’s Water Security Program 2015-2045 143
A key component of this assessment was the selection of appropriate climate models. Eleven global circulation models were selected, which gave the best historical replication of Queensland’s climate, as previously assessed by the former Queensland Centre for Climate Change Excellence.
Table I-1 Global circulation model ranking and selection
Global Circulation Model (GCM)
Mean annual key bulk water storages inflow (ML/annum)
Selection
2030 2050
GFDL_cm2_1_SRES_A2 996,197 778,870
UKMO_HADGEM1_SRES_A2 1,108,089 971,155 10th percentile
MPI_ECHAM5_SRES_A2 1,147,956 1,046,119
UKMO_HADCM3_SRES_A2 1,171,902 1,089,474
Mark_3.5_SRES_A2 1,176,483 1,096,411
IAP_FGOALS1_0_g_SRES_A1B 1,194,806 1,125,298 Median
Mark_3.0_SRES_A2 1,204,105 1,222,453
NCAR_CCSM3_0_SRES_A2 1,253,848 1,239,033
MICRO3_2_hires_SRES_A1B 1,376,615 1,480,451
MIUB_echo_g_SRES_A2 1,412,718 1,559,285 90th percentile
MICRO3_2_medres_SRES_A2 1,501,051 1,729,604
2 .3 Scenarios evaluated
A total of four scenarios were developed to test the impact of climate change, changing demand as well as a combination of high demand and low inflows from climate change. These scenarios were selected to provide insight into how various combinations of supply options were impacted by changes to the key influences of demand and climate change, including the impact from the compounding influences of these factors.
The scenarios evaluated were (refer also to Figure I-2):
1. low inflow due to climate change
2. high demand and low inflow
3. low demand
4. high demand.
The combination of low inflows (high climate change impact) and high demand in scenario 2 represents a plausible worst case scenario. Scenarios 1 and 4 test the impact of low inflows (high climate change) and high demand individually. Low demand in scenario 3 tests how much the planned works associated with each combination of supply options may be deferred if demand increases less than forecast.
Figure I-2 Scenarios evaluated for Version 1 of the Water Security Program
Version 2 of the Water Security Program will consider inclusion of a much broader range of changes to influences in the development of scenarios, testing all supply, demand and system operation levers. Considerations may include factors such as changing catchment conditions, levels of service, broader ranges of impacts from climate change, changing technology, the degree of decentralisation, and the degree of integration of planning with other government agencies and sectors.
The 11 global circulation models were ranked according to their mean annual rainfall as shown in Table I-1. Three of these global circulation models were then chosen to create three amended inflow data sets for low inflows (10th percentile), median inflows and higher inflows (90th percentile). These three inflow sets were applied to the supply modelling tool to assess the potential impact on the yield.
Due to timeframe constraints it has not been possible to test the impact of a broad range of climate scenarios on different combinations of supply options and the associated changes to system performance. The scenario testing was limited to the impact of low inflows (high climate change impact) as this was deemed to have the most adverse impact on water supply security.
The low inflow (high climate change impact) series was taken as the 10th percentile of mean annual inflows and was selected to assess the risk of low inflow from climate change without selecting the worst case scenario, which may lead to potential over-investment.
3
1
24
High demand
Low demand
Low inflowHigh inflow
Dem
and
Climate change – inflows

Water for life144
Figure I-3 Scenario analysis results depicting impact on date first major augmentation is required
3 . APPROACH TO SENSITIVITY ANALYSIS
Sensitivity analysis was also carried out to test the impact of changing a single cost variable on various combinations of supply options. The two key variables considered included the impact of energy prices and discount rates. Both of these variables have changed significantly over recent times due to both global and local economic influences.
3 .1 Energy price
Energy price impacts were selected because the purchase of energy in the form of electricity is a significant single contributor to cost. Over the last eight years, energy prices increased at a much greater rate than the consumer price index, which demonstrates that energy prices can be subject to significant change.
The net present cost analysis for combinations of supply options using most likely projections was undertaken assuming no escalation in energy price above inflation. Sensitivity of the options to changes in energy price over time has been tested by recalculating the net present cost for three energy price escalation rates. The following annual energy price escalation rates have been applied to provide a plausible range of impacts on the 16-year net present cost:
• low escalation: 0.17% – based on the Queensland Competition Authority recommended rate
• medium escalation: 3.43% – based on Seqwater’s typically adopted rate for infrastructure projects
• high escalation: 6% – selected as a long-term upper bound.
These escalation rates were applied as ‘real’ rates (i.e. taking into account inflation) and are intended to represent a long-term rate over 30 years.
3 .2 Discount rate
The discount rate was varied to test how it may influence the economic performance of the system for different combinations of supply options and whether this may influence selection of a preferred future solution.
The net present cost analysis of combinations of options has been undertaken using a real discount rate of 4% per annum. Sensitivity of the options to changes in discount rate over time has been tested by recalculating the net present cost using an alternative rate of 0.36% per annum based on the generic Queensland Treasury Corporation 10-year borrowing rate as at March 2015. This rate has been applied over the 30-year period and is intended to represent a lower bound case.
4 . RESULTS
4 .1 Scenario analysis
The scenario analysis demonstrated that, to achieve robustness against climate change and high demand, more climate-resilient sources would be required. The northern sub-region would be impacted to a greater extent than other areas.
Without further augmenting the water grid, there is an efficient limit to augmentations in the northern sub-region. This is due to network constraints which limit the ability to transfer surplus water from the northern sub-region to other sub-regions and vice versa. Therefore, if surplus water is generated from augmentations in the northern sub-region (i.e. more than
required to meet demands in the northern sub-region), this additional water may not be able to be transported to, and therefore utilised in, central or southern sub-regions. Therefore, under all scenarios other than the low demand scenario, augmentations are required in the northern and other sub-regions (Figure I-3).
Future work will be required to refine network capacity requirements in relation to optimal combinations for the northern sub-region.
4 .2 Sensitivity analysis
The sensitivity analysis demonstrated that different combinations of supply options were similarly sensitive to changing discount rates and thus the discount rate would not alter the selection of a preferred option or pathway.
There was, however, a difference in sensitivity to energy prices between different combinations of supply options.
0
50,000
100,000
150,000
200,000
250,000
300,000
350,000
400,000
450,000
500,000
550,000
600,000
650,000
Sout
h Ea
st Q
ueen
slan
d de
man
d M
L/an
num
LOS yield 440,000 ML/annum no climate change LOS yield 10th percentile in�ow with climate changeHigh demand Most likely demand Low demand
2015
2020 20
25 2035
2040 20
4520
3020
50

South East Queensland’s Water Security Program 2015-2045 145
Appendix J: Standalone communities risk assessment
Seqwater currently supplies bulk water services to 16 standalone1 community water supply schemes:
• Amity Point
• Beaudesert
• Boonah-Kalbar
• Canungra
• Dayboro
• Dunwich
• Esk
• Jimna
• Kenilworth
• Kilcoy
• Kooralbyn
• Linville
• Lowood
• Point Lookout
• Rathdowney
• Somerset Dam.
Table J-1 provides an overview of each of the above water supply schemes detailing their relevant local government authority, water service provider (i.e. Seqwater’s bulk water customer), treatment plant details, raw water source information and relationship with risk to water security over the next five years.
The scope of this version of the Water Security Program requires the identification of water supply schemes that are at risk of supply shortfalls over the next five years.
This assessment provides a detailed overview of prioritisation of standalone communities. The following criteria have been used for the prioritisation process:
• water allocation is insufficient to accommodate proposed average day demands
• treatment plant capacity does not meet future MDMM demand requirements
• issues about raw water sources are considered significant, thus impacting the ability to produce adequate supply.
Historical planning, available demand projections and other available information were used to assess the above criteria to identify schemes at risk. The demand projections are considered a limitation due to 2011 being the baseline year. Therefore, consideration was also given to historical consumption trends as a means to also judge the relevant risk. Following the risk assessment, at-risk schemes were assessed in more detail to develop appropriate supply solutions. Based on the above process and information contained in Table J-1 and Figures J-1 to J-16, the following outcomes are summarised:
• All standalone community water supply schemes have sufficient water allocation to meet average day demands over the next five years.
• Based on the preliminary risk assessment, the following water treatment plants have been identified as having insufficient capacity to meet MDMM demand over the next five years:
− Beaudesert (refer Figure J-2): There is an indication that the Beaudesert MDMM demand is scheduled to reach treatment plant capacity within the next five years. Therefore, Beaudesert is considered to be at risk of a supply shortfall
− Canungra (refer Figure J-4): Based on the demand projection information, this treatment plant is likely to require an augmentation in the next five years. Due to the size of the community, supply can be supplemented through water carting in the interim if required
− Esk (refer Figure J-7): The demand projection indicates that an upgrade will be required in 2018, however the historic trending of demand does not support this conclusion. Based on historic demand trends, this water supply scheme is not deemed to be at significant risk of a supply shortfall over the next five years
− Lowood (refer Figure J-13): The Lowood Water Treatment Plant is also expected to surpass its intended 20-hour operational capacity within the next five years. This outcome is deemed to place Lowood at risk of supply shortfall within the five years.
1 Excluding minor schemes that service recreational and/or dam-based facilities

Water for life146
• Raw water source issues that may have implications for supply include:
− Beaudesert: Water quality at the Beaudesert Water Treatment Plant is considered poor at times and is hampered by industry and rural development upstream of the raw water extraction point, which is exacerbated during wet weather. This will need to be considered as part of the water supply strategy for Beaudesert
− Canungra: The supply is run-of-river and therefore is sensitive to periods of dry weather
− Dayboro: Anecdotal evidence suggests recent floods have modified the interaction between the surface water source and the water table. This has influenced the reliability of groundwater bores in the area. Investigations of the groundwater table and its suitability are currently underway. As the groundwater assessment is still ongoing and will be fundamental to the assessment, Dayboro will be considered as part of the next stage of assessment
− Jimna: The supply is run-of-river and therefore is sensitive to periods of dry weather. Despite the concern with accessing raw water from a run-of-river supply, the Jimna community and average day demand (i.e. 20 kL/day) is relatively small and therefore water carting is a tangible solution as risk mitigation
− Kenilworth: The supply is run-of-river and therefore is sensitive to periods of dry weather. Kenilworth is also a relatively small scheme with an average day demand ranging from 20-30 kL/day over the next 30 years. On this basis, water carting is considered a reasonable risk mitigation.
Based on the above assessment, standalone communities that warrant initial consideration for infrastructure planning needs include Beaudesert, Canungra and Lowood.
Further long-term water security consideration, i.e. performance against LOS objectives, will be assessed for a projected 30-year period in relation to all standalone communities within the next version (Version 2) of the Water Security Program. Based on current knowledge, no standalone community is considered to have an excessive risk in relation to water security (i.e. availability of raw water) over the next five years (Table J-1). This is primarily due to current dam levels, existing or proposed connection to water grid infrastructure, or the ability to supply treated water through carting.

South East Queensland’s Water Security Program 2015-2045 147
Table J-1 Standalone community water supply scheme overview
Standalone community
Local government/bulk supply customer/bulk supply description
Amity Point Local government Redland City Council
Bulk water customer Redland Water
Water treatment plant Amity Point Water Treatment Plant with a capacity of 2.7 ML/day. The plant services the township of Amity Point.
Raw water source The raw water for this water treatment plant is sourced from the North Stradbroke Island aquifer and is considered a secure raw water source.
The allocation for this source is 0.55 ML/day
Water security (five-year outlook)
The North Stradbroke Island aquifer has historically been a reliable source of supply. The risk to supply over the next five years is considered to be low.
Further investigations will be required to confirm the long term reliability of the North Stradbroke Island aquifer.
Beaudesert Local government Scenic Rim Regional Council
Bulk water customer Queensland Urban Utilities
Water treatment plant Beaudesert Water Treatment Plant with a capacity of 2.9 ML/day. The plant services the township of Beaudesert.
The current water treatment plant has insufficient capacity to service the township. An adjustment to the water treatment plant will provide a 4 ML/day capacity from 2016 to alleviate immediate capacity concerns. However, despite this minor augmentation in water treatment plant capacity, concerns still exist about capacity over the next five years.
Raw water source Raw water is sourced from Lake Maroon via the upper reaches of the Logan River. Overall the raw water source is considered to be secure in nature. Water quality at the Beaudesert Water Treatment Plant is considered poor at times and is hampered by industrial development and releases upstream of the raw water extraction point.
The allocation for this source is currently 8.67 ML/day.
Water security (five-year outlook)
Beaudesert is a sizeable standalone community that could not be supported solely through water carting. Under the Water Security Program it is proposed a business case be prepared for Beaudesert, which will investigate connection to the water grid.
Maroon Dam is near capacity (April 2015) and is unlikely to reach levels of concern prior to the anticipated connection of Beaudesert to the water grid.
Boonah–Kalbar Local government Scenic Rim Regional Council
Bulk water customer Queensland Urban Utilities
Water treatment plant Boonah–Kalbar Water Treatment Plant with a capacity of 2.7 ML/day. This plant services the townships of Boonah, Kalbar, Aratula and Mt Alford.
Raw water source The Boonah–Kalbar Water Treatment Plant sources its raw water from Reynolds Creek, which is supplemented by Lake Moogerah releases. During previous droughts the transfer of water from Lake Moogerah to the Boonah–Kalbar Water Treatment Plant has been problematic. This was due to transfer losses being influenced by groundwater levels associated with irrigation extraction.
The allocation for this source is 4.95 ML/day.
Water security (five-year outlook)
Due to the size of the Boonah–Kalbar water supply scheme, it is not feasible to cart water to supplement supply. Therefore, there is no mitigation to overcome shortfalls that may occur due to falling Moogerah Dam levels.
However, Moogerah Dam is near capacity (April 2015) and is not currently deemed to be a water security risk.
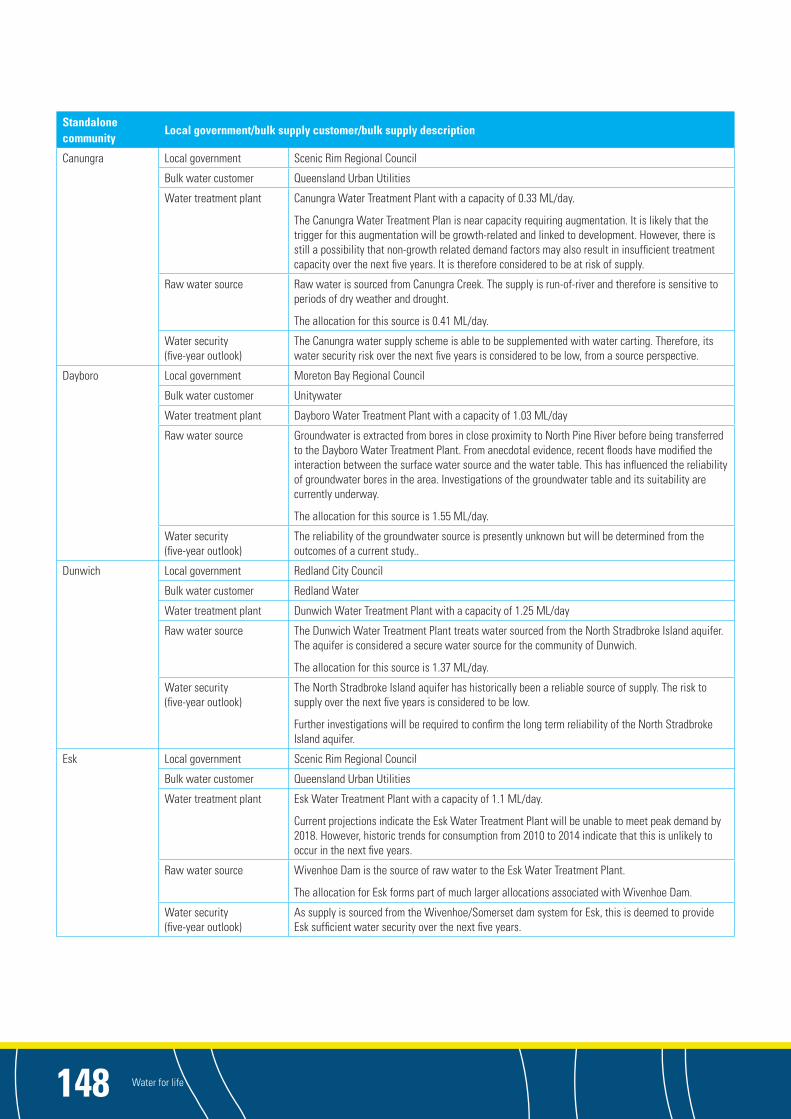
Water for life148
Standalone community
Local government/bulk supply customer/bulk supply description
Canungra Local government Scenic Rim Regional Council
Bulk water customer Queensland Urban Utilities
Water treatment plant Canungra Water Treatment Plant with a capacity of 0.33 ML/day.
The Canungra Water Treatment Plan is near capacity requiring augmentation. It is likely that the trigger for this augmentation will be growth-related and linked to development. However, there is still a possibility that non-growth related demand factors may also result in insufficient treatment capacity over the next five years. It is therefore considered to be at risk of supply.
Raw water source Raw water is sourced from Canungra Creek. The supply is run-of-river and therefore is sensitive to periods of dry weather and drought.
The allocation for this source is 0.41 ML/day.
Water security (five-year outlook)
The Canungra water supply scheme is able to be supplemented with water carting. Therefore, its water security risk over the next five years is considered to be low, from a source perspective.
Dayboro Local government Moreton Bay Regional Council
Bulk water customer Unitywater
Water treatment plant Dayboro Water Treatment Plant with a capacity of 1.03 ML/day
Raw water source Groundwater is extracted from bores in close proximity to North Pine River before being transferred to the Dayboro Water Treatment Plant. From anecdotal evidence, recent floods have modified the interaction between the surface water source and the water table. This has influenced the reliability of groundwater bores in the area. Investigations of the groundwater table and its suitability are currently underway.
The allocation for this source is 1.55 ML/day.
Water security (five-year outlook)
The reliability of the groundwater source is presently unknown but will be determined from the outcomes of a current study..
Dunwich Local government Redland City Council
Bulk water customer Redland Water
Water treatment plant Dunwich Water Treatment Plant with a capacity of 1.25 ML/day
Raw water source The Dunwich Water Treatment Plant treats water sourced from the North Stradbroke Island aquifer. The aquifer is considered a secure water source for the community of Dunwich.
The allocation for this source is 1.37 ML/day.
Water security (five-year outlook)
The North Stradbroke Island aquifer has historically been a reliable source of supply. The risk to supply over the next five years is considered to be low.
Further investigations will be required to confirm the long term reliability of the North Stradbroke Island aquifer.
Esk Local government Scenic Rim Regional Council
Bulk water customer Queensland Urban Utilities
Water treatment plant Esk Water Treatment Plant with a capacity of 1.1 ML/day.
Current projections indicate the Esk Water Treatment Plant will be unable to meet peak demand by 2018. However, historic trends for consumption from 2010 to 2014 indicate that this is unlikely to occur in the next five years.
Raw water source Wivenhoe Dam is the source of raw water to the Esk Water Treatment Plant.
The allocation for Esk forms part of much larger allocations associated with Wivenhoe Dam.
Water security (five-year outlook)
As supply is sourced from the Wivenhoe/Somerset dam system for Esk, this is deemed to provide Esk sufficient water security over the next five years.

South East Queensland’s Water Security Program 2015-2045 149
Standalone community
Local government/bulk supply customer/bulk supply description
Jimna Local government Somerset Regional Council
Bulk water customer Queensland Urban Utilities
Water treatment plant Jimna Water Treatment Plant with a capacity of 0.15 ML/day.
Raw water source The Jimna Water Treatment Plant sources its raw water from Yabba Creek. The supply is run-of-river and therefore is sensitive to periods of dry weather and drought.
The allocation for this source is 0.05 ML/day.
Water security (five-year outlook)
The Jimna water supply scheme can be supplemented with water carting. On this basis, this scheme would be considered to have sufficient water security over the next five years.
Kenilworth Local government Sunshine Coast Regional Council
Bulk water customer Unitywater
Water treatment plant Kenilworth Water Treatment Plant with a capacity of 0.44 ML/day.
Raw water source The Kenilworth Water Treatment Plant is supplied raw water from an extraction from the Mary River. The supply is run-of-river and therefore is sensitive to periods of dry weather and drought.
The allocation for this source is 0.6 ML/day.
Water security (five-year outlook)
The Kenilworth water supply scheme is able to be supplemented with water carting. On this basis, this scheme would be considered to have sufficient water security over the next five years.
Kilcoy Local government Somerset Regional Council
Bulk water customer Queensland Urban Utilities
Water treatment plant Kilcoy Water Treatment Plant with a capacity of 3.3 ML/day.
Raw water source The new water treatment plant sources its raw water supply from Lake Somerset and is therefore considered to be a safe and reliable source.
The water allocation for this source is 3.01 ML/day.
Water security (five-year outlook)
As supply is sourced from the Wivenhoe/Somerset dam system for Kilcoy, this is deemed to provide Kilcoy sufficient water security over the next five years.
Kooralbyn Local government Scenic Rim Regional Council
Bulk water customer Queensland Urban Utilities
Water treatment plant Kooralbyn Water Treatment Plant with a capacity of 1.6 ML/day.
Raw water source The Kooralbyn Water Treatment Plant sources its raw water from the Logan River (i.e. Lake Maroon). Lake Maroon’s supply level is currently at 100% of its full supply level as at February 2015. The raw water source is considered to be safe and reliable.
The water allocation for this source is 1.23 ML/day.
Water security (five-year outlook)
The Kooralbyn water supply scheme is able to be supplemented with water carting. On this basis, this scheme would be considered to have sufficient water security over the next five years.
Lowood Local government Somerset Regional Council
Bulk water customer Queensland Urban Utilities
Water treatment plant Lowood Water Treatment Plant with a capacity of 14.6 ML/day. This plant services an extensive service area outside the Lowood township, which includes Fernvale, Laidley, Plainland, Gatton, Grantham, Helidon and Withcott.
The demand projection for the Lowood water supply scheme indicates that peak demand will exceed the water treatment plant capacity by 2016. On this basis the Lowood water supply scheme is considered to be at risk in the next five years.
Raw water source Releases from Wivenhoe Dam supply raw water to the Lowood Water Treatment Plant. Wivenhoe Dam’s supply level was 95% of its full supply level as at February 2015. The raw water source is considered to be safe and reliable.
The allocation for Lowood forms part of much larger allocations associated with Wivenhoe Dam.
Water security (five-year outlook)
As supply is sourced from the Wivenhoe/Somerset dam system for Lowood, this is deemed to provide Lowood sufficient water security over the next five years.

Water for life150
Standalone community
Local government/bulk supply customer/bulk supply description
Linville Local government Somerset Regional Council
Bulk water customer Queensland Urban Utilities
Water treatment plant Linville Water Treatment Plant with a capacity of 0.33 ML/day.
Raw water source Raw water is sourced from bores in proximity to the upper reaches of the Brisbane River.
The entitlement for this source is 0.1 ML/day.
Water security (five-year outlook)
The Linville water supply scheme is able to be supplemented with water carting. On this basis, this scheme would be considered to have sufficient water security over the next five years.
Point Lookout Local government Redland City Council
Bulk water customer Redland Water
Water treatment plant Point Lookout Water Treatment Plant with a capacity of 2.4 ML/day.
Raw water source The Point Lookout Water Treatment Plant treats water sourced from the North Stradbroke Island aquifer. The aquifer is considered is considered a secure water source for the community of Point Lookout.
The entitlement for this source is 2.05 ML/day.
Water security (five-year outlook)
The North Stradbroke Island aquifer has historically been a reliable source of supply. The risk to supply over the next five years is considered to be low.
Further investigations will be required to confirm the long-term reliability of the North Stradbroke Island aquifer.
Rathdowney Local government Scenic Rim Regional Council
Bulk water customer Queensland Urban Utilities
Water treatment plant Rathdowney Water Treatment Plant with a capacity of 0.34 ML/day.
Raw water source The Rathdowney WaterTreatment Plant sources its raw water from the Logan River (i.e. Lake Maroon). Lake Maroon’s supply level was 99% of its full supply level as at February 2015. The raw water source is considered to be safe and reliable.
The entitlement for this source is 0.22 ML/day.
Water security (five-year outlook)
The Rathdowney water supply scheme is able to be supplemented with water carting. On this basis, this scheme would be considered to have sufficient water security over the next five years.
Somerset Local government Somerset Regional Council
Bulk water customer Queensland Urban Utilities
Water treatment plant Somerset Dam Water Treatment Plant with a capacity of 0.23 ML/day.
Raw water source The raw water for the Somerset Dam Water Treatment Plant is from Somerset Dam. This is considered to be a safe and reliable source of water.
The entitlement for this source is 0.41 ML/day.
Water security (five-year outlook)
As supply is sourced from Wivenhoe/Somerset dam system for Somerset, this is deemed to provide Somerset sufficient water security over the next five years.
The assessment for Figures J-1 to J-16 was based on available information. For the period 2010–2014 the production data was based on actual production, while post-2014 has been based on a 2011 baseline demand projection with a transition between data sets. In some cases the historical production exceeds the forecast demand (i.e. Kilcoy, Kooralbyn, Linville, Point Lookout, Rathdowney).

South East Queensland’s Water Security Program 2015-2045 151
0.00
1.00
2.00
3.00
Fl
ow/D
eman
d M
L/da
y
2010
2011
2012
2015
2016
2019
2020
2013
2014
2017
2018
2021
2024
2025
2022
2023
Historic AD Projected AD Historic MDMM Projected MDMM WTP Capacity (20hr) Allocation
Figure J-1 Amity Point – 10-year projection
0.00
2.00
4.00
6.00
8.00
10.00
12.00
14.00
16.00
18.00
20.00
Historic AD Projected AD Historic MDMM Projected MDMM WTP Capacity (20hr) Allocation
Flow
/Dem
and
ML/
day
2010
2011
2012
2015
2016
2019
2020
2013
2014
2017
2018
2021
2024
2025
2022
2023
Figure J-2 Beaudesert – 10-year projection

Water for life152
0.00
1.00
2.00
3.00
4.00
5.00
6.00
Year Historic AD Projected AD Historic MDMM Projected MDMM WTP Capacity (20hr) Allocation
Flow
/Dem
and
ML/
day
2010
2011
2012
2015
2016
2019
2020
2013
2014
2017
2018
2021
2024
2025
2022
2023
Figure J-3 Boonah–Kalbar – 10-year projection
Figure J-4 Canungra – 10-year projection
0.00
0.10
0.20
0.30
0.40
0.50
0.60
0.70
0.80
0.90
Historic AD Projected AD Historic MDMM Projected MDMM WTP capacity (20hr) Allocation
Flow
/Dem
and
ML/
day
2010
2011
2012
2015
2016
2019
2020
2013
2014
2017
2018
2021
2024
2025
2022
2023

South East Queensland’s Water Security Program 2015-2045 153
0.00
0.20
0.40
0.60
0.80
1.00
1.20
1.40
1.60
1.80
Historic AD Projected AD Historic MDMM Projected MDMM WTP Capacity (20hr) Allocation
Flow
/Dem
and
ML/
day
2010
2011
2012
2015
2016
2019
2020
2013
2014
2017
2018
2021
2024
2025
2022
2023
Figure J-5 Dayboro – 10-year projection
Figure J-6 Dunwich – 10-year projection
0.00
0.20
0.40
0.60
0.80
1.00
1.20
1.40
1.60
Historic AD Projected AD Historic MDMM Projected MDMM WTP Capacity (20hr) Allocation
Flow
/Dem
and
ML/
day

Water for life154
0.00
0.50
1.00
1.50
2.00
2.50
Historic AD Projected AD Historic MDMM Projected MDMM WTP Capacity (20hr)
Flow
/Dem
and
ML/
day
2010
2011
2012
2015
2016
2019
2020
2013
2014
2017
2018
2021
2024
2025
2022
2023
Figure J-7 Esk – 10-year projection
0.00
0.02
0.04
0.06
0.08
0.10
0.12
0.14
0.16
Historic AD Projected AD Historic MDMM Projected MDMM WTP Capacity (20hr) Allocation
Flow
/Dem
and
ML/
day
2010
2011
2012
2015
2016
2019
2020
2013
2014
2017
2018
2021
2024
2025
2022
2023
Figure J-8 Jimna – 10-year projection

South East Queensland’s Water Security Program 2015-2045 155
0.0
0.1
0.2
0.3
0.4
0.5
0.6
0.7
Historic AD Projected AD Historic MDMM Projected MDMM WTP Capacity (20hr) Allocation
Flow
/Dem
and
ML/
day
2010
2011
2012
2015
2016
2019
2020
2013
2014
2017
2018
2021
2024
2025
2022
2023
Figure J-9 Kenilworth – 10-year projection
0.0
0.5
1.0
1.5
2.0
2.5
3.0
3.5
Historic AD Projected AD Historic MDMM Projected MDMM WTP Capacity (20hr) Allocation
Flow
/Dem
and
ML/
day
2010
2011
2012
2015
2016
2019
2020
2013
2014
2017
2018
2021
2024
2025
2022
2023
Figure J-10 Kilcoy – 10-year projection (refer commentary prior to graphs)

Water for life156
0.00
0.20
0.40
0.60
0.80
1.00
1.20
1.40
1.60
1.80
Historic AD Projected AD Historic MDMM Projected MDMM WTP Capacity (20hr) Allocation
2010
2011
2012
2015
2016
2019
2020
2013
2014
2017
2018
2021
2024
2025
2022
2023
Flow
/Dem
and
ML/
day
Figure J-11 Kooralbyn – 10-year projection (refer commentary prior to graphs)
0.00
0.05
0.10
0.15
0.20
0.25
0.30
0.35
Historic AD Projected AD Historic MDMM Projected MDMM WTP Capacity (20hr) Allocation
2010
2011
2012
2015
2016
2019
2020
2013
2014
2017
2018
2021
2024
2025
2022
2023
Flow
/Dem
and
ML/
day
Figure J-12 Linville – 10-year projection (refer commentary prior to graphs)

South East Queensland’s Water Security Program 2015-2045 157
Figure J-13 Lowood – 10-year projection
0.00
5.00
10.00
15.00
20.00
25.00
30.00
Historic AD Projected AD Historic MDMM Projected MDMM WTP Capacity (20hr)
2010
2011
2012
2015
2016
2019
2020
2013
2014
2017
2018
2021
2024
2025
2022
2023
Flow
/Dem
and
ML/
day
Figure J-14 Point Lookout – 10-year projection (refer commentary prior to graphs)
0.00
0.50
1.00
1.50
2.00
2.50
2010
2011
2012
2015
2016
2019
2020
2013
2014
2017
2018
2021
2024
2025
2022
2023
Historic AD Projected AD Historic MDMM Projected MDMM WTP Capacity (20hr) Allocation
Flow
/Dem
and
ML/
day

Water for life158
0.00
0.05
0.10
0.15
0.20
0.25
0.30
0.35
0.40
Historic AD Projected AD Historic MDMM Projected MDMM WTP Capacity (20hr) Allocation
2010
2011
2012
2015
2016
2019
2020
2013
2014
2017
2018
2021
2024
2025
2022
2023
Flow
/Dem
and
ML/
day
Figure J-15 Rathdowney – 10-year projection (refer commentary prior to graphs)
0.00
0.05
0.10
0.15
0.20
0.25
0.30
0.35
0.40
0.45
Historic AD Projected AD Historic MDMM Projected MDMM WTP Capacity (20hr)
2010
2011
2012
2015
2016
2019
2020
2013
2014
2017
2018
2021
2024
2025
2022
2023
Flow
/Dem
and
ML/
day
Figure J-16 Somerset – 10-year projection

South East Queensland’s Water Security Program 2015-2045 159
Appendix K: Standalone communities – drought response plans
• Beaudesert drought response plan on a page
• Canungra drought response plan on a page
• Jimna drought response plan on a page
• Boonah-Kalbar drought response plan on a page
• Kooralbyn drought response plan on a page
• Linville drought response plan on a page
• North Stradbroke Island drought response plan on a page (Amity Point, Dunwich and Point Lookout)
• Rathdowney drought response plan on a page.

Water for life160
Level Trigger Target Key actions Monitor, manage and report Communications Restrictions (standpipe and community)
Water source Preparation for future levels
1. Drought alert, preparedness and monitoring (green)
50% capacity Maroon Dam
Normal demand pattern (where there are no obvious leaks)
Reporting and readiness, monitoring, leak detection and repair
• Monitor supply status, drought response actions weekly (S)
• Monitor demand status weekly (QUU)
• Report weekly to DEWS (S)
• Contact Seqwater emergency response hotline which will act as per the ERP (S)
Advise Scenic Rim Regional Council and other major customers of the supply status (QUU)
Nil Update DRP contact list and review actions (S)
2. Voluntary conservation (yellow)
25% capacity Maroon Dam
5% reduction on normal operations consumption
Implement communications plan, leak detection and repair
As per level 1 (S & QUU) • As per level 1 (S & QUU)
• Commence low level public communications (QUU)
Monitor standpipe use (QUU) Nil • Communications planning (QUU)
• Make necessary arrangements for water carters to cart water to Beaudesert (S)
3. Voluntary conservation, restriction of standpipe and carting of water (orange)
15% capacity Maroon Dam
10% reduction on normal operations consumption
Standpipe restriction, communications plan and carting of water to supplement supply
As per level 1 but monitor daily (S & QUU) • As per level 2 (S & QUU)
• Increased communications (QUU)
Standpipe restriction (QUU) Commence water carting (S)
• Communications planning (QUU)
• Obtain approval to impose water restrictions schedule (QUU)
4. Voluntary conservation, restrictions and the appropriate regulatory measures (red)
10% capacity Maroon Dam
140 L/p/day residential Impose water restrictions, communications plan, restrictions at standpipe
As per level 3 (S & QUU) As per level 3 (S & QUU) • Standpipe restrictions (QUU)
• Impose water restrictions on customers (QUU)
Continue water carting to supplement supply (S)
Emergency response• Communications planning (QUU)
• Determine and prepare for emergency response (S & QUU)
Drought exit• Communications planning (QUU)
4a 7.5% capacity Maroon Dam
130 L/p/day residential Impose further water restrictions, continue level 4 actions with increasing communications
As per level 4 (S & QUU) As per level 4 with increasing intensity (S & QUU)
• Increased water restrictions on customers (QUU)
• Increased standpipe restrictions in line with community restrictions (QUU)
As per level 4 with increasing intensity (S & QUU)
As per level 4 with increasing intensity (S & QUU)
Emergency response 5% capacity Maroon Dam
Maximum reduction (100 L/p/day residential and non-residential combined)
Implement worst case scenario plans
As per level 4 (S & QUU)
Where required discuss with the Minister the need for a water supply emergency response (S)
As per level 4 (S & QUU) • Standpipe remains isolated (QUU)
• Retain and possibly increase severity of water restrictions (QUU)
Implement appropriate worst case scenario plans (S & QUU)
Continue emergency response planning (S & QUU)
Stepped exit Water supply level of a preceding drought response level and removal of the action is operationally appropriate
Maintain the target of the level implemented
Remove appropriate drought response actions
As per level 4 (S & QUU) As per level 4 (S & QUU) • Standpipe remains restricted (QUU)
• Retain restrictions (QUU)
As per level implemented (S & QUU)
Emergency response• Continue emergency response planning
(S & QUU)
Drought exit/re-entry to other levels• Communications planning (QUU)
Complete drought exit 60% capacity Maroon Dam
Normal demand pattern (where there are no obvious leaks)
Return to normal operations
• Completion and cessation of drought actions (S & QUU)
• Contact Seqwater emergency response hotline to close out incident as per ERP (S)
• As per level 1 but advising of exit (S & QUU)
• Drought exit communications (QUU)
• Reopen standpipe (QUU)
• Revoke water restrictions (QUU)
Water sourceCease carting water (S)
• Review and debrief (S & QUU)
• Update the Beaudesert disruption plan (S)
BEAUDESERT DROUGHT RESPONSE PLAN ON A PAGE
This is a guide.
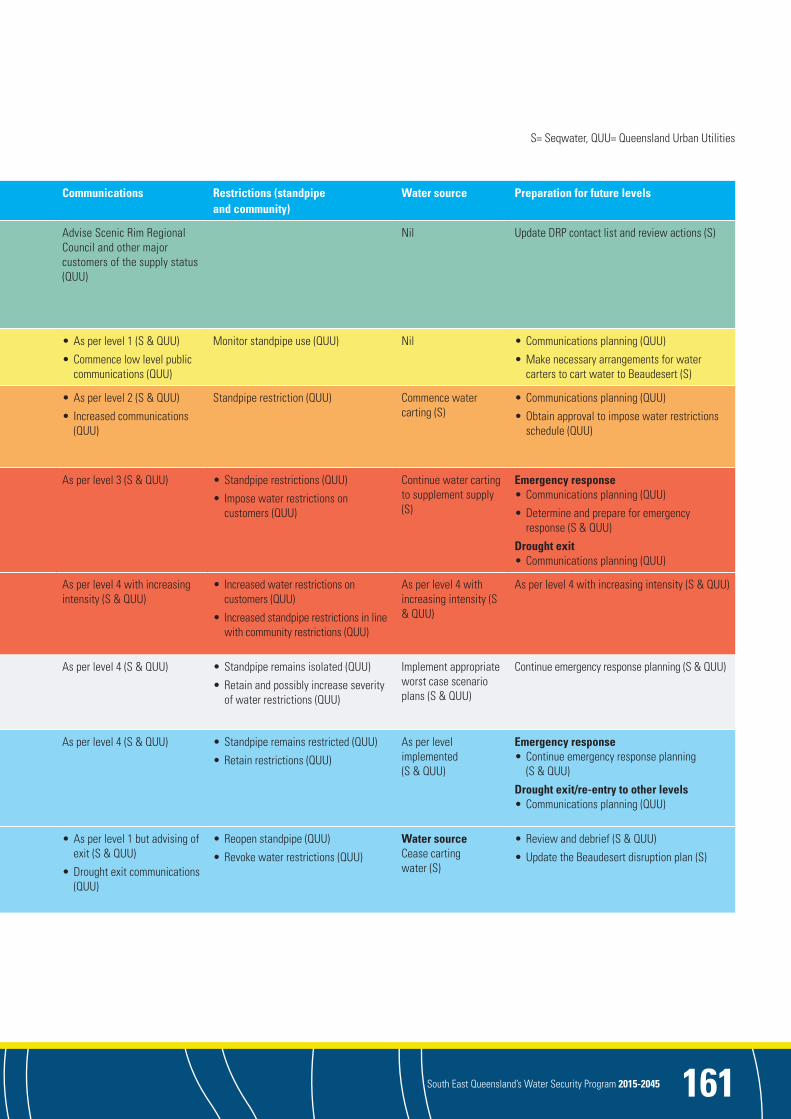
South East Queensland’s Water Security Program 2015-2045 161
Level Trigger Target Key actions Monitor, manage and report Communications Restrictions (standpipe and community)
Water source Preparation for future levels
1. Drought alert, preparedness and monitoring (green)
50% capacity Maroon Dam
Normal demand pattern (where there are no obvious leaks)
Reporting and readiness, monitoring, leak detection and repair
• Monitor supply status, drought response actions weekly (S)
• Monitor demand status weekly (QUU)
• Report weekly to DEWS (S)
• Contact Seqwater emergency response hotline which will act as per the ERP (S)
Advise Scenic Rim Regional Council and other major customers of the supply status (QUU)
Nil Update DRP contact list and review actions (S)
2. Voluntary conservation (yellow)
25% capacity Maroon Dam
5% reduction on normal operations consumption
Implement communications plan, leak detection and repair
As per level 1 (S & QUU) • As per level 1 (S & QUU)
• Commence low level public communications (QUU)
Monitor standpipe use (QUU) Nil • Communications planning (QUU)
• Make necessary arrangements for water carters to cart water to Beaudesert (S)
3. Voluntary conservation, restriction of standpipe and carting of water (orange)
15% capacity Maroon Dam
10% reduction on normal operations consumption
Standpipe restriction, communications plan and carting of water to supplement supply
As per level 1 but monitor daily (S & QUU) • As per level 2 (S & QUU)
• Increased communications (QUU)
Standpipe restriction (QUU) Commence water carting (S)
• Communications planning (QUU)
• Obtain approval to impose water restrictions schedule (QUU)
4. Voluntary conservation, restrictions and the appropriate regulatory measures (red)
10% capacity Maroon Dam
140 L/p/day residential Impose water restrictions, communications plan, restrictions at standpipe
As per level 3 (S & QUU) As per level 3 (S & QUU) • Standpipe restrictions (QUU)
• Impose water restrictions on customers (QUU)
Continue water carting to supplement supply (S)
Emergency response• Communications planning (QUU)
• Determine and prepare for emergency response (S & QUU)
Drought exit• Communications planning (QUU)
4a 7.5% capacity Maroon Dam
130 L/p/day residential Impose further water restrictions, continue level 4 actions with increasing communications
As per level 4 (S & QUU) As per level 4 with increasing intensity (S & QUU)
• Increased water restrictions on customers (QUU)
• Increased standpipe restrictions in line with community restrictions (QUU)
As per level 4 with increasing intensity (S & QUU)
As per level 4 with increasing intensity (S & QUU)
Emergency response 5% capacity Maroon Dam
Maximum reduction (100 L/p/day residential and non-residential combined)
Implement worst case scenario plans
As per level 4 (S & QUU)
Where required discuss with the Minister the need for a water supply emergency response (S)
As per level 4 (S & QUU) • Standpipe remains isolated (QUU)
• Retain and possibly increase severity of water restrictions (QUU)
Implement appropriate worst case scenario plans (S & QUU)
Continue emergency response planning (S & QUU)
Stepped exit Water supply level of a preceding drought response level and removal of the action is operationally appropriate
Maintain the target of the level implemented
Remove appropriate drought response actions
As per level 4 (S & QUU) As per level 4 (S & QUU) • Standpipe remains restricted (QUU)
• Retain restrictions (QUU)
As per level implemented (S & QUU)
Emergency response• Continue emergency response planning
(S & QUU)
Drought exit/re-entry to other levels• Communications planning (QUU)
Complete drought exit 60% capacity Maroon Dam
Normal demand pattern (where there are no obvious leaks)
Return to normal operations
• Completion and cessation of drought actions (S & QUU)
• Contact Seqwater emergency response hotline to close out incident as per ERP (S)
• As per level 1 but advising of exit (S & QUU)
• Drought exit communications (QUU)
• Reopen standpipe (QUU)
• Revoke water restrictions (QUU)
Water sourceCease carting water (S)
• Review and debrief (S & QUU)
• Update the Beaudesert disruption plan (S)
S= Seqwater, QUU= Queensland Urban Utilities
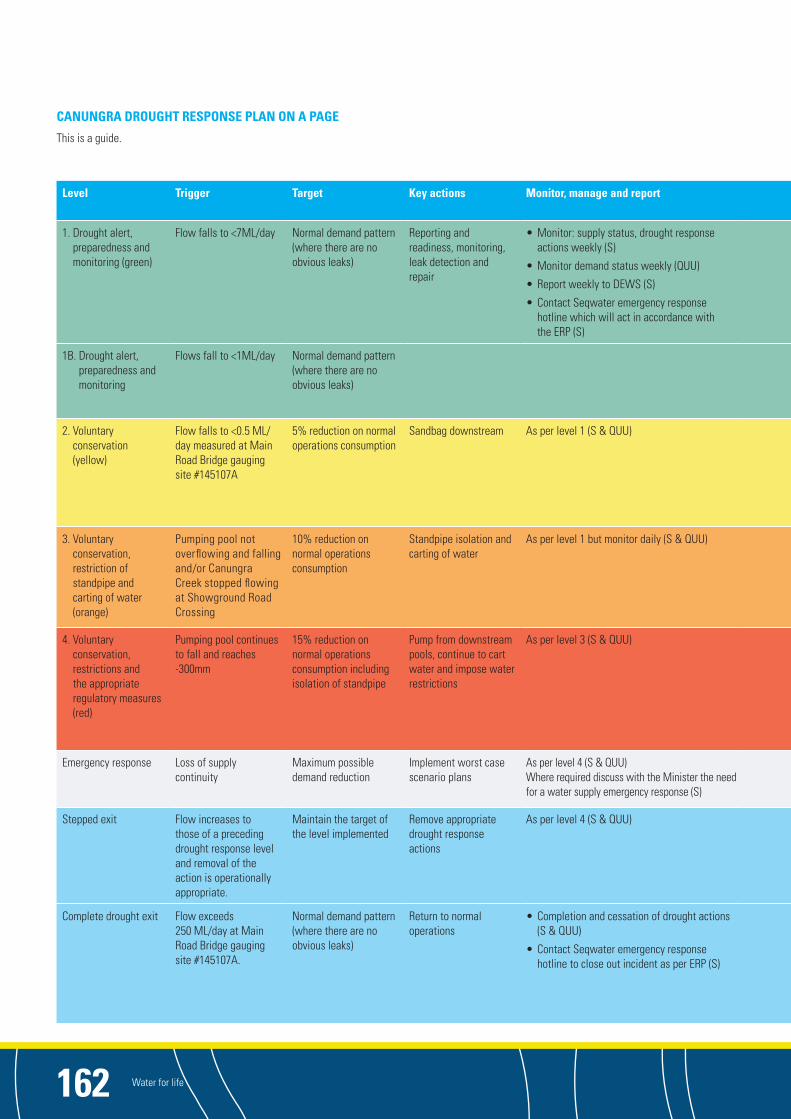
Water for life162
Level Trigger Target Key actions Monitor, manage and report Communications Restrictions (standpipe and community)
Water source Preparation for future levels
1. Drought alert, preparedness and monitoring (green)
Flow falls to <7ML/day Normal demand pattern (where there are no obvious leaks)
Reporting and readiness, monitoring, leak detection and repair
• Monitor: supply status, drought response actions weekly (S)
• Monitor demand status weekly (QUU)
• Report weekly to DEWS (S)
• Contact Seqwater emergency response hotline which will act in accordance with the ERP (S)
• Advise Scenic Rim Regional Council and other major customers of the supply status (QUU)
• Advise irrigators of town actions (S)
Monitor standpipe use (QUU) Nil Update DRP contact list and review actions (S)
1B. Drought alert, preparedness and monitoring
Flows fall to <1ML/day Normal demand pattern (where there are no obvious leaks)
• Communications planning (S & QUU)
• Check water carter availability and suitable access to draw points (S)
• Approval to sandbag downstream (S)
2. Voluntary conservation (yellow)
Flow falls to <0.5 ML/day measured at Main Road Bridge gauging site #145107A
5% reduction on normal operations consumption
Sandbag downstream As per level 1 (S & QUU) • As per level 1 (S & QUU)
• Commence low level public communications (QUU)
• Advise standpipe users of restriction at next level (QUU)
Monitor standpipe use (QUU) Sandbag downstream of intake to provide pumping pool and protect from possible water quality issues. (S)
• Communications planning (QUU)
• Make necessary arrangements for water carters to cart water to Canungra (S)
3. Voluntary conservation, restriction of standpipe and carting of water (orange)
Pumping pool not overflowing and falling and/or Canungra Creek stopped flowing at Showground Road Crossing
10% reduction on normal operations consumption
Standpipe isolation and carting of water
As per level 1 but monitor daily (S & QUU) • As per level 2 (S & QUU)
• Increased communications (QUU)
Standpipe restriction (QUU) • Retain sandbagging operation (S)
• Commence water carting to minimise water loss in the pumping pool (S)
• Communications planning (QUU)
• Obtain approval to pump water from downstream pools upstream (S)
• Obtain approval to impose water restrictions schedule (QUU)
4. Voluntary conservation, restrictions and the appropriate regulatory measures (red)
Pumping pool continues to fall and reaches -300mm
15% reduction on normal operations consumption including isolation of standpipe
Pump from downstream pools, continue to cart water and impose water restrictions
As per level 3 (S & QUU) As per level 3 (S & QUU) • Standpipe isolation (QUU)
• Impose water restrictions on customers (QUU)
• Retain sandbags (S)
• Continue and increase water carting (S)
• Commence pumping water from downstream pools (S)
Emergency response• Communications planning (QUU)
• Determine and prepare for emergency response (S & QUU)
Drought exit• Communications planning (QUU)
Emergency response Loss of supply continuity
Maximum possible demand reduction
Implement worst case scenario plans
As per level 4 (S & QUU)Where required discuss with the Minister the need for a water supply emergency response (S)
As per level 4 (S & QUU) • Standpipe remains isolated (QUU)
• Retain and possibly increase severity of water restrictions (QUU)
Implement appropriate worst case scenario plans (S & QUU)
Continue emergency response planning (S & QUU)
Stepped exit Flow increases to those of a preceding drought response level and removal of the action is operationally appropriate.
Maintain the target of the level implemented
Remove appropriate drought response actions
As per level 4 (S & QUU) As per level 4 (S & QUU) • Standpipe remains isolated (QUU)
• Retain restrictions (QUU)
As per level implemented (S & QUU)
Emergency response• Continue emergency response planning
(S & QUU)
Drought exit /re-entry to other levels• Communications planning (QUU)
Complete drought exit Flow exceeds 250 ML/day at Main Road Bridge gauging site #145107A.
Normal demand pattern (where there are no obvious leaks)
Return to normal operations
• Completion and cessation of drought actions (S & QUU)
• Contact Seqwater emergency response hotline to close out incident as per ERP (S)
• As per level 1 but advising of exit (S & QUU)
• Drought exit communications (QUU)
• Re-open standpipe (QUU)
• Revoke water restrictions (QUU)
Water source• Cease carting water
(S)
• Remove sandbags (S)
• Remove pumps and pipes from downstream (S)
• Review and debrief (S & QUU)• Update the Canungra Disruption Plan (S)
CANUNGRA DROUGHT RESPONSE PLAN ON A PAGE
This is a guide.

South East Queensland’s Water Security Program 2015-2045 163
Level Trigger Target Key actions Monitor, manage and report Communications Restrictions (standpipe and community)
Water source Preparation for future levels
1. Drought alert, preparedness and monitoring (green)
Flow falls to <7ML/day Normal demand pattern (where there are no obvious leaks)
Reporting and readiness, monitoring, leak detection and repair
• Monitor: supply status, drought response actions weekly (S)
• Monitor demand status weekly (QUU)
• Report weekly to DEWS (S)
• Contact Seqwater emergency response hotline which will act in accordance with the ERP (S)
• Advise Scenic Rim Regional Council and other major customers of the supply status (QUU)
• Advise irrigators of town actions (S)
Monitor standpipe use (QUU) Nil Update DRP contact list and review actions (S)
1B. Drought alert, preparedness and monitoring
Flows fall to <1ML/day Normal demand pattern (where there are no obvious leaks)
• Communications planning (S & QUU)
• Check water carter availability and suitable access to draw points (S)
• Approval to sandbag downstream (S)
2. Voluntary conservation (yellow)
Flow falls to <0.5 ML/day measured at Main Road Bridge gauging site #145107A
5% reduction on normal operations consumption
Sandbag downstream As per level 1 (S & QUU) • As per level 1 (S & QUU)
• Commence low level public communications (QUU)
• Advise standpipe users of restriction at next level (QUU)
Monitor standpipe use (QUU) Sandbag downstream of intake to provide pumping pool and protect from possible water quality issues. (S)
• Communications planning (QUU)
• Make necessary arrangements for water carters to cart water to Canungra (S)
3. Voluntary conservation, restriction of standpipe and carting of water (orange)
Pumping pool not overflowing and falling and/or Canungra Creek stopped flowing at Showground Road Crossing
10% reduction on normal operations consumption
Standpipe isolation and carting of water
As per level 1 but monitor daily (S & QUU) • As per level 2 (S & QUU)
• Increased communications (QUU)
Standpipe restriction (QUU) • Retain sandbagging operation (S)
• Commence water carting to minimise water loss in the pumping pool (S)
• Communications planning (QUU)
• Obtain approval to pump water from downstream pools upstream (S)
• Obtain approval to impose water restrictions schedule (QUU)
4. Voluntary conservation, restrictions and the appropriate regulatory measures (red)
Pumping pool continues to fall and reaches -300mm
15% reduction on normal operations consumption including isolation of standpipe
Pump from downstream pools, continue to cart water and impose water restrictions
As per level 3 (S & QUU) As per level 3 (S & QUU) • Standpipe isolation (QUU)
• Impose water restrictions on customers (QUU)
• Retain sandbags (S)
• Continue and increase water carting (S)
• Commence pumping water from downstream pools (S)
Emergency response• Communications planning (QUU)
• Determine and prepare for emergency response (S & QUU)
Drought exit• Communications planning (QUU)
Emergency response Loss of supply continuity
Maximum possible demand reduction
Implement worst case scenario plans
As per level 4 (S & QUU)Where required discuss with the Minister the need for a water supply emergency response (S)
As per level 4 (S & QUU) • Standpipe remains isolated (QUU)
• Retain and possibly increase severity of water restrictions (QUU)
Implement appropriate worst case scenario plans (S & QUU)
Continue emergency response planning (S & QUU)
Stepped exit Flow increases to those of a preceding drought response level and removal of the action is operationally appropriate.
Maintain the target of the level implemented
Remove appropriate drought response actions
As per level 4 (S & QUU) As per level 4 (S & QUU) • Standpipe remains isolated (QUU)
• Retain restrictions (QUU)
As per level implemented (S & QUU)
Emergency response• Continue emergency response planning
(S & QUU)
Drought exit /re-entry to other levels• Communications planning (QUU)
Complete drought exit Flow exceeds 250 ML/day at Main Road Bridge gauging site #145107A.
Normal demand pattern (where there are no obvious leaks)
Return to normal operations
• Completion and cessation of drought actions (S & QUU)
• Contact Seqwater emergency response hotline to close out incident as per ERP (S)
• As per level 1 but advising of exit (S & QUU)
• Drought exit communications (QUU)
• Re-open standpipe (QUU)
• Revoke water restrictions (QUU)
Water source• Cease carting water
(S)
• Remove sandbags (S)
• Remove pumps and pipes from downstream (S)
• Review and debrief (S & QUU)• Update the Canungra Disruption Plan (S)
S= Seqwater, QUU= Queensland Urban Utilities

Water for life164
Level Trigger Target Key actions Monitor, manage and report Communications Restrictions (standpipe and community)
Water source Preparation for future levels
1. Drought alert, preparedness and monitoring (green)
No water flowing over the weir
Normal demand pattern (where there are no obvious system leaks)
Reporting and readiness, monitoring, leak detection and repair
• Monitor: supply status, drought response actions weekly (S)
• Monitor demand status weekly (QUU)
• Report weekly to DEWS (S)
• Contact Seqwater emergency response hotline which will act in accordance with the ERP (S)
Advise Somerset Regional Council and other major customers of the supply status (QUU)
Monitor hydrant standpipe use (QUU) Nil Update contact list and review actions (S)
2. Voluntary conservation (yellow)
N/A
3. Voluntary conservation, restriction of standpipe and carting of water (orange)
The Big Hole is 8m below normal operating level
10% reduction on normal operations consumption
Hydrant standpipe prohibition, communications plan and carting of water
As per level 1 but monitor daily (S & QUU) • As per level 1 (S & QUU)
• Commence public communications (QUU)
Hydrant standpipe prohibition (QUU) Commence water carting (S)
Communications planning (QUU)
4. Restrictions and the appropriate regulatory measures (red)
Water carting source is under water restrictions OR not maintaining supply.
140 L/p/day (residential) Continue to cart water and impose water restrictions (as per water source)
As per level 3 (S & QUU) As per level 3 (S & QUU) • Hydrant standpipe prohibition (QUU)
• Impose water restrictions on customers (QUU)
Continue and increase water carting (S)
Emergency response• Align with source water drought response plan
(S & QUU)
Drought exit• Communications planning (QUU)
Emergency response 5% capacity Maroon Dam
Maximum reduction (100 L/p/day residential and non-residential combined)
Implement worst case scenario plans
As per level 4 (S & QUU)
Where required discuss with the Minister the need for a water supply emergency response (S)
As per level 4 (S & QUU) • Standpipe remains isolated (QUU)
• Retain and possibly increase severity of water restrictions (QUU)
Implement appropriate worst case scenario plans (S & QUU)
Continue emergency response planning (S & QUU)
Stepped exit Water supply level of a preceding drought response level and removal of the action is operationally appropriate
Maintain the target of the level implemented
Remove appropriate drought response actions
As per level 4 (S & QUU) As per level 4 (S & QUU) • Standpipe remains restricted (QUU)
• Retain restrictions (QUU)
As per level implemented (S & QUU)
Emergency response• Continue emergency response planning
(S & QUU)
Drought exit/re-entry to other levels• Communications planning (QUU)
Complete drought exit Big Hole replenished and weir overflowing
Normal demand pattern (where there are no obvious leaks)
Return to normal operations
• Completion and cessation of drought actions (S & QUU)
• Contact Seqwater emergency response hotline to close out incident as per ERP (S)
• As per level 1 but advising of exit (S & QUU)
• Drought exit communications (QUU)
• Remove hydrant standpipe prohibition (QUU)
• Revoke water restrictions (QUU)
Cease carting water (S) • Review and debrief (S & QUU)
• Update the Jimna disruption plan (S)
JIMNA DROUGHT RESPONSE PLAN ON A PAGE
This is a guide.

South East Queensland’s Water Security Program 2015-2045 165
Level Trigger Target Key actions Monitor, manage and report Communications Restrictions (standpipe and community)
Water source Preparation for future levels
1. Drought alert, preparedness and monitoring (green)
No water flowing over the weir
Normal demand pattern (where there are no obvious system leaks)
Reporting and readiness, monitoring, leak detection and repair
• Monitor: supply status, drought response actions weekly (S)
• Monitor demand status weekly (QUU)
• Report weekly to DEWS (S)
• Contact Seqwater emergency response hotline which will act in accordance with the ERP (S)
Advise Somerset Regional Council and other major customers of the supply status (QUU)
Monitor hydrant standpipe use (QUU) Nil Update contact list and review actions (S)
2. Voluntary conservation (yellow)
N/A
3. Voluntary conservation, restriction of standpipe and carting of water (orange)
The Big Hole is 8m below normal operating level
10% reduction on normal operations consumption
Hydrant standpipe prohibition, communications plan and carting of water
As per level 1 but monitor daily (S & QUU) • As per level 1 (S & QUU)
• Commence public communications (QUU)
Hydrant standpipe prohibition (QUU) Commence water carting (S)
Communications planning (QUU)
4. Restrictions and the appropriate regulatory measures (red)
Water carting source is under water restrictions OR not maintaining supply.
140 L/p/day (residential) Continue to cart water and impose water restrictions (as per water source)
As per level 3 (S & QUU) As per level 3 (S & QUU) • Hydrant standpipe prohibition (QUU)
• Impose water restrictions on customers (QUU)
Continue and increase water carting (S)
Emergency response• Align with source water drought response plan
(S & QUU)
Drought exit• Communications planning (QUU)
Emergency response 5% capacity Maroon Dam
Maximum reduction (100 L/p/day residential and non-residential combined)
Implement worst case scenario plans
As per level 4 (S & QUU)
Where required discuss with the Minister the need for a water supply emergency response (S)
As per level 4 (S & QUU) • Standpipe remains isolated (QUU)
• Retain and possibly increase severity of water restrictions (QUU)
Implement appropriate worst case scenario plans (S & QUU)
Continue emergency response planning (S & QUU)
Stepped exit Water supply level of a preceding drought response level and removal of the action is operationally appropriate
Maintain the target of the level implemented
Remove appropriate drought response actions
As per level 4 (S & QUU) As per level 4 (S & QUU) • Standpipe remains restricted (QUU)
• Retain restrictions (QUU)
As per level implemented (S & QUU)
Emergency response• Continue emergency response planning
(S & QUU)
Drought exit/re-entry to other levels• Communications planning (QUU)
Complete drought exit Big Hole replenished and weir overflowing
Normal demand pattern (where there are no obvious leaks)
Return to normal operations
• Completion and cessation of drought actions (S & QUU)
• Contact Seqwater emergency response hotline to close out incident as per ERP (S)
• As per level 1 but advising of exit (S & QUU)
• Drought exit communications (QUU)
• Remove hydrant standpipe prohibition (QUU)
• Revoke water restrictions (QUU)
Cease carting water (S) • Review and debrief (S & QUU)
• Update the Jimna disruption plan (S)
S= Seqwater, QUU= Queensland Urban Utilities

Water for life166
Level Trigger Target Key actions Monitor, manage and report Communications Restrictions (standpipe and community)
Water source Preparation for future levels
1. Drought alert, preparedness and monitoring (green)
50% capacity Moogerah Dam
Normal demand pattern (where there are no obvious leaks)
Reporting and readiness, monitoring, leak detection and repair
• Monitor: supply status, drought response actions weekly (S)
• Monitor demand status weekly (QUU)
• Report weekly to DEWS (S)
• Contact Seqwater emergency response hotline which will act in accordance with the ERP (S)
• Advise Scenic Rim Regional Council and other major customers of the supply status (QUU)
• Advise irrigators of town actions if required (S)
Monitor standpipe use (QUU) Nil Update DRP contact list and review actions (S)
2. Voluntary conservation (yellow)
25% capacity Moogerah Dam
5% reduction on normal operations consumption
• Communications
• Leak detection and repair
As per level 1 (S & QUU) • As per level 1 (S & QUU)
• Commence low level public communications (QUU)
• Advise standpipe users of restriction at next level (QUU)
Monitor standpipe use (QUU) • Communications planning (QUU)
• Make necessary arrangements for water carters to cart water to Boonah-Kalbar (S)
3. Voluntary conservation, restriction of standpipe and carting of water (orange)
15% capacity Moogerah Dam
150 L/p/day residential demand
Standpipe isolation and carting of water
As per level 1 but monitor daily (S & QUU) • As per level 2 (S & QUU)
• Increased communications (QUU)
Standpipe restriction (QUU) Commence water carting to supplement supply (S)
• Communications planning (QUU)
• Obtain approval to impose water restrictions schedule (QUU)
4. Voluntary conservation, restrictions and the appropriate regulatory measures (red)
10% capacity Moogerah Dam
140 L/p/day residential demand including isolation of standpipe
Continue to cart water and impose water restrictions
As per level 3 (S & QUU) As per level 3 (S & QUU) • Standpipe isolation (QUU)
• Impose water restrictions on customers (QUU)
Continue and increase water carting (S)
Emergency response• Communications planning (QUU)
• Determine and prepare for emergency response (S & QUU)
Drought exit• Communications planning (QUU)
4a. Further water restrictions
7.5% capacity Moogerah Dam
130 L/p/day residential demand
Further water supply restrictions and continue to cart
As per level 3 (S & QUU) As per level 3 (S & QUU) Impose further water restrictions (QUU) As per level 3 (S & QUU)
As per level 3 (S & QUU)
Emergency response 5% capacity Moogerah Dam
Maximum possible demand reduction
Implement worst case scenario plans
As per level 4 (S & QUU)
Where required discuss with the Minister the need for a water supply emergency response (S)
As per level 4 (S & QUU) • Standpipe remains isolated (QUU)
• Retain and possibly increase severity of water restrictions (QUU)
Implement appropriate worst case scenario plans (S & QUU)
Continue emergency response planning (S & QUU)
Stepped exit Water supply of a preceding drought response level and removal of the action is operationally appropriate
Maintain the target of the level implemented
Remove appropriate drought response actions
As per level 4 (S & QUU) As per level 4 (S & QUU) • Standpipe remains isolated (QUU)
• Retain restrictions (QUU)
As per level implemented (S & QUU)
Emergency response• Continue emergency response planning
(S & QUU)
Drought exit/re-entry to other levels• Communications planning (QUU)
Complete drought exit 60% capacity Moogerah Dam
Normal demand pattern (where there are no obvious leaks)
Return to normal operations
• Completion and cessation of drought actions (S & QUU)
• Contact Seqwater emergency response hotline to close out incident as per ERP (S)
• As per level 1 but advising of exit (S & QUU)
• Drought exit communications (QUU)
• Re-open standpipe (QUU)
• Revoke water restrictions (QUU)
Water source• Cease carting
water (S)
• Remove sandbags (S)
• Remove pumps and pipes from downstream (S)
• Review and debrief (S & QUU)
• Update the Boonah-Kalbar disruption plan (S)
BOONAH-KALBAR DROUGHT RESPONSE PLAN ON A PAGE
This is a guide.

South East Queensland’s Water Security Program 2015-2045 167
Level Trigger Target Key actions Monitor, manage and report Communications Restrictions (standpipe and community)
Water source Preparation for future levels
1. Drought alert, preparedness and monitoring (green)
50% capacity Moogerah Dam
Normal demand pattern (where there are no obvious leaks)
Reporting and readiness, monitoring, leak detection and repair
• Monitor: supply status, drought response actions weekly (S)
• Monitor demand status weekly (QUU)
• Report weekly to DEWS (S)
• Contact Seqwater emergency response hotline which will act in accordance with the ERP (S)
• Advise Scenic Rim Regional Council and other major customers of the supply status (QUU)
• Advise irrigators of town actions if required (S)
Monitor standpipe use (QUU) Nil Update DRP contact list and review actions (S)
2. Voluntary conservation (yellow)
25% capacity Moogerah Dam
5% reduction on normal operations consumption
• Communications
• Leak detection and repair
As per level 1 (S & QUU) • As per level 1 (S & QUU)
• Commence low level public communications (QUU)
• Advise standpipe users of restriction at next level (QUU)
Monitor standpipe use (QUU) • Communications planning (QUU)
• Make necessary arrangements for water carters to cart water to Boonah-Kalbar (S)
3. Voluntary conservation, restriction of standpipe and carting of water (orange)
15% capacity Moogerah Dam
150 L/p/day residential demand
Standpipe isolation and carting of water
As per level 1 but monitor daily (S & QUU) • As per level 2 (S & QUU)
• Increased communications (QUU)
Standpipe restriction (QUU) Commence water carting to supplement supply (S)
• Communications planning (QUU)
• Obtain approval to impose water restrictions schedule (QUU)
4. Voluntary conservation, restrictions and the appropriate regulatory measures (red)
10% capacity Moogerah Dam
140 L/p/day residential demand including isolation of standpipe
Continue to cart water and impose water restrictions
As per level 3 (S & QUU) As per level 3 (S & QUU) • Standpipe isolation (QUU)
• Impose water restrictions on customers (QUU)
Continue and increase water carting (S)
Emergency response• Communications planning (QUU)
• Determine and prepare for emergency response (S & QUU)
Drought exit• Communications planning (QUU)
4a. Further water restrictions
7.5% capacity Moogerah Dam
130 L/p/day residential demand
Further water supply restrictions and continue to cart
As per level 3 (S & QUU) As per level 3 (S & QUU) Impose further water restrictions (QUU) As per level 3 (S & QUU)
As per level 3 (S & QUU)
Emergency response 5% capacity Moogerah Dam
Maximum possible demand reduction
Implement worst case scenario plans
As per level 4 (S & QUU)
Where required discuss with the Minister the need for a water supply emergency response (S)
As per level 4 (S & QUU) • Standpipe remains isolated (QUU)
• Retain and possibly increase severity of water restrictions (QUU)
Implement appropriate worst case scenario plans (S & QUU)
Continue emergency response planning (S & QUU)
Stepped exit Water supply of a preceding drought response level and removal of the action is operationally appropriate
Maintain the target of the level implemented
Remove appropriate drought response actions
As per level 4 (S & QUU) As per level 4 (S & QUU) • Standpipe remains isolated (QUU)
• Retain restrictions (QUU)
As per level implemented (S & QUU)
Emergency response• Continue emergency response planning
(S & QUU)
Drought exit/re-entry to other levels• Communications planning (QUU)
Complete drought exit 60% capacity Moogerah Dam
Normal demand pattern (where there are no obvious leaks)
Return to normal operations
• Completion and cessation of drought actions (S & QUU)
• Contact Seqwater emergency response hotline to close out incident as per ERP (S)
• As per level 1 but advising of exit (S & QUU)
• Drought exit communications (QUU)
• Re-open standpipe (QUU)
• Revoke water restrictions (QUU)
Water source• Cease carting
water (S)
• Remove sandbags (S)
• Remove pumps and pipes from downstream (S)
• Review and debrief (S & QUU)
• Update the Boonah-Kalbar disruption plan (S)
S= Seqwater, QUU= Queensland Urban Utilities
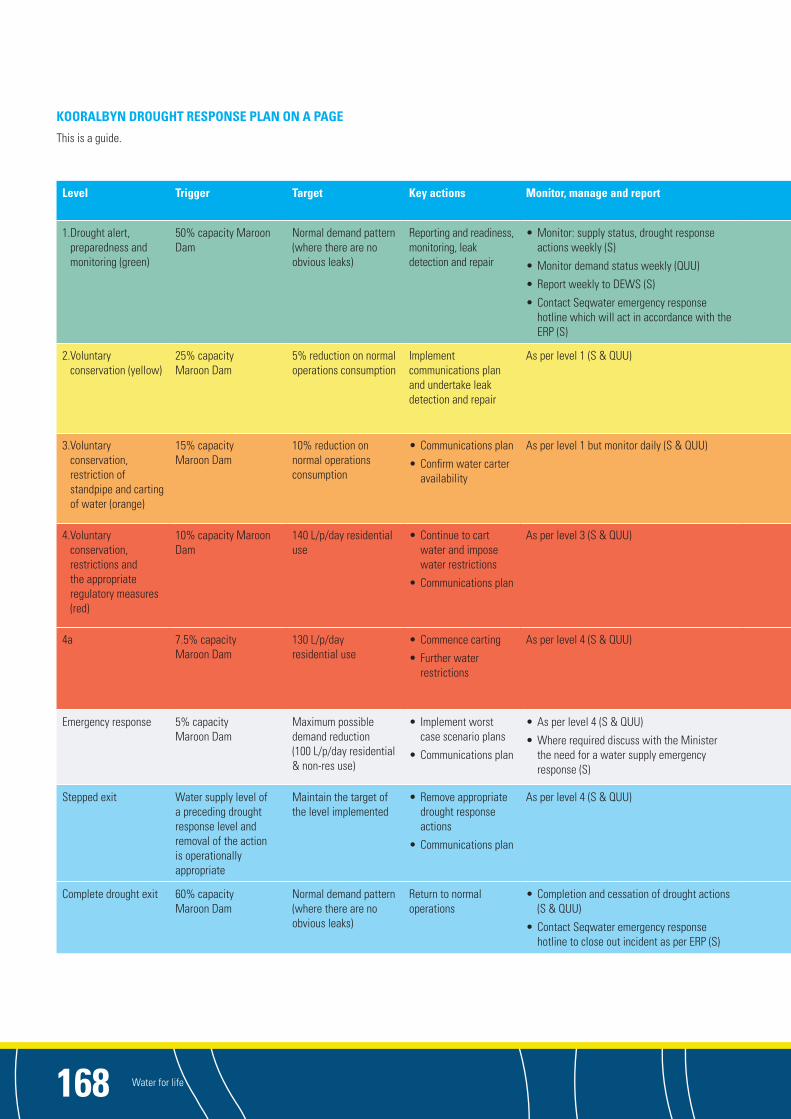
Water for life168
Level Trigger Target Key actions Monitor, manage and report Communications Restrictions (standpipe and community)
Water source Preparation for future levels
1. Drought alert, preparedness and monitoring (green)
50% capacity Maroon Dam
Normal demand pattern (where there are no obvious leaks)
Reporting and readiness, monitoring, leak detection and repair
• Monitor: supply status, drought response actions weekly (S)
• Monitor demand status weekly (QUU)
• Report weekly to DEWS (S)
• Contact Seqwater emergency response hotline which will act in accordance with the ERP (S)
• Advise Scenic Rim Regional Council and other major customers of the supply status (QUU)
• Advise irrigators of town actions (S)
Monitor standpipe use (QUU) Nil Update DRP contact list and review actions (S)
2. Voluntary conservation (yellow)
25% capacity Maroon Dam
5% reduction on normal operations consumption
Implement communications plan and undertake leak detection and repair
As per level 1 (S & QUU) • As per level 1 (S & QUU)
• Commence low level public communications (QUU)
• Advise standpipe users of restriction at next level (QUU)
Communications planning (QUU)
3. Voluntary conservation, restriction of standpipe and carting of water (orange)
15% capacity Maroon Dam
10% reduction on normal operations consumption
• Communications plan
• Confirm water carter availability
As per level 1 but monitor daily (S & QUU) • As per level 2 (S & QUU)
• Increased communications (QUU)
• Communications planning (QUU)
• Make necessary arrangements for water carters to cart water to Kooralbyn (S)
• Obtain approval to impose water restrictions schedule (QUU)
4. Voluntary conservation, restrictions and the appropriate regulatory measures (red)
10% capacity Maroon Dam
140 L/p/day residential use
• Continue to cart water and impose water restrictions
• Communications plan
As per level 3 (S & QUU) As per level 3 (S & QUU) Impose water restrictions on customers (QUU)
Commence water carting (S)
Emergency response• Communications planning (QUU)
• Determine and prepare for emergency response (S & QUU)
Drought exit• Communications planning (QUU)
4a 7.5% capacity Maroon Dam
130 L/p/day residential use
• Commence carting
• Further water restrictions
As per level 4 (S & QUU) • As per level 4 (S & QUU)
• Increased communications (QUU)
Increase water restrictions on customers (QUU)
Continue water carting (S)
As per level 4 (S & QUU)
Emergency response 5% capacity Maroon Dam
Maximum possible demand reduction (100 L/p/day residential & non-res use)
• Implement worst case scenario plans
• Communications plan
• As per level 4 (S & QUU)
• Where required discuss with the Minister the need for a water supply emergency response (S)
As per level 4 (S & QUU) Retain and possibly increase severity of water restrictions (QUU)
Implement appropriate worst case scenario plans (S & QUU)
Continue emergency response planning (S & QUU)
Stepped exit Water supply level of a preceding drought response level and removal of the action is operationally appropriate
Maintain the target of the level implemented
• Remove appropriate drought response actions
• Communications plan
As per level 4 (S & QUU) As per level 4 (S & QUU) Retain restrictions (QUU) As per level implemented (S & QUU)
Emergency response• Continue emergency response planning
(S & QUU)
Drought exit/re-entry to other levels• Communications planning (QUU)
Complete drought exit 60% capacity Maroon Dam
Normal demand pattern (where there are no obvious leaks)
Return to normal operations
• Completion and cessation of drought actions (S & QUU)
• Contact Seqwater emergency response hotline to close out incident as per ERP (S)
• As per level 1 but advising of exit (S & QUU)
• Drought exit communications (QUU)
Revoke water restrictions (QUU) Water sourceCease carting water (S)
• Review and debrief (S & QUU)
• Update the Kooralbyn disruption plan (S)
KOORALBYN DROUGHT RESPONSE PLAN ON A PAGE
This is a guide.

South East Queensland’s Water Security Program 2015-2045 169
Level Trigger Target Key actions Monitor, manage and report Communications Restrictions (standpipe and community)
Water source Preparation for future levels
1. Drought alert, preparedness and monitoring (green)
50% capacity Maroon Dam
Normal demand pattern (where there are no obvious leaks)
Reporting and readiness, monitoring, leak detection and repair
• Monitor: supply status, drought response actions weekly (S)
• Monitor demand status weekly (QUU)
• Report weekly to DEWS (S)
• Contact Seqwater emergency response hotline which will act in accordance with the ERP (S)
• Advise Scenic Rim Regional Council and other major customers of the supply status (QUU)
• Advise irrigators of town actions (S)
Monitor standpipe use (QUU) Nil Update DRP contact list and review actions (S)
2. Voluntary conservation (yellow)
25% capacity Maroon Dam
5% reduction on normal operations consumption
Implement communications plan and undertake leak detection and repair
As per level 1 (S & QUU) • As per level 1 (S & QUU)
• Commence low level public communications (QUU)
• Advise standpipe users of restriction at next level (QUU)
Communications planning (QUU)
3. Voluntary conservation, restriction of standpipe and carting of water (orange)
15% capacity Maroon Dam
10% reduction on normal operations consumption
• Communications plan
• Confirm water carter availability
As per level 1 but monitor daily (S & QUU) • As per level 2 (S & QUU)
• Increased communications (QUU)
• Communications planning (QUU)
• Make necessary arrangements for water carters to cart water to Kooralbyn (S)
• Obtain approval to impose water restrictions schedule (QUU)
4. Voluntary conservation, restrictions and the appropriate regulatory measures (red)
10% capacity Maroon Dam
140 L/p/day residential use
• Continue to cart water and impose water restrictions
• Communications plan
As per level 3 (S & QUU) As per level 3 (S & QUU) Impose water restrictions on customers (QUU)
Commence water carting (S)
Emergency response• Communications planning (QUU)
• Determine and prepare for emergency response (S & QUU)
Drought exit• Communications planning (QUU)
4a 7.5% capacity Maroon Dam
130 L/p/day residential use
• Commence carting
• Further water restrictions
As per level 4 (S & QUU) • As per level 4 (S & QUU)
• Increased communications (QUU)
Increase water restrictions on customers (QUU)
Continue water carting (S)
As per level 4 (S & QUU)
Emergency response 5% capacity Maroon Dam
Maximum possible demand reduction (100 L/p/day residential & non-res use)
• Implement worst case scenario plans
• Communications plan
• As per level 4 (S & QUU)
• Where required discuss with the Minister the need for a water supply emergency response (S)
As per level 4 (S & QUU) Retain and possibly increase severity of water restrictions (QUU)
Implement appropriate worst case scenario plans (S & QUU)
Continue emergency response planning (S & QUU)
Stepped exit Water supply level of a preceding drought response level and removal of the action is operationally appropriate
Maintain the target of the level implemented
• Remove appropriate drought response actions
• Communications plan
As per level 4 (S & QUU) As per level 4 (S & QUU) Retain restrictions (QUU) As per level implemented (S & QUU)
Emergency response• Continue emergency response planning
(S & QUU)
Drought exit/re-entry to other levels• Communications planning (QUU)
Complete drought exit 60% capacity Maroon Dam
Normal demand pattern (where there are no obvious leaks)
Return to normal operations
• Completion and cessation of drought actions (S & QUU)
• Contact Seqwater emergency response hotline to close out incident as per ERP (S)
• As per level 1 but advising of exit (S & QUU)
• Drought exit communications (QUU)
Revoke water restrictions (QUU) Water sourceCease carting water (S)
• Review and debrief (S & QUU)
• Update the Kooralbyn disruption plan (S)
S= Seqwater, QUU= Queensland Urban Utilities

Water for life170
Level Trigger Target Key actions Monitor, manage and report Communications Restrictions (standpipe and community)
Water source Preparation for future levels
1. Drought alert, preparedness and monitoring (green)
N/A water is already being carted as business as usual
2. Voluntary conservation (yellow)
N/A water is already being carted as business as usual
3. Voluntary conservation, restriction of standpipe and carting of water (orange)
N/A water is already being carted as business as usual
4. Restrictions and the appropriate regulatory measures (red)
Water carting source is under water restrictions OR carting not maintaining supply and reticulation reservoir is less than 50% full
140 L/p/day residential demand
Continue to cart water and impose water restrictions (as per water source)
• Monitor: supply status, drought response actions weekly (S)
• Monitor demand status weekly (QUU)
• Report weekly to DEWS (S)
• Contact Seqwater emergency response hotline who will act in accordance with the ERP (S)
• Advise Somerset Regional Council and other major customers of the supply status (QUU)
• Commence public communications (QUU)
• Hydrant standpipe prohibition (QUU)
• Impose water restrictions on customers (QUU)
Continue and increase water carting (S)
Emergency response• Align with source water drought
response plan (S & QUU)
Drought exit• Communications planning (QUU)
Complete drought exit Drought exit for source water location has occurred
Normal demand pattern (where there are no obvious leaks)
Return to normal operations
• Completion and cessation of drought actions (S & QUU)
• Advise Seqwater emergency response hotline to close out incident as per ERP (S)
• As per level 1 but advising of exit (S & QUU)
• Drought exit communications (QUU)
• Remove hydrant standpipe prohibition (QUU)
• Revoke water restrictions (QUU)
Water sourceCease carting water (S)
• Review and debrief (S & QUU)
• Update the Linville disruption plan (S)
LINVILLE DROUGHT RESPONSE PLAN ON A PAGE
This is a guide.

South East Queensland’s Water Security Program 2015-2045 171
Level Trigger Target Key actions Monitor, manage and report Communications Restrictions (standpipe and community)
Water source Preparation for future levels
1. Drought alert, preparedness and monitoring (green)
N/A water is already being carted as business as usual
2. Voluntary conservation (yellow)
N/A water is already being carted as business as usual
3. Voluntary conservation, restriction of standpipe and carting of water (orange)
N/A water is already being carted as business as usual
4. Restrictions and the appropriate regulatory measures (red)
Water carting source is under water restrictions OR carting not maintaining supply and reticulation reservoir is less than 50% full
140 L/p/day residential demand
Continue to cart water and impose water restrictions (as per water source)
• Monitor: supply status, drought response actions weekly (S)
• Monitor demand status weekly (QUU)
• Report weekly to DEWS (S)
• Contact Seqwater emergency response hotline who will act in accordance with the ERP (S)
• Advise Somerset Regional Council and other major customers of the supply status (QUU)
• Commence public communications (QUU)
• Hydrant standpipe prohibition (QUU)
• Impose water restrictions on customers (QUU)
Continue and increase water carting (S)
Emergency response• Align with source water drought
response plan (S & QUU)
Drought exit• Communications planning (QUU)
Complete drought exit Drought exit for source water location has occurred
Normal demand pattern (where there are no obvious leaks)
Return to normal operations
• Completion and cessation of drought actions (S & QUU)
• Advise Seqwater emergency response hotline to close out incident as per ERP (S)
• As per level 1 but advising of exit (S & QUU)
• Drought exit communications (QUU)
• Remove hydrant standpipe prohibition (QUU)
• Revoke water restrictions (QUU)
Water sourceCease carting water (S)
• Review and debrief (S & QUU)
• Update the Linville disruption plan (S)
S= Seqwater, QUU= Queensland Urban Utilities

Water for life172
Level Trigger Target Key actions Monitor, manage and report Communications Restrictions (standpipe and community)
Water source Preparation for future levels
1. Drought alert, preparedness and monitoring (green)
Groundwater (GW) observation bore 14400016 measures 15 mAHD
Normal demand pattern (where there are no obvious leaks)
Reporting and readiness, monitoring, leak detection and repair
• Monitor: supply status, drought response actions weekly (S)
• Monitor demand status weekly (RCC)
• Report weekly to DEWS (S)
• Contact Seqwater emergency response hotline which will act in accordance with the ERP (S)
Advise Redland City Council and other major customers of the supply status (RCC)
Nil Update DRP contact list and review actions (S)
2. Voluntary conservation (yellow)
GW observation bore 14400016 measures 10 mAHD
5% reduction on normal operations consumption
As per level 1 (S & RCC) • As per level 1 (S & RCC)
• Commence low level public communications (RCC)
• Advise standpipe users of restriction at next level (RCC)
Communications planning (RCC)
3. Voluntary conservation, restriction of standpipe and carting of water (orange)
N/A as carting is not a viable option and there are no standpipes at the North Stradbroke Island Water Treatment Plant
4. Voluntary conservation, restrictions and the appropriate regulatory measures (red)
GW observation bore 14400016 measures 4 mAHD OR GW observation bore 142634 measures 2 mAHD
15% reduction on normal operations consumption
Impose water restrictions
As per level 2 (S & RCC ) As per level 2 (S & RCC) Impose water restrictions on customers (RCC)
Emergency response• Communications planning (RCC)
• Determine and prepare for emergency response (S & RCC)
Drought exit• Communications planning (RCC)
4a. Further water restrictions (red)
GW observation bore 14400016 measures 3 mAHD OR GW observation bore 142634 measures 1.5 mAHD
20% reduction in demand
Increase water restrictions (RCC)
Emergency response Loss of supply continuity
Maximum possible demand reduction
Implement worst case scenario plans
As per level 4 (S & RCC)
Where required discuss with the Minister the need for a water supply emergency response (S)
As per level 4 (S & RCC) Retain and possibly increase severity of water restrictions (RCC)
Implement appropriate worst case scenario plans (S & RCC)
Continue emergency response planning (S & RCC)
Stepped exit N/A for North Stradbroke Island
Complete drought exit GW observation bore 14400016 measures 17 mAHD OR GW observation bore 142634 measures 8m AHD
Normal demand pattern (where there are no obvious leaks)
Return to normal operations
• Completion and cessation of drought actions (S & RCC)
• Contact Seqwater emergency response hotline to close out incident as per ERP (S)
• As per level 1 but advising of exit (S & RCC)
• Drought exit communications (RCC)
Revoke water restrictions (RCC) Cease carting water (S) • Review and debrief (S & RCC)
• Update the North Stradbroke Island disruption plan (S)
NORTH STRADBROKE ISLAND DROUGHT RESPONSE PLAN ON A PAGE [AMITY POINT, DUNWICH AND POINT LOOKOUT] AMITY POINT DROUGHT RESPONSE PLAN ON A PAGE
This is a guide.

South East Queensland’s Water Security Program 2015-2045 173
Level Trigger Target Key actions Monitor, manage and report Communications Restrictions (standpipe and community)
Water source Preparation for future levels
1. Drought alert, preparedness and monitoring (green)
Groundwater (GW) observation bore 14400016 measures 15 mAHD
Normal demand pattern (where there are no obvious leaks)
Reporting and readiness, monitoring, leak detection and repair
• Monitor: supply status, drought response actions weekly (S)
• Monitor demand status weekly (RCC)
• Report weekly to DEWS (S)
• Contact Seqwater emergency response hotline which will act in accordance with the ERP (S)
Advise Redland City Council and other major customers of the supply status (RCC)
Nil Update DRP contact list and review actions (S)
2. Voluntary conservation (yellow)
GW observation bore 14400016 measures 10 mAHD
5% reduction on normal operations consumption
As per level 1 (S & RCC) • As per level 1 (S & RCC)
• Commence low level public communications (RCC)
• Advise standpipe users of restriction at next level (RCC)
Communications planning (RCC)
3. Voluntary conservation, restriction of standpipe and carting of water (orange)
N/A as carting is not a viable option and there are no standpipes at the North Stradbroke Island Water Treatment Plant
4. Voluntary conservation, restrictions and the appropriate regulatory measures (red)
GW observation bore 14400016 measures 4 mAHD OR GW observation bore 142634 measures 2 mAHD
15% reduction on normal operations consumption
Impose water restrictions
As per level 2 (S & RCC ) As per level 2 (S & RCC) Impose water restrictions on customers (RCC)
Emergency response• Communications planning (RCC)
• Determine and prepare for emergency response (S & RCC)
Drought exit• Communications planning (RCC)
4a. Further water restrictions (red)
GW observation bore 14400016 measures 3 mAHD OR GW observation bore 142634 measures 1.5 mAHD
20% reduction in demand
Increase water restrictions (RCC)
Emergency response Loss of supply continuity
Maximum possible demand reduction
Implement worst case scenario plans
As per level 4 (S & RCC)
Where required discuss with the Minister the need for a water supply emergency response (S)
As per level 4 (S & RCC) Retain and possibly increase severity of water restrictions (RCC)
Implement appropriate worst case scenario plans (S & RCC)
Continue emergency response planning (S & RCC)
Stepped exit N/A for North Stradbroke Island
Complete drought exit GW observation bore 14400016 measures 17 mAHD OR GW observation bore 142634 measures 8m AHD
Normal demand pattern (where there are no obvious leaks)
Return to normal operations
• Completion and cessation of drought actions (S & RCC)
• Contact Seqwater emergency response hotline to close out incident as per ERP (S)
• As per level 1 but advising of exit (S & RCC)
• Drought exit communications (RCC)
Revoke water restrictions (RCC) Cease carting water (S) • Review and debrief (S & RCC)
• Update the North Stradbroke Island disruption plan (S)
S= Seqwater, RCC=Redland City Council

Water for life174
Level Trigger Target Key actions Monitor, manage and report Communications Restrictions (standpipe and community)
Water source Preparation for future levels
1. Drought alert, preparedness and monitoring (green)
Groundwater (GW) observation bore 14400016 measures 15mAHD
Normal demand pattern (where there are no obvious leaks)
Reporting and readiness, monitoring, leak detection and repair
• Monitor: supply status, drought response actions weekly (S)
• Monitor demand status weekly (RCC)
• Report weekly to DEWS (S)
• Contact Seqwater emergency response hotline who will act in accordance with the ERP (S)
Advise Redland City Council and other major customers of the supply status (RCC)
Nil Update DRP contact list and review actions (S)
2. Voluntary conservation (yellow)
GW observation bore 14400016 measures 10 mAHD OR GW observation bore 14400038 measures 4 mAHD
5% reduction on normal operations consumption
As per level 1 (S & RCC) • As per level 1 (S & RCC)
• Commence low level public communications (RCC)
• Advise standpipe users of restriction at next level (RCC)
Communications planning (RCC)
3. Voluntary conservation, restriction of standpipe and carting of water (orange)
N/A as carting is not a viable option and there are no standpipes at the North Stradbroke Island Water Treatment Plant
4. Voluntary conservation, restrictions and the appropriate regulatory measures (red)
GW observation bore 14400016 measures 4 mAHD OR GW observation bore 14400038 measures 2 mAHD
15% reduction on normal operations consumption
Impose water restrictions
As per level 2 (S & RCC ) As per level 2 (S & RCC) Impose water restrictions on customers (RCC)
Emergency response• Communications planning (RCC)
• Determine and prepare for emergency response (S & RCC)
Drought exit• Communications planning (RCC)
4a. Further water restrictions (red)
GW observation bore 14400016 measures 3 mAHD OR GW observation bore 14400038 measures 1.5 mAHD
20% reduction in demand
Increase water restrictions (RCC)
Emergency response Loss of supply continuity
Maximum possible demand reduction
Implement worst case scenario plans
As per level 4 (S & RCC)
Where required discuss with the Minister the need for a water supply emergency response (S)
As per level 4 (S & RCC) Retain and possibly increase severity of water restrictions (RCC)
Implement appropriate worst case scenario plans (S & RCC)
Continue emergency response planning (S & RCC)
Stepped exit NA for North Stradbroke Island
Complete drought exit GW observation bore 14400016 measures 17 mAHD OR GW observation bore 14400038 measures 8 mAHD
Normal demand pattern (where there are no obvious leaks)
Return to normal operations
• Completion and cessation of drought actions (S & RCC)
• Contact Seqwater emergency response hotline to close out incident as per ERP (S)
• As per level 1 but advising of exit (S & RCC)
• Drought exit communications (RCC)
Revoke water restrictions (RCC) Cease carting water (S) • Review and debrief (S& RCC)
• Update the North Stradbroke Island disruption plan (S)
DUNWICH DROUGHT RESPONSE PLAN ON A PAGE
This is a guide.
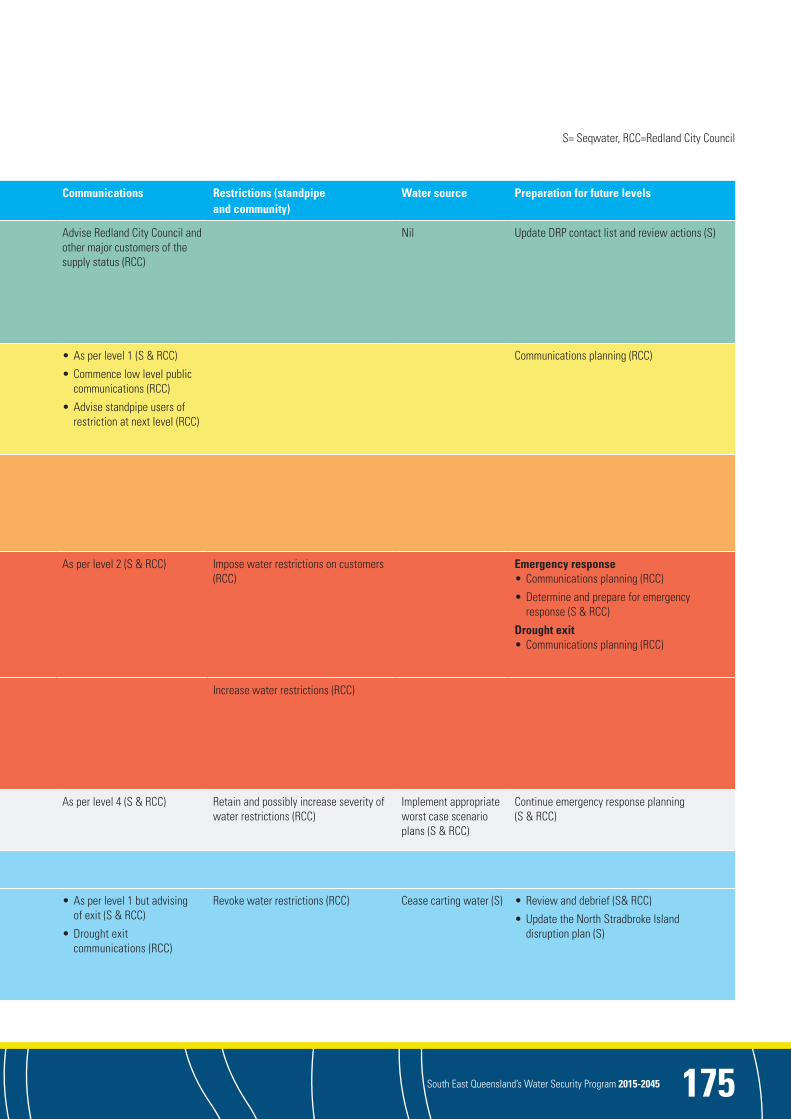
South East Queensland’s Water Security Program 2015-2045 175
Level Trigger Target Key actions Monitor, manage and report Communications Restrictions (standpipe and community)
Water source Preparation for future levels
1. Drought alert, preparedness and monitoring (green)
Groundwater (GW) observation bore 14400016 measures 15mAHD
Normal demand pattern (where there are no obvious leaks)
Reporting and readiness, monitoring, leak detection and repair
• Monitor: supply status, drought response actions weekly (S)
• Monitor demand status weekly (RCC)
• Report weekly to DEWS (S)
• Contact Seqwater emergency response hotline who will act in accordance with the ERP (S)
Advise Redland City Council and other major customers of the supply status (RCC)
Nil Update DRP contact list and review actions (S)
2. Voluntary conservation (yellow)
GW observation bore 14400016 measures 10 mAHD OR GW observation bore 14400038 measures 4 mAHD
5% reduction on normal operations consumption
As per level 1 (S & RCC) • As per level 1 (S & RCC)
• Commence low level public communications (RCC)
• Advise standpipe users of restriction at next level (RCC)
Communications planning (RCC)
3. Voluntary conservation, restriction of standpipe and carting of water (orange)
N/A as carting is not a viable option and there are no standpipes at the North Stradbroke Island Water Treatment Plant
4. Voluntary conservation, restrictions and the appropriate regulatory measures (red)
GW observation bore 14400016 measures 4 mAHD OR GW observation bore 14400038 measures 2 mAHD
15% reduction on normal operations consumption
Impose water restrictions
As per level 2 (S & RCC ) As per level 2 (S & RCC) Impose water restrictions on customers (RCC)
Emergency response• Communications planning (RCC)
• Determine and prepare for emergency response (S & RCC)
Drought exit• Communications planning (RCC)
4a. Further water restrictions (red)
GW observation bore 14400016 measures 3 mAHD OR GW observation bore 14400038 measures 1.5 mAHD
20% reduction in demand
Increase water restrictions (RCC)
Emergency response Loss of supply continuity
Maximum possible demand reduction
Implement worst case scenario plans
As per level 4 (S & RCC)
Where required discuss with the Minister the need for a water supply emergency response (S)
As per level 4 (S & RCC) Retain and possibly increase severity of water restrictions (RCC)
Implement appropriate worst case scenario plans (S & RCC)
Continue emergency response planning (S & RCC)
Stepped exit NA for North Stradbroke Island
Complete drought exit GW observation bore 14400016 measures 17 mAHD OR GW observation bore 14400038 measures 8 mAHD
Normal demand pattern (where there are no obvious leaks)
Return to normal operations
• Completion and cessation of drought actions (S & RCC)
• Contact Seqwater emergency response hotline to close out incident as per ERP (S)
• As per level 1 but advising of exit (S & RCC)
• Drought exit communications (RCC)
Revoke water restrictions (RCC) Cease carting water (S) • Review and debrief (S& RCC)
• Update the North Stradbroke Island disruption plan (S)
S= Seqwater, RCC=Redland City Council

Water for life176
Level Trigger Target Key actions Monitor, manage and report Communications Restrictions (standpipe and community)
Water source Preparation for future levels
1. Drought alert, preparedness and monitoring (green)
Groundwater (GW) observation bore 14400016 measures 15 mAHD
Normal demand pattern (where there are no obvious leaks)
Reporting and readiness, monitoring, leak detection and repair
• Monitor: supply status, drought response actions weekly (S)
• Monitor demand status weekly (RCC)
• Report weekly to DEWS (S)
• Contact Seqwater emergency response hotline who will act in accordance with the ERP (S)
Advise Redland City Council and other major customers of the supply status (RCC)
Nil Update DRP contact list and review actions (S)
2. Voluntary conservation (yellow)
GW observation bore 14400016 measures 10 mAHD OR GW observation bore 14400056 measures 4 mAHD
5% reduction on normal operations consumption
As per level 1 (S & RCC) • As per level 1 (S & RCC)
• Commence low level public communications (RCC)
• Advise standpipe users of restriction at next level (RCC)
Communications planning (RCC)
3. Voluntary conservation, restriction of standpipe and carting of water (orange)
NA as carting is not a viable option and there are no standpipes at the North Stradbroke Island Water Treatment Plant
4 . Voluntary conservation, restrictions and the appropriate regulatory measures (red)
GW observation bore 14400016 measures 4 mAHD OR GW observation bore 14400056 measures 2 mAHD
15% reduction on normal operations consumption
Impose water restrictions
As per level 2 (S & RCC ) As per level 2 (S & RCC) Impose water restrictions on customers (RCC)
Emergency response• Communications planning (RCC )
• Determine and prepare for emergency response (S & RCC)
Drought exit• Communications planning (RCC)
4a. Further water restrictions (red)
GW observation bore 14400016 measures 3 mAHD OR GW observation bore 14400056 measures 1.5 mAHD
20% reduction in demand
Increase water restrictions (RCC)
Emergency response Loss of supply continuity
Maximum possible demand reduction
Implement worst case scenario plans
As per level 4 (S & RCC)
Where required discuss with the Minister the need for a water supply emergency response (S)
As per level 4 (S & RCC) Retain and possibly increase severity of water restrictions (RCC)
Implement appropriate worst case scenario plans (S & RCC)
Continue emergency response planning (S & RCC)
Stepped exit NA for North Stradbroke Island
Complete drought exit GW observation bore 14400016 measures 17 mAHD OR GW observation bore 14400056 measures 8 mAHD
Normal demand pattern (where there are no obvious leaks)
Return to normal operations
• Completion and cessation of drought actions (S & RCC)
• Contact Seqwater emergency response hotline to close out incident as per ERP (S)
• As per level 1 but advising of exit (S & RCC)
• Drought exit communications (RCC)
Revoke water restrictions (RCC) Cease carting water (S) • Review and debrief (S & RCC)
• Update the North Stradbroke Island disruption plan (S)
POINT LOOKOUT DROUGHT RESPONSE PLAN ON A PAGE
This is a guide.
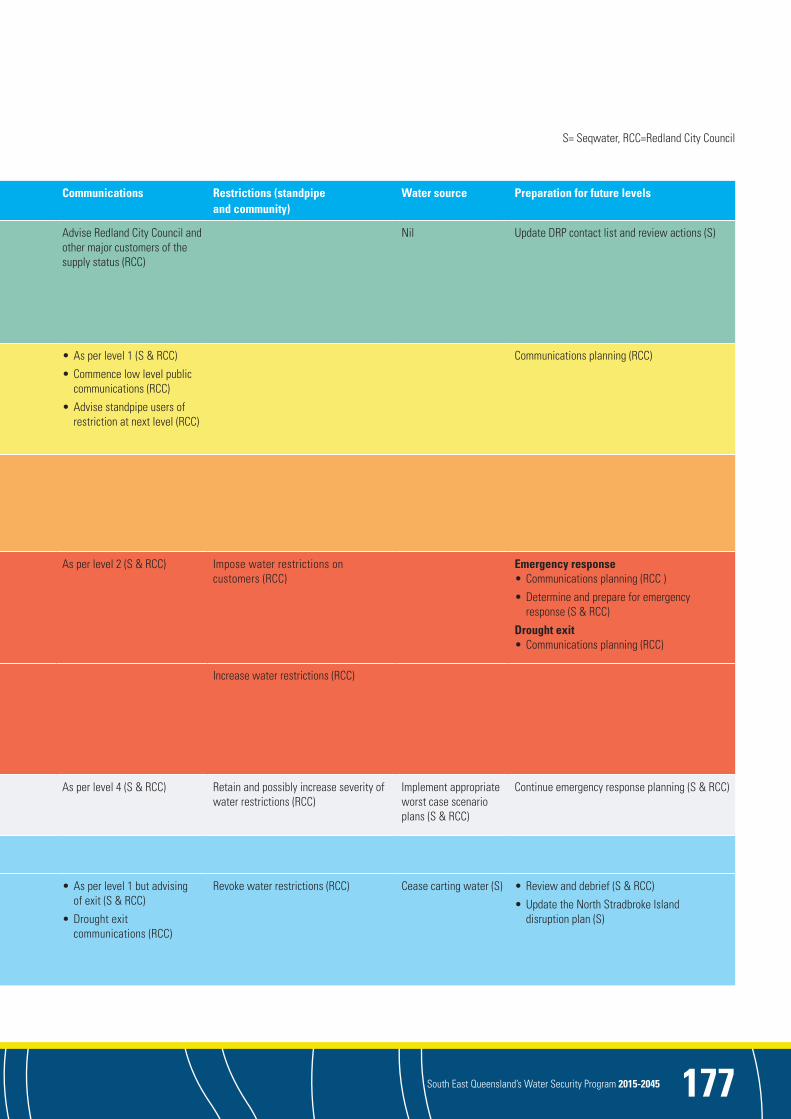
South East Queensland’s Water Security Program 2015-2045 177
Level Trigger Target Key actions Monitor, manage and report Communications Restrictions (standpipe and community)
Water source Preparation for future levels
1. Drought alert, preparedness and monitoring (green)
Groundwater (GW) observation bore 14400016 measures 15 mAHD
Normal demand pattern (where there are no obvious leaks)
Reporting and readiness, monitoring, leak detection and repair
• Monitor: supply status, drought response actions weekly (S)
• Monitor demand status weekly (RCC)
• Report weekly to DEWS (S)
• Contact Seqwater emergency response hotline who will act in accordance with the ERP (S)
Advise Redland City Council and other major customers of the supply status (RCC)
Nil Update DRP contact list and review actions (S)
2. Voluntary conservation (yellow)
GW observation bore 14400016 measures 10 mAHD OR GW observation bore 14400056 measures 4 mAHD
5% reduction on normal operations consumption
As per level 1 (S & RCC) • As per level 1 (S & RCC)
• Commence low level public communications (RCC)
• Advise standpipe users of restriction at next level (RCC)
Communications planning (RCC)
3. Voluntary conservation, restriction of standpipe and carting of water (orange)
NA as carting is not a viable option and there are no standpipes at the North Stradbroke Island Water Treatment Plant
4 . Voluntary conservation, restrictions and the appropriate regulatory measures (red)
GW observation bore 14400016 measures 4 mAHD OR GW observation bore 14400056 measures 2 mAHD
15% reduction on normal operations consumption
Impose water restrictions
As per level 2 (S & RCC ) As per level 2 (S & RCC) Impose water restrictions on customers (RCC)
Emergency response• Communications planning (RCC )
• Determine and prepare for emergency response (S & RCC)
Drought exit• Communications planning (RCC)
4a. Further water restrictions (red)
GW observation bore 14400016 measures 3 mAHD OR GW observation bore 14400056 measures 1.5 mAHD
20% reduction in demand
Increase water restrictions (RCC)
Emergency response Loss of supply continuity
Maximum possible demand reduction
Implement worst case scenario plans
As per level 4 (S & RCC)
Where required discuss with the Minister the need for a water supply emergency response (S)
As per level 4 (S & RCC) Retain and possibly increase severity of water restrictions (RCC)
Implement appropriate worst case scenario plans (S & RCC)
Continue emergency response planning (S & RCC)
Stepped exit NA for North Stradbroke Island
Complete drought exit GW observation bore 14400016 measures 17 mAHD OR GW observation bore 14400056 measures 8 mAHD
Normal demand pattern (where there are no obvious leaks)
Return to normal operations
• Completion and cessation of drought actions (S & RCC)
• Contact Seqwater emergency response hotline to close out incident as per ERP (S)
• As per level 1 but advising of exit (S & RCC)
• Drought exit communications (RCC)
Revoke water restrictions (RCC) Cease carting water (S) • Review and debrief (S & RCC)
• Update the North Stradbroke Island disruption plan (S)
S= Seqwater, RCC=Redland City Council

Water for life178
Level Trigger Target Key actions Monitor, manage and report Communications Restrictions (standpipe and community)
Water source Preparation for future levels
1. Drought alert, preparedness and monitoring (green)
50% capacity Maroon Dam
Normal demand pattern (where there are no obvious leaks)
Reporting and readiness, monitoring, leak detection and repair
• Monitor: supply status, drought response actions weekly (S)
• Monitor demand status weekly (QUU)
• Report weekly to DEWS (S)
• Contact Seqwater emergency response hotline which will act in accordance with the ERP (S)
• Advise Scenic Rim Regional Council and other major customers of the supply status (QUU)
• Advise irrigators of town actions (S)
Monitor standpipe use (QUU) Nil Update DRP contact list and review actions (S)
2. Voluntary conservation (yellow)
25% capacity Maroon Dam
5% reduction on normal operations consumption
Implement communications plan and undertake leak detection and repair
As per level 1 (S & QUU) • As per level 1 (S & QUU)
• Commence low level public communications (QUU)
• Advise standpipe users of restriction at next level (QUU)
Monitor standpipe use (QUU) Communications planning (QUU)
3. Voluntary conservation, restriction of standpipe and carting of water (orange)
15% capacity Maroon Dam
150 L/p/day residential demand
• Standpipe restriction
• Communications plan
• Confirm water carter availability
As per level 1 but monitor daily (S & QUU) • As per level 2 (S & QUU)
• Increased communications (QUU)
Standpipe restriction (QUU) • Communications planning (QUU)
• Make necessary arrangements for water carters to cart water to Rathdowney (S)
• Obtain approval to impose water restrictions schedule (QUU)
4. Voluntary conservation, restrictions and the appropriate regulatory measures (red)
10% capacity Maroon Dam
140 L/p/day residential demand including isolation of standpipe
• Continue to cart water and impose water restrictions
• Communications plan
As per level 3 (S & QUU) As per level 3 (S & QUU) • Standpipe isolation (QUU)
• Impose water restrictions on customers (QUU)
Commence water carting (S)
Emergency response• Communications planning (QUU)
• Determine and prepare for emergency response (S & QUU)
Drought exit• Communications planning (QUU)
4b 7.5% capacity Maroon Dam
130 L/p/day residential demand
• Commence carting
• Further water restrictions
As per level 4 (S & QUU) • As per level 4 (S & QUU)
• Increased communications (QUU)
• Standpipe isolation (QUU)
• Increase water restrictions on customers (QUU)
Continue water carting (S)
As per level 4 (S & QUU)
Emergency response 5% capacity Maroon Dam
Maximum demand reduction (100 L/p/day res and non-res)
• Implement worst case scenario plans
• Communications plan
As per level 4 (S & QUU)
Where required discuss with the Minister the need for a water supply emergency response (S)
As per level 4 (S & QUU) • Standpipe remains isolated (QUU)
• Retain and possibly increase severity of water restrictions (QUU)
Implement appropriate worst case scenario plans (S & QUU)
Continue emergency response planning (S & QUU)
Stepped exit Water supply level of a preceding drought response level and removal of the action is operationally appropriate
Maintain the target of the level implemented
• Remove appropriate drought response actions
• Communications plan
As per level 4 (S & QUU) As per level 4 (S & QUU) • Standpipe remains isolated (QUU)
• Retain restrictions (QUU)
As per level implemented (S & QUU)
Emergency response• Continue emergency response planning
(S & QUU)
Drought exit/re-entry to other levels• Communications planning (QUU)
Complete drought exit 60% capacity Maroon Dam
Normal demand pattern (where there are no obvious leaks)
Return to normal operations
• Completion and cessation of drought actions (S & QUU)
• Contact Seqwater emergency response hotline to close out incident as per ERP (S)
• As per level 1 but advising of exit (S & QUU)
• Drought exit communications (QUU)
• Re-open standpipe (QUU)
• Revoke water restrictions (QUU)
Water sourceCease carting water (S)
• Review and debrief (S & QUU)
• Update the Rathdowney disruption plan (S)
RATHDOWNEY DROUGHT RESPONSE PLAN ON A PAGE
This is a guide.

South East Queensland’s Water Security Program 2015-2045 179
Level Trigger Target Key actions Monitor, manage and report Communications Restrictions (standpipe and community)
Water source Preparation for future levels
1. Drought alert, preparedness and monitoring (green)
50% capacity Maroon Dam
Normal demand pattern (where there are no obvious leaks)
Reporting and readiness, monitoring, leak detection and repair
• Monitor: supply status, drought response actions weekly (S)
• Monitor demand status weekly (QUU)
• Report weekly to DEWS (S)
• Contact Seqwater emergency response hotline which will act in accordance with the ERP (S)
• Advise Scenic Rim Regional Council and other major customers of the supply status (QUU)
• Advise irrigators of town actions (S)
Monitor standpipe use (QUU) Nil Update DRP contact list and review actions (S)
2. Voluntary conservation (yellow)
25% capacity Maroon Dam
5% reduction on normal operations consumption
Implement communications plan and undertake leak detection and repair
As per level 1 (S & QUU) • As per level 1 (S & QUU)
• Commence low level public communications (QUU)
• Advise standpipe users of restriction at next level (QUU)
Monitor standpipe use (QUU) Communications planning (QUU)
3. Voluntary conservation, restriction of standpipe and carting of water (orange)
15% capacity Maroon Dam
150 L/p/day residential demand
• Standpipe restriction
• Communications plan
• Confirm water carter availability
As per level 1 but monitor daily (S & QUU) • As per level 2 (S & QUU)
• Increased communications (QUU)
Standpipe restriction (QUU) • Communications planning (QUU)
• Make necessary arrangements for water carters to cart water to Rathdowney (S)
• Obtain approval to impose water restrictions schedule (QUU)
4. Voluntary conservation, restrictions and the appropriate regulatory measures (red)
10% capacity Maroon Dam
140 L/p/day residential demand including isolation of standpipe
• Continue to cart water and impose water restrictions
• Communications plan
As per level 3 (S & QUU) As per level 3 (S & QUU) • Standpipe isolation (QUU)
• Impose water restrictions on customers (QUU)
Commence water carting (S)
Emergency response• Communications planning (QUU)
• Determine and prepare for emergency response (S & QUU)
Drought exit• Communications planning (QUU)
4b 7.5% capacity Maroon Dam
130 L/p/day residential demand
• Commence carting
• Further water restrictions
As per level 4 (S & QUU) • As per level 4 (S & QUU)
• Increased communications (QUU)
• Standpipe isolation (QUU)
• Increase water restrictions on customers (QUU)
Continue water carting (S)
As per level 4 (S & QUU)
Emergency response 5% capacity Maroon Dam
Maximum demand reduction (100 L/p/day res and non-res)
• Implement worst case scenario plans
• Communications plan
As per level 4 (S & QUU)
Where required discuss with the Minister the need for a water supply emergency response (S)
As per level 4 (S & QUU) • Standpipe remains isolated (QUU)
• Retain and possibly increase severity of water restrictions (QUU)
Implement appropriate worst case scenario plans (S & QUU)
Continue emergency response planning (S & QUU)
Stepped exit Water supply level of a preceding drought response level and removal of the action is operationally appropriate
Maintain the target of the level implemented
• Remove appropriate drought response actions
• Communications plan
As per level 4 (S & QUU) As per level 4 (S & QUU) • Standpipe remains isolated (QUU)
• Retain restrictions (QUU)
As per level implemented (S & QUU)
Emergency response• Continue emergency response planning
(S & QUU)
Drought exit/re-entry to other levels• Communications planning (QUU)
Complete drought exit 60% capacity Maroon Dam
Normal demand pattern (where there are no obvious leaks)
Return to normal operations
• Completion and cessation of drought actions (S & QUU)
• Contact Seqwater emergency response hotline to close out incident as per ERP (S)
• As per level 1 but advising of exit (S & QUU)
• Drought exit communications (QUU)
• Re-open standpipe (QUU)
• Revoke water restrictions (QUU)
Water sourceCease carting water (S)
• Review and debrief (S & QUU)
• Update the Rathdowney disruption plan (S)
S= Seqwater, QUU= Queensland Urban Utilities

Water for life180
Kate Lanskey (Project Director)
Ed Ebert (Project Manager)
SUPPLY AND DEMAND
Karen Campisano
Anne Chan
Dimity Lynas
Neranjala Fernando
WATER SUPPLY MODELLING
Mark Askins
Wendy Auton
Phillip Chan
Genavee Telford
Jyoteshni Mahambrey
INTEGRATED MASTER PLANNING
Tony Prenzler
Storm Stickland
Jimmy Innes
Jim Fear
Aaron Brand
Selina Zhang
Luke Belcher
Water Supply Planning team
OTHER KEY SUPPORT STAFF
Lori Beeton
Robbie Goedecke
Liz Kearins
Jana Marschall
James Moffatt
Others who have contributed to and/or supported the delivery of the Water Security Program, through workshop input, review and various other forums.

Water Supply Planning team (L-R): Wendy Auton, Aaron Brand, Anne Chan, Neranjala Fernando, James Moffatt, Jim Fear, Tony Prenzler, Ed Ebert, Karen Campisano, Mark Askins, Kate Lanskey, Dimity Lynas, Storm Stickland, Luke Belcher, Genavee Telford, Phillip Chan, Jyoteshni Mahambrey, Jimmy Innes. Absent: Selina Zhang.
Thank you to the members of the Water Supply Planning team and all of the other people at Seqwater who have worked tirelessly on modelling, analysis, planning and drafting to deliver Version 1 of the Water Security Program. The high quality of work achieved in a short timeframe is commendable. In particular, thank you to our General Manager, Jim Pruss, for his leadership and support. Special thanks to the DEWS and South East Queensland water service provider staff who have worked collaboratively with Seqwater during the development of the Program, and to our Independent Review Panel for their expert guidance and review.
We are proud to present this program to our community for your feedback and input and look forward to continuing to work with you and our key stakeholders to develop Version 2 of the Water Security Program.
Kate Lanskey Manager, Water Supply Planning

www.seqwater.com.au