Water Filtration - Mechanical & Industrial Engineering … Filtration For Developing Nations Derek...
90
Water Filtration For Developing Nations Derek Humenny Dimitra Panagiotoglou A thesis submitted in partial fulfilment of the requirements for the degree of BACHELOR OF APPLIED SCIENCE Supervisors: Professors W.L. Cleghorn and J.K. Mills Industrial Partner: Richie Singh, Creative Engineering Services Inc.
Transcript of Water Filtration - Mechanical & Industrial Engineering … Filtration For Developing Nations Derek...

Water Filtration For Developing Nations
Derek Humenny Dimitra Panagiotoglou
A thesis submitted in partial fulfilment of the requirements for the degree of
BACHELOR OF APPLIED SCIENCE
Supervisors: Professors W.L. Cleghorn and J.K. Mills Industrial Partner: Richie Singh, Creative Engineering Services Inc.

Abstract
Clean, safe drinking water remains unavailable to a large portion of the global population. This most basic of human rights, and requirement for healthy living should not be a commodity exclusive to the economic elite. While several technologically sophisticated solutions improve water quality in affluent regions equipped with adequate infrastructure, these solutions are not appropriate for more rural, rudimentary, low-cost demands.
This paper discusses eight common filtration technologies, analyzing them in context of their application in the developing world. The best solution must be compatible with the economical, technological and educational limitations of the large, target populace, while still achieving appropriate sanitation standards (as set out by the World Health Organization, WHO) and water consumption demands. To that end, Slow Sand Filtration has been selected as appropriately meeting these goals. The Slow Sand filter used for the Life Cycle Analysis is estimated to cost $5.59 (2008 USD) to produce and run, require minimal infrastructure to produce and run, while meeting WHO standards and has an estimated lifespan of 100 years. Experimentation was used to verify the capabilities of slow sand filtration. The test model produced a 75% reduction in coliform bacteria while maintaining flow rates of up to 1926L/day.

i
Acknowledgements
Thanks to Damien Boyd, Kelly Hodgson, Aaron Hong, Andrew and Wendy Humenny, Dr.
David James, and Brian Mitchell for their contributions to the success of this thesis.

ii
Method of Attribution
The work was divided evenly and reflective of each student’s particular strengths. The
background research on filtration methods, and model construction were conducted by both
students. Data analysis and explanation, as well as editing were done by Dimitra Panagiotoglou,
with prototype design and monitoring, report compilation and formatting by Derek Humenny.

iii
Table of Contents
Acknowledgements........................................................................................................................... i
Method of Attribution ..................................................................................................................... ii
List of Symbols Used ........................................................................................................................ v
List of Figures .................................................................................................................................. vi
List of Tables .................................................................................................................................. vii
Chapter 1 – Introduction.................................................................................................................. 1
Motivation ................................................................................................................................... 1
Objectives .................................................................................................................................... 2
Chapter 2 – Water Consumption and Demand ............................................................................... 4
Target Demographic .................................................................................................................... 4
Target Contaminants ................................................................................................................... 6
Data Analysis ................................................................................................................................ 6
Division of GEMStat Data ............................................................................................................. 8
Data Trends .................................................................................................................................. 9
Water Source ............................................................................................................................... 9
Chapter 3 – Water Filtering Methods ............................................................................................ 11
Granular Media Filtering ............................................................................................................ 11
Sand........................................................................................................................................ 12
Anthracite .............................................................................................................................. 14
Barrier Media Filtering ............................................................................................................... 15
Membrane Technology .......................................................................................................... 15
Ceramic .................................................................................................................................. 20
Concrete ................................................................................................................................. 21
Disinfection Treatment .............................................................................................................. 22
Ultraviolet Radiation .............................................................................................................. 22
Chemical Purification ............................................................................................................. 24
Carbon Adsorption ..................................................................................................................... 26
Chapter 4 – Technology Assessment ............................................................................................. 29
Method Selection ....................................................................................................................... 29
Slow Sand Filtration Improvements ........................................................................................... 30
Life Cycle Analysis ...................................................................................................................... 34

iv
Premanufacture ..................................................................................................................... 35
Manufacture .......................................................................................................................... 36
Distribution/Transportation................................................................................................... 36
Use ......................................................................................................................................... 37
Maintenance .......................................................................................................................... 37
End of Life .............................................................................................................................. 39
Chapter 5 – Prototype .................................................................................................................... 40
Functional Requirements ........................................................................................................... 40
Design......................................................................................................................................... 41
Basic Operation ...................................................................................................................... 41
Function ................................................................................................................................. 42
Materials ................................................................................................................................ 43
Methods ..................................................................................................................................... 43
Contaminated Water Source ................................................................................................. 43
Testing Procedure .................................................................................................................. 44
Test Sample Analysis .............................................................................................................. 45
Chapter 6 – Sample Analysis .......................................................................................................... 46
Test Results ................................................................................................................................ 46
Discussion .................................................................................................................................. 46
Sources of Error ......................................................................................................................... 49
Chapter 7 – Recommended Future Actions ................................................................................... 51
Chapter 8 – Conclusion .................................................................................................................. 52
Chapter 9 – Tables and Figures ...................................................................................................... 54
Glossary .......................................................................................................................................... 64
Works Cited .................................................................................................................................... 65
Appendix A – GEMStat Analysis ..................................................................................................... 72
Appendix B – Darcy’s Law Derivation and Application .................................................................. 74
Appendix C – EIOLCA of Filter Parts ............................................................................................... 75
Appendix D – Contribution to Final Document .............................................................................. 76
Appendix E – Detailed Prototype Drawings ................................................................................... 78

v
List of Symbols Used
Chapter 1
Atlas Conversion Factor (national currency to the USD) for year t
Average annual exchange rate (national currency to the USD) for year t
GDP deflator for the year t
SDR deflator in USD terms for year t
Atlas GNI per capita in USD in year t
Current GNI (local currency) for year t
Midyear population for year t
National Population
Average Domestic Water Footprint of the Population
Calculated weighted domestic average per capita
Appendix B
Q Volumetric flow rate
κ Permeability
A Cross-sectional area
μ Dynamic viscosity
L Filter bed depth
K Hydraulic conductivity
γ Specific weight of fluid
ρ Density of fluid
g gravity = 9.814

vi
List of Figures
Fig 2.1 – Iron Contamination in Asia
Fig 2.2 – Sulphate Contamination in Africa
Fig 2.3 – Population Representation for Africa
Fig 3.1 – Membrane Cross-Flow Filtration
Fig 3.2 – Effective Removal of Pathogens for Membrane Technologies
Fig 5.1 – Prototype Layout (Artisitic Rendition)
Fig A.1 – Contamination Probability per Continent

vii
List of Tables
Table 2.1 – World Bank Class Division
Table 2.2 – Target Countries
Table 2.3 – Major Global Contaminants
Table 2.4 – Summary of WHO and National Water Contaminant Guidelines
Table 3.1 – Anthracite Sizing
Table 3.2 – Membrane Energy and Pressure Demands
Table 3.3 – Ultraviolet Dosage Required
Table 3.4 – Activated Carbon Magnitudes and Applications
Table 3.5 – Water Contaminants that can be Reduced to Acceptable Standards by AC Filtration
Table 4.1 – Pugh Decision Matrix
Table 6.1 – Test Results
Table A.1 – Full List of Contaminants
Table C.1 – EIOLCA of Filter Parts

1
Chapter 1 – Introduction
Motivation
Clean drinking water is essential to life. The UN Committee on Economic, Social and
Cultural Rights has declared it “indispensable for leading a life in human dignity. It is a
prerequisite for the realization of other human rights.”1 If article 25 of the Declaration of
Human rights stipulates that “everyone has the right to a standard of living adequate for the
health and well-being of himself and of his family, including food, clothing, housing and medical
care and necessary social services...”2 how much more the case for the very precursor of such
rights. Despite international recognition of its importance 884 million people continue to have
unsafe drinking water3. This, compounded with the of inadequate sanitation result in
approximately 5000 children’s deaths daily4
Global efforts are being invested to improve these statistics. Although solutions are
continuously proposed to remediate the issue, the best is not apparent. The process of
selection for the ideal treatment method is complicated by the individual scope of each option.
Varying target contaminants, geography, quantity and functional needs result in a
conglomeration of solutions each targeting a particular niche of the overall global problem. The
issue is exacerbated when producers of technology are insensitive to the needs of the
population that will be utilizing the proposed solution.
This team is interested in identifying the simplest solution for the largest geographic
populace. The quality of water to be treated, its source, and its use will be taken into
consideration. The supply quantity and its purpose (whether for direct consumption or other
use) are also key factors for consideration. It is also prudent to identify materials’ availability
and appropriate technology to employ for the construction and maintenance of said unit. It is

2
the intent of this team to design small, easy to use, independent filtration units for individual
household use.
The project is commissioned by the Ontario Centres of Excellence’s Connections
Program’s industrial partner Mr. Richard Singh of Creative Engineering Services Inc. The interest
is academic in nature with the expectation of reproducing past experimental results for the
selected treatment option. Neither student involved in this thesis project nor the industry
partner have an intimate background of water filtration methods. The main body of information
provided in this document as collected via a thorough literature search is the basis for the
principles employed when designing and testing the filtration unit.
Objectives
The objective of this thesis is to establish a simple, effective and efficient water
filtration unit. Simple indicates that minimal education will be required to build, operate or
maintain the unit. Poor education can lead to inappropriate use, degrading the quality of
treated water. Effectiveness is expressed by the unit’s ability to reduce major contaminants
within the influent water to World Health Organization standards. The unit must be efficient in
both its energy and resource requirements during operation and maintenance. It must deliver
an appropriate amount of potable water for a family’s needs and be scalable to accommodate
for the variety of family sizes. An additional aim is to maximize the incorporation of local
equipment and materials for its production, thereby minimizing its costs (labour and
maintenance) and ecological footprint. Both are reasonable concerns when attempting to
provide an ethically responsible solution. Finally, the safety of the users and the environment is
of the outmost concern.

3
The recommended method will be tested using a physical prototype to ensure both
feasibility of design and the desired flow rate are met. Additionally, construction will be used to
gage the ease of production and use, along with the expertise needed to maintain the unit.

4
Chapter 2 – Water Consumption and Demand
Target Demographic
An understanding of the influent water issues and the target potable water quality are
necessary to isolate the technology best tailored to remove contaminants present. In the event
that water source analyses concludes localized water quality issues these will be ignored by the
method proposed. This is not to suggest that such problems are insignificant but rather to
admit that they fall outside the scope for a global water purifying unit. Furthermore, by
selecting a target demographic the water demands will be properly assessed.
The World Bank’s Income Class designation is a simple and quantitative means of
highlighting which populations are in greatest need of improved water treatment. World Bank’s
Atlas Method calculates the GNI (Gross National Income) for every country which is then used to
classify respective economies. “The Atlas conversion factor for any year is the average of a
country’s exchange rate... and its exchange rates for the two preceding years, adjusted for the
difference between the rate of inflation”5. In the event that the official exchange rate of a
country appears to be an unreliable means of tracking economic progress an alternate estimate
for the rate is used in the Atlas formula. Below is World Bank’s formula for the Atlas conversion
factor for year t.
and the calculation of GNI per capita in U.S. dollars for year t :
Once the normalized GNI is generated, national economies are classified as being:

5
Table 2.1 – World Bank Class Division6
Economic CLASS GNI per capita
Low Income $935 or less
Lower Middle Income $936 to $3,705
Upper Middle Income $3,706 to $11,455
High Income $11,456 or more
For this thesis, countries belonging to lower middle income or beyond have been
targeted as possessing populations that will benefit from the incorporation of private filters at
the household level. This list does not assume an entire lack of water treatment infrastructure
but rather serves to highlight potential for inequalities of its distribution. Furthermore, by
highlighting this subset of the global population, a weighted average consumption rate can be
calculated as a target flow rate for the proposed unit.
Thus of 141 nations with an economic CLASS calculated by World Bank, seventy eight of
these have been targeted as benefiters (see Table 2.2). Based on this list, the domestic water
footprint7 of each of the identified nations was used in conjunction with the populations of each
to come up with a weighted average daily domestic water consumption estimate:
The target flow rate must meet the 86L/day per person in the household. This figure,
while large, meets the primary consumption requirements of cooking and drinking, and those of
secondary nature. These include but are not limited to: feeding private livestock, gardening,
personal sanitation and washing8. While not all of the population targeted for this product has
access to this much water, the goal is to design a unit that can handle larger water demands, as
well as seasonal fluctuations. The design’s scalability permits for smaller models to be made
wherever preferred.

6
Target Contaminants
The World Health Organization has established drinking water standards for metals,
suspended ions, bacteria/virus, and other contaminants. Of these, some are especially
dangerous to human life while others can accumulate in the body degrading health over a
prolonged period of time. The filter must remove the contaminants found in drinking water that
pose an immediate danger to human health. It is desired that other long range contaminants be
minimized but is not an immediate objective. To determine which contaminants require
immediate removal, data provided by the UN will be used. The United Nations’ Global
Environment Monitoring System GEMStat Programme “ share[s] surface and ground water
quality data sets collected from the GEMS/Water Global Network, including more than 3,000
stations, close to four million records, and over 100 parameters.”9 and has been monitoring
global water table quality for over thirty years10. The data they have compiled is voluntarily
provided by participating nations. Samples from various water table sites are collected
anywhere from a monthly to annual basis. Some countries have been providing data at regular
intervals for several decades while others have been more sporadic in their samples submission.
Data provided has been assessed as “Safe”, “Threatened” or “Dangerous” for a variety of
contaminants:
Table 2.3 – Major Global Contaminants
Major Ions Metals Microbiology
Chloride Aluminum Arsenic Boron Coliform
Sodium Cadmium Iron Lead Faecal Coliform Bacteria
Sulphate Manganese Mercury Nickel
(see Appendix A for a full list of contaminants and their probabilities of occurance)
Data Analysis
GEMStat provided data organized by country, contaminant, year and number of samples
per test set. Sample set data was summarized by including the lowest and highest results, the

7
mean, median, and standard deviation of individual sets. Each sample set represents the
multiple tests conducted for that country and year. The United Nations’ Environment Program
(UNEP) has posted a table outlining the World Health Organization’s contamination standards in
conjunction with other major environmental organization’s protocols. The WHO’s guidelines are
thus used to determine the quality of the samples shared except for bacterial contaminants, as
universal standards were not provided for such specimens. In these circumstances Canadian
guidelines have been used instead. For a list of WHO and select National water contaminant
guidelines, refer to Table 2.4.
Wherever the maximum value of the set was above the permissible contaminant
threshold defined by WHO, that set’s water quality was flagged as “Threatened”. If the mean
was above the threshold, the water was classified as “Dangerous”. Using these simple flags, the
contaminant list (found in Table 2.3) was created from the much larger list of potential
contaminants.
While individual results on a per sample basis were not provided, the data proved useful
in diagnosing the general health of national surface water sources. The standard deviation of
sample sets has assisted in identifying trends within national levels. As such, wherever the
standard deviation exceeds of 100, it has been ignored in the figures generated for visualization
purposes. While the maximum result included is still useful in suggesting that that water suffers
from that contaminant, its extreme value with respect to the set’s minimum and mean, along
with a blatantly high standard deviation suggest that it is an anomalous sample, rather than
consistently repeatable. Fig 2.1, which shows Asia’s Iron contamination, indicates that there is a
consistently high level of iron in the water exceeding the permissible 0.2mg/L recommended

8
guideline. Note, no data has been excluded from this graph on the grounds that the standard
deviation does not exceed 100.
Conversely, Africa’s Sulfate contamination data (shown in Fig 2.2) is generally consistent
despite the exclusion of 10 of the 81 sample sets. Since 500mg/L is the recommended
maximum quantity, this figure shows that Sulfate contamination is not a significant problem for
Africa (nor the Americas or Asia). Hence it has been eliminated as one of the priority
contaminants that must be addressed by our filtration unit.
Division of GEMStat Data
As information provided to GEMStat is not obligatory but rather voluntary, not all
populations have been represented equally via participation in the program. Despite this,
national and continental data collected have assisted in dividing the data by socio-economic
demographic (on a national scale). Fig 2.3 illustrates this population representation as adjusted
for population growth. First to note is the total representation of the continent. In the case of
Africa, less than 25% of the population has participated in GEMStat’s program. Of that that has,
it is almost an even split between developed and developing populations.
Also, not all nations currently considered developed by World Bank’s Atlas classification
have been so in the past 30 years. As development is an ongoing process, some nations may
have met the “developed” threshold used earlier in this thesis sometime during this period. In
other words, fewer countries or different nations were classified as middle to higher income in
the 1980’s than is shown here. With respect to population representation in the data, this
implies that poor populations have had a higher level of representation in statistics in reality
than is shown here. For the purpose of analyzing source water it is more important to show that
9
sufficient data has been provided for representation than to show the divide between economic
classes.
Data Trends
A strong correlation exists between GEMStat’s data and that of the World Bank’s
economic class. The more developed a nation is, the greater the presence of major ions and
toxic metals. For developing nations, increased industrial growth contributes to added
environmental degradation through waste disposal. This thesis will focus on eliminating the
most dangerous contaminants affecting the most vulnerable water sources first. It is assumed
that treatment infrastructure will continue to be implemented and match added pollutants
introduced through increased industrialization. China and India represent a paradox in that they
are developing faster than their populace’s water issues are being addressed. Based on
conclusions drawn from the statistical analysis explained above, the elimination of
microbiological contaminants is the primary target of this thesis as these are most prevalent and
dangerous. “At any given time, almost half the population of the developing world is suffering
from one or more of the main diseases associated with inadequate provision of water and
sanitation.”11
Heavy metal and ion pollutants will be considered outside the primary scope of the
thesis project as they are particularly localized problems normally caused by few participating
countries with extreme conditions in very few sample sets provided.
Water Source
This thesis will focus on treating surface water tables. Surface water is readily available
from rivers and streams, lakes and rain water collected by individuals. It will not deal with

10
underground sources or salt water. Thus, desalinization technology and its application or the
method of collecting water will not be addressed here.

11
Chapter 3 – Water Filtering Methods For the purposes of this project, filtration technologies have been organized in four
major categories: Granular Media Filtering, Barrier Media Filtering, Disinfection Treatments,
and Carbon Adsorption. These broad sections classify all eight filtration methods researched
and analyzed, by underlying technology employed.
Granular Media Filtering
Media filters employ basic principles for operation. The filter is made of a bed of
particulates which act as a physical barrier to strain the feed water. The feed water, which
contains suspended solids, passes through the filter bed grains of the media. The suspended
solids, however, are entrapped within the filter bed and strained out of the feed water. The
smaller the grains, the fewer and smaller the particles it allows through.
There are two major forms of granular filtration – slow and rapid. Rapid granular
filtering uses a pressure process to force feed water through the filter, whereas slow filtration
uses gravity to provide the necessary pressure. While slow filtering with sand has been used for
well over two centuries, it was not until the 1880’s and the study of bacteria that water
purification was subjected to systematic scientific analysis. Studies revealed that “when kept in
proper condition, *slow+ sand filters … took away as much as 98 percent of the bacterial
content”12. Since these filters operate at much slower filtration rates, a biochemical change is
able to take place in the upper layers of the filter bed which increases the filter’s effectiveness.
As the filtration process is carried out, organic particles previously suspended in the feed water
settle on the top layer of the filter bed. These particles begin to culture a bacterial “skin or layer
of slime”, and it is the “biochemical transformations *that+ occur in this layer … which are
necessary to make slow filters efficient as filters with biological activity”13. This layer is referred
to as the Schmutzdecke.

12
[A] sticky film, which is reddish-brown in colour, consists of decomposing
organic matter, iron, manganese and silica and therefore acts as a fine filter
that contributes to the removal of fine colloidal particles in the raw water.
The Schmutzdecke also doubles up as an initial zone of biological activity,
providing some degradation of soluble organics in the raw water, which is
useful for reducing tastes, odours and colour14.
The Schmutzdecke is generally defined as the top 0.5 – 2cm of a slow filter. The bacteria
that form in this layer use the filtered organic matter as food. A portion of this is oxidized to
provide metabolic energy while the rest is converted into cell material that supports their
growth15. To do so, the sand must be kept wet and the filter layers must remain undisturbed by
turbulent feed waters which can otherwise disrupt bacterial growth.
What occurs below the Schmutzdecke while imperative to the success of the
purification processes that occurs in slow filters is poorly understood.16 It is speculated that a
combination of temperature conditions that impede growth, lack of organic matter to meet
nutritional needs, the presence of various types of predatory organisms (protozoa and lower
metazoa) and of various microorganisms that produce chemical or biological poisons, all
contribute to the control and limiting of intestinal bacteria. Thus this combination of factors in
the biological zone contributes to a “substantial reduction in the number of E. Coli, and an even
greater proportional decrease in pathogens”17.
Sand
Sand is the most popular material used in granular media filters. Gravel, also loose rock
but larger than 2mm in diameter, will be explained in conjunction to its finer counterpart. The
specific size range of gravel is 2-4mm18, while geologically classified sand is 62.5µm to 2mm in
diameter19. Sand’s advantages as a water filtration media include its widespread availability,
variation in size, inertness, minimal cost (if any), and lack of processing requirements. Silica
sand’s availability and inertness make it the most favourable choice. Some suggested variables

13
for consideration when designing filtration systems using sand include the particles’ effective
size (the average particle diameter) and the depth of the filter bed. For fine sand (0.4-0.8mm)
filter bed heights should range between 18 and 36cm. At such conditions, filtration rates of 80-
400L/m2-min are achievable for heavy influent rates20. Such rates are common in large
wastewater filtration plants. On a smaller scale such as that of this thesis, slower rates are to be
anticipated. Notice that the filtration rate is a relative measurement dependent on the filter’s
surface area.
Despite the initial concern that a slower filtration rate is undesirable, upon closer
inspection it may prove to be advantageous. Slower flow rates allow greater opportunity for
pollutants to come into contact with the filter media and become entrapped in a layer. Slower
filter rates also permit biological activity to aid in the destruction and removal of undesirable
biotic contaminants as explained earlier. Hence as long as the flow rate still meets family water
needs, slower is better.
Some of the disadvantages of the sand media filter, common to media filters in general,
include the need to backwash. Backwash frequency is dependent on the quality of incoming
water, and flow rate experienced relative to that of the filter performing at optimum conditions.
Backwashing is a water intensive process that requires several litres of clean water that must be
disposed of upon use. Furthermore, as with other gravitational media, the sand filter must
undergo a ripening stage preceding its first use and after each backwash cycle21 for the
Schmutzdecke’s development. During this ripening, water that initially flows through the
system will not have its bacterial contaminants removed and hence should not be used for
human ingestion. Finally, the biotic layer is very sensitive to disturbances and users must ensure
that turbulent water or fluctuating flow rates are minimized.

14
Anthracite
Anthracite is another granular media filter option. It is the naturally occurring
“intermediate formation between bituminous coal and graphite” with a 92 to 98% carbon
content22. It is denser than bituminous coal and has low volatility23. Its high combustion
temperature (>925˚C)24 means it is unlikely to combust under standard conditions, thus allowing
for safe storage. Its largest reserve is found in the Pennsylvania Coal Region, but other large
sources include mines in Austria, Canada, Denmark, Finland, Germany, India, Italy, Japan,
Netherlands, Russia, Sweden, Switzerland, and Turkey25. Despite having weak electrostatic
properties that can aid in trapping particulates in the water in the same manner that activated
carbon employs, its significantly smaller surface area and lack of processing after mining, make it
more suitable as a sediment filter like sand. Its advantages include the range of particle sizes
available26:
Table 3.1 – Anthracite Sizing
Classification Chestnut Pea Buckwheat Rice Barley
Min Size (in) 7/8 9/16 3/8 3/16 3/32
Max Size (in) 1 1/2 7/8 9/16 3/8 3/16
As such, it can easily be selected for a particular desired diameter and a gradient of
different sized anthracite layers can effectively trap very small pollutants. An ideal particle
diameter to filter bed depth ratio for one layer of anthracite is an effective size of 0.8-2mm in
diameter and a depth of anywhere between 36-90cm and dependent on the quality of incoming
water27. Whenever designing gravitational filters, the depth of each filter layer and the particle
size must be considered to minimize head loss. If the drop is too quick, pollutants will remain in
the uppermost levels, inhibiting deeper penetration of the water and ultimately requiring
frequenter backwash to improve flow.

15
Like other filter media, anthracite is not effective in removing chemical pollutants
present in the water supply. Despite it being a commonly found natural resource, anthracite is
not necessarily mined in the remote areas populated by the target demographic. Furthermore,
mining is an energy intensive practice with damaging effects to local ecosystems. Finally,
according to one site, a kg of anthracite costs eight dollars US, not including shipping and
handling28.
Anthracite is nontoxic when ingested, and only a mild mechanical irritant if the dust
comes into contact with eyes or skin29. “Excessive, long term inhalation to coal dust may cause
pneumoconiosis (or “Black Lung”)” which includes “reduction in pulmonary function, pulmonary
hypertension, bronchitis, emphysema and premature death”30. While users of the filter and
those who will provide maintenance are not inherently exposed in such a manner, it is
important to be aware of the consequences of misuse when assessing the overall impact of the
material.
Barrier Media Filtering
Barrier Media Filters, as the name suggests, utilize techniques that involve a physical
obstruction in the path of flow. Unlike Granular Media Filters which are loose particle based,
these use a solid permanent, porous obstacle to trap contaminants smaller than the pore size of
the filter.
Membrane Technology
Membrane filtration technology is little more than a sophisticated sieving process,
relying on a pressure or vacuum to drive the process. Rather than use a loose particle media to
entrap suspended solids, it employs an engineered barrier in the form of a porous material. The
16
effectiveness of the membrane is directly determined by the size of the pores like its
counterpart31. There are two different operating processes for membrane filtration.
The first process, Dead-End Filtration, has one flow entering the filter, and one flow
exiting. In this method, all of the incoming flow (the feed water) encounters the membrane and
is forced to pass through the membrane. Any suspended solids in the feed water too large to fit
through the membrane’s pores are deposited on the surface of the filter. While the simplest of
the two processes, it is also more susceptible to membrane clogging. The build up of particulate
on the membrane is steady and extremely short in comparison to the membrane life. As
expected, build up that gathers on the membrane, the slower the filtration rate achieved. To
restore the Dead-End Filtration throughput relatively frequent backwashing to clear the filter of
accumulated contaminants is necessary. The frequency of backwashing is determined entirely
by the turbidity of the feed water and its flow rate through the filter. In very demanding
commercial applications involving large volumes of water, backwashing is necessary every 15-
60mins32. Unlike media filtration however, backwashing a membrane filter is quick, highly
effective, and restores the filter to its full capacity33.
The second operating process for membrane filtration is Cross-Flow Filtration. The
Cross-flow Filtration method seeks to avoid the problem of built up of particulate on the
membrane. In Dead-End Filtration, the feed water is delivered perpendicular to the membrane,
forcing the feed water through the membrane while depositing any suspended solids on the
pressure side of the membrane. In contrast, Cross-Flow filtration does not force the particles
into the membrane. One flow enters the filter, and two exit – one on the feed water side of the
membrane, and one on the opposite side.

17
Feed water enters the filter and is passed parallel to the membrane at high velocity.
The momentum of the majority of particulates carries them along the surface of the membrane,
and out the exit as part of the retentate (waste water that has a high concentration of
suspended solids). The feed water that is drawn through the membrane thus has a significantly
lower concentration of particles. Any of these particles that are drawn to the membrane are
trapped by the membrane and then most are subsequently freed by the high velocity water
above them. These too are henceforth carried along the membrane and out the exit as
additional retentate. A larger portion of the feed water is thus able to cross through the
membrane with less build up and clogging of the membrane34. The two exit streams are
classified as follows: (1) the Retentate, high in concentration of suspended solids; and (2) the
Permeate or filtered solution that has been filtered of suspended solids. This process is shown
in Fig 3.1. With this method, there is still some build up on the membrane, and backwashing will
eventually be necessary, but the duration of the filtering cycle between each backwash is
significantly increased, as is the volume of permeate produced.
Membranes for drinking water production are generally manufactured from synthetic
polymers to reduce costs. These polymers may be any of “a wide variety of materials, including
Cellulose Acetate (CA), Polyvinylidene Fluoride (PVDF), Polyacrylonitrile (PAN), Polypropylene
(PP), Polysulfone (PS), Polyethersulfone (PES), or other polymers”35. Ceramic, metallic and
organic membranes are other options but lack the manufacturability and durability of the
polymeric membranes. Material choices are often based upon strength as large commercial
operations may be required to operate at pressures as high as 85-100kPa36. For this thesis,
strength will be ignored as the filter is unlikely to operate under high pressure.

18
One of the greatest benefits of using membrane filtration is the length of life of the
membrane itself. The technology is robust enough that it can withstand years of use and its
simple maintenance requirements make it a desirable filtration option:
When membranes no longer produce clean water at the desired rate, they
are cleaned in place with soap and water and returned to service.
Membranes can be repeatedly cleaned for years of productive, dependable
service prior to replacement”37.
There are four main forms of membrane filtration, classified based on the size of the
pores of the membrane:
1) Microfiltration (MF) uses pressure-driven membrane filtration. Pore size: 0.1-0.2µm
2) Ultrafiltration (UF) uses pressure-driven membrane filtration. Pore size: 0.01-
0.05µm
3) Nanofiltration (NF) also a pressure-driven membrane filtration and uses some of the
principles of reverse osmosis. Pore size: ~0.001µm
4) Reverse Osmosis (RO) a process that uses pressure to force the migration of the
water from one side of the membrane to the other. Pore size: 0.0001µm38.
The effectiveness of these filtration methods with respect to pathogen removal are
shown in Fig 3.2. Effectiveness improves with a decrease in pore size but this is associated with
increased pressure demands. As technological advancements in membrane technology
progress, new designs opt to minimize the pressure needed for effective particulate removal.
As Fig 3.2 shows, such filters are also highly successful in removing protozoan, oocysts, helminth
ova, and bacteria/viruses39. Reverse Osmosis filters can even remove dissolved constituents,
NDMA(N-Nitrosodimethylamine) and other related organic compounds. The ability to filter
while simultaneously disinfecting avoids the need for subsequent disinfection treatment.
Membrane technology’s mechanical method of disinfection also prevents the opportunity for

19
microbial resistance to chemicals to develop. Additionally, metal salts (iron or aluminum) can
also be added to the process to increase the filters’ performance40.
There are three common membrane modules: Tubular, Spiral Wound, and Hollow Tube.
Tubular membranes are cylindrical in shape (ranging from 5-15mm in diameter) and arranged
lengthwise inside a tube. Feed water enters the tubes from within and is forced through the
cylinder walls. Due to the size of the cylinders, clogging is very rare41. Spiral wound membrane
filters act very similar to Cross-Flow filters mentioned earlier. They are manufactured as flat
sheets and then rolled into compact spiral shapes. As the feed water passes through the length
of the roll, some passes through the rolled up membrane layers depositing contaminants on the
membrane. This permeate flow is diverted along the spiral to the centre where it is collected in
a pipe that exits the filter carrying the cleaned water. The remainder of the flow and residue
exit out the other side of the roll42. Hollow membrane filters function similar to Tubular filters.
The main difference is the diameter of the cylindrical fibres which is on the order of 0.1µm and
less. As such, the filtered water quality can be extremely high. They are, however, very easily
clogged and are therefore generally limited to uses in which the feed water already has a low
suspended solids content43.
The reader must keep in mind that these units are not standalone. All membrane filters
require water be pre-treated to avoid fouling. They also require a constant supply of electricity
to drive the pumps necessary for the pressure differences used to remove pollutants from the
water, although MF is possible without any pump work. Maintenance workers will need to
handle residual waste and be prepared to properly dispose of the concentrate. Finally, such
technology currently lacks a cheap and reliable method of monitoring the exit water’s quality.
In the specific case of Reverse Osmosis filters, these are best used for groundwater/low solids

20
surface water and are expensive compared to conventional treatments (including micro and
ultrafiltration)44. Table 3.2 outlines the minimal energy and pressure demands for the various
membrane filters available. Such filters cannot be easily manufactured locally. The
transportation and technology costs cannot guarantee affordability on a per household basis.
The intensity of the filtration process is better suited for larger projects and so has potential for
community sized filtration plants used in the future.
Ceramic
Ceramic like other barrier filters relies on its effective porosity to trap particles larger
than its pore size. Usually, the ceramic is clay formed into a pot shape before fired up. The
benefits ceramic based filter media include its low cost, material availability, and easy
maintenance. Ideal clay for the filter is that of clay castoffs from local brick factories that have
not been fired up45. Such clay has been aged for several weeks and has improved porosity that
fresh clay lacks.
As part of the manufacturing process, potters are suggested to add sawdust or rice hulks
to the clay mixture. Once fired up, these materials burn off, leaving behind a regular, even pore
distribution in the material46. It is imperative that once the clay has been formed and fired, the
sides of the pot not be handled as the oils from workers’ hands can deposit dirt that inhibits the
optimal performance of the filter while at the same time allowing for potential bacterial
contamination of the water once the filter is set up47. A layer of colloidal silver is painted on the
inside of the pot. The silver ions kill approximately 99.88% of bacterial and viral pathogens
found within the tainted water source by disrupting their respiratory function48.
Since these filters are relatively simple and easy to make locally, they can be
manufactured at an exceptionally low cost, with some estimates as low as $4 US (2005)49. To

21
ensure that filters are working at optimal performance, the interior needs to be scrubbed
approximately every six months to remove built up residue50. While such filters are cheap and
easy to manufacture, they lack the ability to remove chemical toxins from water. Furthermore,
delicate handling of the pots is imperative to prevent cracks from developing prematurely which
will render the filter useless. Likewise, they lack redundancies to ensure that the water leaving
the filter is truly potable.
Overall manufacturing requirements include a cement mixer and grinder to process the
aged workable clay, colloidal silver which can either be purchased or manufactured through
electrolysis, rice hulks, sawdust or similarly cheap, fine, combustible particles to create the
necessary pores within the filter, and a kiln/cooling area. Workers can be trained to properly
manufacture and maintain the filters51.
Concrete
Concrete is a mixture of cement, fly ash, slag cement, various aggregates (such as gravel,
limestone or granite), water and potential chemical admixtures (CaCl2, NaCl, C6H12O6, or
plasticizers)52 and is used as another cheap, simple to manufacture barrier filter. Aggregates
and admixtures are responsible for the various properties of concrete including its porosity and
resistance to corrosion. Furthermore, like ceramic, concrete can be formed into various shapes
and solidified. Unlike ceramic this does not require intense heat but rather the addition of
water.
Cement is slightly hazardous for workers, as unsafe exposure to the fine particles can
cause respiratory problems if inhaled. Individuals may also suffer from cement burns or skin
inflammation due to allergic contact dermatitis53, finally heavy cement filters need to be
carefully transported to avoid injury.

22
As with ceramic filters, care must be taken to ensure that concrete filters are not
delivered cracked. They must be monitored for chemical corrosion to prevent potential leaks in
the filter. Fortunately, as with ceramic, these can be gently cleaned by scrubbing away the dirt
film that has developed. However, unlike ceramic, these filters only trap larger particles and
improve the turbidity of water. There is no bacterial/viral or chemical process to treat the
water; thus concrete can only be used as an intermediary filtration step where water will need
further treatment. Finally, the filter will need occasional drainage to remove dirt build up. Both
cement and ceramic filters naturally cool the water as it sweats through the media.
Disinfection Treatment
This subsection contains processes that attack bacteria and other living organisms.
These processes are most commonly chemical in nature, however, can include methods such as
Ultra Violet Radiation, which is discussed here as well. Of note, because disinfection treatments
are aimed solely at neutralizing bacterial and viral threats, they are usually a secondary form of
treatment that is preceded by some form of filtration aimed at eliminating particulate matter
from the feed water.
Ultraviolet Radiation
As the name suggests, ultraviolet bulbs are used to disinfect contaminated influent
passing by. “The germicidal properties of the radiation emitted from ultraviolet (UV) light
sources have been used in a wide variety of applications since its use was pioneered in the early
1900’s”54. There is an effective range of electromagnetic radiation which destroys a large
number of bacterial and viral contaminants commonly plaguing drinking water. The optimum
intensity range of effective electromagnetic radiation is between 250 and 270nm, with the
consumer standard set at bulbs with an intensity of 245nm55. Table 3.3 lists common pathogens
found in drinking water and the necessary UV dosage at 245nm to render them innocuous56.

23
The Tobacco mosaic virus requires the largest dosage of 440,000 µW-s/cm2, this
translates to needing 0.44J of energy per square centimetre of water that crosses the UV
barrier. With such small dosages required, UV light can be pulsed at short intermittent times to
disinfect the water, thus conserving energy in the process. Mere seconds of UV exposure
effectively treat visually clear water as water flows past a UV light chamber housing the UV bulb
and its necessary components, while UV light is emitted killing 99% of the listed pathogens57. At
no point in time does the water actually come into contact with the bulb or other equipment, it
simply passes by a UV transparent chamber.
The benefits of using ultraviolet radiation as a sanitizer include the method’s
effectiveness regardless of the water’s temperature and pH level. There is no need to store any
hazardous materials as is the case with chemical disinfection. Furthermore, no Volatile Organic
Compounds (VOCs) or toxic air emissions are produced in the process, there are no known toxic
or non-toxic by-products, and there is no danger of overdosing on the dosage of UV energy that
the water is exposed to58.
As the use of UV bulbs requires energy, there is a need for a stable, high voltage supply
of electrical power. Microbial factors, such as type, source, age and density of the water, along
with chemical factors such as the presence of nitrites, sulfites, iron, the water’s hardness, and
aromatic organic levels will all impede the disinfector’s performance59. UV radiation acts as a
“point disinfectant”. It kills pathogens that happen to pass by the UV chamber when activated.
If however, pathogens manage to escape breed further down the system, UV treatment
provides no protection against re-infection downstream60. This type of treatment requires
frequent monitoring by trained staff and is better suited for large filtration systems. Scheduled
maintenance and frequent testing of the bulb intensity and water quality are necessary to

24
ensure that the bulbs are effectively penetrating deep enough within the passing water supply
to treat the entire volume. As time passes, debris and pollutants may deposit themselves
against the bulbs’ housing, inhibiting the UV rays from destroying the pathogens by blocking
their path.
This type of treatment requires a minimum of two bulbs, that are pulsed energy, broad
band xenon; narrow band excimer or continuous band mercury, to ensure that even if one is not
operable or is being replaced the other can continue to disinfect61. Mechanical wipers for
optimal transmission between cleaning and maintenance work are beneficial. Photodiode
sensors monitoring the intensity of the UV energy supplied to the interior of the water supply
aid in detecting any changes to the dosage supplied. Also required are quartz sleeves with
appropriate transmission rates, and safety controls that will automatically shut off the lamps
when functioning at high bulb temperatures and dealing with low flow levels62. Finally, ballasts
used to supply regulated power are required and come in three forms: standard (core coil),
energy efficient (core coil) or electronic solid state63. Such complicated parts clearly suggest
that this is a much more sophisticated and demanding purification process than is applicable for
intended customer. Other maintenance demands include cleaning of the UV chamber at least
every six months, and that calcium levels, turbidity, and colour be observed to ensure that these
factors do not hinder the performance of the bulbs64.
Chemical Purification
Chemical purification relies on chemical reactions to drive the disinfection process. Its
advantages include its effectiveness, lack of energy requirements, and ability to support fast
flow rates within a water treatment system. Its disadvantages may outweigh its benefits and
warrant it impractical as a process for individual household purposes. These include the
expensive and ongoing need to purchase treatment chemicals, the complicated nature of
25
delicately balancing the additives to obtain the correct quality of water while not exposing
drinkers to harmful levels of toxins, the potential for incorrect handling and disposal of the
chemicals and their waste which can threaten both human and environmental safety, and the
inability to improve taste and some physical characteristics of the water (such as turbidity)65.
There is a long list of potential chemicals that can be added to treated water to disinfect
the supply. These are broken up into two categories: coagulants and precipitants. Coagulants
are involved in the “chemical destabilization of particles and in the formation of larger particles
through perikinetic flocculation (collection of particles in the size range from 0.01 to 1µm)”66.
Precipitants are chemicals added “to alter the physical state of dissolved and suspended solids
and facilitate their removal by sedimentation”67. Both cases need contaminants strained or to
sediment out of the flow water. The following is a list of popular coagulants and precipitants:
Alum, Aluminum chloride, Calcium hydroxide (lime), Ferric chloride, Ferric sulfate, Ferrous
sulfate, and Sodium aluminate. Precipitants to remove heavy metals and dissolved organic
substances include Cadmium hydroxide, Cadmium sulfide, Chromium hydroxide, Copper
hydroxide, Copper sulfide, Iron II hydroxide, Iron III sulfide, Lead hydroxide, Lead sulfide,
Mercury hydroxide, Mercury sulfide, Nickel hydroxide, Nickel sulfide, Silver hydroxide, Silver
sulfide, Zinc hydroxide, and Zinc sulfide68.
Chemical exposure to above mentioned acids and bases can lead to dangerous skin
burns, and irritation of mucosal linings. Many are known mammalian cell mutagens and high
exposure to any can cause death69. Finally, as these chemicals are not necessarily available
locally, there is the impractical need to have them delivered, a large deterrent for employing
this technique in remote regions of the world.

26
Carbon Adsorption
Adsorption is the binding of molecules or particles to a surface. These binding forces
are generally very weak, reversible, and can attract almost anything of appropriate size that is
dissolved or suspended in a solution (in the case of water filtration). Compounds with stronger
colour, taste and odour tend to bind the strongest70. While there exist many materials that can
be activated such as alumina, silicas, zeolites, clays, polymers and even biomass activated
carbon (AC) has the strongest physical adsorption forces, per volume of adsorbing porosity, of
any known substance 71. This ability to adsorb is due to its great surface area. AC can achieve
surface areas of greater than 1000m2/g when activated properly72.
The adsorption process is based largely upon the ratio of the concentration of the
particulate to its solubility in the mixture. In general, adsorptivity is understood to depend on
five factors:
1) Physical properties of the AC (pore size and distribution). Filtration is best when the
pores are slightly larger than the contaminant molecules.
2) The chemical nature of the carbon source (amounts of hydrogen and oxygen
associated with it). “AC materials formed from different activation processes will
have chemical properties that make them more or less attractive to various
contaminants”73.
3) The chemical composition and concentration of the contaminant. There is a
tendency for AC to form the strongest binds to organic molecules, likely because the
chemical nature of organic molecules and AC are very similar.

27
4) The temperature and pH of the water. As pH and temperature decrease organic
chemicals occur in more adsorbable forms.
5) The flow rate and the amount of time it is exposed to the feed water. Since carbon
adsorption is based largely on physical contact of the contaminant with the AC, the
longer the exposure of the AC, the more effective the filtration.
Activated carbon is essentially a crude form of graphite. It has a very porous, imperfect
structure that enables it to adsorb a broad size range of compounds. AC can be produced from
a wide array of materials including: wood, coal, peat, coconut shells, saran, and recycled tires74.
Material differences result in variations of the distribution of internal pores, affecting the
surface of the carbon and therefore its ability to adsorb75. Additionally, alkali ash content of the
final product varies depending on the base material which can increase the pH of the filter,
hindering AC’s ability to adsorb organic chemicals76. These values can range from 2 – 25%, with
the average falling at around 7%77. Ultimately, the microscopic structure (pore sizes and overall
surface areas), surface quality, and chemical composition can drastically change the
performance of the filter78.
While activation is relatively uncomplicated, the technology required in producing
consistent AC needs to be capable of maintaining strict quality control79. Production and
processing techniques for AC are dependent on the nature of the base material and the desired
characteristics. The most common production techniques used are Chemical Activation and
Steam Activation. Chemical Activation is used largely for organic base materials such as wood
and peat which “is impregnated with a strong dehydrating agent ... mixed into a paste and then
heated to temperatures of 500 – 800˚C ... the resultant activated carbon is washed, dried and
ground to powder”80. Steam Activation is used when coal and carbonized coconut shell are the

28
base materials. The activation process is carried out at 800 - 1100˚C in the presence of steam81.
As gasification of the material with steam occurs, the produced carbon monoxide and hydrogen
are burned off leaving the porous particles behind. This AC is then graded, screened and de-
dusted. Carbon produced by Chemical Activation tends to be very macroporous (containing a
wider pore structure) and this is ideal for adsorbing larger molecules. Carbon produced by
Steam Activation tends to be either microporous or mesoporous (containing finer or medium-
sized pore structures) better suited for adsorbing suspended compounds within liquids and
vapours82.
Activated Carbon particles can be produced in varying sizes:
Table 3.4 – Activated Carbon Magnitudes and Applications83
Granular Activated Carbon (GAC)
Powder Activated Carbon (PAC)
Pellet Activated Carbon
Typical Particle Sizes (mm)
0.20-5.00 ≤0.18 0.80-5.00
Typical Applications
Liquid and Gas phase Liquid Phase and Flue Gas Treatment
Gas Phase applications (lower pressure drop, higher mechanical strength, low dust content)
Activated Carbon has been shown to be able to remove several organic, and inorganic chemicals
to meet EPA Health Advisory Levels. These include Trihalomethanes, Pesticides, Industrial
Solvents (halogenated hydrocarbons), Polychlorinated Biphenyls (PBCs) and Polycyclic Aromatic
Hydrocarbons (PAHs)84 as is shown in Table 3.5.
However, activated carbon is ineffective for removing microbes, sodium, nitrates,
fluoride and hardness from water sources. Also, lead and other heavy metals can only be
removed by very specific Activated Carbon filters.

29
Chapter 4 – Technology Assessment
Method Selection Given that each of the methods described above has its respective strengths and
weaknesses, an organized means of selecting the most appropriate technology is necessary. A
common set of criteria was used to evaluate each method. These criteria have been organized
into subcategories as follows:
1. Parameters: this is a loose category describing the physical properties of the unit.
These are represented by the size of the unit, its anticipated flow rate, and the unit’s
storage capacity. Effective technology should not be insensitive to the need for
adequate unit storage. It must meet the 86L/day per household member requirement
specified earlier.
2. Life: is the qualitative precursor of the more detailed Life Cycle Analysis that will be
conducted for the chosen filter. Exotic material use, high maintenance demands
reflected in frequent and/or energy intensive processes, and the difficulty of use are to
be avoided.
3. Effectiveness: the major contaminants identified using GEMStat’s data must be reduced
to WHO standards with the basic expectation of large particulates removal, and
improved clarity, taste and odour of water.
4. Health Risks: the health risks associated to those making the units and using them. This
includes the manufacturing, use and disposal stages of the unit. The materials
themselves may be hazardous to health if inappropriate exposure occurs (as with
chemicals or radiation). Likewise, the technology to make the unit may incur a degree
of danger, (ex. Use of power tools).
30
5. Environment: anticipated damage to the environment during production, use, and end
of life are points of concern. Introducing a method which demands the disposal of
hazardous material (for example) would be insensitive to the already delicate conditions
of the environment that it is being used in. Furthermore, such degrading material or
technology can adversely affect the water quality of the site demanding more elaborate
treatment practices not necessarily accessible by the target demographic.
A Pugh matrix was developed with these five subheadings to compare the eight
treatment methods (Table 4.1). The weights provided are out of a cumulative 100% based on
level of importance as defined by the team for the overall success of the project. Some
properties, such as the size of the unit were considered less important than its effectiveness at
eliminating microbiological activity, the one being more aesthetic in nature than the other. The
ratings for each property were 1-8 where one was the least favourable and eight the most. The
original shows the weight assigned compounded with the raw score to create a weighted
average. The scores were then ranked, best being assigned first place and so forth.
Thus sand filtration has been identified as the best method for addressing the water
quality issues for the largest population while minimizing environmental and health risks
associated with its use.
Slow Sand Filtration Improvements
The main focus thus far has been upon the principles underlying slow sand filtration
technology, with little consideration given to any method that optimizes its function. There are,
in fact, several ways that the quality of the filtration can be improved, and the flow rates
increased. Filtrate quality is dependent upon a large variety of control factors including grain
size of the sand, quality (turbidity) of the influent water, amount of hydraulic loading (pressure

31
head of water above the filter bed), depth of the filter bed, and temperature of the filter. By
manipulating these control factors, one can optimize a filter to perform best. As will be
discussed, the quality can be further increased through the application of select pre-treatment
methods, use of metal-oxide sand, sand that has been pre-seeded with select microorganisms,
or through use of a sand-anthracite mixture85. For the purposes of this thesis project, only the
first improvement mentioned will be considered in-depth (select pre-treatment methods), also,
an improvement upon slow sand filtration is here defined as a change to the filtration process
that will improve either water quality or flow rate, without any sacrifice to the other.
Attempting to vary some of the control factors to optimize a filter may prove to be very
arduous task. For example, filtration rates are largely dependent upon the size of the sand
grains used, as is evidenced by Darcy’s Law for fluid flow through porous media (See Appendix B
for the equation and its derivation). This equation shows the proportional relationship between
the size of the grain and the filtration rate, namely, the smaller the sand grain, the lower the
hydraulic conductivity of the filter bed and the lower the filtration rate. While it may seem
prudent to improve the filter performance by increasing the filtration rate by increasing the size
of the grain, this degrades the quality achieved by the filter. For effective filtration, it is
necessary to use sand in the range of 0.23-0.60mm, because small grain sizes are important for
trapping suspended solids and organics in the influent water86.
Similar trade-offs would be necessary if one were to drastically change any of the other
aforementioned factors. For example, flow rates can be increased by changing the pressure
head above the filter bed (using a greater height of water), but this can drive the organics that
feed bacteria deeper within the filter, and stimulate growth that can adversely affect the quality
of effluent water87. The complication of dealing with these factors is echoed by the work of

32
Huisman & Wood, who wrote that “so many variables govern *the bacterial growth and filter
performance] ... that it is virtually impossible to make predictions, except on the basis of
previous experience with the particular water concerned”. There must be a simpler means of
improving filter performance. One such method is through pre-treatment.
Pre-filtration methods include: screening (the use of a mesh to remove larger
particulate and organic matter), reservoir storage (in large, open reservoirs for lengthy periods,
to facilitate the growth of bacteria causing pathogen breakdown), sedimentation storage (in
smaller quantities and for shorter time scales, to encourage larger particles to sediment), pre-
conditioning (addition of chemical to precipitate out salts), pre-chlorination (as a form of
sterilization), pH adjustment, flocculation, and the addition of coagulation agents (to encourage
smaller particles to precipitate from the water). When used in conjunction with slow sand
filtration, only two methods (screening and sedimentation storage) are applicable to the
objectives of this thesis. While there are many benefits to large reservoir storage, it is not
applicable in every situation, as it is best suited for the sides of rivers.
Pre-conditioning and pH adjustment are very useful processes for helping control the
chemical characteristics of the water before it reaches the filter. These processes are, however,
costly to implement and run since they depend on a supply of chemicals (such as lime, soda ash,
hydrogen chloride, or carbon dioxide) that are not locally available in most regions of the
world88. Additionally, these processes are not easily adaptable to individual household use and
are better for large-scale water treatment processes. A similar argument can be made for
flocculation and coagulation, which are most effectively applied to large operations. Most
importantly though, in the case of slow sand filtration, these two processes are not

33
recommended to be used as pre-treatments because floc carryover into the filter will very
rapidly clog the filter bed89.
Screening is a very simple process whereby a mesh is used to sift out larger particles,
such as leaves or twigs, and organics from the water that can otherwise clog the filter. Although
simple, this process can significantly ease the burden on the filter, improving run times between
necessary cleaning and the filter’s effectiveness. This process is generally not necessary for
groundwater sources since they are not likely to be contaminated with debris. It is, however, a
suggested pre-treatment method where applicable because both its construction and
implementation are very simple. The mesh can be made from a simple string grid or loosely
woven cloth hung over a wood frame which can be used to stir up and skim the water.
Alternatively, it can consist of a simple piece of fabric at the top of the filter through which the
water is poured, effectively straining out much of the larger particulate in the water.
Sedimentation storage can also be advantageous for the same reason. If the water is
stored and not perturbed for a period of time before being put through the filter, the heavier-
than-water particles will begin to sediment and collect at the bottom. In municipal and large-
scale water purification operations, this is advised to take place for at least 4 hours, however,
for application on a smaller scale (likely in buckets and jugs of volumes 20L and up) the
sedimentary process will be much quicker due to the shorter distance the particles can drop90.
Of note, the time-frame of these processes will be largely dependent upon the turbidity of the
water, with more turbid waters requiring more time to sediment. Lastly, while it is possible for a
sample of stagnant water undergoing the sedimentary process to begin culturing bacteria, this is
unlikely as it would require time on the order of days, rather than hours.

34
Life Cycle Analysis
The Economic Input Output Life Cycle Analysis is a useful tool in comparing multiple
options for the same problem or determining which stage of the process/object’s life (be it pre-
during manufacturing, use or end of life) is the most energy and pollution intensive and
problematic. For recommendation purposes, existing model currently manufactured and in use
has been analyzed. Biosand’s filter and mould designs which use the Schmutzdecke as part of
the treatment process is a sand filter encased in a long cylindrical column with a PVC pipe exiting
from the bottom and brought along the side of the column to a height a few inches above the
interior sand layer. This ensures the pressure gradient keeps the Schmutzdecke layer moist.
The unit’s individual components have been priced in current USD and converted to 1997 dollars
using the Consumer Price Index to conduct the EIOLCA. Of all the models provided by The
Green Institute of Carnegie Mellon University (including the University of Toronto’s/ Statistics
Canada 2002 model), the US Department of Commerce Industry Benchmark 1997 was selected
as it is the most detailed (divided into 439 consumer sectors)91. The greater definition of each
sector allows for a more accurate assessment of each component in the LCA.
Using BioSandFilter’s prescribed dimensions, their filter has been calculated to costs
$5.59 2008 USD. This cost includes all needed equipment and materials, transit and labour
according to US industry standards. As is explained later it has an appreciable service life of
several decades. The concrete encasing the sand filter mould needs cement, sand, ballast
(gravel 8mm to 30mm in diameter), PVC 1/2” tubing and elbows, cooking fat, steel sheets, nuts
and bolts, and steel shafts. Please refer to Appendix C for a detailed part listing and the
complete EIOLCA which includes environmental products produced in the process.
The mould outlined by BioSandFilter can create multiple filters. Thus the overall LCA is
for the production of 1000 individual water filters over its lifetime. This number reflects the

35
durability and longevity of the mould while recognizing that individual communities do not
normally exceed a thousand families.
The equipment needed to produce the mould should be available in urban centres close
to said communities. In the event that drills, grinders, lathe, rolling, and welding machines, are
scarce, the mould will have to be manufactured elsewhere and transported to the area of need.
Such additional costs have been incorporated in the EIOLCA as they cannot be accurately
estimated.
Premanufacture
Two important conditions must be met for the success of the filter’s use. The first is
ensuring families have access to said technology/units. The other, is proper education of users.
Before, and while making the filters, users must understand:
1. The purpose of the unit
2. How to properly care for units
3. When units are most effective at treating water
4. How to dispose of the unit once it becomes obsolete through physical damage or
improved water infrastructure and treatment
5. The limitations associated with the unit
Helping distribute the education and materials/equipment required to make the filters
will prove inadequate in correcting water quality issues faced by users until these points are
internalized.

36
Manufacture
The process of creating the filter moulds and units themselves may vary due to material
and equipment limitations. The mould can be made in towns that have the necessary
equipment and then shared amongst outlying villages to make the units. As the filter is made of
concrete it is difficult to transport once made and hence this concern should be responsibly
considered before manufacturing commences. Transportation should be minimal, safe for
workers, and minimize filter damage by cracks, clogging, or exposure to contaminating agents.
The mould itself is handmade. It is imperative that no dents exist within the inner core
piece as this will make it impossible for removal once the concrete has set92. It takes 25-37
hours for the concrete column to properly harden93. The unit should set for at least 7 days
before being transported94.
While the concrete encasement is made, sand and gravel must be sorted by size and
cleaned to remove dirt and clay95. The unit requires approximately 30 days for the
Schmutzdecke to mature and produce treated water. In the interim it is advisable that users not
drink this water as bacteria removal is limited. The sand within the filter should be kept wet at
all times to ensure the health of the biozone. To minimize the waste of water that runs through
the filter but cannot be consumed, it is advisable that the water be kept and recycled as the
filter improves or used for secondary water consumption needs (i.e. household cleaning,
watering of crops or sanitation purposes).
Distribution/Transportation
To minimize the ecological footprint and costs of making the filter the units should be
made locally or as close to this as possible. Ideally, moulds should be distributed by volunteers
to communities and units be made collectively. Communities should be approached by

37
educators early to explain and encourage the use of the filters. The filters will weigh
approximately 85kg96 excluding the sand used, have a volume of 53L, and stand 1m tall97. The
fine particles of sand should be added once the unit has been brought to the home to reduce
the load and sand shifting during transit.
Use
This filter is capable of producing 1L of treated water per minute with a fine sand height
of 20-25cm (see sample calculation in Appendix B). Fine sand has a hydraulic conductivity of
approximately 10-4m/s with a diameter of 125-250µm98. As the Schmutzdecke develops expect
the flow rate to drop to as low as 10L per hour99. While this is obviously a drastic drop, it may
still suffice for a family’s water needs. Do note that the slower the flow rate, the longer the
water remains in the biological layer and therefore the better the quality of water exiting the
system.
Maintenance
While backwashing improves the flow rate of sand filters it is not the most desirable
practice in water scarce regions. The process itself is very water intensive. It also requires a
pump and energy to drive the fluid up through the sand column and out in the opposite
direction. Furthermore, backwashing disturbs or entirely destroys the biological layer of
filtration that makes slow sand filtration so effective.
An alternative to backwashing is Wet Harrowing100. To do so, users plug the spout to
prevent water from draining out the unit. Water is added from the top into the filter and is
“slowly swirled around by hand”101. The individual cleaning the filter must avoid touching the
sand as this will disturb the biolayer. “The movement of water loosens the accumulated dirt,
which comes into suspension [and] this muddy water can then be carefully decanted, using a
cup”102. The process effectively dislodges particulate matter that has deposited itself deeper

38
within the first layers of sand while retaining the Schmutzdecke intact. “Often the filter is back
to normal operation within hours instead of days to weeks.”103
Removing the sand and washing should only occur every five to ten years104. In
situations where either backwashing or sand washing are employed as maintenance steps a two
column water filter is desirable. In such circumstances, two columns of equal capacity should be
set up (keep in mind size and weight constraints). One filter should be set up weeks earlier than
the other leaving it time to have the slime layer grow. Once this column is operational, the
second should be started up as well. The water that would normally run through the filter and
be disposed due to inadequate treatment can then be run through the fully functional filter and
consumed while the second column matures. Once both are running properly, they should be
used equally. Hence one will always need cleaning about a month or more sooner. This will
ensure that while the cleaned filter is redeveloping the biolayer the overall quality of water
consumed isl maintained.
Projects using biosand filters have found that “some filter owners clean their filter out
of routine, rather than because of blockage or inconveniently reduced flow rate”. Such
practices hinder the filter’s abilities and must be avoided105. Proper use through education is
imperative and should be followed up to ensure the success of such projects.
Flow rate reduction can also be associated with seasonal patterns. The rainy season
often produces more turbid water106. Such problems can be alleviated to some extent through
the employment of pre-filtration practices.
Filters can remain fully operational with no need for maintenance anywhere between 6
months and a year depending on water turbidity107. As such, scheduling cleaning on a calendar
basis is not the best practice. Rather, it should be performed only when flow rates are so low as
to hinder the objective of the system.

39
End of Life
The main components in the filter are the concrete column, the sand and the plastic
pipe. Concrete’s life expectancy can be between 30 to over 100 years given the environmental
conditions108. Since the concrete container will not be exposed to any degrading chemicals, is
resistant to normal weathering conditions and will not be moved often, it is safe to assume it
will last longer than 30 years. PVC pipe when used for drinking water will exceed 100 years of
service109. As mentioned above, sand will need to be thoroughly cleaned every 5-10 years.
Hence with basic maintenance practices these filters can last several generations within a home.
The concrete itself can be re-crushed and used as future ballast for other concrete projects. The
recycling of PVC is also possible although currently there are concerns about chlorine release in
industry practices110. Ultimately the end of life permits 100% recyclability.

40
Chapter 5 – Prototype In addition to the goal of selecting a recommended filtration technology, the
requirement of this project is to take said technology and build a test rig that will treat
simulated turbid, bacteria rich water, and run laboratory experiments to demonstrate its
effectiveness. To do so, it was necessary to first assess the requirements of the filter, around
which a design and testing procedure were outlined.
Functional Requirements
The basic requirements for the filter’s functionality were incorporated into the following
nine constraints on the design:
1) Most importantly the prototype must mimic the slow sand filtration process. An
appropriate head of water above the filter bed must be achieved to drive flow.
2) Dirty water must be added near the filter bed so as to minimize disturbance of the sand.
This will permit the growth of bacteria necessary for slow sand filtration’s success.
3) The filter must replicate conditions of daily use by a family unit. It should support use at
regular intervals. As both students involved are not able to monitor the filter daily, it is
necessary to create an independently operating system.
4) Since filter water stagnation for extended periods of time will ruin the bacterial growth
in the filter, the apparatus must provide a continuous cycle of water through it.
5) The testing rig should be designed from inert materials to ensure no contamination of
the effluent water.
6) There are two proposed methods of arranging a slow sand filter. The test rig (a single
system) should be designed to test both filter styles simultaneously. It should be
modular to permit easy incorporation of different designs of gravity-feed filters, should
the need arise to test them.

41
7) The system should handle different flow rates associated with each respective filter, as
well as be capable of handling the various fluctuations in flow rates over its lifetime –
generally, as filters age, their flow rates decrease.
8) The effectiveness of a slow sand filtration unit depends on the bacteria culture in the
filter bed hence appropriate germinating conditions must be met. The test rig must
operate under varying ambient temperature conditions, providing a consistently
controlled environment for the bacteria.
9) Lastly, the test rig is to be transportable, and therefore must be designed to fit into a
Honda CRV (the largest car available to the students). If the test rig cannot be designed
to fit in one piece, it must be designed for disassembly into components that will fit.
Design
An artistic rendition of the layout of the finalized design which supports the outlined
test rig requirements can be found in Fig 5.1. The design drawings themselves can be found in
Appendix D, the modeling of which was done using SolidWorks software.
Basic Operation
A ‘trough’ design was chosen as the most effective way of meeting several of the
functional requirements. Please reference Fig 5.1 for the following explanation. In this design,
water is drawn from the lower reservoir (at 1) and pushed up by a pump to the trough (at 2).
Connected to the trough are the overflow downspout (at 3) which carries excess water back to
the lower reservoir (at 1), and the filter columns (at 4) which draw water from the trough
through the filter bed (at 5) at their respective rates and back to the lower reservoir (at 6). The
turbid test water is added via the upper reservoir (at 7).
As aforementioned, the test rig requires a design that support two different methods of
arranging a slow sand filtration. It is suggested that the frequency of backwashing maintenance

42
can be reduced if the filter bed is arranged in the reverse manner111. In this case the gravel layer
is above the sand, as opposed to the conventional design of the sand layer on top. To comment
on the viability of such a filter, this second arrangement was also tested. In an effort to prevent
particles or filter sand escaping through the filter outlets and into the system, a simple piece of
tightly-woven fabric was placed over the opening, and held in place by the weight of the filter
bed.
Function
A water system height of 71.12cm (28”) above the filter beds was chosen, giving an
effective pressure head above the bed of 6.963kPa (see Appendix B for sample calculation). To
facilitate the addition of the highly turbid test water to the filter water column, the inlet holes
were placed several inches above the filter bed on the side of each column. This ensured that
the test water is added as close to the bed as possible, without disturbing the top layers of the
bed (functional requirements – FRs 1, 2).
The use of a pump to run the system ensured that the test rig does not need frequent
supervision. The test rig can be left running indefinitely, only requiring attention when adding
test water, or to top up water loss due to evaporation (FR 3). Additionally, the trough design
ensured that water is distributed to all filter arrangements on a continuous basis (FR 4).
The water in the trough is maintained at a constant height, hereafter referred to as the
‘system height’. Should one of the filter columns attached experience an increase in flow rate,
this will create a difference in column water height relative to the system height, and this
pressure difference will drive the flow from the trough into the column until equilibrium is re-
attained. If the flow rate slows, less water is pulled from the trough. Thus the trough design
allows for the varying flow rates of multiple filter arrangements (FRs 6, 7).

43
Using aquarium water heaters, the system temperature is maintained constant at 80oF.
These heaters were placed one per filter in each column in order to ensure that the surrounding
cold air did not interfere with the bacterial growth inside the filter (FR 8).
Lastly, in order to maintain a reasonable system height of water, the test rig was
required to be larger than the dimensions limiting its transportation. It was necessary to design
the rig for disassembly into appropriately-sized components (FR 9).
Materials
Because of cost constraints and available building tools, wood was used for the frame of
the structure. It was decided that the most suitable material for the filter columns would be 6”
diameter PVC piping because of its cost-effectiveness, durability, inertness, size, and since it is
used extensively in the construction industry, it is a very accessible form of piping to work with.
Transparent plastic PVC medical tubing and connectors were used for the majority of the tubing
(with clear plastic vinyl tubing used everywhere else). Lastly, to seal connections to the PVC
piping, a flexible, waterproof, silicone caulking was used. These materials were chosen to
conform with FR 5.
Methods
Contaminated Water Source
As previously discussed the populations of interest suffer largely from coliform
bacterial-related problems. In order to properly test a filter with respect to these specific issues,
an appropriate water source was necessary to find or create. Most local large freshwater
sources (including Lake Ontario) generally meet WHO standards, especially during the winter
season when a large quantity of the bacteria and algae die from the extreme weather
conditions112. Since the project spanned from autumn to early spring, it was necessary to find

44
some other consistent source of water, high in coliform bacteria. It was decided that the best
way to meet these requirements would be to culture a large, separate batch of contaminated
water. A 100 gallon aquarium tank was used to so facilitate approximately 30 gallons cultured
water. The bacterial content of the water was seeded using soil, an aquarium-grow solution
(rich in algae, phytoplankton, zooplankton, rotifers, krill, fish, yeast and other natural
ingredients), rotting potato peels, apple core, and peach pit, rusting iron nails, and a plant food
mix (containing 30% Nitrogen, 15% Phosphorous, 15% Potassium). The water was kept
stagnant, at a temperature of at 80oF, and underneath a 15W UV grow lamp. As water
evaporated it was replaced with tap water. To ensure that the chlorine present in the tap water
did not affect the bacteria population growing in the solution, water was left to stand for at least
24 hours before being added to the solution to allow the majority of chlorine to dissipate.
Testing Procedure
The following steps outline the processes undertaken to gather samples to test the
effectiveness of the both filtration arrangements:
(Please refer Fig 5.1 for the following instructions)
1) Stir up the contaminated water, and collect a 275mL sample.
2) Disconnect the filter columns from the trough (at 4).
3) Plug the outlets (at 6) to both filter columns (stagnate the flow in each filter).
4) Disconnect the tubing from the upper reservoir (at 7), and using these, drain the
columns of their water to a level a couple of inches from the top of the filter bed.
5) Reconnect the tubing to the upper reservoir, and add 6L of contaminated water to each
column.
6) Unplug the outlets on the filters and allow the contaminated water to drain through the
beds until the water levels reduce back to a couple of inches from the beds.

45
7) Add an additional 3L of contaminated water to each column, let 2L drain through, and
then take a 275mL test sample from each filter’s outlet. This step ensures that the filter
bed has been cleared of the system water before the sample is taken, so that the
sample results from contaminated water having run completely through the filter bed.
8) Reconnect the filter to the trough, and allow the system to replenish the water in the
filters.
Test Sample Analysis
Upon collection of the test samples, they were sent to Gelda Scientific & Industrial
Corporation for analysis. The bacterial-based tests run on the samples were: Heterotrophic
Plate Count (a measure of all of the bacterial load “that use organic nutrients for growth”113),
Total Coliform (bacteria that “belong in the family Enterobacteriaceae”, bacteria linked to
decay114), Escherichia Coliform (commonly known as “E. Coli”), and Yeast and Mould. These
particular tests were chosen to give an appreciable understanding of the bacterial content of the
samples.

46
Chapter 6 – Sample Analysis
Test Results
The following table is the collection of results taken by submitting two separate sample
sets one week apart to Gelda Labs for analysis. The aim of this thesis is to demonstrate that the
two columns of sand can bring bacteria values down to appropriate levels. The following table
contains the results obtained from testing:
Table 6.1 – Test Results
Sample Name Date of Submission HPC/ml Yeast/ml Mould/ml
TC-MF/ml
EC-MF/100ml
Flow rate L/day
Feed water Control 1 11/03/2009 6700 0 3 34 0
Feed water Control 2 18/03/2009 10000
40 0
Column A - Test 1 11/03/2009 14000 0 0 3200 0 2160
Column A - Test 2 18/03/2009 4800
2200 0 1926
Column B - Test 1 11/03/2009 40000 0 0 4100 0 969
Column B - Test 2 18/03/2009 6000
1500 0 22.5
Biosand Water Mix 18/03/2009 5400 0
System Water 18/03/2009 220 3
Discussion
Column A represents the standard sand column where sand is layered on top of gravel.
Column B is the reverse set up and sand is the final filter layer that water encounters within the
system. The two columns were set up to determine which achieves better quality, flow rates as
well as is better suited for maintenance.
Two sets of samples were collected and submitted to determine whether or not the
Schmutzdecke had enough time to fully develop. The first sample set was sent in three weeks
after the units were set up and first introduced to contaminated water. The second set was
submitted exactly one week afterward. The reader will notice that more samples were sent in
on the second date. While the first samples appeared improved upon visual inspection, the
results came back indicating otherwise. In both columns the results returned showed what
seemed as an inexplicable spike in the quantity of bacteria found in the treated water vs. that
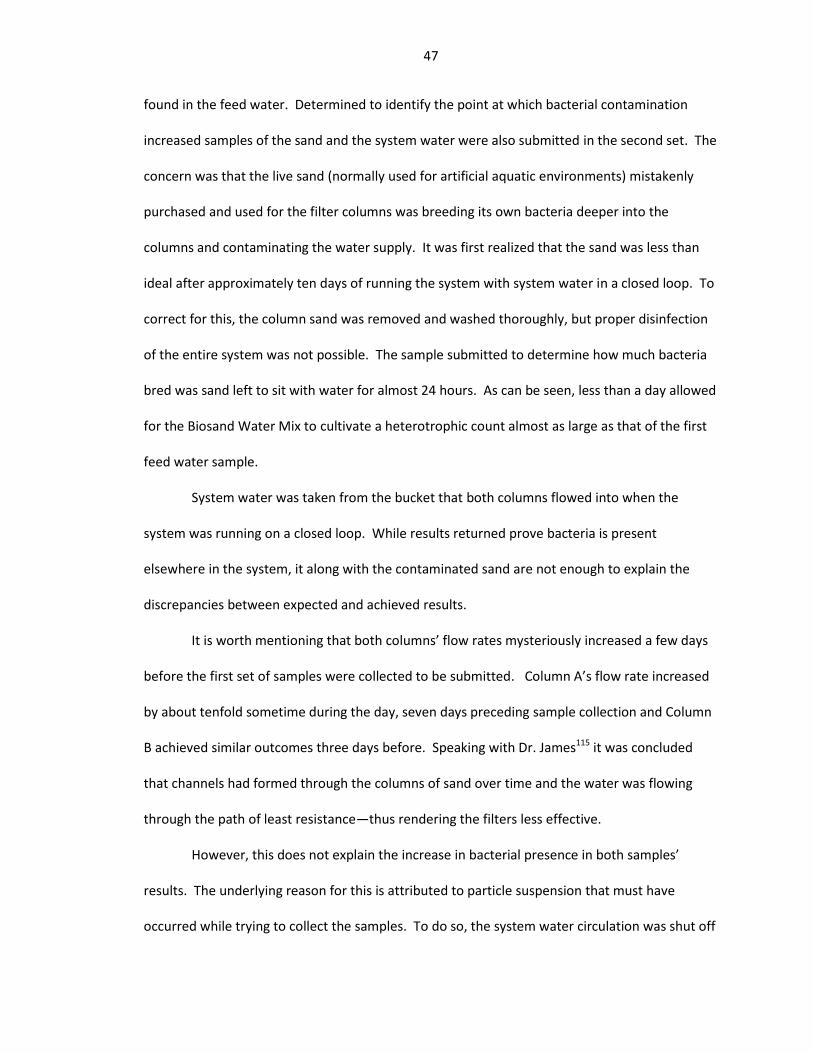
47
found in the feed water. Determined to identify the point at which bacterial contamination
increased samples of the sand and the system water were also submitted in the second set. The
concern was that the live sand (normally used for artificial aquatic environments) mistakenly
purchased and used for the filter columns was breeding its own bacteria deeper into the
columns and contaminating the water supply. It was first realized that the sand was less than
ideal after approximately ten days of running the system with system water in a closed loop. To
correct for this, the column sand was removed and washed thoroughly, but proper disinfection
of the entire system was not possible. The sample submitted to determine how much bacteria
bred was sand left to sit with water for almost 24 hours. As can be seen, less than a day allowed
for the Biosand Water Mix to cultivate a heterotrophic count almost as large as that of the first
feed water sample.
System water was taken from the bucket that both columns flowed into when the
system was running on a closed loop. While results returned prove bacteria is present
elsewhere in the system, it along with the contaminated sand are not enough to explain the
discrepancies between expected and achieved results.
It is worth mentioning that both columns’ flow rates mysteriously increased a few days
before the first set of samples were collected to be submitted. Column A’s flow rate increased
by about tenfold sometime during the day, seven days preceding sample collection and Column
B achieved similar outcomes three days before. Speaking with Dr. James115 it was concluded
that channels had formed through the columns of sand over time and the water was flowing
through the path of least resistance—thus rendering the filters less effective.
However, this does not explain the increase in bacterial presence in both samples’
results. The underlying reason for this is attributed to particle suspension that must have
occurred while trying to collect the samples. To do so, the system water circulation was shut off

48
and allowed to drain out of the columns after which 6L of feedwater were fed through the
columns to collect 275ml samples. To prevent disturbance of the biolayer within the sand while
contaminated water was reintroduced, 2 inches of system water remained above the sand layer.
The column was then stopped as 3 L of feed water were added. At this point that the
momentum normally carrying the water down and through the columns rebounded against the
bottom of the filter loosening particles and bacteria found within the filter bed. This disturbed
bacteria (most of which was feeding off decaying matter carried deeper into the sand) was
flushed out when the water stopper was removed. Hence upon sample collection when another
3L were poured through (to reduce the effects of potential dilution of the first 3L with system
water) the bacteria found its way into the samples.
In support of this theory resettling of the fine sand did occur once the system was put
back into closed system mode. The flow rate of Column B slowed by an appreciable amount.
While originally operating at 969L/day, this dropped to 22.5L/day. Column B shows the effects
of particle suspension and resettling best because it is exposed to the most energy caused by
the pressure gradient. Hence the higher level of bacterial contamination. For this same reason,
it is also resettled more when flow was restored. Since a week passed before the second set of
data was collected this allowed the biotic activity to return to that more characteristic of
properly functioning sand filters. Thus there is a noticeable decrease in the amount of bacteria
carried through the system.
The system water value demonstrates that the filters function effectively to an extent.
Since contaminated water was added every 3-4 days (regardless of sample collection or not) if
the filters performed as poorly as suggested by the column sample data, the bacteria that
escaped would re-circulate and thrive within the system, and the effect would be compounded
by each instance of feed water addition. Instead, over several cycles, the system reduced the

49
bacterial content to 220ppm diluted in 65.65L. This same result would be achieved if 6L of feed
water carried through a filter returned a sample of 2407ppm, in other words a 77% decrease
from influent levels. This implies that for the pressure achieved, a deeper sand bed was
necessary to adequately treat the water.
Sources of Error
While the results are not entirely favourable, they do show that bacterial contamination
can be reduced if the filters are set up properly. As this project incorporated little course
material from previous classes but rather introduced new concepts that were incorporated in
the test, the errors in set up that are now apparent were not so during the design stage. These
sources of error are:
o contamination from tubes
o closed circuit problem (exposure of entire system to poorly treated water)
o Schmutzdecke development incomplete
o sand used had live bacteria culture
o filter bed not deep enough to eliminate all bacteria present
o disturbance in sand and Schmutzdecke created during sample collection
o heaters too warm
One major problem that was realized part way during the test phase was the possibility
that the closed system could effectively permit the entire filter unit to become infected by
bacteria that managed to escape the sand filter. As the Schmutzdecke takes time to mature, it
will not eliminate all pathogenic contamination upon first use. By creating a closed system that
kept the sand moist at all times and permitted the bio layer’s development it also gave bacteria

50
the ability to contaminate the exit tubing, bucket, pump and trough. This became apparent as a
slime layer developed on several surfaces of the unit beyond the filter columns.
Another problem briefly mentioned was the duration of time given for the
Schmutzdecke’s development prior to sample collection. The method used for gathering
samples will have disturbed this layer but not necessarily destroyed it and the one week period
may have permitted it to continue to grow despite having to first restore its previous state
before continuing.
The biggest factors of error were the inadequate sand depth to pressure (driving flow)
ratio and the lack of careful packing116. A sand depth of a few centimetres deeper would have
ensured that slower flow rates were met allowing the particulates suspended in water longer
contact time with the sand and biological layer to ensure contaminant removal. Likewise, better
packing of the sand would have prevented the channel burrowing that occurred. This, along
with a fine mesh placed over the sand to keep it in place would have prevented the particle
suspension effect that occurred during sample collection.
Finally the sand used for the filter, while fine enough, was covered in bacteria of its own.
Despite efforts to wash the sand once this was discovered, the column and rest of the system
were not properly disinfected, to eliminate any contamination present downstream.
While the heaters were installed out of necessity to ensure that the room’s low ambient
temperature did not drop the water’s temperature below life sustaining conditions, it may have
proved to be too warm for the correct balance of bacteria. Instead, weaker heaters or heaters
that could be adjusted to regulate water at a lower temperature should be used.

51
Chapter 7 – Recommended Future Actions If this thesis continued, the experiences thus far have led to the following suggestions
being implemented in the future.
1. Design shorter, smaller water columns with sand layers of varying relative height to find
the optimal height to flow rate condition. Flow rate equation should be used as a
precursor to estimating sand depth
2. Set up a column with only very fine particles of sand
3. Use silica sand that does not contain live bacterial culture
4. Do not heat the water in the columns
5. Take weekly samples of water filtered through the respective columns and monitor flow
rate
6. When setting up columns ensure sand particles are wet and packed well to minimize
potential air pockets that can later lead to channelling
7. Investigate the effectiveness of activated carbon used in conjunction with the sand filter
a. Test effectiveness of recycled carbon
b. Activate carbon personally to gage the complexity of the process and determine
feasibility in application to developing nations
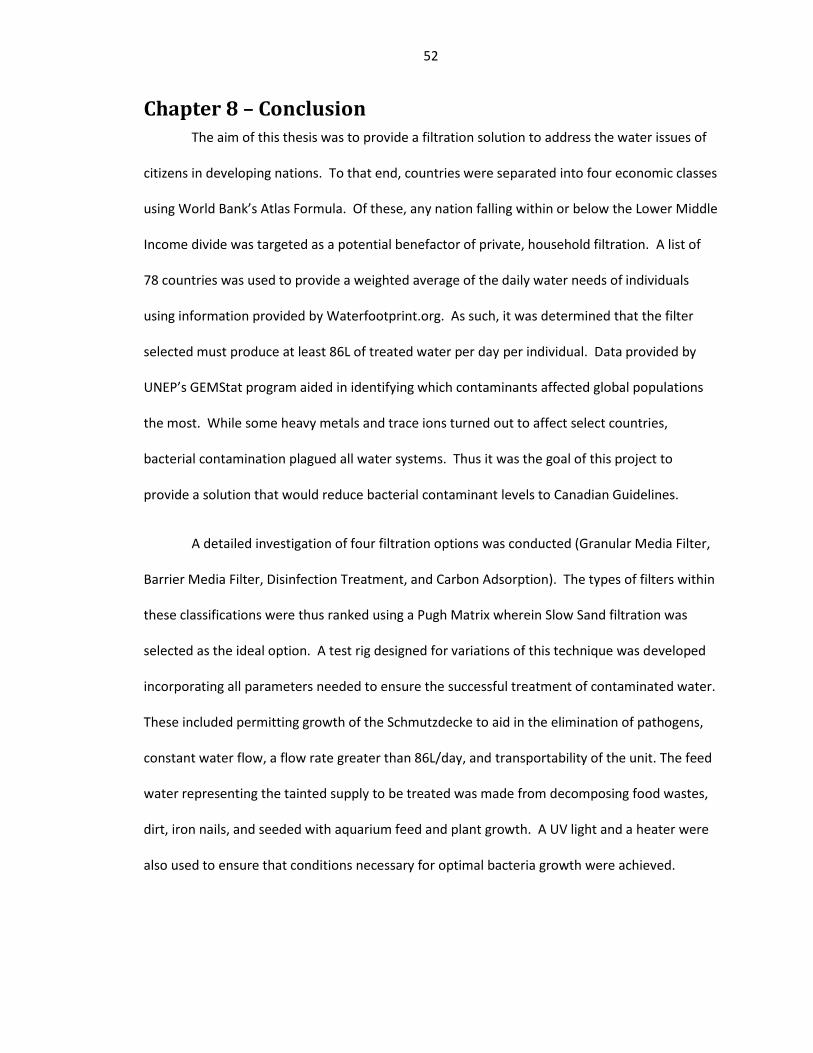
52
Chapter 8 – Conclusion The aim of this thesis was to provide a filtration solution to address the water issues of
citizens in developing nations. To that end, countries were separated into four economic classes
using World Bank’s Atlas Formula. Of these, any nation falling within or below the Lower Middle
Income divide was targeted as a potential benefactor of private, household filtration. A list of
78 countries was used to provide a weighted average of the daily water needs of individuals
using information provided by Waterfootprint.org. As such, it was determined that the filter
selected must produce at least 86L of treated water per day per individual. Data provided by
UNEP’s GEMStat program aided in identifying which contaminants affected global populations
the most. While some heavy metals and trace ions turned out to affect select countries,
bacterial contamination plagued all water systems. Thus it was the goal of this project to
provide a solution that would reduce bacterial contaminant levels to Canadian Guidelines.
A detailed investigation of four filtration options was conducted (Granular Media Filter,
Barrier Media Filter, Disinfection Treatment, and Carbon Adsorption). The types of filters within
these classifications were thus ranked using a Pugh Matrix wherein Slow Sand filtration was
selected as the ideal option. A test rig designed for variations of this technique was developed
incorporating all parameters needed to ensure the successful treatment of contaminated water.
These included permitting growth of the Schmutzdecke to aid in the elimination of pathogens,
constant water flow, a flow rate greater than 86L/day, and transportability of the unit. The feed
water representing the tainted supply to be treated was made from decomposing food wastes,
dirt, iron nails, and seeded with aquarium feed and plant growth. A UV light and a heater were
also used to ensure that conditions necessary for optimal bacteria growth were achieved.

53
When samples were initially run through the columns, it appeared that bacteria was
added to the exiting water rather than being removed. A second set of samples sent in and this
showed that improper sample collection infected the samples sent in for testing. The method of
sample collection caused particulates within the sand to become suspend in the fluid
surrounding the sand particles thus exiting when the samples were taken. Contamination of the
system further downstream had less impact on the overall results achieved than previously
expected. Ultimately, the sand filters were capable of removing approximately 76% of
contaminants with flow rates of 969L/day. The addition of more sand would slow down the
flow and increase the feed water’s contact time with the Schmutzdecke thereby improving the
overall quality further.
A Life Cycle Analysis was conducted to determine the cost of the sand filtration unit. It
was based on an existent model described by BioSandFilter and found to be $5.59 if individual
moulds to make the concrete encasement were used 1000 times. While the results obtained
were not entirely representative of expected results, design improvements should correct the
problems encountered if this thesis is continued in the future and do indicate that sand filtration
is a cheap method of treating bacteria contaminated supplies.

54
Chapter 9 – Tables and Figures (Characterized by order of appearance in the document)
Table 2.1 – World Bank Class Division (imbedded in the document)
Table 2.2 – Target Countries
Africa
Algeria Angola Benin Burundi Burkina Faso
Cameroon Cape Verde
Central African Rep. Chad Côte d'Ivoire
Ethiopia Gambia, the
Ghana Kenya Liberia
Madagascar Malawi Mali Mauritania Morocco
Mozambique Namibia Nigeria Rwanda Senegal
Sierra Leone Somalia Sudan Swaziland Tanzania
Togo Tunisia Zambia Zimbabwe
Americas, the
Bolivia Colombia Dominican Republic, the Ecuador El Salvador
Guatemala Guyana Haiti Honduras Nicaragua
Paraguay Peru Venezuela
Asia
Afghanistan Armenia Azerbaijan Bangladesh Bhutan
Cambodia China Egypt Georgia India
Indonesia Iran Iraq Jordan Korea, DPR
Kyrgyzstan Laos Myanmar Nepal Pakistan
Philippines, the Sri Lanka Tajikistan Thailand Turkmenistan
Uzbekistan Yemen
Europe
Albania Moldova Ukraine, the
Oceania
Papua New Guinea
Table 2.3 – Major Global Contaminants (imbedded in the document)

55
Table 2.4 – Summary of WHO and National Water Contaminant Guidelines117 Geographic
Region WHO
(Guidelines) European Union
(Standards) Canada
(Guidelines) Australia
(Guidelines) New Zealand (Guidelines)
Japan (Standards)
United States (Standards)
Parameter mg/L mg/L mg/L mg/L mg/L mg/L mg/L
Algae, blue-green >1 toxic/10
mL
Aluminum 0.2 0.2 0.2 0.2 0.2 0.2
Ammonia- un-ionoized
* 0.5 0.5 0.5
Antimony 0.005 0.005 0.006 0.003 0.003 0.006
Arsenic 0.01 0.01 0.01 0.007 0.01 0.01 0
Barium 0.3 # 0.004 0.004
Boron 0.3 0.001 0.001 4 1.4 1
Bromate * 0.01 0.01 0.02 0.025 0.01 0
Cadmium 0.003 0.005 0.005 0.002 0.003 0.01 0.005
Calcium * 300
Chloride 250 250 250 250 200 250
Chromium 0.5 0.5 0.5 0.5 0.5 0.1
Coliform- total # 0/100mL 0/100mL 0 0
Colour # # & >5 degrees 15 colour units
Copper 2 2 2 1 2 1 1.3
Cyanide 0.07 0.05 0.05 0.08 0.08 0.01 0.2
Enterococci 0/250mL 0/250mL
Escherichia coli 0/250mL 0/250mL >1/100mL
Hardness * # & 300
Iron # 0.2 0.2 0.3 0.01 0.3 0.3
Lead 0.01 0.01 0.01 0.01 0.01 0
Lithium 0.9
Magnesium 300
Manganese 0.5 0.05 0.05 0.5 0.5 0.05 0.05
Mercury 0.001 0.001 0.001 0.001 0.002 0.0005
Mercury- inorganic
0.002
Molybdenum 0.07 # 0.05 0.07
Nickel 0.02 0.02 0.02 0.02 0.02
Nitrate 50 50 50 10
Nitrate + Nitrite 50 10
Nitrite 0.5 0.5 3 1
Odour & & &
pH * # 6.5-8.5 5.8-8.6 6.5-8.5
Selenium 0.01 0.01 0.01 0.01 0.01 0.01 0.05
Silver # # 0.1 0.02 0.1
Sodium 200 200 200 180 200
Solids- total dissolved (TDS)
* # 0.1 0.02 0.1
Sulfate 500 250 250 500 250
Tin * # 1 0.0005
Tritium 100Bq/L
Turbidity * # & >2 degrees n/a
Uranium * # 0.02 0.02 0.002
Vanadium 1.4 #
Zinc 3 # 3 1 5
Where: *,#,^,& represent no guideline, not mentioned, 250µS cm-1, and acceptable to consumers no abnormal change, respectively

56
Fig 2.1 – Iron Contamination in Asia
Fig 2.2 – Sulphate Contamination in Africa

57
Fig 2.3 – Population Representation for Africa
Table 3.1 – Anthracite Sizing (imbedded in document)
Fig 3.1 – Membrane Cross-Flow Filtration118
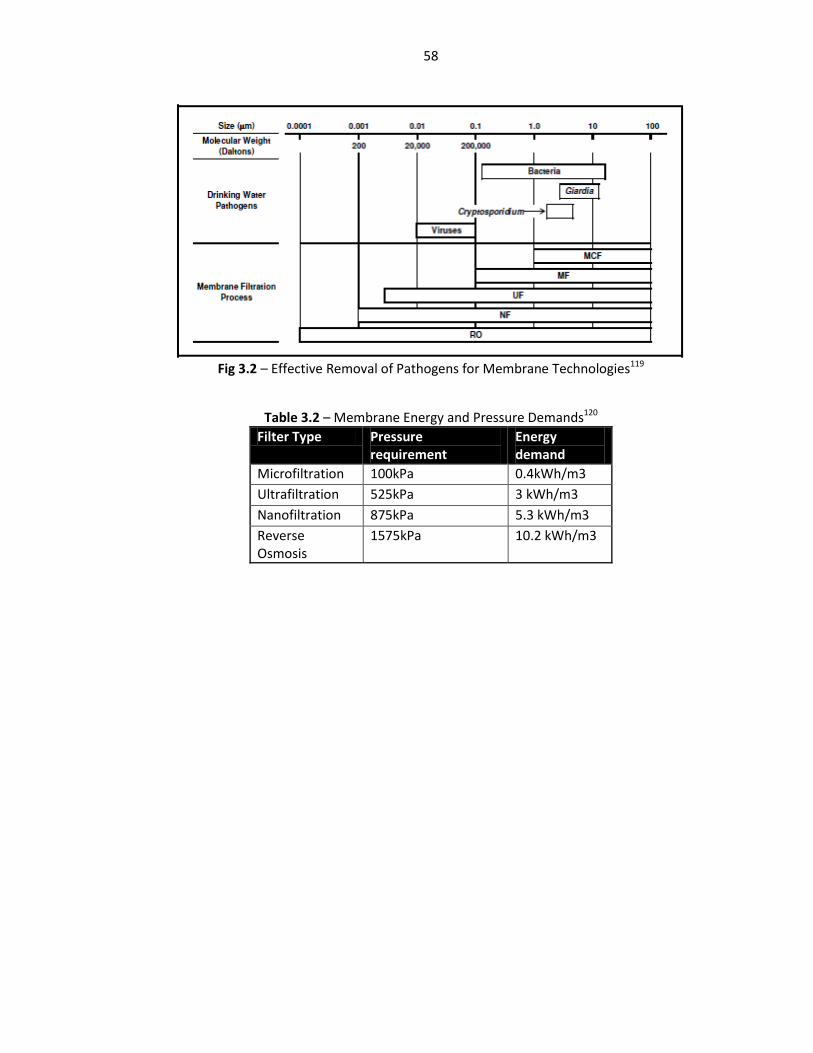
58
Fig 3.2 – Effective Removal of Pathogens for Membrane Technologies119
Table 3.2 – Membrane Energy and Pressure Demands120
Filter Type Pressure requirement
Energy demand
Microfiltration 100kPa 0.4kWh/m3
Ultrafiltration 525kPa 3 kWh/m3
Nanofiltration 875kPa 5.3 kWh/m3
Reverse Osmosis
1575kPa 10.2 kWh/m3

59
Table 3.3 – Ultraviolet Dosage Required121
Ultraviolet Dosage Required
For 99.9% Destruction of Various Organisms
(µW-s/cm2 at 254nm)
Bacteria
Mold Spores
Bacillus anthracis 8,700 Aspergillus flavus 99,000
B. Enteritidis 7,600 Aspergillus glaucus 88,000
B. Megatherium sp. (vegetative) 2,500 Aspergillus niger 330,000
B. Megatherium sp. (spores) 52,000 Mucor racemosus A 35,200
B. Paratyphosus 6,100 Mucor racemosus B 35,200
B. Subtilis (vegetative) 11,000 Oospora lactis 11,000
B. Subtilis (spores) 58,000 Penicillium digitatum 88,000
Clostridium tetani 22,000 Penicillium expansum 22,000
Corynebacterium diphtheria 6,500 Penicillium roqueforti 26,400
Eberthella typhosa 4,100 Rhizopus nigricans 220,000
Escherichia coli 7,000
Leptospira interrogans 6,000
Micrococcus candidus 12,300 Algae/Protozoa
Micrococcus sphaeroides 15,400 Chlorella vulgaris (algae) 22,000
Mycobacterium tuberculosis 10,000 Nematode Eggs 92,000
Neisseria catarrhalis 8,500 Paramecium 200,000
Phytomonas tumefaciens 8,500
Proteus vulgaris 6,600
Pseudomonas aeruginosa 10,500 Virus
Pseudomonas fluorescens 6,600 Bacteriophage (E. Coli) 6,600
Salmonella typhimarium 15,200 Hepatitis virus 8,000
Salmonella typhosa (Typhoid) 6,000 Influenza virus 6,600
Sarcina lutea 26,400 Polio virus 6,000
Serratia marcescens 6,200 Rotavirus 24,000
Shigella marcescens 6,200 Tobacco mosaic 440,000
Shigella dysenteriae (Dysentery) 4,200
Shigella paradysenteriae 3,400
Spirillum rubrum 6,160 Yeast
Staphylococcus albus 5,720 Baker's yeast 8,800
Staphylococcus aureus 6,600 Brewer's yeast 6,600
Streptococcus hemolyticus 5,500 Common yeast cake 13,200
Streptococcus lactis 8,800 Saccharomyces cerevisiae 13,200
Streptococcus viridians 3,800 Saccharomyces ellipsoideus 13,200
Vibrio Cholerae 6,500 Saccharomyces sp. 17,600

60
Table 3.4 – Activated Carbon Magnitudes and Applications (imbedded in document)
Table 3.5 – Water Contaminants that can be Reduced to Acceptable Standards by AC Filtration122
Primary Drinking Water Standards Contaminant
Maximum Contaminant Level, mg/L
Inorganic Contaminants
Organic Arsenic Complexes 0.05
Organic Chromium Complexes 0.05
Mercury (Hg + 2) Inorganic 0.05
Organic Mercury Complexes 0.002
Organic Contaminants
Benzene 0.005
Endrin 0.0002
Lindane 0.004
Methoxychlor 0.1
1,2-dichloroethane 0.005
1,1-dichloroethylene 0.007
1,1,1-trichloroethane 0.2
Total Trihalomethanes (TTHMs) 0.1
Toxaphene 0.005
Trichloroethylene 0.005
2,4-D 0.1
2,4,5-TP (Silvex) 0.01
Para-dichlorobenzene 0.075
Secondary Drinking Water Standards Contaminant
Secondary Maximum Contaminant Level, mg/L
Colour 15 colour units
Foaming Agents (MBAS) 0.5 mg/L
Odour 3 threshold odour numbers
61
Table 4.1 – Pugh Decision Matrix
Granular Media Filtering Barrier Media Filtering Disinfection Treatment
Sand Anthracite Membrane Ceramic Concrete Ultraviolet Radiation
Chemical Purification
Carbon Adsorption
Selection Criteria Weight Rating WS Rating WS Rating WS Rating WS Rating WS Rating WS Rating WS Rating WS
Parameters Flow Rate 4% 7 0.2763 7 0.2763 6 0.2368 3 0.1184 3 0.1184 8 0.3158 8 0.3158 4 0.1579
Size of Unit 1% 5 0.0329 5 0.0329 6 0.0395 6 0.0395 6 0.0395 8 0.0526 8 0.0526 6 0.0395
Capacity 1% 7 0.0461 7 0.0461 6 0.0395 6 0.0395 5 0.0329 8 0.0526 8 0.0526 6 0.0395
Life Availability of Materials 3% 8 0.2632 5 0.1645 2 0.0658 5 0.1645 5 0.1645 2 0.0658 4 0.1316 5 0.1645
Cost for manufacturing 7% 7 0.4605 5 0.3289 2 0.1316 7 0.4605 6 0.3947 1 0.0658 3 0.1974 5 0.3289
Cost for maintenance 3% 6 0.1974 5 0.1645 3 0.0987 8 0.2632 7 0.2303 1 0.0329 1 0.0329 4 0.1316
Maintenance requirements 4% 4 0.1579 4 0.1579 2 0.0789 7 0.2763 6 0.2368 2 0.0789 1 0.0395 4 0.1579
Ease of use 7% 6 0.3947 5 0.3289 3 0.1974 7 0.4605 7 0.4605 2 0.1316 1 0.0658 7 0.4605
Life expectancy 7% 7 0.4605 5 0.3289 3 0.1974 7 0.4605 7 0.4605 3 0.1974 1 0.0658 6 0.3947
Energy Needs 7% 8 0.5263 5 0.3289 2 0.1316 6 0.3947 5 0.3289 1 0.0658 3 0.1974 5 0.3289
Effectiveness Bacterial Removal 7% 7 0.4605 7 0.4605 7 0.4605 7 0.4605 6 0.3947 8 0.5263 8 0.5263 4 0.2632
Metals removal 4% 3 0.1184 3 0.1184 6 0.2368 4 0.1579 4 0.1579 1 0.0395 6 0.2368 4 0.1579
Major Ion removal 3% 3 0.0789 3 0.0789 6 0.1579 4 0.1053 4 0.1053 1 0.0263 6 0.1579 6 0.1579
Large particulates 3% 8 0.2105 8 0.2105 8 0.2105 8 0.2105 8 0.2105 1 0.0263 6 0.1579 6 0.1579
Clarity 4% 5 0.1974 5 0.1974 7 0.2763 6 0.2368 5 0.1974 1 0.0395 6 0.2368 7 0.2763
Taste 4% 4 0.1579 4 0.1579 7 0.2763 6 0.2368 5 0.1974 3 0.1184 6 0.2368 7 0.2763
Odour 4% 4 0.1579 4 0.1579 7 0.2763 6 0.2368 5 0.1974 3 0.1184 6 0.2368 7 0.2763
Health Risks During Production 1% 6 0.0789 5 0.0658 4 0.0526 7 0.0921 4 0.0526 3 0.0395 1 0.0132 6 0.0789
Storage of materials 1% 7 0.0921 6 0.0789 3 0.0395 7 0.0921 5 0.0658 3 0.0395 1 0.0132 7 0.0921
Use 7% 7 0.4605 7 0.4605 2 0.1316 8 0.5263 7 0.4605 5 0.3289 1 0.0658 7 0.4605
Disposal of waste 5% 7 0.3684 6 0.3158 4 0.2105 7 0.3684 7 0.3684 3 0.1579 1 0.0526 6 0.3158
Environment Use of Toxic Materials 4% 7 0.2763 6 0.2368 5 0.1974 7 0.2763 6 0.2368 3 0.1184 1 0.0395 7 0.2763
Reusability 5% 8 0.3684 5 0.2303 6 0.2763 7 0.3224 7 0.3224 1 0.0461 1 0.0461 3 0.1382
Recyclability 3% 8 0.2632 4 0.1316 3 0.0987 2 0.0658 2 0.0658 1 0.0329 1 0.0329 6 0.1974
Waste 4% 7 0.2763 5 0.1974 4 0.1579 6 0.2368 6 0.2368 1 0.0395 1 0.0395 6 0.2368
Weighted Average 100% 6.3816 5.2566 4.2763 6.3026 5.7368 2.7566 3.2434 5.5658
Rank 1 5 6 2 3 8 7 4
(where WS = Weighted Score)

62
Figure 5.1 – Prototype Layout (Artistic Rendition)

63
Table 6.1 – Test Results
Sample Name Date of Submission HPC/ml Yeast/ml Mould/ml
TC-MF/ml
EC-MF/100ml
Flow rate L/day
Feed water Control 1 11/03/2009 6700 0 3 34 0
Feed water Control 2 18/03/2009 10000
40 0
Column A - Test 1 11/03/2009 14000 0 0 3200 0 2160
Column A - Test 2 18/03/2009 4800
2200 0 1926
Column B - Test 1 11/03/2009 40000 0 0 4100 0 969
Column B - Test 2 18/03/2009 6000
1500 0 22.5
Biosand Water Mix 18/03/2009 5400 0
System Water 18/03/2009 220 3

64
Glossary Backwash—to clean out (a clogged filter) by reversing the flow of fluid123 Colloidal—in chemistry, the suspension of fine particles between 10 and 10,000 Å dispersed in a continuous medium, be it gas/liquid or solid, that prevents them from being filtered easily or settling rapidly124 Effluent—Fluid flowing out, treated water125 Feed water—water that first enters a filtration phase Floc—particles that have coagulated out of solution Gravitational Filter—Filter type that relies on gravity to push influent through media. Influent—Fluid flowing in126 Permeate—the filtered solution in a filtration phase Retentate—the portion of the feed solution that does not pass through a cross flow membrane filter Suspended solids—small solid particles distributed evenly in water as a colloid, used as one indicator of water quality. Turbidity—not clear or transparent because of stirred-up sediment or the like; clouded; opaque;127 Wet Harrowing—by means of disturbing water immersing layer of slime in filter, the ability to dislodge and hence removed particulate matter embedded

65
Works Cited
"Activated Carbon (Coconut, Coal, Wood and Lignite based)." Air and Water Treatments. 2005.
Ecologix Environmental Systems, LLC. 23 Oct. 2008
<http://http://www.ecologixsystems.com/activated_carbon.php?s=product>.
"Activated Carbon." Wikipedia. 29 Dec. 2005. Wikimedia Foundation Ltd. 22 Oct. 2008
<http://http://en.wikipedia.org/wiki/activated_carbon>.
"Activated Carbon From CPL Carbon Link." Activated Carbon. CPL Carbon Link. 10 Oct. 2008
<http://www.activated-carbon.com/carbon.html>.
Allgeier, Steven, Brent Alspach, and James Vickers. Membrane Filtration Guidance Manual.
Tech.No. 815-R-06-009. Office of Ground Water and Drinking Water, Standars and Risk
Management Division, United States Environmental Protection Agency. Cincinnati, OH:
United States Environmental Protection Agency, 2005.
"Anthracite Coal." Science. 2008. ENasco. 9 Nov. 2008
<http://http://www.enasco.com/product/sb10656m>.
"Anthracite." Wikipedia. 13 Feb. 2003. Wikimedia Foundation Ltd. 31 Oct. 2008
<http://http://en.wikipedia.org/wiki/anthracite>.
"Arkal Water Filtration System." Arkal Water Filtration Systems: Valves, Filters, Strainers,
Compressed Air Products. Oct. 2006. Pelmar Engineering Ltd. 10 Oct. 2008
<http://http://www.process-controls.com/pelmar/arkal_water.html>.
"BioSand Filter." Wikipedia, the free encyclopedia. 19 Mar. 2009
<http://en.wikipedia.org/wiki/BioSand_Filter>.

66
Blackburn, Humphrey. ABCs of maintaining slow sand filters. Sept. 1998. EBSCO Industries, Inc.
19 Mar. 2009 <www.watertechonline.com>.
Boyd, MSc. Damien. "Water Quality." Telephone interview. 11 Mar. 2009.
Brouckaert, B.M., A. Amirtharajah, R. Rajagopaul, and P. Thompson. "Filter Backwash Option For
Rural Treatment." Thesis. University of KwaZulu-Natal, Durban, 2006.
Brown, Craig M., and Michael A. Sheedy. Method and Apparatus for Increasing Contaminant
Loading Capacity. Bereskin & Parr, assignee. Patent WO/2006/012728. 2006.
Bungay, Henry R. "Adsorption." Chemical and Biological Engineering. 25 Feb. 2000. Rensselaer
Polytechnic Institute. 13 Nov. 2008 <http://www.rpi.edu/dept/chem-eng/biotech-
environ/adsorb/adsorb.htm>.
Burton, Franklin L., and David H. Stensel. Wastewater Engineering: Treatment and Reuse. Ed.
George Tchobanoglous. 4th ed. Vol. 1. New York, NY: The McGrawhill Companies, Inc.,
2003.
Carnegie Mellon University Green Design Institute. (2008) Economic Input-Output Life Cycle
Assessment (EIO-LCA), US 1997 Industry Benchmark model [Internet], Available
from:<http://www.eiolca.net> Accessed 1 January, 2008.
"Chemical Summary Tables." Water Sanitation and Health (WSH). 2008. World Health
Organization. 10 Oct. 2008
<http://http://www.who.int/water_sanitation_health/dwq/en/>.
Cheremisinoff, Nicholas P. Handbook of Water and Wastewater Treatment Technologies.
Chicago: Butterworth-Heinemann Limited, 2001.

67
Clear Tech. Material Safety Data Sheet: Anthracite Filter Media. Saskatoon, AB: Clear Tech
Industries Inc., 2007.
"Concrete and Concrete Products-Manufacturing and Construction." Occupational Safety &
Health Administration. 28 Feb. 2008. U.S. Department of Labor. 11 Nov. 2008
<http://http://www.osha.gov/dcsp/products/topics/concreteproducts/index.html>.
"Concrete." Wikipedia. 3 Apr. 2001. Wikimedia Foundation Ltd. 11 Nov. 2008
<http://http://en.wikipedia.org/wiki/concrete>.
"Data - Country Classification." The World Bank. 11 Jan. 2009 <http://web.worldbank.org>.
Derry, T. K., and Trevor I. Williams. A Short History of Technology from Ancient Times to A. D.
1900. Minneapolis: Dover Publications, Incorporated, 1993. 421-24.
"Durability." Green Building, Energy Efficient Home and Buildings, Sustainable Architecture and
Development with Concrete. Portland Cement Association. 20 Mar. 2009
<http://www.concretethinker.com/solutions/Durability.aspx>.
GEMStat: Global Water Quality Database. 11 Jan. 2009 <http://www.gemstat.org>.
"Gravel." Wikipedia. 9 Jan. 2003. Wikimedia Foundation Ltd. 14 Oct. 2008
<http://en.wikipedia.org/wiki/gravel>.
GTAstore. "Water Solution For Entire House." GTA Water. 2004. GTA Water. 17 Oct. 2008
<http://http://www.gtawater.com>.
Hodgson, Kelly. Contaminant Data of Global Water Tables. Raw data. United Nations
Environmental Programme: GEMStat, Toronto.

68
Hodgson, Kelly. Global Water Contaminant Results. Raw data. UN GEMS/Water Programme
Office, Burlington. 2008. Information provided by GEMStat (Global Water Quality
Database) on behalf of UNEP
Hoekstra, Arjen Y. "Water for Domestic Use." E-mail to the author. 2 Feb. 2009.
"How do VaporSep Membranes Work?" Membrane Solutions For Industrial Separations. 2007.
Membrane Technology and Research Inc. 12 Nov. 2008
<http://www.mtrinc.com/faq.html>.
Huisman, L., and W. E. Wood. Slow Sand Filtration. Chicago: World Health Organization, 1974.
"Human rights." Wikipedia. 27 Sept. 2001. Wikimedia Foundation Ltd. 19 Mar. 2009
<http://en.wikipedia.org/wiki/Human_rights>.
James, BSc, MS, PhD, MA, PEng. David F. "Sand Column Understanding." Personal interview. 19
Mar. 2009.
Knaebel, Kent S. Adsorbent Selection. Tech.No. Adsorption Research Inc. Dublin, OH. 6-9. 2008.
Adsorption Reserarch Inc. 12 Nov. 2008
<http://www.adsorption.com/publications/adsorbentsel1b.pdf>.
Lahlou, Mohammed. Ultraviolet Disinfection. PublicationNo. DWPKPE71. National Drinking
Water Clearinghouse, National Environmental Services Centre. Morgantown, WV:
National Environmental Services Centre, 2000. 1-4.
"Life expectancy of Rigid PVC pipe." PVC4Pipes. 18 Mar. 2009
<http://www.pvc4pipes.org/faq/life-expectancy-pvc-pipe.htm>.

69
"Lignite." Wikipedia. 4 Mar. 2002. Wikimedia Foundation Ltd. 27 Oct. 2008
<http://en.wikipedia.org/wiki/lignite>.
"Membrane Technology." Lenntech Ultrafiltration. 2008. Lenntech Water Treatment & Air
Purification Holding B.V. 10 Nov. 2008 <http://www.lenntech.com/ultrafiltration.htm>.
Miller, Chaz. "Profiles in Garbage: Polyethylen Terephthalate." Waste Age. 1 May 2001. Penton
Media, Inc. 19 Oct. 2008
<http://wasteage.com/mag/waste_profiles_garbage_polyethylene/>.
Mol, Adrian, and Eric Fewster. Bio-Sand Filtration Mould Construction Guidelines. Wrexham:
BioSandFilter.org, 2007.
Mol, Adrian. Biosand Filter Casting Instructions. The Shieling, Wreay: BiosandFilter.Org, 2004.
Mol, Jaap, ed. "Biosand Filter." Biosand Filter. 2004. Biosand Filter Org. 10 Oct. 2008
<http://www.biosandfilter.org/biosandfilter>.
"Particle size (grain size) -." Wikipedia, the free encyclopedia. 20 Mar. 2009
<http://en.wikipedia.org/wiki/Particle_size_(grain_size)>.
"The PVC Debate." PVC and Vinyls by Solvin. 22 Mar. 2009
<http://www.solvinpvc.com/sustainabledevelopment/thepvcdebate/0,,5230-2-
0,00.htm>.
"Sand." Wikipedia. 2 Feb. 2002. Wikimedia Foundation Ltd. 14 Oct. 2008
<http://en.wikipedia.org/wiki/sand>.
"ScienceDirect - International Journal of Food Microbiology : Heterotrophic plate count
bacteria—what is their significance in drinking water?*1." ScienceDirect - Home.

70
20 Mar. 2009 <http://www.sciencedirect.com/science?_ob=ArticleURL&_udi=B6T7K-
4CCNC7B-
3&_user=994540&_rdoc=1&_fmt=&_orig=search&_sort=d&view=c&_acct=C000050024
&_version=1&_urlVersion=0&_userid=994540&md5=39d855632c525b4f87e1e96a96c1f
3eb>.
"Significance of total coliforms in drinking water - Total Coliforms - Guidelines for Canadian
Drinking Water Quality: Guideline Technical Document." Welcome to the Health Canada
Web site | Bienvenue au site Web de Sant. Health Canada. 19 Mar. 2009
<http://www.hc-sc.gc.ca/ewh-semt/pubs/water-eau/coliforms-coliformes/significance-
importance-eng.php>.
"Statistics | WaterAid." WaterAid - water and sanitation for all - International site. 20 Mar. 2009
<http://www.wateraid.org/international/what_we_do/statistics/default.asp>.
Ultraviolet Disinfection. Tech.No. 4230-MI4178. Edstrom Industries. Waterford, WI: Edstrom
Industries, Inc., 2003. 1-8.
"Universal Declaration of Human Rights." OHCHR Homepage. United Nations Department of
Public Information. 18 Mar. 2009 <http://www.unhchr.ch/udhr/lang/eng.htm>.
Viklund, Andreas, ed. "Production Manual." Potters For Peace. 2006. Potters For Peace. 3 Nov.
2008 <http://http://s189535770.onlinehome.us/pottersforpeace/>.
Walzak, M. J., S. Flynn, R. Foerch, E. Karbashewski, Amy Lin, and M. Strobel. "UV and Ozone
Treatment of Polypropylene and Poly(ethylene terephthalate)." Diss. University of
Western Ontario, 1995. Abstract. Journal of Adhesion Science and Technology 9th ser.
1995 (1995): 1165-301. UMI No. 3647422.

71
"Water Footprints of Nations." Waterfootprint.org: Water footprint and virtual water. Water
Footprint Network. 11 Jan. 2009
<http://www.waterfootprint.org/?page=files/NationalStatistics>.
"Water purification." Wikipedia. Wikimedia Foundation Ltd. 20 Mar. 2009
<http://en.wikipedia.org/wiki/Water_purification>.
Water Quality for Ecosystem and Human Health. Burlington: United Nations Environment
Programme Global Environment Monitoring System/Water Programme, 2006. GEMStat.
UN GEMS/Water Programme Office. 11 Jan. 2009 <www.gemswater.org>.
"World Bank Atlas Method." The World Bank. 24 Oct. 2008. The World Bank. 1 Feb. 2009
<http://web.worldbank.org/WBSITE/EXTERNAL/DATASTATISTICS/0,,contentMDK:20452
009~menuPK:64133156~pagePK:64133150~piPK:64133175~theSitePK:239419~isCURL:Y
~isCURL:Y,00.html>.
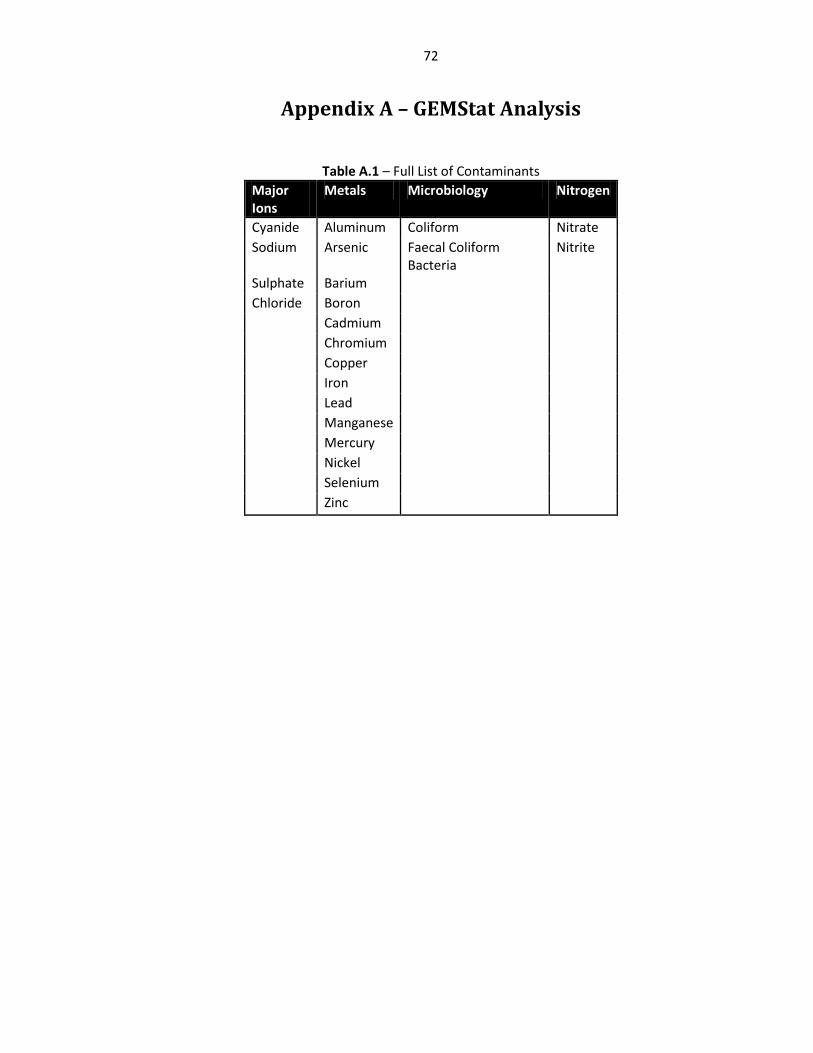
72
Appendix A – GEMStat Analysis
Table A.1 – Full List of Contaminants
Major Ions
Metals Microbiology Nitrogen
Cyanide Aluminum Coliform Nitrate
Sodium Arsenic Faecal Coliform Bacteria
Nitrite
Sulphate Barium
Chloride Boron
Cadmium
Chromium
Copper
Iron
Lead
Manganese
Mercury
Nickel
Selenium
Zinc

73
Fig A.1 – Contamination Probability per Continent

74
Appendix B – Darcy’s Law Derivation and Application
Darcy’s Law:
Hydraulic Conductivity:
Specific Weight of Water:
Darcy’s Law Therefore Becomes:
This can then be applied, knowing the hydraulic conductivity, filter area, pressure, density of the
liquid, gravity and the filter depth to find for a flow rate through the porous media. Finer pores
have more resistance to flow, and so have lower values of hydraulic conductivity.
Calculation of Pressure Head
Water Pressure:

75
Appendix C – EIOLCA of Filter Parts Table C.1 – EIOLCA of Filter Parts
Energy Toxic Releases (Pre to Manufacturing Stage)
Parts
Cost (USD 1997) Total TJ
Non-Point Air (kg)
Point Air (kg)
Tot Air Releases (kg)
Water Releases (kg)
Land Releases (kg)
Underground Releases (kg)
Total Releases (kg)
POTW Transfers (kg)
Offsite Transfers (kg)
Total Rel/Trans (kg)
Plate 1113x950X2 $11.50 1.79E-04 8.24E-04 3.01E-03 3.84E-03 9.17E-03 1.55E-02 4.18E-04 2.90E-02 1.68E-03 1.16E-02 4.22E-02
Flat iron 50x11415x6 $2.31 3.60E-05 1.65E-04 6.05E-04 7.71E-04 1.84E-03 3.12E-03 8.38E-05 5.82E-03 3.37E-04 2.33E-03 8.47E-03
Flat iron 50x1415x6 $2.31 3.60E-05 1.65E-04 6.05E-04 7.71E-04 1.84E-03 3.12E-03 8.38E-05 5.82E-03 3.37E-04 2.33E-03 8.47E-03
Flat iron 50x938x6 $6.12 9.55E-05 4.38E-04 1.60E-03 2.05E-03 4.88E-03 8.27E-03 2.22E-04 1.54E-02 8.94E-04 6.18E-03 2.25E-02
M12x50 bolt & nut $0.52 4.38E-06 2.76E-05 8.90E-05 1.17E-04 4.62E-05 6.87E-04 1.92E-05 8.69E-04 3.93E-05 1.77E-04 1.09E-03
Plate 265x260x2 $0.75 1.17E-05 5.37E-05 1.96E-04 2.50E-04 5.97E-04 1.01E-03 2.72E-05 1.89E-03 1.09E-04 7.57E-04 2.75E-03
Plate 110x180x6 $0.65 1.01E-05 4.63E-05 1.69E-04 2.16E-04 5.15E-04 8.72E-04 2.35E-05 1.63E-03 9.44E-05 6.53E-04 2.37E-03
Flat iron 25x40x6 $0.03 5.09E-07 2.34E-06 8.55E-06 1.09E-05 2.60E-05 4.41E-05 1.18E-06 8.22E-05 4.77E-06 3.30E-05 1.20E-04
Flat iron 25x25x6 $0.04 6.36E-07 2.92E-06 1.07E-05 1.36E-05 3.25E-05 5.51E-05 1.48E-06 1.03E-04 5.96E-06 4.12E-05 1.50E-04
M12x75 bolt & nut $0.28 2.33E-06 1.47E-05 4.74E-05 6.21E-05 2.46E-05 3.66E-04 1.02E-05 4.63E-04 2.10E-05 9.46E-05 5.80E-04
Steel shaft 40x50 long $0.59 9.23E-06 4.24E-05 1.55E-04 1.98E-04 4.71E-04 7.99E-04 2.15E-05 1.49E-03 8.64E-05 5.97E-04 2.17E-03
Flat iron 50x50x6 $0.16 2.55E-06 1.17E-05 4.28E-05 5.45E-05 1.30E-04 2.20E-04 5.92E-06 4.11E-04 2.38E-05 1.65E-04 5.99E-04
Plate 942.5 (outer), 911 (inner)x252.5x2 $2.54 3.97E-05 1.82E-04 6.66E-04 8.49E-04 2.03E-03 3.43E-03 9.23E-05 6.41E-03 3.71E-04 2.57E-03 9.33E-03
Plate 848.2 (outer), 785.4(inner)x652.2x2 $5.80 9.04E-05 4.15E-04 1.52E-03 1.94E-03 4.62E-03 7.82E-03 2.10E-04 1.46E-02 8.46E-04 5.85E-03 2.13E-02
Plate 450x450x6 $0.07 1.03E-06 4.73E-06 1.73E-05 2.21E-05 5.27E-05 8.92E-05 2.40E-06 1.67E-04 9.65E-06 6.68E-05 2.43E-04
Plate 286x286x2 $0.89 1.39E-05 6.37E-05 2.33E-04 2.97E-04 7.09E-04 1.20E-03 3.23E-05 2.24E-03 1.30E-04 8.99E-04 3.27E-03
Plate 250x250x2 $0.68 1.06E-05 4.87E-05 1.78E-04 2.27E-04 5.42E-04 9.18E-04 2.47E-05 1.71E-03 9.93E-05 6.87E-04 2.50E-03
M25 nut $1.05 8.84E-06 5.57E-05 1.80E-04 2.35E-04 9.32E-05 1.39E-03 3.86E-05 1.75E-03 7.94E-05 3.58E-04 2.19E-03
Plate 80 diamx15 thick $0.41 6.40E-06 2.94E-05 1.07E-04 1.37E-04 3.27E-04 5.53E-04 1.49E-05 1.03E-03 5.99E-05 4.14E-04 1.50E-03
Square tube 50x50x3x330 $1.75 2.73E-05 1.26E-04 4.59E-04 5.85E-04 1.40E-03 2.37E-03 6.36E-05 4.42E-03 2.56E-04 1.77E-03 6.43E-03
Square tube 50x50x3x600 $1.59 2.49E-05 1.14E-04 4.18E-04 5.32E-04 1.27E-03 2.15E-03 5.78E-05 4.02E-03 2.33E-04 1.61E-03 5.85E-03
Angel iron 50x50x6x600 $5.97 9.31E-05 4.27E-04 1.56E-03 1.99E-03 4.76E-03 8.06E-03 2.17E-04 1.50E-02 8.71E-04 6.03E-03 2.19E-02
Steel shaft 16x360 $0.68 1.06E-05 4.88E-05 1.79E-04 2.28E-04 5.43E-04 9.20E-04 2.47E-05 1.72E-03 9.95E-05 6.88E-04 2.50E-03
Steel shaft 25x300 long $0.69 1.08E-05 4.96E-05 1.82E-04 2.32E-04 5.52E-04 9.36E-04 2.52E-05 1.75E-03 1.01E-04 7.00E-04 2.54E-03
Steel shaft 40x50 long $0.30 4.61E-06 2.12E-05 7.75E-05 9.88E-05 2.36E-04 3.99E-04 1.07E-05 7.45E-04 4.32E-05 2.99E-04 1.09E-03
Washer 60 diam $0.75 6.32E-06 3.98E-05 1.28E-04 1.68E-04 6.66E-05 9.90E-04 2.76E-05 1.25E-03 5.67E-05 2.56E-04 1.57E-03
Steel shaft 40x10 long $0.12 1.85E-06 8.47E-06 3.10E-05 3.95E-05 9.43E-05 1.60E-04 4.29E-06 2.98E-04 1.73E-05 1.19E-04 4.34E-04
Pipe 1" class 'B' 900 $2.15 3.35E-05 1.54E-04 5.62E-04 7.17E-04 1.71E-03 2.90E-03 7.79E-05 5.41E-03 3.13E-04 2.17E-03 7.88E-03
Steel shaft 18x150 long $0.18 2.80E-06 1.29E-05 4.71E-05 6.00E-05 1.43E-04 2.43E-04 6.52E-06 4.53E-04 2.62E-05 1.81E-04 6.59E-04
Bolts & nuts M10x25 $5.71 4.81E-05 3.03E-04 9.77E-04 1.28E-03 5.07E-04 7.54E-03 2.10E-04 9.54E-03 4.32E-04 1.95E-03 1.19E-02
Welding rods $6.61 3.31E-10 1.98E-08 0.00E+00 1.98E-08 0.00E+00 0.00E+00 0.00E+00 2.64E-08 0.00E+00 0.00E+00 2.64E-08
cement $2.03 5.28E-08 6.09E-09 0.00E+00 6.09E-09 0.00E+00 0.00E+00 0.00E+00 8.12E-09 0.00E+00 0.00E+00 8.12E-09
PVC elbow 1/2"* $0.98 1.44E-05 9.56E-05 2.75E-04 3.70E-04 5.51E-05 4.51E-04 1.73E-04 1.05E-03 1.73E-04 8.76E-05 1.31E-03
PVC pipe $1.16 1.71E-05 1.13E-04 3.26E-04 4.38E-04 6.52E-05 5.34E-04 2.05E-04 1.24E-03 2.05E-04 1.04E-04 1.55E-03
Total per 1000 parts $4.23 8.55E-07 4.11E-06 1.47E-05 1.88E-05 3.93E-05 7.71E-05 2.44E-06 1.38E-04 8.06E-06 5.18E-05 1.97E-04

76
Appendix D – Contribution to Final Document
Abstract Derek Humenny
Acknowledgements Dimitra Panagiotoglou
Method of Attribution Dimitra Panagiotoglou
Table of Contents Derek Humenny
List of Symbols Used Derek Humenny
List of Figures Derek Humenny
List of Tables Derek Humenny
Chapter 1 – Introduction
Motivation Dimitra Panagiotoglou
Objectives Dimitra Panagiotoglou
Chapter 2 – Water Consumption and Demand
Target Demographic Dimitra Panagiotoglou
Target Contaminants Dimitra Panagiotoglou
Data Analysis Dimitra Panagiotoglou
Division of GEMStat Data Dimitra Panagiotoglou
Data Trends Dimitra Panagiotoglou
Water Source Dimitra Panagiotoglou
Chapter 3 – Water Filtering Methods
Granular Media Filtering Derek Humenny
Sand Dimitra Panagiotoglou
Anthracite Dimitra Panagiotoglou
Barrier Media Filtering Derek Humenny
Membrane Technology Derek Humenny
Ceramic Dimitra Panagiotoglou
Concrete Dimitra Panagiotoglou
Disinfection Treatment Derek Humenny
Ultraviolet Radiation Dimitra Panagiotoglou
Chemical Purification Dimitra Panagiotoglou
Carbon Adsorption Derek Humenny
Chapter 4 – Technology Assessment
Method Selection Dimitra Panagiotoglou
Slow Sand Filtration Improvements Derek Humenny
Life Cycle Analysis Dimitra Panagiotoglou
Premanufacture Dimitra Panagiotoglou
Manufacture Dimitra Panagiotoglou
Distribution/Transportation Dimitra Panagiotoglou
Use Dimitra Panagiotoglou
Maintenance Dimitra Panagiotoglou
End of Life Dimitra Panagiotoglou

77
Chapter 5 – Prototype
Functional Requirements Derek Humenny
Design Derek Humenny
Basic Operation Derek Humenny
Function Derek Humenny
Materials Derek Humenny
Methods Derek Humenny
Contaminated Water Source Derek Humenny
Testing Procedure Derek Humenny
Test Sample Analysis Derek Humenny
Chapter 6 – Sample Analysis
Test Results Dimitra Panagiotoglou
Discussion Dimitra Panagiotoglou
Sources of Error Dimitra Panagiotoglou
Chapter 7 – Recommended Future Actions Dimitra Panagiotoglou
Chapter 8 – Conclusion Dimitra Panagiotoglou
Chapter 9 – Tables and Figures Derek Humenny
Glossary Dimitra Panagiotoglou
Works Cited
Appendix A – GEMStat Analysis Dimitra Panagiotoglou
Appendix B – Darcy’s Law Derivation and Application Derek Humenny
Appendix C – EIOLCA of Filter Parts Dimitra Panagiotoglou
Appendix E – Contribution to Final Document Derek Humenny
Appendix D – Detailed Prototype Drawings Derek Humenny

78
Appendix E – Detailed Prototype Drawings

79
1 "Human rights." Wikipedia. 27 Sept. 2001. Wikimedia Foundation Ltd. 19 Mar. 2009 <http://en.wikipedia.org/wiki/Human_rights>. 2 "Universal Declaration of Human Rights." OHCHR Homepage. United Nations Department of Public Information. 18 Mar. 2009 <http://www.unhchr.ch/udhr/lang/eng.htm>. 3 "Statistics | WaterAid." WaterAid - water and sanitation for all - International site. 20 Mar. 2009 <http://www.wateraid.org/international/what_we_do/statistics/default.asp>. 4 Ibid.,3 5 "World Bank Atlas Method." The World Bank. 24 Oct. 2008. The World Bank. 1 Feb. 2009
<http://web.worldbank.org/WBSITE/EXTERNAL/DATASTATISTICS/0,,contentMDK:20452009~menuPK:64133156~pagePK:64133150~piPK:64133175~theSitePK:239419~isCURL:Y~isCURL:Y,00.html>.
6 Ibid.,5 7 "Water Footprints of Nations." Waterfootprint.org: Water footprint and virtual water. Water Footprint Network. 11 Jan. 2009
<http://www.waterfootprint.org/?page=files/NationalStatistics>. 8 Hoekstra, Arjen Y. "Water for Domestic Use." E-mail to the author. 2 Feb. 2009. 9 GEMStat: Global Water Quality Database. 11 Jan. 2009 <http://www.gemstat.org>. 10 Hodgson, Kelly. Contaminant Data of Global Water Tables. Raw data. United Nations Environmental Programme: GEMStat, Toronto. 11 "Statistics | WaterAid." WaterAid - water and sanitation for all - International site. 20 Mar. 2009 <http://www.wateraid.org/international/what_we_do/statistics/default.asp>. 12 Derry, T. K., and Trevor I. Williams. A Short History of Technology from Ancient Times to A. D. 1900. Minneapolis: Dover
Publications, Incorporated, 1993. 421-24. 13 Cheremisinoff, Nicholas P. Handbook of Water and Wastewater Treatment Technologies. Chicago: Butterworth-Heinemann
Limited, 2001. 14 Mol, Jaap, ed. "Biosand Filter." Biosand Filter. 2004. Biosand Filter Org. 10 Oct. 2008 <http://www.biosandfilter.org/biosandfilter>. 15 Huisman, L., and W. E. Wood. Slow Sand Filtration. Chicago: World Health Organization, 1974. 16 Ibid.,15 17 Ibid., 16 18 "Gravel." Wikipedia. 9 Jan. 2003. Wikimedia Foundation Ltd. 14 Oct. 2008 <http://en.wikipedia.org/wiki/gravel>. 19 "Sand." Wikipedia. 2 Feb. 2002. Wikimedia Foundation Ltd. 14 Oct. 2008 20 environ/adsorb/adsorb.htm>. 21 Brown, Craig M., and Michael A. Sheedy. Method and Apparatus for Increasing Contaminant Loading Capacity. Bereskin & Parr,
assignee. Patent WO/2006/012728. 2006. 22 "Anthracite." Wikipedia. 13 Feb. 2003. Wikimedia Foundation Ltd. 31 Oct. 2008 <http://http://en.wikipedia.org/wiki/anthracite>. 23 Ibid., 22 24 Clear Tech. Material Safety Data Sheet: Anthracite Filter Media. Saskatoon, AB: Clear Tech Industries Inc., 2007. 25 Ibid., 22 26 Ibid., 22 27 Burton, Franklin L., and David H. Stensel. Wastewater Engineering: Treatment and Reuse. Ed. George Tchobanoglous. 4th ed. Vol.
1. New York, NY: The McGrawhill Companies, Inc., 2003. 28 "Anthracite Coal." Science. 2008. ENasco. 9 Nov. 2008 <http://http://www.enasco.com/product/sb10656m>. 29 Ibid.,24 30 Ibid.,24 31 Allgeier, Steven, Brent Alspach, and James Vickers. Membrane Filtration Guidance Manual. Tech.No. 815-R-06-009. Office of
Ground Water and Drinking Water, Standars and Risk Management Division, United States Environmental Protection Agency. Cincinnati, OH: United States Environmental Protection Agency, 2005.
32 Ibid.,31 33 Ibid.,31 34 Ibid.,31 35 Ibid.,31 36 Ibid.,13 37 Ibid.,13 38 Ibid.,31 39 Ibid.,27 40 Ibid.,13 41 "Membrane Technology." Lenntech Ultrafiltration. 2008. Lenntech Water Treatment & Air Purification Holding B.V. 10 Nov. 2008
<http://www.lenntech.com/ultrafiltration.htm>. 42 "How do VaporSep Membranes Work?" Membrane Solutions For Industrial Separations. 2007. Membrane Technology and
Research Inc. 12 Nov. 2008 <http://www.mtrinc.com/faq.html>. 43 Ibid.,41 44 Ibid.,23 45 Viklund, Andreas, ed. "Production Manual." Potters For Peace. 2006. Potters For Peace. 3 Nov. 2008
<http://http://s189535770.onlinehome.us/pottersforpeace/>. 46 Ibid.,45 47 Ibid.,45 48 Ibid.,45

80
49 Ibid.,45 50 Ibid.,45 51 Ibid.,45 52 "Concrete." Wikipedia. 3 Apr. 2001. Wikimedia Foundation Ltd. 11 Nov. 2008 <http://http://en.wikipedia.org/wiki/concrete>. 53 "Concrete and Concrete Products-Manufacturing and Construction." Occupational Safety & Health Administration. 28 Feb. 2008.
U.S. Department of Labor. 11 Nov. 2008 <http://http://www.osha.gov/dcsp/products/topics/concreteproducts/index.html>. 54 Ibid.,27 55 Ibid.,27 56 Ultraviolet Disinfection. Tech.No. 4230-MI4178. Edstrom Industries. Waterford, WI: Edstrom Industries, Inc., 2003. 1-8. 57 Ibid.,56 58 Lahlou, Mohammed. Ultraviolet Disinfection. PublicationNo. DWPKPE71. National Drinking Water Clearinghouse, National
Environmental Services Centre. Morgantown, WV: National Environmental Services Centre, 2000. 1-4. 59 Ibid.,58 60 Ibid.,27 61 Ibid.,27 62 Ibid.,27 63 Ibid.,27 64 Ibid.,27 65 Ibid.,27 66 Ibid.,27 67 Ibid.,27 68 Ibid.,27 69 Ibid.,27 70 Bungay, Henry R. "Adsorption." Chemical and Biological Engineering. 25 Feb. 2000. Rensselaer Polytechnic Institute. 13 Nov. 2008
<http://www.rpi.edu/dept/chem-eng/biotech-environ/adsorb/adsorb.htm>. 71 Knaebel, Kent S. Adsorbent Selection. Tech.No. Adsorption Research Inc. Dublin, OH. 6-9. 2008. Adsorption Reserarch Inc. 12 Nov.
2008 <http://www.adsorption.com/publications/adsorbentsel1b.pdf>. 72 Ibid.,13 73 Ibid.,13 74 Ibid.,71 75 Ibid.,71 76 Ibid.,71 77 Ibid.,71 78 Ibid.,71 79 Ibid.,71 80 "Activated Carbon From CPL Carbon Link." Activated Carbon. CPL Carbon Link. 10 Oct. 2008 <http://www.activated-
carbon.com/carbon.html>. 81 Ibid.,80 82 Ibid.,80 83 Ibid.,13 84 Ibid.,13 85 "BioSand Filter." Wikipedia, the free encyclopedia. 19 Mar. 2009 <http://en.wikipedia.org/wiki/BioSand_Filter>. 86 Ibid.,85 87 Ibid.,15 88 "Water purification." Wikipedia. Wikimedia Foundation Ltd. 20 Mar. 2009 <http://en.wikipedia.org/wiki/Water_purification>. 89 Ibid.,85 90 Ibid.,88 91 Carnegie Mellon University Green Design Institute. (2008) Economic Input-Output Life Cycle Assessment (EIO-LCA), US 1997
Industry Benchmark model [Internet], Available from:<http://www.eiolca.net> Accessed 1 January, 2008. 92 Mol, Adrian. Biosand Filter Casting Instructions. The Shieling, Wreay: BiosandFilter.Org, 2004. 93 Ibid.,92 94 Ibid.,92 95 Ibid.,92 96 Ibid.,92 97 Mol, Adrian, and Eric Fewster. Bio-Sand Filtration Mould Construction Guidelines. Wrexham: BioSandFilter.org, 2007. 98 "Particle size (grain size) -." Wikipedia, the free encyclopedia. 20 Mar. 2009 <http://en.wikipedia.org/wiki/Particle_size_(grain_size)>. 99Ibid.,13 100 Ibid.,13 101 Ibid.,13 102 Ibid.,13 103 Blackburn, Humphrey. ABCs of maintaining slow sand filters. Sept. 1998. EBSCO Industries, Inc. 19 Mar. 2009 <www.watertechonline.com>. 104 Ibid.,108

81
105 Ibid.,13 106 Ibid.,13 107 Ibid.,13 108 "Durability." Green Building, Energy Efficient Home and Buildings, Sustainable Architecture and Development with Concrete. Portland Cement Association. 20 Mar. 2009 <http://www.concretethinker.com/solutions/Durability.aspx>. 109 "Life expectancy of Rigid PVC pipe." PVC4Pipes. 18 Mar. 2009 <http://www.pvc4pipes.org/faq/life-expectancy-pvc-pipe.htm>. 110 "The PVC Debate." PVC and Vinyls by Solvin. 22 Mar. 2009 <http://www.solvinpvc.com/sustainabledevelopment/thepvcdebate/0,,5230-2-0,00.htm>. 111 Brouckaert, B.M., A. Amirtharajah, R. Rajagopaul, and P. Thompson. "Filter Backwash Option For Rural Treatment." Thesis. University of KwaZulu-Natal, Durban, 2006. 112 Boyd, MSc. Damien. "Water Quality." Telephone interview. 11 Mar. 2009. 113 "ScienceDirect - International Journal of Food Microbiology : Heterotrophic plate count bacteria—what is their significance in drinking water?*1." ScienceDirect - Home. 20 Mar. 2009 <http://www.sciencedirect.com/science?_ob=ArticleURL&_udi=B6T7K-4CCNC7B-3&_user=994540&_rdoc=1&_fmt=&_orig=search&_sort=d&view=c&_acct=C000050024&_version=1&_urlVersion=0&_userid=994540&md5=39d855632c525b4f87e1e96a96c1f3eb>. 114 "Significance of total coliforms in drinking water - Total Coliforms - Guidelines for Canadian Drinking Water Quality: Guideline Technical Document." Welcome to the Health Canada Web site | Bienvenue au site Web de Sant. Health Canada. 19 Mar. 2009 <http://www.hc-sc.gc.ca/ewh-semt/pubs/water-eau/coliforms-coliformes/significance-importance-eng.php>. 115 James, BSc, MS, PhD, MA, PEng. David F. "Sand Column Understanding." Personal interview. 19 Mar. 2009. 116 Ibid.,115 117 "Chemical Summary Tables." Water Sanitation and Health (WSH). 2008. World Health Organization. 10 Oct. 2008 118 Cross-flow Filtration. "Filtration." Wikipedia. 25 Feb. 2002. Wikimedia Foundation. 17 Oct. 2008
<http://en.wikipedia.org/wiki/filtration>. 119 Ibid., 31 120 Ibid.,27 121 Ibid.,36 122 Ibid.,13 123 "backwash." Dictionary.com Unabridged (v 1.1). Random House, Inc. 13 Nov. 2008. <Dictionary.com http://dictionary.reference.com/browse/backwash>. 124 "colloidal." The American Heritage® Dictionary of the English Language, Fourth Edition. Houghton Mifflin Company, 2004. 13 Nov. 2008. <Dictionary.com http://dictionary.reference.com/browse/colloidal>. 125 "effluent." Dictionary.com Unabridged (v 1.1). Random House, Inc. 13 Nov. 2008. <Dictionary.com http://dictionary.reference.com/browse/effluent>. 126 "influent." Webster's Revised Unabridged Dictionary. MICRA, Inc. 13 Nov. 2008. <Dictionary.com http://dictionary.reference.com/browse/influent>. 127 "turbidity." Dictionary.com Unabridged (v 1.1). Random House, Inc. 13 Nov. 2008. <Dictionary.com http://dictionary.reference.com/browse/turbidity>.