Water Efficiency Update
23
Water Efficiency Update Board of Directors/ Communications and Water Efficiency Committee November 17, 2021
Transcript of Water Efficiency Update

Water Efficiency UpdateBoard of Directors/ Communications and Water Efficiency Committee
November 17, 2021

OverviewReview Intertie Draft PrinciplesEstablishing Long Term Water Use Targets
• Goals for Selecting a Conservation Target• Marin Water’s Per Capita Water Use• Identify Range of Potential Conservation Targets• Benchmark Water Use Against Several Metrics• Discuss and Select a Long-Term Conservation Target
Informational Residential Water Budgets
2

Review of Policy Principles
3

Draft Principles For Operation of The Intertie
• The intertie shall be used to prevent a water shortage emergency as defined in District Code section 13.02.015 or any other emergency situation (such as a major seismic event) that threatens the ability of the District to supply sufficient water to meet the health and safety of its customers.
• Water Transfers should only be considered if the District has maximized or planned to maximize all local resources, including but not limited to all available water resources from Sonoma Water, such as including winter water and potential future groundwater and groundwater storage options.
4

Draft Principles For Operation of The Intertie
• The District shall implement and maintain a water efficiency and conservation program designed to achieve both:
1. XX% overall reduction in water use, equivalent to XX gallons-per-capita-per-day over the next 10 yrs.
2. YY% overall reduction in residential water use, equivalent to YY residential gallons-per-capita-per-day over the next 10 yrs.
5

Draft Principles For Operation of The Intertie
• Prioritization of transfer water sources shall be based on:1. Sustainable practices of water supplier including financial investment in
protection of aquatic species and associated ecosystems.2. Transfer water sources that have been declared surplus and would
otherwise be consumptively used.
• The operation of the intertie shall not adversely affect the operations of any public agency partner.
6

Establishing Long Term Water Use Targets
7

Considerations for Selecting a Long-Term Conservation Target• Be achievable
• Benchmark against MMWD’s historical minimum use• Benchmark against achieved usage by other agencies
• Select target on a per capita basis, independent of population change• Set target relative to “non-drought” use levels• Evaluate a range of options and decide how much of a “reach” is
appropriate• Ten year target – through 2030
8
9
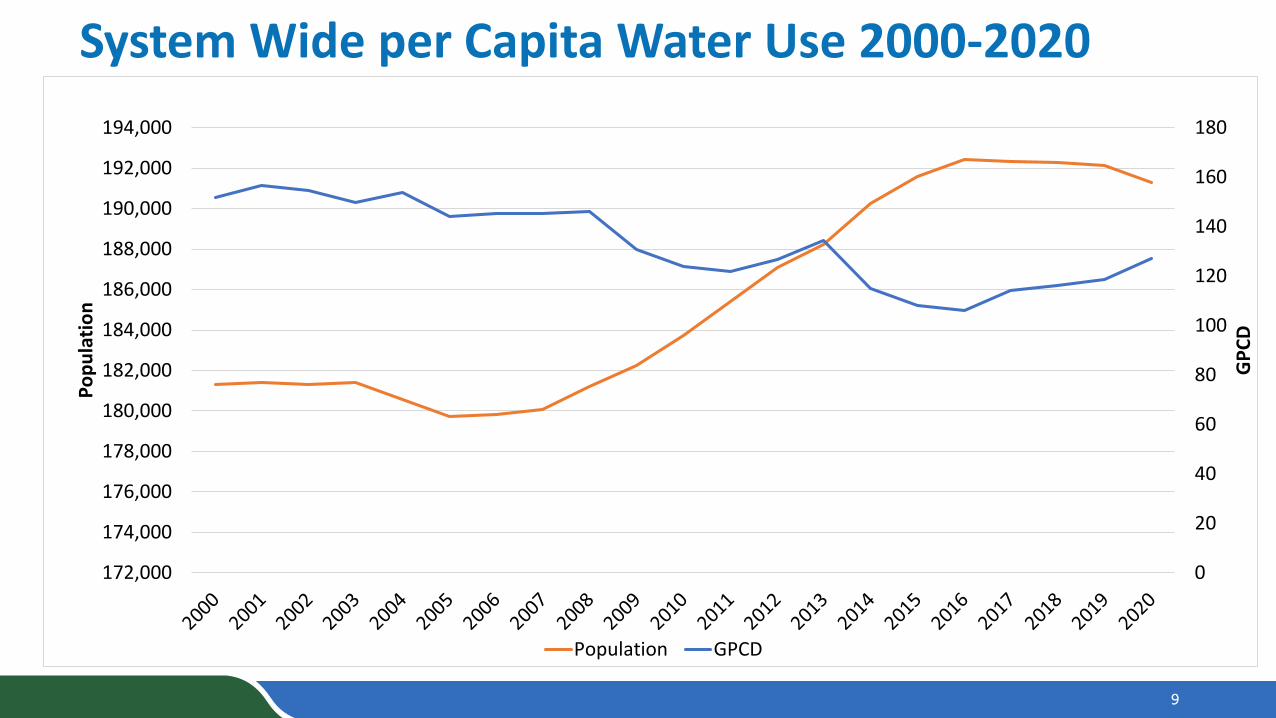
System Wide per Capita Water Use 2000-2020
0
20
40
60
80
100
120
140
160
180
172,000
174,000
176,000
178,000
180,000
182,000
184,000
186,000
188,000
190,000
192,000
194,000
GPC
D
Popu
latio
n
Population GPCD

Average of 2017, 2018, 2019 consumption from California DWR, based on annual reported data (eAR)
0
50
100
150
200
250
300
350
San
Gabr
iel V
alle
y W
ater
Com
pany
Lynw
ood
City
of
McK
inle
yvill
e Co
mm
unity
Ser
vice
Dist
rict
Gold
en S
tate
Wat
er C
ompa
ny -
Bell-
Bell
Gard
ens
Gold
en S
tate
Wat
er C
ompa
ny S
San
Gab
riel
Cres
cent
City
Calif
orni
a W
ater
Ser
vice
Com
pany
Visa
liaGo
leta
Wat
er D
istric
tM
arin
a Co
ast W
ater
Dist
rict
Valle
jo C
ity O
fGo
lden
Sta
te W
ater
Com
pany
Art
esia
Para
mou
nt C
ity O
fVa
llejo
City
Of
Mor
ro B
ay C
ity o
fVa
lley
Of T
he M
oon
Wat
er D
istric
tO
liveh
urst
Pub
lic U
tility
Dist
rict
Mon
tebe
llo L
and
and
Wat
er C
ompa
nySh
afte
r Ci
ty O
fSu
nnys
lope
Cou
nty
Wat
er D
istric
tCa
lifor
nia
Wat
er S
ervi
ce C
ompa
ny S
outh
San
Fra
ncisc
oCr
esce
nt C
ityCa
lifor
nia
Wat
er S
ervi
ce C
ompa
ny V
isalia
Calif
orni
a W
ater
Ser
vice
Com
pany
Sal
inas
Dist
rict
Pitt
sbur
g C
ity O
fSe
al B
each
City
of
Valle
y Co
unty
Wat
er D
istric
tM
onte
rey
Park
City
Of
Arro
yo G
rand
e Ci
ty o
fGo
lden
Sta
te W
ater
Com
pany
Wes
t Ora
nge
Rosa
mon
d Co
mm
unity
Ser
vice
Dist
rict
Calif
orni
a Am
eric
an W
ater
Com
pany
- Ve
ntur
a Di
stric
tVa
llejo
City
Of
Twen
tyni
ne P
alm
s Wat
er D
istric
tCe
res
City
Of
Gilro
y C
ity O
fM
anha
ttan
Bea
ch C
ity o
fHu
ntin
gton
Bea
ch C
ity o
fJo
shua
Bas
in W
ater
Dist
rict
Hesp
eria
Wat
er D
istric
t City
of
Mes
a W
ater
Dist
rict
Mar
in W
ater
San
Dieg
uito
Wat
er D
istric
tCo
ntra
Cos
ta W
ater
Dist
rict
Subu
rban
Wat
er S
yste
ms S
an Jo
se H
ills
Covi
na C
ity o
fLa
ke H
emet
Mun
icip
al W
ater
Dist
rict
Calif
orni
a W
ater
Ser
vice
Com
pany
Mar
ysvi
lleSu
burb
an W
ater
Sys
tem
s Whi
ttie
r/La
Mira
daSu
burb
an W
ater
Sys
tem
s Whi
ttie
r/La
Mira
daCa
lifor
nia
Wat
er S
ervi
ce C
ompa
ny L
os A
ltos/
Subu
rban
Man
teca
City
of
Colto
n C
ity o
fM
onro
via
City
of
Dinu
ba C
ity o
fFo
lsom
City
of
Fulle
rton
City
Of
Lee
Lake
Wat
er D
istric
tCa
lifor
nia
Wat
er S
ervi
ce C
ompa
ny C
hico
Dist
rict
Hanf
ord
City
of
Calif
orni
a W
ater
Ser
vice
Com
pany
Bea
r Gul
chCa
lifor
nia
Wat
er S
ervi
ce C
ompa
ny C
hico
Dist
rict
Juru
pa C
omm
unity
Ser
vice
Dist
rict
Gold
en S
tate
Wat
er C
ompa
ny S
an D
imas
Calif
orni
a Am
eric
an W
ater
Com
pany
- Ve
ntur
a Di
stric
tPo
way
City
of
Sant
a M
arga
rita
Wat
er D
istric
tCa
lifor
nia
Wat
er S
ervi
ce C
ompa
ny V
isalia
Cala
vera
s Cou
nty
Wat
er D
istric
tCa
lifor
nia
Wat
er S
ervi
ce C
ompa
ny P
alos
Ver
des
Clov
is Ci
ty o
fRi
vers
ide
High
land
Wat
er C
ompa
nyW
est V
alle
y W
ater
Dist
rict
Calif
orni
a W
ater
Ser
vice
Com
pany
Oro
ville
Yorb
a Li
nda
Wat
er D
istric
tDi
scov
ery
Bay
Com
mun
ity S
ervi
ces D
istric
tRo
sevi
lle C
ity o
fBa
nnin
g C
ity o
fGo
lden
Sta
te W
ater
Com
pany
- Co
rdov
aFo
lsom
City
of
Sant
a Cl
arita
Val
ley
Wat
er A
utho
rity
New
hall
Divi
sion
Sant
a Cl
arita
Val
ley
Wat
er A
utho
rity
New
hall
Divi
sion
Bake
rsfie
ld C
ity O
fRe
ddin
g Ci
ty o
fM
onte
cito
Wat
er D
istric
tLo
s Ang
eles
Cou
nty
Wat
erw
orks
Dist
rict 2
9 - M
alib
u &
…Sa
nta
Clar
ita V
alle
y W
ater
Aut
horit
y N
ewha
ll Di
visio
n
Per C
apita
Dem
and
(GPC
D)
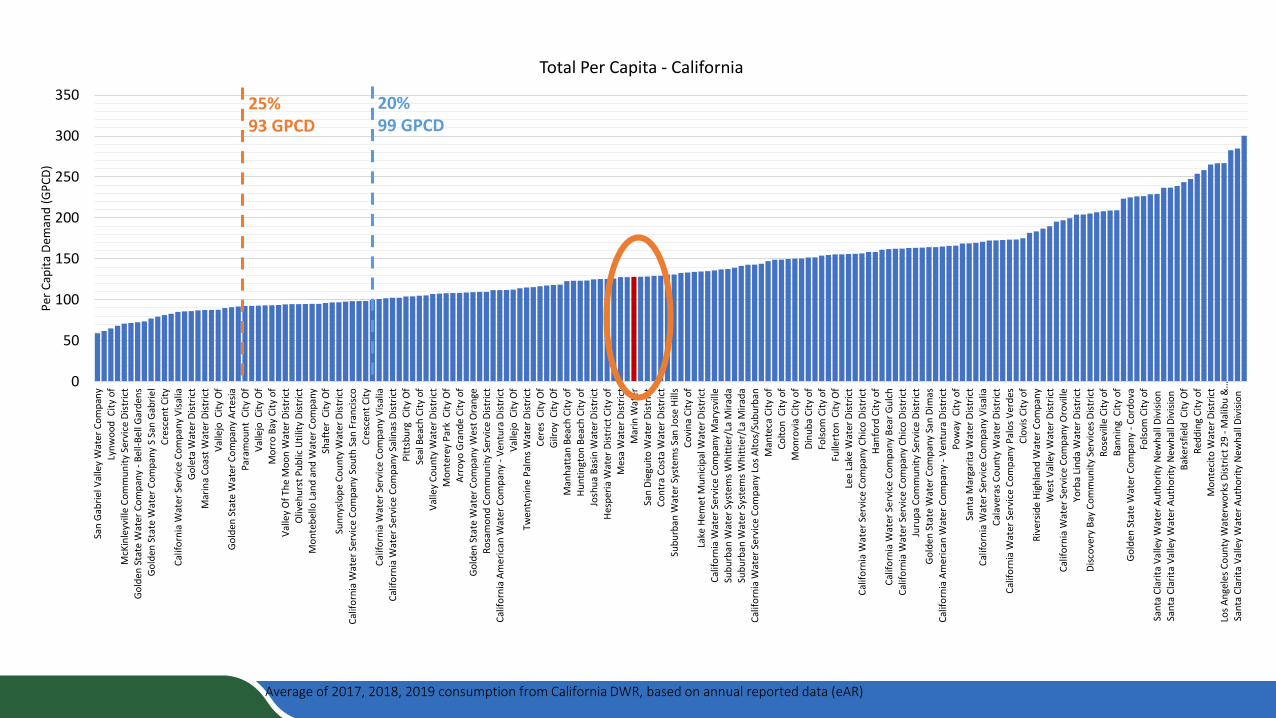
Total Per Capita - California
MMWD’s Per Capita Use is in the Middle of the Pack

Per Capita Water Use from 2010-2020
11
MMWD, 124
NMWD, 119
Santa Rosa, 99
Petaluma, 107
Sonoma, 166
San Francisco, 76
BAWSCA, 106
EBMUD, 121
40
60
80
100
120
140
160
180
2009 2010 2011 2012 2013 2014 2015 2016 2017 2018 2019 2020 2021
Per C
apita
Pot
able
Wat
er U
se (G
PCD)
MMWD NMWD Santa Rosa Petaluma Sonoma San Francisco BAWSCA Agencies EBMUD
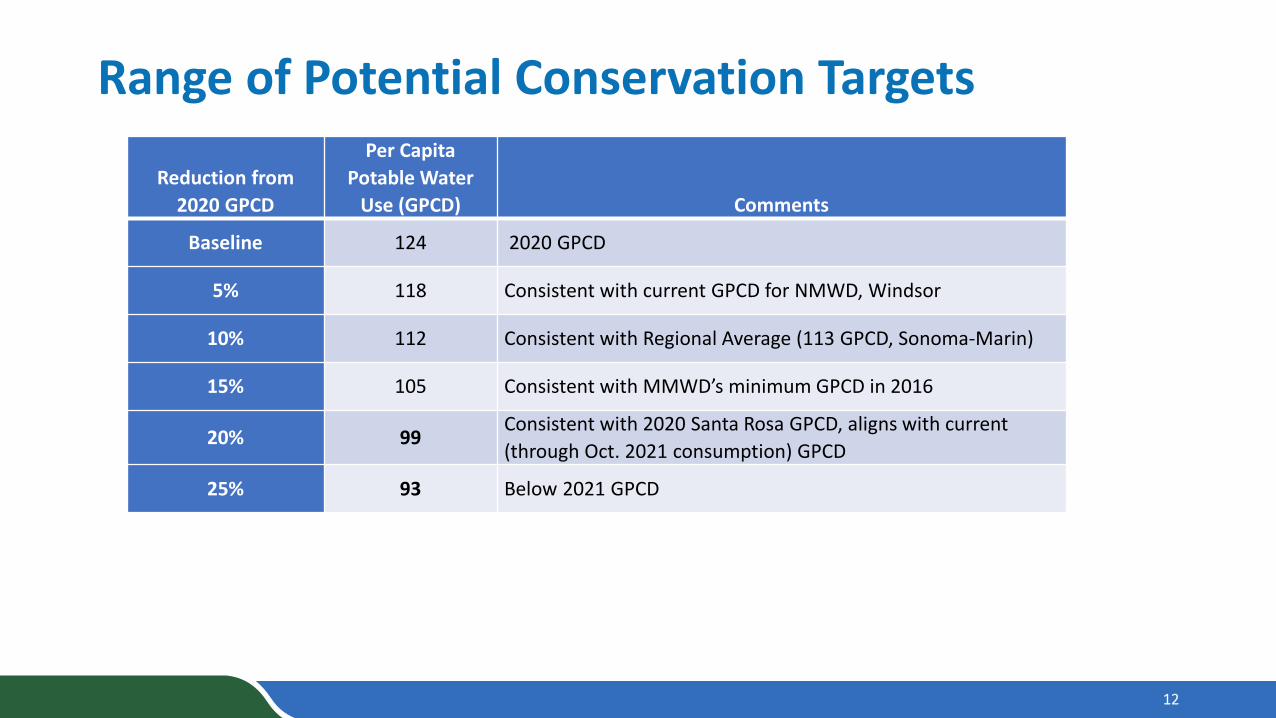
Range of Potential Conservation Targets
Reduction from 2020 GPCD
Per Capita Potable Water
Use (GPCD) Comments
Baseline 124 2020 GPCD
5% 118 Consistent with current GPCD for NMWD, Windsor
10% 112 Consistent with Regional Average (113 GPCD, Sonoma-Marin)
15% 105 Consistent with MMWD’s minimum GPCD in 2016
20% 99Consistent with 2020 Santa Rosa GPCD, aligns with current (through Oct. 2021 consumption) GPCD
25% 93 Below 2021 GPCD
12

Per Capita Water Use from 2010-2020
13
MMWD, 124
NMWD, 119
Santa Rosa, 99
Petaluma, 107
Sonoma, 166
San Francisco, 76
BAWSCA, 106
EBMUD, 121
40
60
80
100
120
140
160
180
2009 2010 2011 2012 2013 2014 2015 2016 2017 2018 2019 2020 2021
Per C
apita
Pot
able
Wat
er U
se (G
PCD)
MMWD NMWD Santa Rosa Petaluma Sonoma San Francisco BAWSCA Agencies EBMUD
20%99 GPCD
25%93 GPCD

Change in Per Capita Water Use from 2010 to 2020
• Greatest reduction over 10-year period was 20%
• MMWD minimum was 105 GPCD in 2016
• Min use from 2010-2020 in was 84 GPCD (Santa Rosa in 2015)
Agency
Potable Water Use (GPCD)
Minimum (2010-2020) 2010 2020
Change 2010-2020
(%)MMWD 105 124 124 0.03%Sonoma 126 148 166 12%VOMWD 87 98 102 4.1%Santa Rosa 84 103 99 -4.0%EBMUD 106 130 121 -7.1%Petaluma 105 117 107 -8.5%NMWD 107 134 119 -12%BAWSCA 94 130 106 -19%SFPUC 75 95 76 -20%

Change in Per Capita Water Use – Current Drought
• Through August, MMWD’s GPCD has been reduced by 23%, a new historical low
Agency
Potable Water Use (GPCD)Minimum
(2010-2020)
2020Change
2010-2020 (%)
2021 thru August
Change 2020-2021
(%)MMWD 105 124 0.03% 96 -23%Sonoma 126 166 12% 143 -14%VOMWD 87 102 4.1% 94 -8%Santa Rosa 84 99 -4.0% 92 -7%EBMUD 106 121 -7.1% 118 -2%Petaluma 105 107 -8.5% 110 3%NMWD 107 119 -12% 103 -13%SFPUC 75 76 -20% 67 -12%
Average of 2017, 2018, 2019 consumption from California DWR, based on annual reported data (eAR)
0
50
100
150
200
250
300
350Sa
n Ga
brie
l Val
ley
Wat
er C
ompa
nyLy
nwoo
d C
ity o
fM
cKin
leyv
ille
Com
mun
ity S
ervi
ce D
istric
tGo
lden
Sta
te W
ater
Com
pany
- Be
ll-Be
ll Ga
rden
sGo
lden
Sta
te W
ater
Com
pany
S S
an G
abrie
lCr
esce
nt C
ityCa
lifor
nia
Wat
er S
ervi
ce C
ompa
ny V
isalia
Gole
ta W
ater
Dist
rict
Mar
ina
Coas
t Wat
er D
istric
tVa
llejo
City
Of
Gold
en S
tate
Wat
er C
ompa
ny A
rtes
iaPa
ram
ount
City
Of
Valle
jo C
ity O
fM
orro
Bay
City
of
Valle
y O
f The
Moo
n W
ater
Dist
rict
Oliv
ehur
st P
ublic
Util
ity D
istric
tM
onte
bello
Lan
d an
d W
ater
Com
pany
Shaf
ter
City
Of
Sunn
yslo
pe C
ount
y W
ater
Dist
rict
Calif
orni
a W
ater
Ser
vice
Com
pany
Sou
th S
an F
ranc
isco
Cres
cent
City
Calif
orni
a W
ater
Ser
vice
Com
pany
Visa
liaCa
lifor
nia
Wat
er S
ervi
ce C
ompa
ny S
alin
as D
istric
tPi
ttsb
urg
City
Of
Seal
Bea
ch C
ity o
fVa
lley
Coun
ty W
ater
Dist
rict
Mon
tere
y Pa
rk C
ity O
fAr
royo
Gra
nde
City
of
Gold
en S
tate
Wat
er C
ompa
ny W
est O
rang
eRo
sam
ond
Com
mun
ity S
ervi
ce D
istric
tCa
lifor
nia
Amer
ican
Wat
er C
ompa
ny -
Vent
ura
Dist
rict
Valle
jo C
ity O
fTw
enty
nine
Pal
ms W
ater
Dist
rict
Cere
s Ci
ty O
fGi
lroy
City
Of
Man
hatt
an B
each
City
of
Hunt
ingt
on B
each
City
of
Josh
ua B
asin
Wat
er D
istric
tHe
sper
ia W
ater
Dist
rict C
ity o
fM
esa
Wat
er D
istric
tM
arin
Wat
erSa
n Di
egui
to W
ater
Dist
rict
Cont
ra C
osta
Wat
er D
istric
tSu
burb
an W
ater
Sys
tem
s San
Jose
Hill
sCo
vina
City
of
Lake
Hem
et M
unic
ipal
Wat
er D
istric
tCa
lifor
nia
Wat
er S
ervi
ce C
ompa
ny M
arys
ville
Subu
rban
Wat
er S
yste
ms W
hitt
ier/
La M
irada
Subu
rban
Wat
er S
yste
ms W
hitt
ier/
La M
irada
Calif
orni
a W
ater
Ser
vice
Com
pany
Los
Alto
s/Su
burb
anM
ante
ca C
ity o
fCo
lton
City
of
Mon
rovi
a Ci
ty o
fDi
nuba
City
of
Folso
m C
ity o
fFu
llert
on C
ity O
fLe
e La
ke W
ater
Dist
rict
Calif
orni
a W
ater
Ser
vice
Com
pany
Chi
co D
istric
tHa
nfor
d Ci
ty o
fCa
lifor
nia
Wat
er S
ervi
ce C
ompa
ny B
ear G
ulch
Calif
orni
a W
ater
Ser
vice
Com
pany
Chi
co D
istric
tJu
rupa
Com
mun
ity S
ervi
ce D
istric
tGo
lden
Sta
te W
ater
Com
pany
San
Dim
asCa
lifor
nia
Amer
ican
Wat
er C
ompa
ny -
Vent
ura
Dist
rict
Pow
ay C
ity o
fSa
nta
Mar
garit
a W
ater
Dist
rict
Calif
orni
a W
ater
Ser
vice
Com
pany
Visa
liaCa
lave
ras C
ount
y W
ater
Dist
rict
Calif
orni
a W
ater
Ser
vice
Com
pany
Pal
os V
erde
sCl
ovis
City
of
Rive
rsid
e Hi
ghla
nd W
ater
Com
pany
Wes
t Val
ley
Wat
er D
istric
tCa
lifor
nia
Wat
er S
ervi
ce C
ompa
ny O
rovi
lleYo
rba
Lind
a W
ater
Dist
rict
Disc
over
y Ba
y Co
mm
unity
Ser
vice
s Dist
rict
Rose
ville
City
of
Bann
ing
City
of
Gold
en S
tate
Wat
er C
ompa
ny -
Cord
ova
Folso
m C
ity o
fSa
nta
Clar
ita V
alle
y W
ater
Aut
horit
y N
ewha
ll Di
visio
nSa
nta
Clar
ita V
alle
y W
ater
Aut
horit
y N
ewha
ll Di
visio
nBa
kers
field
City
Of
Redd
ing
City
of
Mon
teci
to W
ater
Dist
rict
Los A
ngel
es C
ount
y W
ater
wor
ks D
istric
t 29
- Mal
ibu
&…
Sant
a Cl
arita
Val
ley
Wat
er A
utho
rity
New
hall
Divi
sion
Per C
apita
Dem
and
(GPC
D)
Total Per Capita - California
25%93 GPCD
20%99 GPCD

Historical GPCD and Potential Targets
• Baseline shown is the 2020 UWMP population projections
• 2021 (through August) is 96 GPCD, a new historical low
• Exceeds a 20% target• Some post drought rebound is
expected
17
Baseline (UWMP), 117 GPCD
20%, 99 GPCD
25%, 93 GPCD
50
70
90
110
130
150
2005 2010 2015 2020 2025 2030 2035Po
tabl
e Pe
r Cap
ita D
eman
d (G
PCD)
Potential Conservation Targets, Baseline, and Historical GPCD
Historical Baseline (UWMP), 117 GPCD
20%, 99 GPCD 25%, 93 GPCD
Axis truncated to show detail
*2021 GPCD reflects use through August 2021

Informational Residential Water Budgets
18

Informational Residential Water Budgets Contract signed with consultant to develop informational residential water budgets Indoor budgets options: fixed at 5,000 gallons/month; reported number of bedrooms parcel records; average indoor gallons/day/resident (or connection)
Outdoor budget options: irrigable area allowed x gallons per square foot (gpsf); allowed gpsf may be reduced as landscape size increases
Informational Water Budgets will be complete in January.
19

20
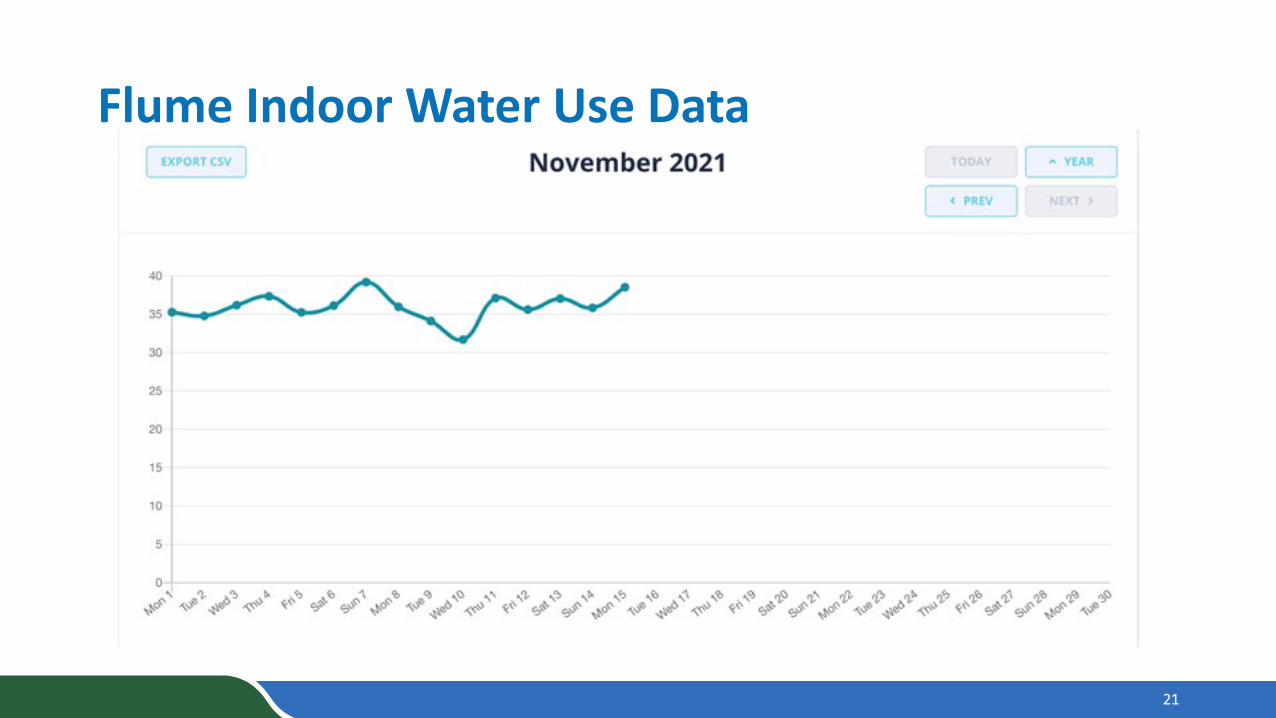
Flume Indoor Water Use Data
21

Next Steps
22

Next Steps
• Incorporate input to Intertie Draft Principles• Select long-term conservation target • Water Efficiency Master Plan will be developed to meet long-
term conservation target• Develop R-GPCD goals• Finalize informational water budgets for residential
customers
23