Water Diffusion into and Electrical Testing of Composite Insulator … · Water Diffusion into and...
17
Armentrout et al.: Water Diffusion into and Electrical Testing of Composite Insulator GRP Rods 506 Water Diffusion into and Electrical Testing of Composite Insulator GRP Rods D. Armentrout, M. Kumosa, and L. Kumosa Center for Advanced Materials and Structures Department of Engineering, University of Denver 2390 S. York St., Denver, CO 80208 ABSTRACT This paper describes water diffusion into and electrical testing of unidirectional ( ) glass reinforced polymer GRP composite rods used as load bearing components ( ) in high voltage composite non-ceramic insulators. The tests were performed fol- lowing ANSI standard C29.11 Section 7.4.2 that can be used to evaluate electrical properties of composites. The unidirectional composite rod materials based on ei- ther E-glass or ECR-glass fibers with modified polyester, epoxy and vinyl ester resins were investigated. Two types of ECR-glass fibers were considered, namely ( ) high and low seed voids . The effects of composite surface sandblasting, mechani- cal pre-loading and nitric acid exposure on the electrical properties of the compos- ites were studied. In addition to the required data of the ANSI standard, the speci- men mass gain was also measured after boiling for 100 h. Most importantly, there was no correlation found between the mass gain and the leakage current for differ- ent composites. The materials with high seed ECR-glass fibers had much higher leakage currents and they absorbed less moisture than the composites based on ei- ther the low seed ECR-glass fibers or E-glass fibers. It was shown in this work that different types of sandblasting, as well as mechanical preloading with and without acid exposure had a negligible effect on the leakage currents and water mass gain of the composite specimens. Index Terms — Water diffusion, composite insulators, non-ceramic insulators, glass reinforced polymer, GRP rods, sand blasting, mechanical pre-loading, nitric acid exposure, leakage current. 1 INTRODUCTION Ž . ON-CERAMIC composite insulators NCI have N been used in electrical transmission applications with line voltages ranging from 69 to 735 kV. The structural component of a NCI is a unidirectional glass reinforced Ž . polymer GRP composite rod. Under certain conditions the GRP rods and thus composite insulators can fail in- service either mechanically or electrically if water ingress is allowed into the insulators. The presence of either wa- ter or weak nitric acid inside an insulator can cause brittle Ž . fracture, also known as stress corrosion cracking SCC w x 1-16 . Water ingress can also significantly change the Ž . electrical dielectrical properties of the composite GRP w x rods 7, 9, 13 . To prevent insulator failures, both the resistance to w x w brittle fracture 6 13, 15, 16 and electrical failures 7, 9, x 13, 14 of insulator rod composites must be improved. Standards exist for testing NCI composites for their elec- Manuscript recei®ed on 17 February 2003, in final form 30 October 2003. trical properties by measuring the electrical leakage cur- rent after aqueous salt solution has diffused into a com- posite material. These standards are described in ANSI wx C29.11 Section 7.4.2 1 and in a similar international w x standard IEC 61109 Section 5.4.2 17 . The main results from both of these tests are pass or fail of the material based on a leakage current level of 1 mA at 12 kV. w x In the two standards 1, 17 , the test is called a water diffusion test. In material science, however, the usual wa- ter diffusion test has nothing to do with the electrical properties of materials. It only determines the amount of water that diffuses into a material as specified in the w x ASTM standard D-5229 18 . A modified version of the water diffusion test used in this investigation will be re- ferred to as the water-diffusion-electrical-test because of both its electrical and water diffusion aspects. Ž ECR-glass fibers otherwise known as corrosion resis- . tant E-glass fibers have been shown to be less susceptible w x to SCC than E-glass fibers 7-11, 13-16 . The ECR-glass fibers are chemically very similar to the E-glass fibers ex- 1070-9878 r 04 r $20.00 2004 IEEE 506
Transcript of Water Diffusion into and Electrical Testing of Composite Insulator … · Water Diffusion into and...

Armentrout et al.: Water Diffusion into and Electrical Testing of Composite Insulator GRP Rods506
Water Diffusion into and Electrical Testing of CompositeInsulator GRP Rods
D. Armentrout, M. Kumosa, and L. KumosaCenter for Advanced Materials and Structures
Department of Engineering, University of Denver2390 S. York St., Denver, CO 80208
ABSTRACTThis paper describes water diffusion into and electrical testing of unidirectional
( )glass reinforced polymer GRP composite rods used as load bearing components( )in high voltage composite non-ceramic insulators. The tests were performed fol-
lowing ANSI standard C29.11 Section 7.4.2 that can be used to evaluate electricalproperties of composites. The unidirectional composite rod materials based on ei-ther E-glass or ECR-glass fibers with modified polyester, epoxy and vinyl esterresins were investigated. Two types of ECR-glass fibers were considered, namely
( )high and low seed voids . The effects of composite surface sandblasting, mechani-cal pre-loading and nitric acid exposure on the electrical properties of the compos-ites were studied. In addition to the required data of the ANSI standard, the speci-men mass gain was also measured after boiling for 100 h. Most importantly, therewas no correlation found between the mass gain and the leakage current for differ-ent composites. The materials with high seed ECR-glass fibers had much higherleakage currents and they absorbed less moisture than the composites based on ei-ther the low seed ECR-glass fibers or E-glass fibers. It was shown in this work thatdifferent types of sandblasting, as well as mechanical preloading with and withoutacid exposure had a negligible effect on the leakage currents and water mass gainof the composite specimens.
Index Terms — Water diffusion, composite insulators, non-ceramic insulators,glass reinforced polymer, GRP rods, sand blasting, mechanical pre-loading, nitricacid exposure, leakage current.
1 INTRODUCTIONŽ .ON-CERAMIC composite insulators NCI haveNbeen used in electrical transmission applications with
line voltages ranging from 69 to 735 kV. The structuralcomponent of a NCI is a unidirectional glass reinforced
Ž .polymer GRP composite rod. Under certain conditionsthe GRP rods and thus composite insulators can fail in-service either mechanically or electrically if water ingressis allowed into the insulators. The presence of either wa-ter or weak nitric acid inside an insulator can cause brittle
Ž .fracture, also known as stress corrosion cracking SCCw x1-16 . Water ingress can also significantly change the
Ž .electrical dielectrical properties of the composite GRPw xrods 7, 9, 13 .
To prevent insulator failures, both the resistance tow x wbrittle fracture 6�13, 15, 16 and electrical failures 7, 9,
x13, 14 of insulator rod composites must be improved.Standards exist for testing NCI composites for their elec-
Manuscript recei®ed on 17 February 2003, in final form 30 October 2003.
trical properties by measuring the electrical leakage cur-rent after aqueous salt solution has diffused into a com-posite material. These standards are described in ANSI
w xC29.11 Section 7.4.2 1 and in a similar internationalw xstandard IEC 61109 Section 5.4.2 17 . The main results
from both of these tests are pass or fail of the materialbased on a leakage current level of 1 mA at 12 kV.
w xIn the two standards 1, 17 , the test is called a waterdiffusion test. In material science, however, the usual wa-ter diffusion test has nothing to do with the electricalproperties of materials. It only determines the amount ofwater that diffuses into a material as specified in the
w xASTM standard D-5229 18 . A modified version of thewater diffusion test used in this investigation will be re-ferred to as the water-diffusion-electrical-test because ofboth its electrical and water diffusion aspects.
ŽECR-glass fibers otherwise known as corrosion resis-.tant E-glass fibers have been shown to be less susceptible
w xto SCC than E-glass fibers 7-11, 13-16 . The ECR-glassfibers are chemically very similar to the E-glass fibers ex-
1070-9878rrrrr04rrrrr$20.00 � 2004 IEEE506

IEEE Transactions on Dielectrics and Electrical Insulation Vol. 11, No. 3; June 2004 507
Ž .cept that the boron oxide B O has been removed from2 3
the glass. Insulators based on corrosion resistant boronfree ECR-glass fibers have been available and used pri-
w x w xmarily in Europe since 1983 8 . Kuhl stated 8 that therehave been no brittle fractures of these insulators. The useof the ECR-glass fibers in the United States has been lim-ited because of higher leakage currents as measured by
w xthe water diffusion electrical test 1, 17 . As was shown inw x7, 9, 13 ECR-glass fibers can have both high and lowleakage currents. Sproull received a patent for ECR-glass
w xfibers that have lower leakage currents 19 . The cause ofthe higher leakage current, as Sproull asserts in his patent,
w xis due to a higher seed count in the glass fibers 19 . Seedsare gaseous inclusions originally in the molten state of theglass that are incorporated in the fibers as voids. Thehigher seed counts of the original boron free corrosionresistant glass fibers made them inadequate for most elec-
w xtrical applications. Sproull’s patent 19 used more TiO2
at approximately 1.5% by weight to obtain a lower seedcount glass without B O .2 3
w xAlthough the ANSI standard 1 has been available sincew x1989, only T.S. McQuarrie et al. 7, 9, 13 have preformed
systematic research of leakage currents for different com-w xposite insulators with the water diffusion test 1, 17 . In
addition, no published research could be found that criti-cally evaluates the test or tries to determine why varia-tions can exist in leakage currents among similar compos-ite rod materials. Other insulator related research has fo-cused, for example, on changes in leakage current causedby surface effects on insulators from condensing humidityw x w x20 and different fog chamber conditions 21 .
Research in this work first evaluates the potential ofthe water diffusion electrical test for composite rod test-ing. Then, the test is used to investigate variations in leak-age currents among similar composite insulator rod mate-rials in a variety of different conditions that can occur inactual insulators used in-service. The effects of differentglass fibers, polymer binders and treatment conditions onthe leakage currents are examined in unidirectional glasspolymer composites that either have been commonly usedor might be used in the near future in composite non-ceramic insulators.
2 EXPERIMENTAL2.1 COMPOSITE MATERIALS TESTED
Two groups of unidirectional pultruded composite ma-terials from Glasforms, Inc., USA, were tested in thisstudy. A total of seven different composite systems wereprovided for the initial series of tests. These compositeswere E-glass fibers in epoxy, modified polyester and vinylester; high seed ECR-glass fibers in modified polyester andvinyl ester; and low seed ECR-glass fibers in epoxy andvinyl ester. The composites tested in this series were testedas supplied and after low and medium sandblasting. Crys-tal Mark, Inc., USA, performed the sandblasting. During
the manufacturing process of composite insulators, someinsulator manufacturers apply sandblasting to their GRProds before applying the rubber weathersheds. This ap-parently improves adhesion between the rubber weather-shed and the composite rod. However, during sandblast-ing severe surface damage to the rods can be generatedwhich can affect both the corrosion and electrical proper-ties of the rods. The effect of sandblasting on brittle frac-
wture has been extensively studied by Kumosa et al. 12, 13,x15 . Details of the sandblasting procedure for both the low
and medium sandblasting conditions are shown in Table1. The known sandblasting conditions used by an insulatormanufacture are also shown in Table 1 for comparison.The sandblasting conditions used in this research were ex-actly the same as in a SCC study performed by Kumosa et
w xal. 12, 13, 15 on GRP composites.
For the second series of the water diffusion electricalŽtests, composites based only on ECR-fibers both high and
.low seed ECR-glass fibers with epoxy, modified polyester,and vinyl ester were obtained. All materials in the secondseries of tests had already been sandblasted by an insula-tor manufacturer and stressed to 45% of the failure load
w xfor 96 h 7, 9, 13, 16 . Some of those materials were alsoexposed to 1 N nitric acid for 96 h. The composite systemstested in the second group had already been tested for
w xtheir brittle fracture resistance 7, 9, 13, 16 . Out of thenine composite systems based on E-glass, low and highseed ECR-glass fibers with modified polyester, epoxy andvinyl ester only the six ECR-glass fiber composites passed
w xthe brittle fracture test 7, 9, 13, 16 with no visible dam-age to the composites. Since all the E-glassrpolymer com-posites failed the brittle fracture test by multiple rod frac-tures and splits, specimens could not have been taken forthe electrical tests from those composites. That is the rea-son why in the second series of experiments, only theECR-glass fiber based composites were tested.
2.2 TEST PROCEDUREThe test procedures used in the water diffusion electri-
cal tests performed in this investigation were slightly dif-ferent from the water diffusion test as recommended by
w xthe ANSI standard 1 . First, the ANSI standards statesw x1 , ‘‘Only one core material may be boiled at one time’’.In this research in order to boil different materials at once,each specimen was isolated from the others by sealing it
Ž .in a polyethylene terephthalate PET pouch with approx-imately 50 ml of deionized water with 0.1% by weightNaCl. The individual bags were placed in boiling deion-ized water with 0.1% by weight NaCl. The boiling watercaused each bag to pressurize slightly as they reachedtemperature equilibrium.
A second procedural variation from the ANSI standardw x1 was an initial measurement of the leakage current be-fore the water diffusion electrical test. Rather than havingonly the final measure of leakage current, a measurement
1070-9878rrrrr04rrrrr$20.00 � 2004 IEEE 507

Armentrout et al.: Water Diffusion into and Electrical Testing of Composite Insulator GRP Rods508
Table 1. Sandblasting conditions used in this study and by an insulator manufacturer.
Manufacturer Rod Low MediumPretreatment Sandblasting Sandblasting
Blasting Particles Al O Size Unknown Al O 17.5 �m Al O 17.5 �m3 2 3 2 3 2Pressures 344 kPa 275 kPa 550 kPaFeed Rate Unknown 3.4 mmrs 1.7 mmrs
Angle Incidence Grazing Perpendicular PerpendicularNozzle Size Unknown 1.14 mm 1.14 mm
Rod Rotation Rate Unknown 600 RPM 600 RPM
of the initial leakage current before boiling was per-formed so that the change in leakage current due to ab-sorbed moisture could be determined. By examining thechange in leakage current, the effects of water diffusioncould be evaluated while minimizing other factors not re-lated to the test like the capacitance of the electrodes. InSection 3.12 a discussion is included which demonstratesthat the initial measurement of leakage current had noeffect on the final current measurement after boiling.
Another set of procedural changes from the standardw x1 was made to determine the specimen mass gain fromboiling. In order to determine if mass gain from moistureabsorption could be correlated with changes in leakagecurrent a measure of mass before and after boiling wasneeded. The initial mass of all specimens was recordedafter cleaning them with isopropyl alcohol, before boiling.In order to obtain the mass of the specimens after boiling,they were removed from the room temperature tap water,dried with filter paper, weighed, and then the leakage cur-rent was measured.
Finally, in order to reduce the amount of moisture gainduring specimen cutting in water as specified in the stan-
w xdards 1, 17 , the specimens were cut in methanol instead.
Figure 1. Diagram of a specimen between two brass electrodes.
For the second group of specimens from Glasforms, Inc.,the specimens were vacuum dried at 110 �C for 17 h be-fore boiling. The combined effect of all of these procedu-
w xral changes in comparison with the standard 1 on theleakage current measurements is discussed in Section 3.12of this work.
2.3 HIGH VOLTAGE MEASUREMENTSDuring high-voltage testing, the specimens were placed
between two brass electrodes in a high voltage chamber asshown in Figure 1. A Hipotronics HD-140-Auto ACrDChipot was used for the voltage source of these tests. The
w xANSI standard 1 calls for the voltage to ramp at approxi-mately 1 kVrs to 12 kV. The voltage source was set to stopat 12 kV with the maximum voltage ramp rate, yieldingthe initial voltage time curve shown in Figure 2. It can beseen in Figure 2 that the initial curve ramps up at about1.3 kVrs to 8 kV, and then slowly approaches 12 kV at arate of 110 Vrs. After a 60 s hold at 12 kV, the voltagedecreases to zero at a rate of 1.2 kVrs. Initially these ramprates were unstable and they slowed over time. Later theproblem with ramp rates was fixed and the second curveshown in Figure 2 was obtained. The repaired hipot couldrepeatably reach 12 kV in 27 s as opposed to the previousperformance that required 37 to 83 s to ramp to 12 kV.No noticeable change in the measured leakage current wasmeasured with the different ramp rates.
A Protek 608 digital multi-meter was used to record allleakage current values on a laptop computer. The meterhad a 0.1 �A resolution on the 5 mA scale. For these
Figure 2. Voltage versus time plots generated by the hipot voltagesource initially and after the hipot had been optimized.
1070-9878rrrrr04rrrrr$20.00 � 2004 IEEE508

IEEE Transactions on Dielectrics and Electrical Insulation Vol. 11, No. 3; June 2004 509
tests, a max function was used that stores the maximumcurrent value sampled at a rate of 10 samplesrs. The max-imum value was held until the meter was reset. Since the
w xstandards 1, 17 require that the current during the wholetest shall not exceed 1 mA, the maximum function hasbeen used to verify that the leakage current stayed belowthis value. The maximum leakage current value was out-put to a computer through an optical interface, which pro-vided electrical isolation between the meter and com-puter. The maximum current values from the meter wererecorded on the computer and stored for later processingor verification.
2.4 SEM OBSERVATIONSŽ .A JEOL 5800 LV scanning electron microscope SEM
was used to examine the morphology of the specimens be-fore and after the water diffusion electrical testing. SEMimages were obtained in low vacuum mode, which allowsfor examination of uncoated rods. A backscatter electrondetector was used for all SEM images. SEM images areshown in Figure 3 comparing the rod surfaces of a low
Ž .seed ECR-glass epoxy in the as received Figure 3a , theŽ . Ž .light Figure 3b and medium Figure 3c sandblasted con-
Žditions, and the manufacturers sandblasted surface Fig-.ure 3d . An increase in surface damage can be seen be-
tween the light and medium sandblasted conditions. Un-protected fibers on the surface of the material sand-blasted by a manufacturer were damaged more than themedium sandblasted conditions. Since the manufacturersandblasting treatment was at a glancing angle, fibersslightly below the surface level were protected from dam-age by the higher surface fibers.
Images of the polished rod cross-sections are shown inŽ .Figure 4 for rods with E-glass Figure 4a , high seed
Ž .ECR-glass Figure 4b and low seed ECR-glass fibersŽ .Figure 4c . Since all these images were taken at the samemagnification, an obvious difference between the fibers istheir average diameter. The high seed ECR-glass fibersare approximately 20 �m in diameter while the low seedECR-glass and E-glass fibers have an average diameter ofabout 14 �m. Another major difference between thesefibers is the presence of voids in the high seed ECR-glass
Figure 3. SEM images of the low seed ECR-glass epoxy rod. a, as received surface; b, light sandblasted surface; c; medium sandblastedsurface; d, a manufacturers sandblasted surface.
1070-9878rrrrr04rrrrr$20.00 � 2004 IEEE 509

Armentrout et al.: Water Diffusion into and Electrical Testing of Composite Insulator GRP Rods510
fibers. The fiber voids were common in the high seedECR-glass while none were observed in the low seedECR-glass or E-glass fibers.
3 EVALUATIONS OF THE WATERDIFFUSION ELECTRICAL TEST
Before the systematic testing of all composite systemsfor their electrical properties, evaluations of the water dif-fusion electrical test were performed. Several different as-pects of the test that could affect the leakage current datawere analyzed.
3.1 EFFECT OF WIRE POSITIONSince an ac voltage was used, changes in capacitance
have an effect on the leakage current. It was found thatby repositioning of the meter test leads, the leakage cur-rent changed by �0.2 �A. As long as the meter leadswere positioned away from each other, the effect of mov-ing the leads was found to be negligible. When the wiremeter leads were twisted around each another, the capac-itance increased thus increasing the leakage current. Forthe measurement of specimen leakage current, the testleads were always positioned away from each other.
3.2 EFFECT OF SHARP OBJECTSWhenever sharp conductive objects were located near
or in contact with an electrode the leakage current in-creased. These sharp metal objects changed the electricalfield and increased the leakage current. As a result of thisobservation, the high voltage test area was cleared of allmetal objects except the electrodes.
3.3 EFFECT OF THE SPECIMENPRESENCE ON LEAKAGE CURRENTS
A measurement was performed of the leakage currentwithout a composite specimen and with the upper brasshigh voltage electrode suspended in air approximately 30
Žmm above the lower electrode the distance between the.electrodes if a specimen were in between . The leakage
current was 11.4 � 0.2 �A caused mainly by the capaci-tance between the electrodes, where changes in humidityand electrode separation caused fluctuations in this value.Before boiling, specimens in this investigation had a leak-age current in the range of 12.4 to 13.5 �A. This wouldimply that the initial leakage current due to the actualspecimen was in the range of 0.8 to 2.3 �A caused primar-ily by the increased capacitance since the composites have
Ž .a higher dielectric constant than air see Section 5 .
3.4 EFFECT OF SPECIMEN CONTACTWITH THE ELECTRODES
In order to determine if the quality of the electricalcontact between the specimen and electrodes had any ef-fect on the leakage current measurements, several tests
Figure 4. SEM images of rod cross-sections from materials with thefollowing fibers. a, E-glass; b, high seed ECR-glass; c, low seedECR-glass.
were performed. First, one end of a specimen was moist-ened with water and the leakage current was measured.This caused no change in leakage current. In order to geteven better electrical contact, the specimen ends were
Žcoated with carbon paint colloidal graphite in isopropyl
1070-9878rrrrr04rrrrr$20.00 � 2004 IEEE510
IEEE Transactions on Dielectrics and Electrical Insulation Vol. 11, No. 3; June 2004 511
.alcohol and allowed to dry. The carbon coated endscaused no change in leakage current. Conductive end capsof aluminum foil were also attached with either super glue,epoxy or silicon rubber. None of the differences in electri-cal contacts with the specimens had any effect on themeasured leakage current.
3.5 SELECTION OF THE LEAKAGECURRENT STANDARD SPECIMEN
Early on during testing, a need was recognized for aspecimen that could be used to determine the fluctuationsin the baseline leakage current. A specimen chosen forthis needed to have a very small change in leakage currentafter boiling. A leakage current standard that fulfilled thisrequirement was a low seed ECR-glass epoxy specimen,which had only a 0.7 �A change in leakage current afterboiling. After boiling the specimen was air dried for sev-eral months before being used as standard. As a standard,this specimen was stored in the high voltage chamber sothat it could be maintained at the ambient conditions ofthe chamber. After the leakage current standard wasidentified, its leakage current has been measured beforemeasuring the leakage current of any specimen to deter-mine the baseline conditions. The initial leakage currentof the standard was 12.8 �A and the long-term variationswere in the range of 12.5 to 13.5 �A with an average of13.0 �A. Short-term variations of the standard leakagecurrent over a period of four days have been less than orequal to 0.3 �A. After being tested under high voltageover one hundred times, the current standard has notshown any significant shift in leakage current.
3.6 EFFECT OF TEMPERATURE ANDHUMIDITY
In order to determine if the specimen temperature hadany influence on the leakage current, a randomly selectedspecimen was heated to 100�C and transferred immedi-ately to the high voltage chamber after heating. The leak-age current of the specimen did not change. Then, a heat-ing lamp was placed in the high voltage chamber and thespecimen was heated with the chamber. The leakage cur-rent was checked during heating. After several measure-ments the current dropped by approximately 0.1 �A,which is within experimental error. It was concluded thattemperature does not have any significant effect on thecurrent measurements.
Seasonal changes of the leakage current standardrecorded over a period longer than a year showed an in-crease in currents by approximately 1 �A during the morehumid summer months and on rainy days. Since theamount of humidity in the air increases the dielectric con-stant of the air and capacitance between the electrodes,the leakage current will vary with humidity. The effect ofhumidity on leakage currents was found to be greater thanthe effect of temperature. To account for the effect of
humidity on leakage currents all tests were performed inthe same room with the ambient relative humidity varyingfrom 10 to 45% over the last two years. Within the four-daytest period the variation in humidity was much smaller.
3.7 EFFECT OF SPECIMEN DRYINGw xThe standards 1, 17 require that test specimens be
cleaned in isopropyl alcohol immediately before boiling.Early on during testing, the specimens were also cleanedin isopropyl alcohol just before measuring the initial leak-age current. It was discovered that some specimens, par-ticularly the specimens with high seed ECR-glass fibers,
Ž .had elevated initial leakage currents �14 �A , which wascaused by alcohol absorption. However, if the specimenswere allowed to dry in air a few hours after cleaning, theinitial leakage current of the specimens with the high seed
Ž .ECR-glass fibers would be very similar �13 �A to thespecimens with the low seed fibers, indicating that the al-cohol evaporated.
The amount of moisture absorbed by the compositespecimens before the initial current measurements de-pends on the moisture history of the specimen. The onlyreproducible initial starting condition is to thoroughly drythe specimens. Various drying techniques were also foundto have a significant effect on the initial specimen mass.Initially, a two-hour drying time at 110�C in vacuum wastried to lower the initial leakage current due to alcohol.While this worked well for the reduction of the initialleakage current due to alcohol absorption, it did notcompletely remove all the moisture that the specimenshave absorbed since manufacturing. In order to better drythe specimens, they were put under vacuum for 17 h at110 �C.
3.8 EXTERNAL INDICATIONS OF HIGHCURRENTS
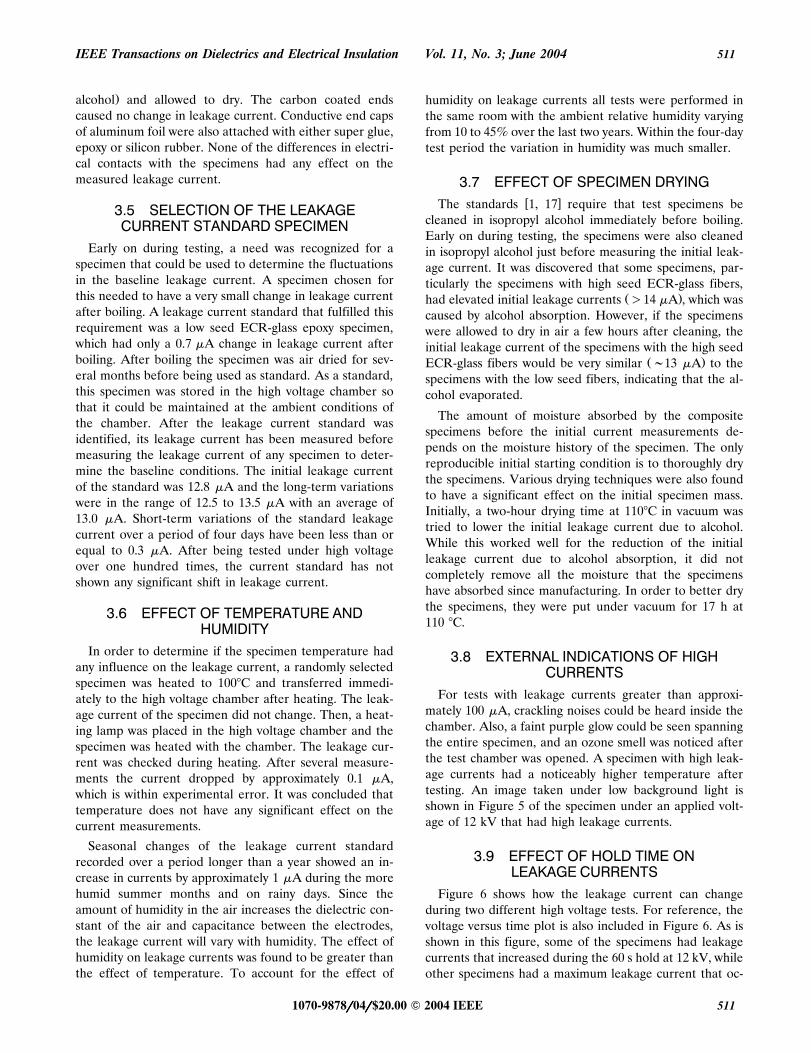
For tests with leakage currents greater than approxi-mately 100 �A, crackling noises could be heard inside thechamber. Also, a faint purple glow could be seen spanningthe entire specimen, and an ozone smell was noticed afterthe test chamber was opened. A specimen with high leak-age currents had a noticeably higher temperature aftertesting. An image taken under low background light isshown in Figure 5 of the specimen under an applied volt-age of 12 kV that had high leakage currents.
3.9 EFFECT OF HOLD TIME ONLEAKAGE CURRENTS
Figure 6 shows how the leakage current can changeduring two different high voltage tests. For reference, thevoltage versus time plot is also included in Figure 6. As isshown in this figure, some of the specimens had leakagecurrents that increased during the 60 s hold at 12 kV, whileother specimens had a maximum leakage current that oc-
1070-9878rrrrr04rrrrr$20.00 � 2004 IEEE 511
Armentrout et al.: Water Diffusion into and Electrical Testing of Composite Insulator GRP Rods512
Figure 5. A photograph of an as received high seed ECR-glass fibersin epoxy specimen with high leakage currents.
Figure 6. Plot of the leakage current and time for two differentspecimens shown with the voltage versus time plot from Figure 2.
curred early during the hold. If a specimen had decreas-ing leakage current after reaching 12 kV this would not beobserved since the meter output is the maximum leakagecurrent up to that time. For specimens with leakage cur-rents above 100 �A, there is a high current uncertaintysince the maximum value could have resulted from a briefspike in current or from increasing currents as shown inFigure 6. Specimens with leakage current below 100 �Adid not exhibit a similar increase in leakage current dur-ing the hold in voltage.
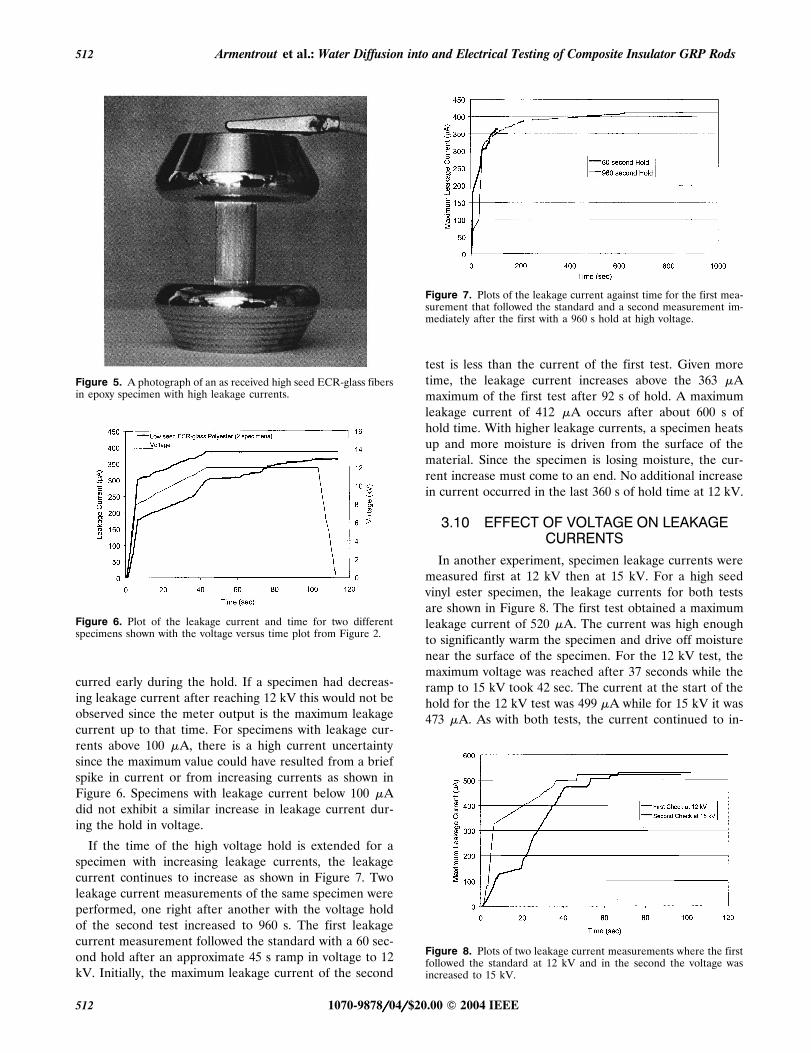
If the time of the high voltage hold is extended for aspecimen with increasing leakage currents, the leakagecurrent continues to increase as shown in Figure 7. Twoleakage current measurements of the same specimen wereperformed, one right after another with the voltage holdof the second test increased to 960 s. The first leakagecurrent measurement followed the standard with a 60 sec-ond hold after an approximate 45 s ramp in voltage to 12kV. Initially, the maximum leakage current of the second
Figure 7. Plots of the leakage current against time for the first mea-surement that followed the standard and a second measurement im-mediately after the first with a 960 s hold at high voltage.
test is less than the current of the first test. Given moretime, the leakage current increases above the 363 �Amaximum of the first test after 92 s of hold. A maximumleakage current of 412 �A occurs after about 600 s ofhold time. With higher leakage currents, a specimen heatsup and more moisture is driven from the surface of thematerial. Since the specimen is losing moisture, the cur-rent increase must come to an end. No additional increasein current occurred in the last 360 s of hold time at 12 kV.
3.10 EFFECT OF VOLTAGE ON LEAKAGECURRENTS
In another experiment, specimen leakage currents weremeasured first at 12 kV then at 15 kV. For a high seedvinyl ester specimen, the leakage currents for both testsare shown in Figure 8. The first test obtained a maximumleakage current of 520 �A. The current was high enoughto significantly warm the specimen and drive off moisturenear the surface of the specimen. For the 12 kV test, themaximum voltage was reached after 37 seconds while theramp to 15 kV took 42 sec. The current at the start of thehold for the 12 kV test was 499 �A while for 15 kV it was473 �A. As with both tests, the current continued to in-
Figure 8. Plots of two leakage current measurements where the firstfollowed the standard at 12 kV and in the second the voltage wasincreased to 15 kV.
1070-9878rrrrr04rrrrr$20.00 � 2004 IEEE512

IEEE Transactions on Dielectrics and Electrical Insulation Vol. 11, No. 3; June 2004 513
crease during the hold at high voltage. It was not until 25s into the hold at 15 kV that the current of the second testsurpassed the maximum current at 12 kV to obtain a max-imum of 529 �A. If the specimen had been unchanged bythe measurement of leakage current at 12 kV, a linearincrease of current with voltage would be expected or amaximum leakage current of 650 �A for the voltage hold.The loss of moisture during these tests seems to be thereason for the lower than expected leakage currents.
3.11 EFFECT OF POST-BOILING TIMEON LEAKAGE CURRENTS
A group of specimens were tested to determine whathappens to the leakage current and mass gains measure-ments over time, after the water diffusion electrical tests.An attempt was made to determine if the elevated cur-rents and masses after boiling would return to the initialvalues. After the water diffusion electrical tests, the speci-mens were then stored under ambient conditions and theleakage current and mass were measured after 7 and 14days. Table 2 lists the changes in currents and masses withrespect to the initial values before boiling for three differ-ent materials. The E-glassrmodified polyester compositesquickly reduced their mass and current after testing whilethe E-glassrepoxy and E-glassrvinyl ester specimens wereslower to release moisture. The drop in current was alsoslower for these specimens. It can also be seen in Table 2that the E-glassrmodified polyester specimens absorbedapproximately three times more moisture than the othertwo composites.
3.12 EFFECT OF TEST MODIFICATIONON LEAKAGE CURRENT
A verification test was performed to determine if all thevariations from the standard as described in Section 2.2had any effect on the measurements of the leakage cur-
w xrents. The ANSI standard 1 was followed exactly in thistest. Six ECR-glass low seedrepoxy specimens and sixECR-glass high seedrmodified polyester specimens wereprepared and tested for their electrical properties accord-
w xing to the ANSI standard 1 . Then, the leakage currentdata were compared with the results from the six speci-mens from each of the same two materials tested usingour modified test procedure. The leakage current resultsfrom six specimens of each material are given in Table 3.For the low seed ECR-glass epoxy material, there was nodifference in leakage current obtained from these twotests. The ranges of leakage current overlap for the testsand the average currents were within one standard devia-tion of the measurements. For the high seed ECR-glassmodified polyester material, the currents were statisticallyhigher when obtained according to the standard and theranges did not overlap.
3.13 COMPARISON BETWEENDIFFERENT LABORATORIES
The same materials investigated in this study were alsosubjected to the water diffusion test following the ANSI
w x w xstandard 1 performed by another laboratory 7, 9 . Theother lab’s results for the low seed ECR-glass epoxy mate-rial ranged from 25 to 29 �A and for the high seed ECR-glass modified polyester material ranged from 688 to 863�A. Compared to the results in Table 3, both materialshad higher leakage currents than obtained in our labora-tory. For the materials with lower current results, the dif-ference between laboratories was most likely due to varia-tions in the test setup and relative humidity. Another dif-ference between the laboratories could be altitude. Higheraltitude gives a lower atmospheric pressure and lowers theboiling point of water. The other tests were performednear sea level, which gives a higher boiling temperaturefor the 0.1% aqueous NaCl solution and also gives a higherbaseline system capacitance between the electrodes. Other
Table 2. After Boiling Results.
�Wt. �Wt. �Current �CurrentAverage After 7 After 14 �Current After 7 After 14
Ž . Ž . Ž . Ž . Ž . Ž .Specimen Type �Wt. % days % days % �A days �A days �A
E-glass mod. polyester 0.657 0.286 0.212 9.4 0.6 0.4E-glass vinyl ester 0.195 0.148 0.133 0.7 0.5 0.4E-glass epoxy 0.235 0.196 0.182 0.5 0.4 0.3
Table 3. Comparison With The Standard Results.
Standard Leakage Currents Modified Standard LeakageŽ . Ž .�A Currents �A
Standard StandardSpecimen Type Range Deviation Average Range Deviation Average
Low Seed ECR- 13.2y14.0 0.27 13.6 13.4y13.7 0.13 13.5glass epoxyHigh Seed ECR-glass mod. 320y407 30.4 366 476y563 35.3 520
Polyester
1070-9878rrrrr04rrrrr$20.00 � 2004 IEEE 513
Armentrout et al.: Water Diffusion into and Electrical Testing of Composite Insulator GRP Rods514
reasons could exist for different results between the twolaboratories. This demonstrates however, that differencesbetween laboratories could be responsible for greater dif-ferences in the leakage current results than most of theeffects described in this Section.
4 RESULTS AND DISCUSSION4.1 AS RECEIVED SPECIMENS
Seven composite systems from Glasforms, Inc. in the asreceived condition were tested in this part of the project.The following seven unidirectional composites were testedfor their electrical properties: E-glassrmodified polyester,E-glassrepoxy, E-glassrvinyl ester, high seed ECR-glassrmodified polyester, high seed ECR-glass vinyl ester,low seed ECR-glassrepoxy and low seed ECR-glassrvinylester. The composite rod specimens were tested aftercleaning, without elevated temperature vacuum drying be-fore boiling. In the initial series of tests on the compositesthe importance of vacuum drying at elevated tempera-tures was not known. The effect of specimen drying onthe leakage current measurements will be further dis-cussed in Section 4.4 of this work.
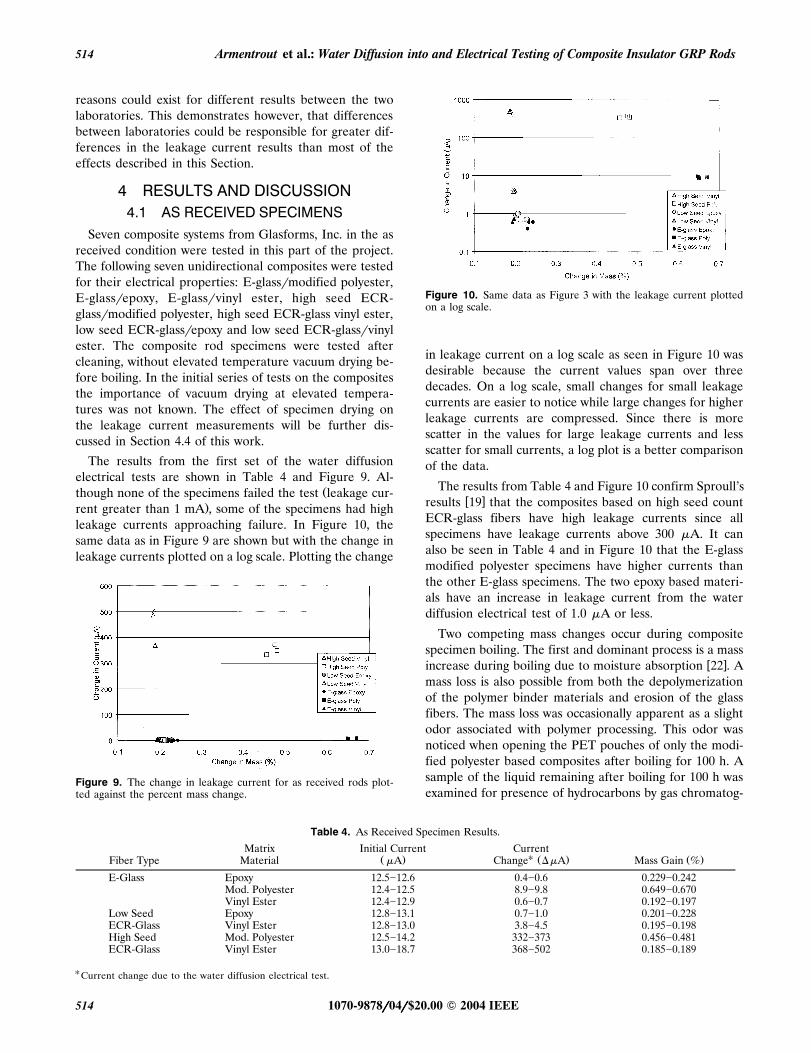
The results from the first set of the water diffusionelectrical tests are shown in Table 4 and Figure 9. Al-
Žthough none of the specimens failed the test leakage cur-.rent greater than 1 mA , some of the specimens had high
leakage currents approaching failure. In Figure 10, thesame data as in Figure 9 are shown but with the change inleakage currents plotted on a log scale. Plotting the change
Figure 9. The change in leakage current for as received rods plot-ted against the percent mass change.
Figure 10. Same data as Figure 3 with the leakage current plottedon a log scale.
in leakage current on a log scale as seen in Figure 10 wasdesirable because the current values span over threedecades. On a log scale, small changes for small leakagecurrents are easier to notice while large changes for higherleakage currents are compressed. Since there is morescatter in the values for large leakage currents and lessscatter for small currents, a log plot is a better comparisonof the data.
The results from Table 4 and Figure 10 confirm Sproull’sw xresults 19 that the composites based on high seed count
ECR-glass fibers have high leakage currents since allspecimens have leakage currents above 300 �A. It canalso be seen in Table 4 and in Figure 10 that the E-glassmodified polyester specimens have higher currents thanthe other E-glass specimens. The two epoxy based materi-als have an increase in leakage current from the waterdiffusion electrical test of 1.0 �A or less.
Two competing mass changes occur during compositespecimen boiling. The first and dominant process is a mass
w xincrease during boiling due to moisture absorption 22 . Amass loss is also possible from both the depolymerizationof the polymer binder materials and erosion of the glassfibers. The mass loss was occasionally apparent as a slightodor associated with polymer processing. This odor wasnoticed when opening the PET pouches of only the modi-fied polyester based composites after boiling for 100 h. Asample of the liquid remaining after boiling for 100 h wasexamined for presence of hydrocarbons by gas chromatog-
Table 4. As Received Specimen Results.
Matrix Initial Current Current�Ž . Ž . Ž .Fiber Type Material �A Change ��A Mass Gain %
E-Glass Epoxy 12.5�12.6 0.4�0.6 0.229�0.242Mod. Polyester 12.4�12.5 8.9�9.8 0.649�0.670Vinyl Ester 12.4�12.9 0.6�0.7 0.192�0.197
Low Seed Epoxy 12.8�13.1 0.7�1.0 0.201�0.228ECR-Glass Vinyl Ester 12.8�13.0 3.8�4.5 0.195�0.198High Seed Mod. Polyester 12.5�14.2 332�373 0.456�0.481ECR-Glass Vinyl Ester 13.0�18.7 368�502 0.185�0.189
�Current change due to the water diffusion electrical test.
1070-9878rrrrr04rrrrr$20.00 � 2004 IEEE514

IEEE Transactions on Dielectrics and Electrical Insulation Vol. 11, No. 3; June 2004 515
Ž .raphy-mass spectroscopy GC-MS and no organics wereŽ .found volatiles had already escaped . This relates to a
mass loss much smaller than the minimum resolution ofŽ .our balance 0.1 mg . Another analysis technique using In-
Ž .ductively Coupled Plasma-Mass spectroscopy ICP-MS ,which yields only elemental information, was performed.ICP-MS showed elevated levels of boron, silicon, calciumand magnesium. Relating the concentration levels back tomass loss of the elements in oxide form accounts for atotal loss of approximately 0.31 mg or 0.0028% of thespecimen total weight. From Table 4 this small fraction ofweight loss is less than the specimen variations of the massgain measurements.
As can be seen from Figure 10, no correlation could befound between the changes in leakage current and massfor all the materials investigated in this part of the study.It has also been found that the moisture absorption de-pends more on the type of polymer binder than the fibertype. The polymer binders in order of least to greatestmoisture absorption are vinyl ester, epoxy, and modifiedpolyester where vinyl ester and epoxy are very close to thesame amount of absorption. This agrees with the observa-tions and conclusions from the moisture research con-ducted on the same composites by exposing them to 80%
w xrelative humidity at 50�C 22 . It can also be observed thatthe high seed ECR-glass with modified polyester compos-ite has lower absorption and higher current than E-glassmodified polyester.
4.2 SANDBLASTED SPECIMENSThe composite rods listed in Section 4.1 were also sub-
jected to the water diffusion electrical test after light and
Figure 11. The change in leakage currents for the light sandblastedrods specimens plotted against the percent mass change.
medium sandblasting. The data for the light sandblastedcomposites are shown in Table 5 and Figure 11 whereasthe medium sandblasted composite data are given in Table6 and shown in Figure 12. Comparing the data shown inFigure 10 with the results presented in Figures 11 and 12,it can be observed that the relative position of the differ-ent materials is about the same. The high seed ECR-glasscomposite systems still exhibit higher leakage currents
Žcompared to the other specimens. All three tables Tables.4�6 have overlapping mass gain ranges for corresponding
materials. With a few minor exceptions, the ranges alsooverlap for the water diffusion leakage currents. The cur-rent changes for the as received E-glassrepoxy and E-glassrmodified polyester composites range below the lightand medium sandblasted specimens of the same materi-als. The data for the high seed ECR-glass materials rangeabove the light and medium sandblasted specimens.
Table 5. Test Matrix of Light Sandblasted Specimens.
Matrix Materials Initial Current Current�Ž . Ž . Ž .Fiber Type �A Change ��A Mass Gain %
E-Glass Epoxy 12.5�12.7 0.8�1.4 0.233�0.261Mod. Polyester 12.4�12.6 10.6�26.6 0.637�0.680Vinyl Ester 12.6�12.8 0.6�0.9 0.184�0.201
Low Seed Epoxy 12.6�12.8 0.9�1.3 0.206�0.213ECR-Glass Vinyl Ester 12.7�12.9 3.3�13.6 0.193�0.215High Seed Mod. Polyester 12.5�13.4 174�287 0.472�0.512ECR-Glass Vinyl Ester 12.6�14.8 111�135 0.184�0.199
�Current change due to the water diffusion electrical test.
Table 6. Test Matrix of Medium Sandblasted Specimens.
Matrix Initial Current Current�Ž . Ž .Fiber Type Material �A Change ��A Mass Gain %
E-Glass Epoxy 12.7 0.7�0.8 0.237�0.240Mod. Polyester 12.3�12.8 17.8�204 0.627�0.744Vinyl Ester 12.6�12.7 0.5�1.1 0.187�0.193
Low Seed Epoxy 12.7�12.8 0.9�1.0 0.209�0.213ECR-Glass Vinyl Ester 12.7�12.8 3.3�3.8 0.159�0.197High Seed Mod. Polyester 12.5�12.9 209�337 0.466�0.501ECR-Glass Vinyl Ester 12.8�13.1 95�134 0.183�0.195
�Current change due to the water diffusion electrical test.
1070-9878rrrrr04rrrrr$20.00 � 2004 IEEE 515

Armentrout et al.: Water Diffusion into and Electrical Testing of Composite Insulator GRP Rods516
Figure 12. The change in leakage current for the medium sand-blasted rods specimens plotted against the percent mass change.
Table 7 lists the average change in leakage currents forthe as received, light and medium sandblasted specimens.The leakage currents were similar for most specimens withincreased surface damage due to sandblasting. The highseed ECR-glass materials exhibited a decrease in leakagecurrent with sandblasting whereas the E-glass and low seedECR-glass epoxy based composites had an increase inleakage current with sandblasting. For the as received lowseed ECR-glassrvinyl ester composite, the leakage cur-rents were in between the currents for the light andmedium sandblasted specimens.
In Table 8 the average percent mass gains are listed forthe as received, light, and medium sandblasted specimens.The average mass gains are relatively constant for eachmaterial tested under the three different conditions. Theobservations made during the tests on the sandblasted
specimens did not change the initial conclusions that thepolymer type is the dominant factor in the amount of wa-ter absorbed by the composites. The only significantchange in mass gain with surface conditioning is the in-crease in mass gain of the medium sandblasted E-glassrmodified polyester material. This rather unusual be-havior, in comparison with the other composite systems isdiscussed in the next Section.
4.3 SANDBLASTED E-GLASS MODIFIEDPOLYESTER
Two different E-glassrmodified polyester rods weresandblasted with the light and medium conditions. Notice-able differences were observed in the leakage currents be-tween the rods. The average of the change in leakage cur-rent for the E-glassrmodified polyester with light sand-blasting for one rod was 12.5 �A and for the other rodwas 23.9 �A. An even greater change in leakage currentwas observed for the E-glassrmodified polyester rod withmedium sandblasting. In this case, one rod had an aver-age change in leakage current of 34.2 �A whereas for theother rod the average change in current was 135 �A. Fig-ure 13 shows the moisture and leakage current data fromthe two E-glassrmodified polyester rods with mediumsandblasting. From Figure 13 one can see that the higherleakage current specimens also had higher moisture gainfor this particular material.
To explain the data shown in Figure 13, the two sand-blasted E-glassrmodified polyester rods were sectionedperpendicular to the fibers with a diamond-coated circu-lar saw blade into three pieces from each specimen. Eachpiece, approximately 10 mm �0.5 mm in length, was sub-
Table 7. Comparison of Average Leakage Current Change Caused by Water Diffusion.Ž .Average Leakage Current Change �A
Matrix Material Light MediumFiber Type As Received Sandblasting Sandblasting
E-Glass Epoxy 0.5 1.0 0.8Mod. Polyester 9.4 18.2 79.9Vinyl Ester 0.7 0.8 0.8
Low Seed Epoxy 0.8 1.0 1.0ECR-Glass Vinyl Ester 4.1 6.5 3.6High Seed Mod. Polyester 352 250 247ECR-Glass Vinyl Ester 452 120 117
Table 8. Comparison of the Average Mass Gain During Boiling.Ž .Average Mass Gain %
Matrix Light MediumFiber Type Material As Received Sandblasting Sandlasting
E-Glass Epoxy 0.235 0.248 0.239Mod. Polyester 0.657 0.661 0.705Vinyl Ester 0.195 0.193 0.189
Low Seed Epoxy 0.213 0.208 0.211ECR-Glass Vinyl Ester 0.196 0.205 0.186High Seed Mod. Polyester 0.471 0.491 0.484ECR-Glass Vinyl Ester 0.187 0.192 0.187
1070-9878rrrrr04rrrrr$20.00 � 2004 IEEE516

IEEE Transactions on Dielectrics and Electrical Insulation Vol. 11, No. 3; June 2004 517
Figure 13. The change in leakage current for the medium sand-blasted rods of E-glass fibers in modified polyester against the changein mass for two different sandblasted rods.
Žsequently subjected to the dye penetration test ANSIw x w x.C29.11 Section 7.4.1 1 and IEC 61109 Section 5.4.1 17 .
The dye penetration test is useful in determining if largevoids are present in composite specimens. However, ifvoids do not run the length of a specimen, they will not bedetected by the dye penetration test. None of the sec-tioned specimens failed the dye penetration test.
The fact that the specimens passed the dye penetrationtest should not mean that either cracks or voids were not
w xpresent in the specimens. In a previous paper 12 the au-thors determined the micro-hardness of the three differ-ent polymers used in the composite investigated in thisresearch. The modified polyester was found to have of thehighest micro-hardness among the three different poly-mers meaning that it also had the lowest fracture tough-ness. As a result, the polyester based composites are moresusceptible to internal cracking than the epoxy or vinylester based systems. Therefore, internal damage in themodified polyester based composite caused by sandblast-ing should be expected. Since the specimens passed thedye penetration test, the damage must not have been se-vere enough to fail the test, however large enough to in-crease moisture absorption by the composite.
4.4 MANUFACTURER SANDBLASTED,STRESSED, AND ACID EXPOSED
SPECIMENSSince some insulators used in service are based on
sandblasted rods, as explained in Section 2.1, the effect ofthis rod surface condition was examined with the waterdiffusion electrical test. In addition, during the brittlefracture process nitric acid solutions are formed in servicew x5 . At some point the acid can reach the rod withoutcausing brittle fracture. However, the surface of some rodsmight be affected by leaching which in turn can damagethe rod surface. This might affect the electrical propertiesof the rods. This mechanism is certainly very likely in thecase of ECR-fiber composites. It might not be applicableto E-glass fiber systems since they will fail by brittle frac-
ture when exposed to mineral acids for extended periodsof time. During insulator manufacturing excessive proofmechanical loads can be applied with possible negative
w xeffects on the in-service performance of the insulators 3 .By causing internal cracking, excessive mechanical loadscould also increase leakage currents. These were the rea-sons why some composites previously exposed to excessivemechanical loads with and without acid exposure weresubjected to the water diffusion electrical tests in this re-search.
In this series of tests, six composite systems based onŽ .ECR-glass low and high seed fibers with modified
polyester, epoxy and vinyl ester were tested for their elec-trical properties. These composites have been previously
w xsubjected to the brittle fracture tests 7, 9, 13, 16 andstressed to 45% of their mechanical failure loads for 96hours. Parts of the rods, in the gage sections, were also
Ž .exposed to strong nitric acid 1 N . An insulator manufac-turer sandblasted the rods before testing. Since the E-glassrpolymer rods based on the same three polymers
wfailed the test by multiple fractures and splitting 7, 9, 13,x16 , samples could not be taken from those rods for the
water diffusion electrical tests performed in this study.Since the moisture history of these rods was more uncer-tain and some of the rods were exposed to nitric acid, itwas decided to vacuum dry the specimens at 110�C for 17hours after cleaning and before measuring the initial spec-imen mass. Thus, any residual moisture from the brittlefracture tests was removed before the water diffusionelectrical tests. Some specimens from the low seed ECR-glassrepoxy rods were vacuum dried at elevated tempera-ture whereas some were boiled without drying, to be ableto compare the leakage current and moisture absorptionresults with the previous series of tests.
The moisture gain and leakage current results for theŽsix ECR-glass fiber composite systems previously stressed
.but not exposed to nitric acid are presented in Table 9.For comparison, specimens of low seed ECR-glassrepoxyboth with and without vacuum drying at 110�C for 17 hbefore boiling have been included. In addition, data arelisted in Table 10 for specimens with a manufacturersandblasting, stressed to 45% of failure load, and exposedto 1 N nitric acid for 96 h while under load. The datapresented in Table 10 were obtained on specimens takenfrom the gage sections of the rods subjected to the brittlefracture test. It can be seen that Tables 9 and 10 containthe data for low seed ECR-glassrmodified polyester andhigh seed ECR-glassrepoxy that were not available for theresearch presented in Sections 4.1 and 4.2 of this work.
Ž .The moisture gains mass gains listed in Tables 9 and10 are all higher than the moisture gains listed in Tables4�6 for the same composites, with the exception of thespecimens that were not vacuum dried. It should bepointed out that the data in Tables 4�6 came also fromthe specimens that were not vacuum dried. Vacuum dry-
1070-9878rrrrr04rrrrr$20.00 � 2004 IEEE 517
Armentrout et al.: Water Diffusion into and Electrical Testing of Composite Insulator GRP Rods518
Table 9. Test Matrix of Manufacturers Sandblasting and Stressed Specimens.�Initial Current Current Change
Ž . Ž . Ž .Fiber Type Matrix Material �A ��A Mass Gain %��Low Seed Epoxy 12.9�13.0 1.3�2.1 0.216�0.226
ECR-Glass Epoxy 13.0 1.3�2.0 0.234�0.247Mod. Polyester 12.9 9.0�33.6 0.616�0.660Vinyl Ester 13.1 2.7�3.7 0.228�0.233
High Seed Epoxy 13.0�13.1 126�758 0.171�0.178ECR-Glass Mod. Polyester 13.0�13.1 250�510 0.557�0.597
Vinyl Ester 12.9�13.2 179�208 0.229�0.230
�Current change due to the water diffusion electrical test.��Material was not vacuum dried at 110�C for 17 hours prior to test.
Table 10. Test Matrix of Manufacturers Sandblasting, Stressed Specimens, and Acid Exposed Specimens.
Matrix Initial Current Current�Ž . Ž . Ž .Fiber Type Material �A Change ��A Mass Gain %
��Low Seed Epoxy 12.9�13.0 1.3�1.6 0.217�0.230ECR-Glass Mod. Polyester 12.5�13.0 19.8�33.4 0.644�0.664
Vinyl Ester 13.1�13.5 4.1�5.4 0.226�0.230High Seed Epoxy 13.1�13.4 107�158 0.171�0.180ECR-Glass Mod. Polyester 12.9�13.1 317�375 0.567�0.593
Vinyl Ester 13.2 204�242 0.223�0.241
�Current change due to the water diffusion electrical test.��Material was not vacuum dried at 110�C or 17 h prior to test.
ing at 110�C for 17 h before the water diffusion electricaltest removed most of moisture residues from the speci-mens so that they could absorb more moisture during boil-ing. The ranges of leakage currents overlap in Tables 4�6and those in Tables 9 and 10. The leakage currents for thehigh seed ECR-glass materials are much higher and thereis more scatter in the data. Low seed ECR-glassrepoxyhas a higher leakage current than the values listed in Ta-bles 4�6; however, the difference is still smaller than vari-
Ž .ability of the current standard 1.0 �A .ŽFour different materials low seed ECR glassrepoxy, low
seed ECR glassrvinyl ester, high seed ECR-glassrmod-.ified polyester and high seed ECR-glassrvinyl ester were
available for comparison with five different types of treat-ments. The effect of the following five treatments on theelectrical properties of the composites could be examined:as received, low and medium sandblasting, mechanical
Ž .pre-stressing at 45% failure load for 96 h with sandblast-ing, and a combination of mechanical pre-stressing, sand-
Ž .blasting and acid exposure 1 N nitric acid for 96 h . Table11 compares the average mass gain for the five differentconditions and four different materials. In addition to thefive different treatment conditions, the effect of specimen
drying before boiling is also illustrated in Table 11. Thecorresponding data for the leakage currents for the abovefour composite systems and five treatment conditions arelisted in Table 12.
In general, the mass gains are not sensitive to the con-Ž .ditioning see Table 11 but they are affected by specimen
drying before boiling. For comparison, two values are givenin Table 11 for the low seed ECR-glassrepoxy compositewith and without initial drying. Drying increased the aver-age moisture gain by 0.018%, which is slightly larger thanthe effect of specimen variation.
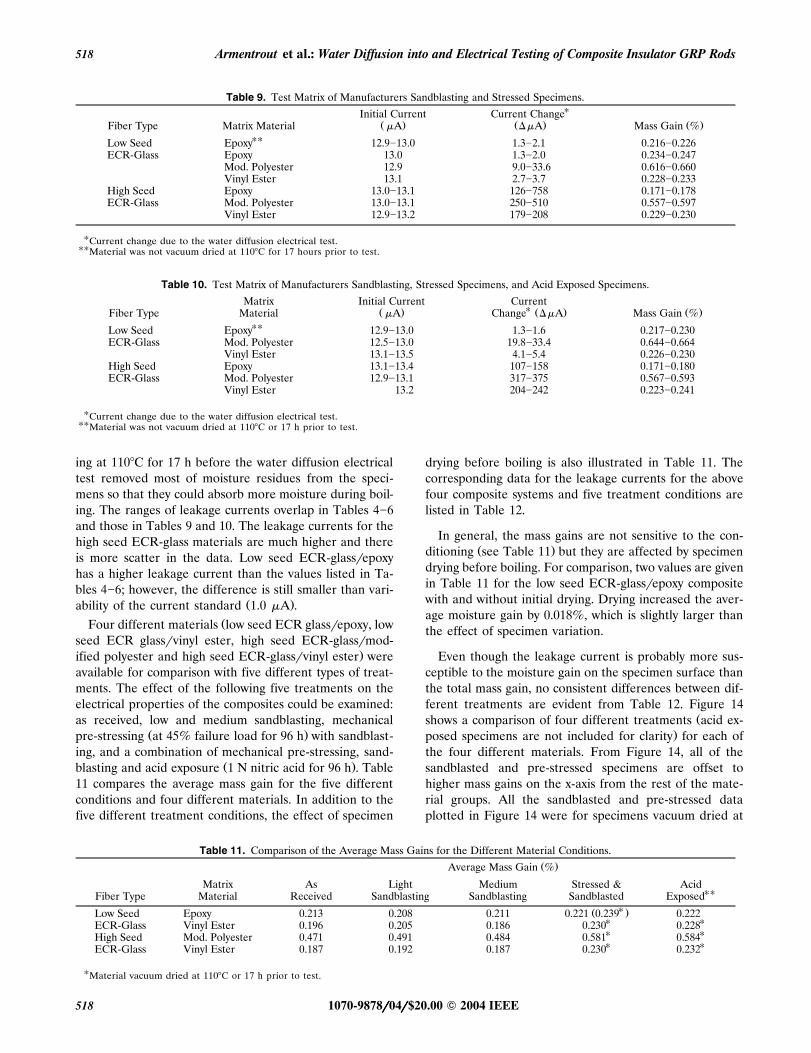
Even though the leakage current is probably more sus-ceptible to the moisture gain on the specimen surface thanthe total mass gain, no consistent differences between dif-ferent treatments are evident from Table 12. Figure 14
Žshows a comparison of four different treatments acid ex-.posed specimens are not included for clarity for each of
the four different materials. From Figure 14, all of thesandblasted and pre-stressed specimens are offset tohigher mass gains on the x-axis from the rest of the mate-rial groups. All the sandblasted and pre-stressed dataplotted in Figure 14 were for specimens vacuum dried at
Table 11. Comparison of the Average Mass Gains for the Different Material Conditions.Ž .Average Mass Gain %
Matrix As Light Medium Stressed & Acid��Fiber Type Material Received Sandblasting Sandblasting Sandblasted Exposed
�Ž .Low Seed Epoxy 0.213 0.208 0.211 0.221 0.239 0.222� �ECR-Glass Vinyl Ester 0.196 0.205 0.186 0.230 0.228� �High Seed Mod. Polyester 0.471 0.491 0.484 0.581 0.584� �ECR-Glass Vinyl Ester 0.187 0.192 0.187 0.230 0.232
�Material vacuum dried at 110�C or 17 h prior to test.
1070-9878rrrrr04rrrrr$20.00 � 2004 IEEE518
IEEE Transactions on Dielectrics and Electrical Insulation Vol. 11, No. 3; June 2004 519
Figure 14. The change in leakage current for the four different sur-face conditions tested and four different materials plotted againstthe percent change in mass.
110�C or 17 h, thus explaining the higher mass gains ofthese specimens. The change in leakage currents are aboutthe same for all specimens of the same material. For theleakage currents, the only difference that stands out is asreceived high seed ECR-glassrvinyl ester. This compositehad higher currents than the other three conditions. Sincethis is not consistent for all as received specimens, thehigher possible scatter at high leakage current probablycaused this difference.
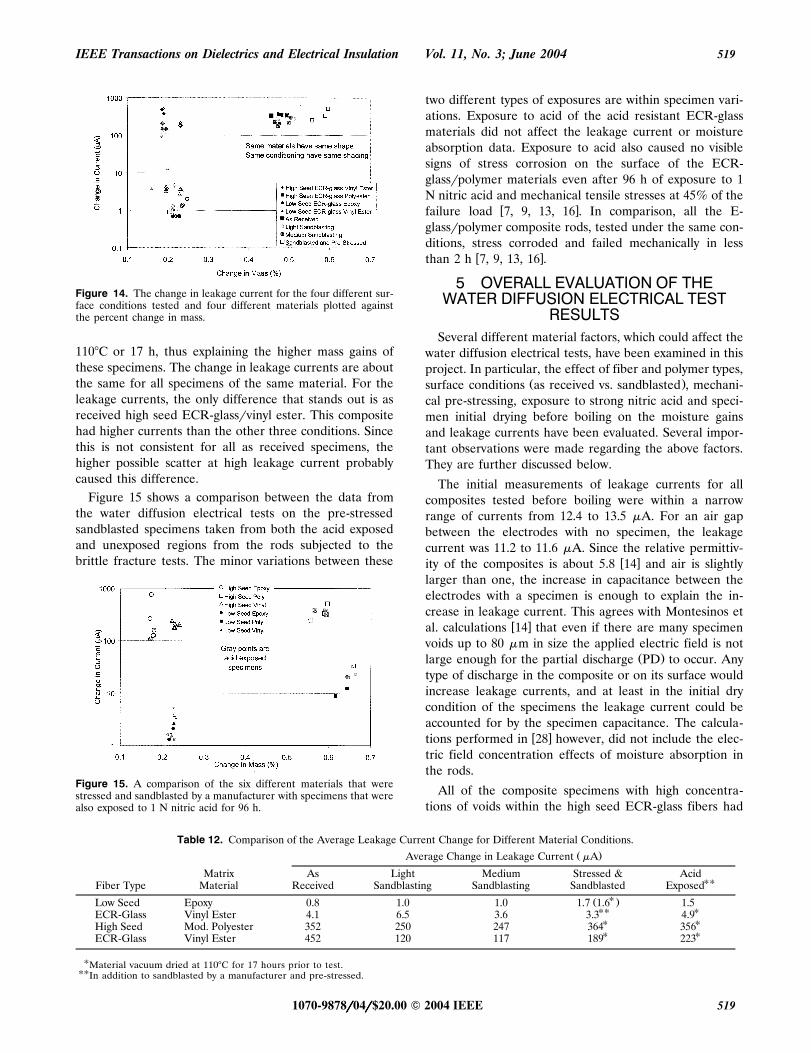
Figure 15 shows a comparison between the data fromthe water diffusion electrical tests on the pre-stressedsandblasted specimens taken from both the acid exposedand unexposed regions from the rods subjected to thebrittle fracture tests. The minor variations between these
Figure 15. A comparison of the six different materials that werestressed and sandblasted by a manufacturer with specimens that werealso exposed to 1 N nitric acid for 96 h.
two different types of exposures are within specimen vari-ations. Exposure to acid of the acid resistant ECR-glassmaterials did not affect the leakage current or moistureabsorption data. Exposure to acid also caused no visiblesigns of stress corrosion on the surface of the ECR-glassrpolymer materials even after 96 h of exposure to 1N nitric acid and mechanical tensile stresses at 45% of the
w xfailure load 7, 9, 13, 16 . In comparison, all the E-glassrpolymer composite rods, tested under the same con-ditions, stress corroded and failed mechanically in less
w xthan 2 h 7, 9, 13, 16 .
5 OVERALL EVALUATION OF THEWATER DIFFUSION ELECTRICAL TEST
RESULTSSeveral different material factors, which could affect the
water diffusion electrical tests, have been examined in thisproject. In particular, the effect of fiber and polymer types,
Ž .surface conditions as received vs. sandblasted , mechani-cal pre-stressing, exposure to strong nitric acid and speci-men initial drying before boiling on the moisture gainsand leakage currents have been evaluated. Several impor-tant observations were made regarding the above factors.They are further discussed below.
The initial measurements of leakage currents for allcomposites tested before boiling were within a narrowrange of currents from 12.4 to 13.5 �A. For an air gapbetween the electrodes with no specimen, the leakagecurrent was 11.2 to 11.6 �A. Since the relative permittiv-
w xity of the composites is about 5.8 14 and air is slightlylarger than one, the increase in capacitance between theelectrodes with a specimen is enough to explain the in-crease in leakage current. This agrees with Montesinos et
w xal. calculations 14 that even if there are many specimenvoids up to 80 �m in size the applied electric field is not
Ž .large enough for the partial discharge PD to occur. Anytype of discharge in the composite or on its surface wouldincrease leakage currents, and at least in the initial drycondition of the specimens the leakage current could beaccounted for by the specimen capacitance. The calcula-
w xtions performed in 28 however, did not include the elec-tric field concentration effects of moisture absorption inthe rods.
All of the composite specimens with high concentra-tions of voids within the high seed ECR-glass fibers had
Table 12. Comparison of the Average Leakage Current Change for Different Material Conditions.Ž .Average Change in Leakage Current �A
Matrix As Light Medium Stressed & Acid��Fiber Type Material Received Sandblasting Sandblasting Sandblasted Exposed
�Ž .Low Seed Epoxy 0.8 1.0 1.0 1.7 1.6 1.5�� �ECR-Glass Vinyl Ester 4.1 6.5 3.6 3.3 4.9
� �High Seed Mod. Polyester 352 250 247 364 356� �ECR-Glass Vinyl Ester 452 120 117 189 223
�Material vacuum dried at 110�C for 17 hours prior to test.��In addition to sandblasted by a manufacturer and pre-stressed.
1070-9878rrrrr04rrrrr$20.00 � 2004 IEEE 519

Armentrout et al.: Water Diffusion into and Electrical Testing of Composite Insulator GRP Rods520
Ž .high leakage currents �95 �A . Since the average sizeof the high seed ECR-glass fibers was approximately 20�m, the approximate maximum size of a fiber void couldnot be larger than 20 �m. For this range of void sizes, theinception electric field strength for partial discharge is
w xeven higher than for larger voids 14 . Yet the high seedcomposites were the materials with high leakage currentswhen subjected to the water diffusion electrical test. Dis-charge was observed in these specimens combined withthe generation of ozone. Ozone has also been associatedwith the formation of nitric acid in composite insulatorsw x w x5 . Montesinos et al. 14 incorrectly concluded that PD inthe rods is not responsible for brittle fracture failure be-cause they failed to take into account moisture absorptionby the rods.
For all the rods, the increase in capacitance due to wa-Ž .ter absorption ignoring the salt was calculated to cause a
maximum leakage current increase of 0.3 �A for 16 mmrods. This is approximately equal to the uncertainty of thelow leakage current measurements. The observed increaseof leakage currents due to the water diffusion electricaltest ranged from 0.4 to 758 �A. The additional increasein the leakage currents above 0.3 �A that was observed,could be due to increased specimen conductivity, partialdischarge, glow discharge, corona, plasma formation andozone generation.
The presence of moisture absorbed into a compositedramatically changes the electrical field within the mate-rial. Any absorption of water by a composite insulator willincrease its dielectric constant. The gradient of moistureconcentration within the material effectively causes a gra-dient of dielectric constants highest along the outer edgesof the material and decreasing toward the center of theinsulator. According to McAllister and Crichton whenthere are materials with two different dielectric constants
w xin an electric field 23 , the induced charge is increased onvoids located in the medium with a lower dielectric con-stant. This effect is enhanced as the extent of the higherpermittivity material increases.
Another possible effect is that salt water forms micro-conductive paths on and near the surface of the compos-ite. The conductive paths concentrate the electric field and
if a void is nearby discharge can occur. If the specimen isallowed to dry, the conductive paths within the compositeare removed and the leakage current returns to the initiallevel.
Internal damage in the material can also cause voids.For the E-glass modified polyester system, a differencewas noticed between two different rods with the mediumsandblasted surface and to a lesser extent in the case ofthe light sandblasted surface. For this particular material,increased mass gains weakly correlated with increasedleakage currents. Since the rods were brittle they could bemore easily damaged during the sandblasting process, in-troducing voids into the material.
Surface conditioning for the most part had a negligibleeffect on either mass gain or leakage current. Since waterdiffusion starts from the surface and progresses into thespecimen, one could imagine that the condition of thesurface would have some effect on the diffusion processand consequently the leakage current. The major effect ofsandblasting is an increase in the total surface area of thespecimen and its surface roughness. The moisture absorp-tion process however is not limited by surface roughnessbut by the diffusion of the bulk. The more influential fac-tor on mass gain, as seen in Table 11, was the effect ofvacuum drying the specimens at 110 �C for 17 h beforetesting. Only for E-glassrmodified polyester with mediumsandblasting did the specimens have a significantly wide
Žrange of elevated leakage currents and mass gain see Fig-.ure 13 . Because drying removed more of the initial mois-
ture of the specimens, more moisture could be added dur-ing boiling, but the final moisture concentration in thematerial was about the same. Drying did not have an ef-fect on leakage currents since they are determined by thefinal moisture concentration in the material. However, thetype of material was the most influential factor on boththe mass gain and the leakage current.
Ž .Since the five different material conditions Table 13had minimal influence on the leakage currents and massgains, results from all five different treatments have beenaveraged together for the nine different materials testedin two stages. Since the E-glass modified polyester withmedium sandblasting had such a wide range of currents
Table 13. Comparison of the Average Results for the Water Diffusion Electrical Test.
Current Mass Gain No. Mass Gain� Ž . Ž . Ž .Fiber Type Matrix Material Change ��A Drying % Dried %
��E-Glass Epoxy 0.8 0.241��Mod. Polyester 14.4 0.659��Vinyl Ester 0.7 0.192
Low Seed Epoxy 1.2 0.214 0.234��ECR-Glass Mod. Polyester 21.7 0.647
Vinyl Ester 4.6 0.196 0.229High Seed Epoxy 256 �� 0.176ECR-Glass Mod. Polyester 313 0.483 0.560
Vinyl Ester 215 0.189 0.231
�Current change due to the water diffusion electrical test.��No Data available.
1070-9878rrrrr04rrrrr$20.00 � 2004 IEEE520

IEEE Transactions on Dielectrics and Electrical Insulation Vol. 11, No. 3; June 2004 521
and mass gain, data from this material type and conditionwere not average with the rest of the data from this mate-rial in Table 13. Several important observations can bemade based on the data presented in Table 13. First, themodified polyester based composites have the highestleakage currents and mass gains for each of the three dif-ferent fiber types. Second, the high seed ECR-glass fibercomposites have the highest leakage currents but for mostmaterials they have a lower mass gain than the other com-posites based on the E-glass and low seed ECR-glassfibers. Third, the composites based on E-glass fibers havethe lowest leakage currents, slightly lower than the cur-rents for the materials based on low-seed ECR-glass fibers.Finally, the epoxy and vinyl ester based systems have massgains and leakage currents very close to each other for theE-glass and low seed ECR-glass fibers.
A reason for lower mass gains in materials with the highseed ECR-glass fibers compared to the other two fibers is
Ž .most likely the larger fiber size see Figure 4 . The largefibers could act as a greater barrier to the absorption ofmoisture, by increasing path length around the fibers thediffusion rate into the material is slowed. As long as thevolume fraction of fibers was similar for composites withdifferent size fibers, which is the case for the composites
w xinvestigated in this research 22 , the maximum mass gainfor these composites would be very similar for the materi-als with the same polymer.
6 CONCLUSIONHE water diffusion electrical tests performedTin this investigation yielded useful information about
relationships between absorbed moisture and leakage cur-rents in unidirectional glass fiberrpolymer matrix compos-ite materials used in high voltage insulators. One impor-tant observation made in this research was that moistureabsorption does not correlate with higher leakage cur-rents for different materials. In general, different compos-ite systems with very similar amounts of absorbed mois-ture can exhibit significant differences in leakage cur-rents. Therefore, in some glassrpolymer composites,higher leakage currents could not be explained in terms ofhigher moisture absorption. Only one composite system,medium sandblasted E-glassrmodified polyester, whichseemed to have differing amounts of damage, had in-creased moisture absorption that correlated with higherleakage currents. It was also shown in this work that the
Žtype of specimen conditioning sandblasting, pre-stressing,.and acid exposure seemed to have a negligible effect on
the amount of moisture absorbed and the leakage current.
ACKNOWLEDGMENTSThis research has been supported by the Electric Power
Research Institute under contract �EP-P2971rC1399. Wewould also like to thank Dr. T.S. McQuarrie of Glas-
forms, Inc for providing the GRP rods used in this investi-gation. Thanks also to Dr. M. Balasingam of the Univer-sity of Denver, Chemistry Department who preformed theGC-MS and ICP-MS analysis.
REFERENCESw x1 American National Standards Institute, ‘‘American National
Standard for Composite Suspension Insulators of OverheadTransmission Lines - Tests’’, ANSI C29.11-1989.
w x2 M. Kumosa and Q. Qiu, ‘‘Failure Analysis of Composite Insula-Žtors Failure Investigation of 500 kV Non-ceramic Insulators for
.Pacific Gas & Electric Company ’’, Final Report to the PacificGas and Electric Company, Department of Engineering, Uni-versity of Denver, 1996.
w x3 M. Kumosa, H. S. Narayan, Q. Qiu and A. Bansal, ‘‘BrittleFracture of Non-Ceramic Suspension Insulators with EpoxyCone End-Fittings’’, Composites Sci. Techn., Vol. 57, pp.739�751, 1997.
w x4 Interview with Maciej Kumosa, ‘‘Research of Brittle Fractures inComposite Insulators,’’ Insulator News & Market Report,JulyrAugust, pp. 46�51, 1997.
w x5 A. R. Chughtai, D. M. Smith and M. Kumosa, ‘‘Chemical Anal-ysis of a Field-Failed Composite Suspension Insulator’’, Compos-ite Sci. Techn., Vol. 58, pp. 1641�1647, 1998.
w x6 D. Armentrout, T. Ely, S. Carpenter and M. Kumosa, ‘‘An In-vestigation of the Brittle Fracture in Composite Materials usedfor High Voltage Insulators’’, J. Acoustic Emission, Vol. 16, No.1�4, 1998.
w x7 T. S. McQuarrie, ‘‘Improved Dielectric & Brittle Fracture Re-sistant Core Rods For Non-Ceramic Insulators’’, 2000 WorldCongress on Insulator Technologies for the Year 2000 & Be-yond, Barcelona, Spain, November 14�17, 1999.
w x8 M. Kuhl, ‘‘FRP Rods for Brittle Fracture Resistant CompositeInsulators’’, IEEE Trans. Dielectr. Electr. Insul., Vol. 8, pp182�190, 2001.
w x9 T. S. McQuarrie, D. Armentrout and M. Kumosa, ‘‘ImprovedDielectric & Brittle Fracture Resistant Core Rods For Non-Ceramic Insulators, 2001 World Insulator Congress & Exhibi-tion, Shanghai, China, November 18�21, 2001.
w x10 M. Kumosa, D. Armentrout, T. Ely, et al., Fracture Analysis ofComposite Insulators, EPRI, Palo Alto, CA: 2001. 1006293.
w x11 J. T. Burnham, T. Baker, A. Bernstorf, C. de Tourreil, J.-M.George, R. Gorur, R. Hartings, B. Hill, A. Jagtiani, T. S. Mc-Quarrie, D. Mitchell, D. Ruff, H. Schneider, D. Shaffner, J. Yuand J. Varner, ‘‘IEEE Task Force Report: Brittle Fracture inNon-Ceramic Insulators,’’ IEEE Trans. Power Del., Vol. 17, pp.848�856, 2002.
w x12 L. Kumosa, D. Armentrout and M. Kumosa, ‘‘The Effect ofSandblasting on the Initiation of Stress Corrosion Cracking inUnidirectional E-glassrPolymer Composites Used in High Volt-
Ž .age Composite Non-Ceramic Insulators’’, Composites Sci.Techn., Vol. 62, pp. 1999�2015, 2002.
w x13 M. Kumosa, D. Armentrout, L. Kumosa, et al., Failure Analysisof Composite High Voltage Insulators, EPRI, Palo Alto, CA:2002. 1007464.
w x14 J. Montesinos, R.S. Gorur, B. Mobasher, and D. Kingsburry,‘‘Brittle Fracture in Nonceramic Insulators: Electrical Aspects
Ž .of Microscopic Flaws in Glass Reinforced Plastic GRP Rods’’,IEEE Trans. Dielectr. Electr. Insul., Vol. 9, pp. 244�252, 2002.
w x15 L. Kumosa, M. Kumosa and D. Armentrout, ‘‘Resistance toStress Corrosion Cracking of Unidirectional GlassrPolymerComposites Based on Low and High Seed ECR-glass Fibers forHigh Voltage Composite Insulator Applications’’, CompositesPart A, Vol. 34, pp. 1�15, 2003.
w x16 D. Armentrout, M. Kumosa and T. S. McQuarrie, ‘‘Boron FreeFibers for Prevention of Acid Induced Brittle Fracture of Com-posite Insulator GRP Rods’’, IEEE Trans. Power Del., Vol. 18,pp. 684�693, 2003.
1070-9878rrrrr04rrrrr$20.00 � 2004 IEEE 521

Armentrout et al.: Water Diffusion into and Electrical Testing of Composite Insulator GRP Rods522
w x17 International Electrotechnical Commission, ‘‘Composite Insula-tors for A.C. Overhead Lines with a Nominal Voltage Greaterthan 1000V - Definitions, Test Methods and Acceptance Crite-ria,’’ IEC 61109, 1992.
w x18 American Society of Testing and Materials, ‘‘Standard TestMethod for Moisture Absorption Properties and EquilibriumConditioning of Polymer Matrix Composite Materials,’’D5229rD5229M-92, 1998.
w x19 J. F. Sproull, ‘‘Fiber Glass Composition,’’ United States Patent�4,542,106, Sept. 17, 1985.
w x20 H. R. Baker and R. N. Bolster, ‘‘Surface Electrical Leakage onInsulators and Coatings in the Presence of Moisture Condensa-tion’’, IEEE Trans. Electr. Insul., Vol. 11, pp. 76-80, 1976.
w x21 H. Zhang and R. Hackam, ‘‘Electrical Surface Resistance, Hy-drophobicity and Diffusion Phenomena in PVC’’, IEEE Trans.Dielectr. Electr. Insul., Vol. 6, pp. 73�83, 1999.
w x22 L. Kumosa, B. Benedikt, D. Armentrout and M. Kumosa,‘‘Moisture Absorption Properties of Unidirectional GlassrPoly-mer Composites Used in Non-Ceramic Insulators’’, CompositesPart A, in press.
w x23 I.W. McAllister and G.C. Crichton, ‘‘Influence of Bulk Dielec-tric Polarization upon Partial Discharge Transients’’, IEEETrans. Dielectr. Electr. Insul.,Vol. 7, pp. 124�132, 2000.
1070-9878rrrrr04rrrrr$20.00 � 2004 IEEE522