
Water Demand In Dhaka City Dr A.K. ENAMUL HAQUE Co-authors: MUNTASIR CHAUDHURY PARVEZ KARIM ABBASI.
46
Water Demand In Water Demand In Dhaka City Dhaka City Dr A.K. ENAMUL HAQUE Dr A.K. ENAMUL HAQUE Co-authors: Co-authors: MUNTASIR CHAUDHURY MUNTASIR CHAUDHURY PARVEZ KARIM ABBASI PARVEZ KARIM ABBASI
-
Upload
sharlene-hubbard -
Category
Documents
-
view
215 -
download
0
Transcript of Water Demand In Dhaka City Dr A.K. ENAMUL HAQUE Co-authors: MUNTASIR CHAUDHURY PARVEZ KARIM ABBASI.
Water Demand In Water Demand In Dhaka CityDhaka City
Dr A.K. ENAMUL HAQUEDr A.K. ENAMUL HAQUE
Co-authors:Co-authors:
MUNTASIR CHAUDHURYMUNTASIR CHAUDHURY
PARVEZ KARIM ABBASIPARVEZ KARIM ABBASI

ObjectivesObjectivesAssessing the demand for water Assessing the demand for water for domestic, commercial and for domestic, commercial and industrial users for the next 25 industrial users for the next 25 years in Dhaka.years in Dhaka.

Factors affecting demand for Factors affecting demand for waterwater
Demand for water, by definition, includes the amount of water demanded by a unit of consumption for given socio-economic conditions, pricing strategy, basic human needs and for a given level of quality of life Therefore, to understand demand
Household, commercial and industrialFor household demand analysisStudy conducted
Detailed Household Survey

OUR PRESENTATIONSOUR PRESENTATIONS
HOUSEHOLD SURVEYDESIGN PHASE
IMPLEMENTATION
PROFILE OF HOUSEHOLD IN DHAKA
ESTIMATION OF DEMAND FOR WATER

HOUSEHOLD SURVEY
SURVEY DATA COLLECTED FROM ALL 7 DWASA ZonesPOPULATION – CHARATERISTICS
BASED ON GIS MAPPING OF 30 WARDS (CENSUS) OF HOUSE TYPES TO REPRESENT ALL INHABITANTS OF DHAKA CITY CONNECTED TO DWASA
5 TYPES OF HOUSES ARE DEFINED
1. Katcha - wall made of bamboo etc2. Semi-Pucca - brick wall and tin roof3. One-storey- concrete roof4. Mullti-storey-2 to 6 floors5. Hi-rise - 7 or more

Sampling ProcessSampling Process
BASED ON GIS MAP OF HOUSES IN 30 WARDS.
GIS Data from various Zones
Sample is proportional to distribution of house by type in each zone

type of house hi rise multi
storied one
storied semi pacca katcha Total
Zone 1 3 36 12 27 11 89 Zone 2 4 11 6 10 3 34 Zone 3 12 66 17 33 8 136 Zone 4 2 54 10 39 16 121 Zone 5 4 66 19 39 13 141 Zone 6 9 32 7 23 6 77 Zone 7 3 12 7 14 5 41 All Zones 37 277 78 185 62 639
The SAMPLEThe SAMPLE

THE INSTRUMENTSTHE INSTRUMENTS
QUESTIONNIARES QUESTIONNIARES
Several Modules – Major ones are:Several Modules – Major ones are:HOUSE CHARACTERISTICSHOUSE CHARACTERISTICS
WATER USE AND USE OF GADGETSWATER USE AND USE OF GADGETS
PROBLEMS IN WATER DEMANDPROBLEMS IN WATER DEMAND
LIFE STYLE RELATED QUESTIONSLIFE STYLE RELATED QUESTIONS
INCOME, EDUCATION, ETC. PROFILE INCOME, EDUCATION, ETC. PROFILE OF MEMBERS OF THE HOUSEHOLDOF MEMBERS OF THE HOUSEHOLD

Survey implementation rulesSurvey implementation rules13 members in the survey team13 members in the survey team
2 – one male and one female members in 2 – one male and one female members in each team. each team.
Each zone was split into blocks using major Each zone was split into blocks using major roads. Each survey team was given a roads. Each survey team was given a unique starting point for each day of survey. unique starting point for each day of survey. [systematic stratified random sampling][systematic stratified random sampling]
A master table using house type was used A master table using house type was used to select a sample using pre-defined to select a sample using pre-defined structure of sample selection.structure of sample selection.

Basic survey rulesBasic survey rules
Each sample must meet the criteria of the Each sample must meet the criteria of the sample in terms house type. sample in terms house type. No U Turn at any point or going backNo U Turn at any point or going backTwo consecutive left or right turns on a Two consecutive left or right turns on a road are not allowed road are not allowed In case of a dead-end road, the team can In case of a dead-end road, the team can fall back to the point from where they can fall back to the point from where they can take a turn. take a turn.

Table 2.2: Age of the Household Table 2.2: Age of the Household
Type of house Mean age in years
Std. Deviation
Hi rise 8.11 11.81 Multi storey 15.10 13.12 One storey 25.18 39.36 Semi pucca 21.74 20.88 Katcha 16.42 14.35 Total 17.92 20.79

Characteristics in our houses
Average Number of Percent of Houses with
Type of House
Fam
ily
Livin
g in
the H
ouse
Hous
ehold
siz
e
Bath
-ro
oms
Gard
ens
Engli
sh
Com
mod
e
Wate
r He
ating
Fa
ciliti
es
Gara
ges
Car
wash
ing
prov
ision
Hi rise 27.54 4.71 2.64 24.30 75.70 5.40 83.78 37.80 Multi-storey 6.01 5.52 2.50 30.20 48.70 11.60 54.51 27.80 One storey 1.92 5.83 2.16 35.10 32.10 1.30 28.57 22.70 Semi pucca 2.98 5.11 1.63 19.40 8.10 0.50 1.64 1.10 Katcha 4.87 4.73 1.17 9.80 4.80*
Total 5.77 5.32 2.10 25.40 32.20 5.60 32.55 17.40
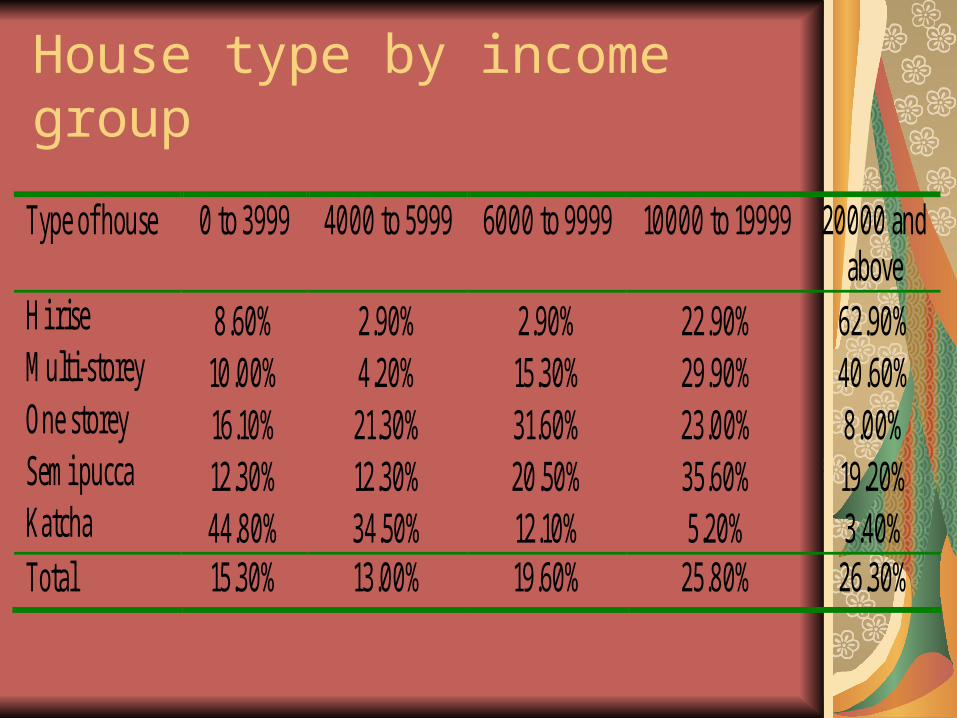
House type by income group
Type of house 0 to 3999 4000 to 5999 6000 to 9999 10000 to 19999 20000 and above
Hi rise 8.60% 2.90% 2.90% 22.90% 62.90% Multi-storey 10.00% 4.20% 15.30% 29.90% 40.60% One storey 16.10% 21.30% 31.60% 23.00% 8.00% Semi pucca 12.30% 12.30% 20.50% 35.60% 19.20% Katcha 44.80% 34.50% 12.10% 5.20% 3.40% Total 15.30% 13.00% 19.60% 25.80% 26.30%

Demand Side issues Demand Side issues

Water consumption by house type
Type of House Liter/capita/day (LCD)
Hi rise 238.58 Multi-storey 140.39 One storey 138.11 Semi pucca 107.88 Katcha 53.13 Total 125.32

Water consumption by living standard
Liter per person per day Indicators of living standards
Yes No Garden in the premise 161.09 115.38 Commode in the toilet 183.68 104.51 Car washing facility 232.71 109.29 Water heating facility 247.86 121.89 Dishwasher 225.52 121.46 Washing machine for clothes 212.22 115.91 Attached Bath 153.29 109.46 Bathtub 238.61 112.77 Shower in the bathroom 159.53 100.64 Floor-tiles in the Bathroom 164.45 109.19

Water Consumption by ranges of LCD
Range Valid Percent Cumulative below 100 43.3 43 100 to 150 22.5 66 150 to 200 13.7 80 200 thru highest 20.6 100 Total 100

What factors affect water consumption?
Regression output:
Unstandardized Coefficients Standardized Coefficients
t Sig.
B Std. Error Beta Intercept 104.818 9.181 11.416 0.00 Type of house 7.687 4.062 0.104 1.893 0.059 Dummy for Car washing facility
44.005 12.011 0.202 3.664 0.00
Dummy for Dishwasher
47.442 22.744 0.109 2.086 0.038
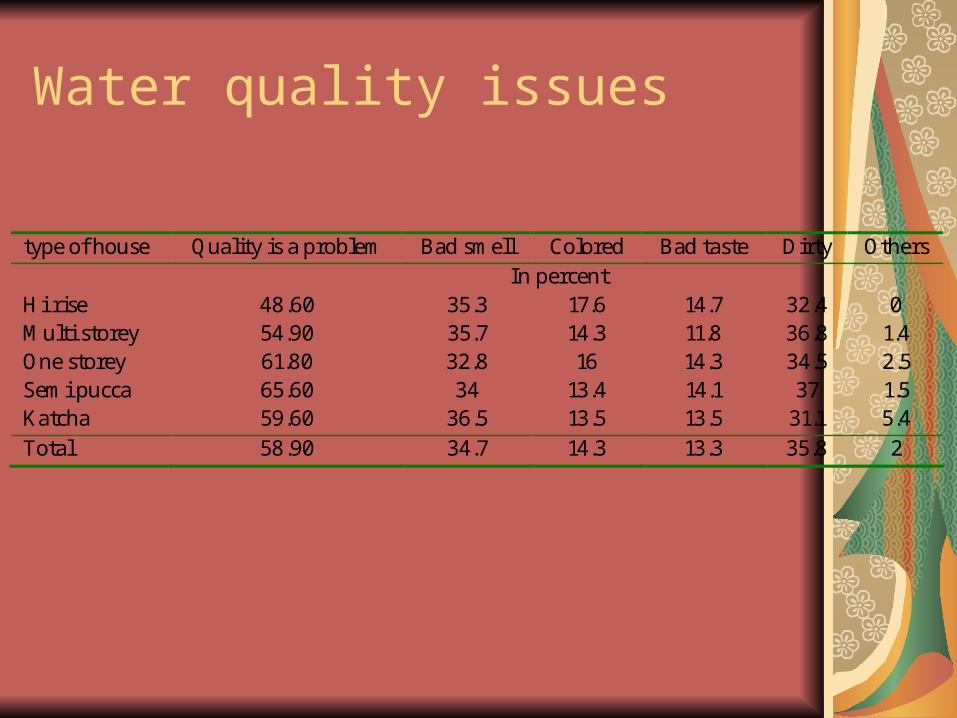
Water quality issues
type of house Quality is a problem Bad smell Colored Bad taste Dirty Others In percent Hi rise 48.60 35.3 17.6 14.7 32.4 0 Multi storey 54.90 35.7 14.3 11.8 36.8 1.4 One storey 61.80 32.8 16 14.3 34.5 2.5 Semi pucca 65.60 34 13.4 14.1 37 1.5 Katcha 59.60 36.5 13.5 13.5 31.1 5.4 Total 58.90 34.7 14.3 13.3 35.8 2

Water supply interruptions
Quality of water supply in Uninterrupted With interruptions Winter 66.8 31.2 Pre-monsoon 64.5 34 Monsoon 80.6 18.4

Source of Water
Type of House WASA DTW TW MARKET Hi rise 97.3 2.7 0 0 Multi storey 95.7 2.5 0.4 1.4 One storey 94.9 0 2.6 2.6 Semi pucca 93 2.2 3.2 1.6 Katcha 75 5.4 17.9 1.8 Total 93.1 2.4 3 1.6

Demand forecast model HOUS = POP/() ........................................................................................(1)
Where, HOUS = Number of Houses, POP = Population, is average family size, and is number of families living in a house.
POPi = HOUS i i i ...............................................................................(2)
Where POPi = Population living in ith type of house, i percent of ith type of house, i average family size living in ith type of house, and is the average number of families living in ith type of house.
WDi = i POPi ............................................................................................(3)
Where, is the water demand per capita per day in liter for ith type of house, and WD is the total water demand for ith type of houses.
TWD = Σ (WDi) (1 + ) / (1 - ) ................................................................(4)
Where, is the physical leakages during distribution, and is the percent of water used by commercial and industrial users and TWD is total water demand in Dhaka, and value is 10% and is 30%.
GWDPC = TWD / POP .................................................................................(5)
Where, GWDPC is Gross water demand per capita and POP is the total population.
LCD = ΣWDi / POP .......................................................................................(6)
Where, LCD is per capita per day water demand in liter.
POPt = POPt-1ert ............................................................................................ (7)
Where, POPt is population served by DWASA in period t and r = 4.27% as the annual growth rate using exponential growth rate.

Existing DWASA zones
Population Business As Usual Year
Million MLD GLCD LCD 2005 8.31 1,658.49 199.60 127.02 2010 9.96 2,013.54 202.08 128.59 2015 11.90 2,434.00 204.55 130.17 2020 14.10 2,918.61 207.03 131.74 2025 16.57 3,471.50 209.50 133.32 2030 19.48 4,128.54 211.97 134.89

Demand 2005-2030 - baseline
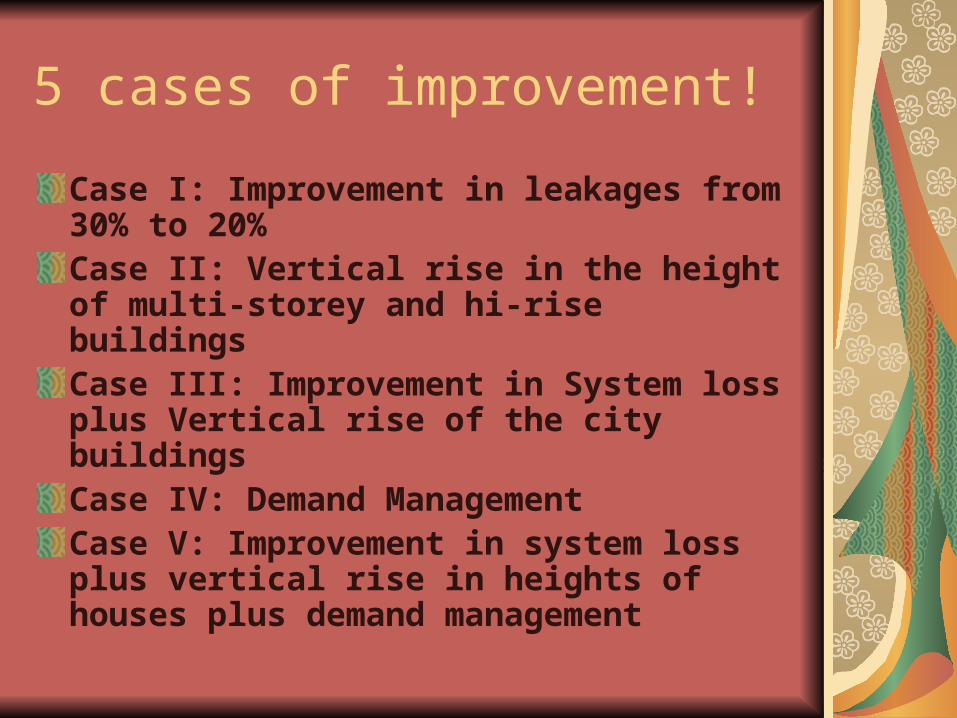
5 cases of improvement!
Case I: Improvement in leakages from 30% to 20% Case II: Vertical rise in the height of multi-storey and hi-rise buildingsCase III: Improvement in System loss plus Vertical rise of the city buildingsCase IV: Demand ManagementCase V: Improvement in system loss plus vertical rise in heights of houses plus demand management

Baseline – plus 5 cases
Year Population Business As Usual
Case I Case II Case III Case IV Case V
2005 8.31 1,658.49 1,658.49 1,658.49 1,658.49 1,658.50 1,658.49
2010 9.96 2,013.54 1,957.60 2,013.31 1,957.38 1,993.39 1,937.79
2015 11.90 2,434.00 2,302.43 2,579.79 2,440.35 2,385.88 2,389.68
2020 14.10 2,918.61 2,688.20 3,221.46 2,967.13 2,833.09 2,870.54
2025 16.57 3,471.50 3,115.45 3,929.90 3,526.83 3,337.47 3,365.73
2030 19.48 4,128.54 3,612.47 4,728.40 4,137.35 3,931.61 3,887.08
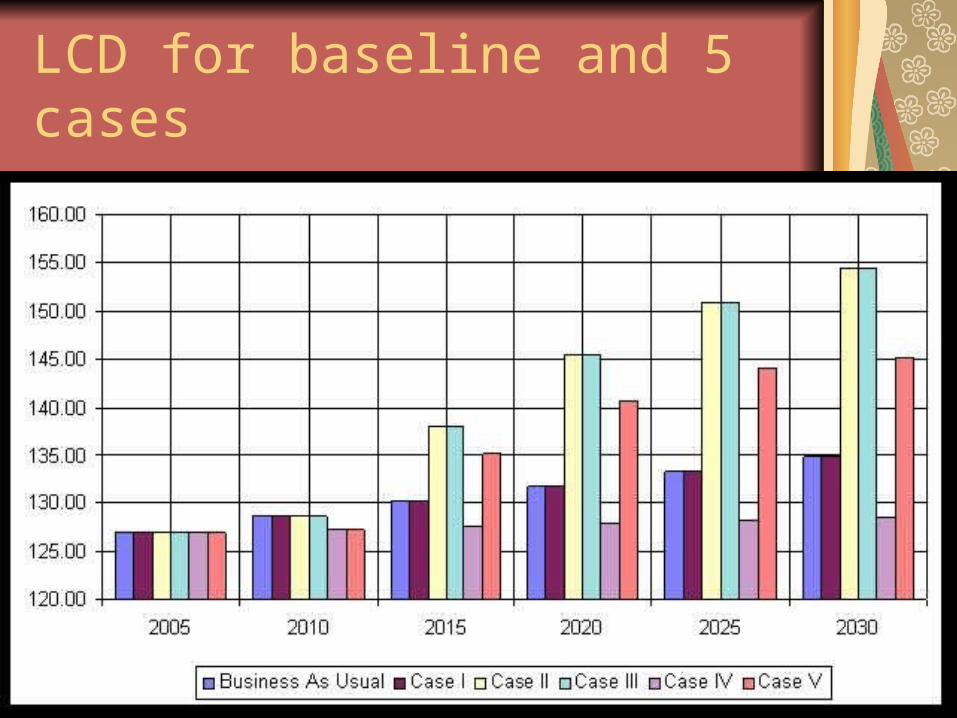
LCD for baseline and 5 cases

Counterfactual scenarios of changes over time
Scenario I: Like that of Motijheel ThanaScenario II: Like that of Ramna-Eskaton AreaScenario III: Like that of Mohakhali ThanaScenario IV: A Mixed Area – like Motijheel-Mohakhali-Ramna combined

Counterfactual scenarios
Name of the Area Scenario Katcha SEMI-PUCCA
One-storey
Multistorey High-rise
Baseline - 7.88% 31.31% 9.18% 53.49% 1.54% Motijheel I 1.25% 47.04% 5.93% 38.84% 6.94% Ramna-Eskaton I I 2.57% 14.42% 10.54% 67.12% 5.35% Mohakhali I I I 7.97% 48.62% 7.61% 32.96% 2.84% Mixed IV 3.93% 36.69% 8.03% 46.31% 5.04%

Scenario 1: Demand MLD
Year Population
Business As Usual
Case I Case II Case III Case IV Case V
(million) Million Liter per Day
2005 8.31 1,658.49 1,658.49 1,658.49 1,658.49 1,658.50 1,658.49
2010 9.96 2,118.33 2,059.49 2,118.12 2,059.28 2,083.74 2,025.65
2015 11.90 2,677.47 2,532.74 2,842.63 2,688.97 2,560.54 2,565.85
2020 14.10 3,340.22 3,076.52 3,711.73 3,418.70 3,071.45 3,115.15
2025 16.57 4,115.26 3,693.18 4,735.00 4,249.36 3,598.51 3,628.25
2030 19.48 5,032.77 4,403.67 5,941.01 5,198.39 4,146.65 4,072.22
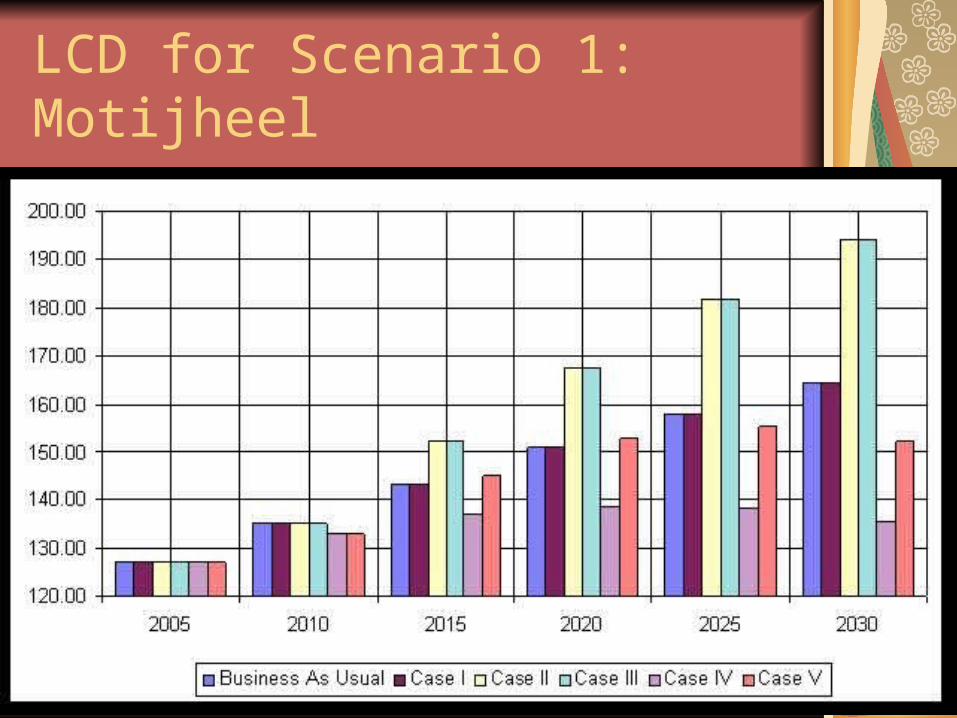
LCD for Scenario 1: Motijheel

Scenario II: Ramna-Eskaton
Year Population (million)
Business As Usual
Case I Case II Case III Case IV Case V
Million Liter per Day
2005 8.31 1,658.49 1,658.49 1,658.49 1,658.49 1,658.49 1,658.49 2010 9.96 2,126.87 2,067.79 2,126.63 2,067.56 2,096.98 2,038.50 2015 11.90 2,689.37 2,544.00 2,870.13 2,714.99 2,594.58 2,615.18 2020 14.10 3,344.81 3,080.74 3,761.38 3,464.43 3,134.78 3,227.22 2025 16.57 4,095.93 3,675.84 4,796.79 4,304.81 3,701.64 3,830.89 2030 19.48 4,991.38 4,367.46 6,021.31 5,268.64 4,308.42 4,400.68

Scenario II: LCD
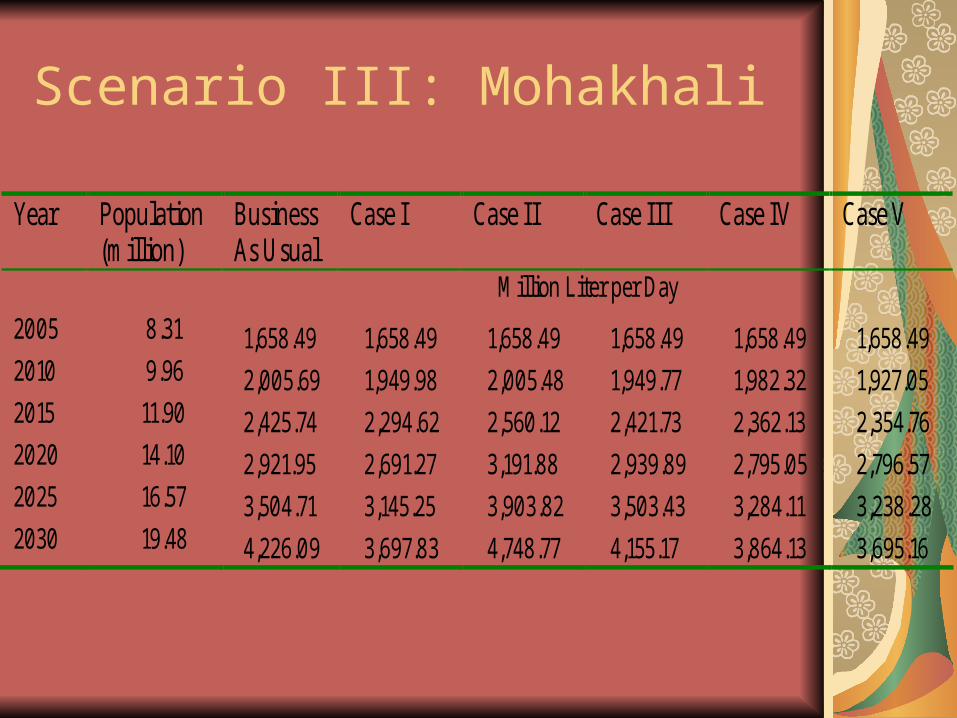
Scenario III: Mohakhali
Year Population (million)
Business As Usual
Case I Case II Case III Case IV Case V
Million Liter per Day
2005 8.31 1,658.49 1,658.49 1,658.49 1,658.49 1,658.49 1,658.49 2010 9.96 2,005.69 1,949.98 2,005.48 1,949.77 1,982.32 1,927.05 2015 11.90 2,425.74 2,294.62 2,560.12 2,421.73 2,362.13 2,354.76 2020 14.10 2,921.95 2,691.27 3,191.88 2,939.89 2,795.05 2,796.57 2025 16.57 3,504.71 3,145.25 3,903.82 3,503.43 3,284.11 3,238.28 2030 19.48 4,226.09 3,697.83 4,748.77 4,155.17 3,864.13 3,695.16

Scenario III: LCD

Scenario IV: Mixed
Year Population (million)
Business As Usual
Case I Case II Case III Case IV Case V
Million Liter per Day
2005 8.31 1,658.49 1,658.49 1,658.49 1,658.49 1,658.49 1,658.49 2010 9.96 2,083.01 2,025.15 2,082.79 2,024.93 2,053.77 1,996.51 2015 11.90 2,596.66 2,456.30 2,756.63 2,607.62 2,504.99 2,511.09 2020 14.10 3,201.19 2,948.47 3,553.51 3,272.97 2,999.48 3,045.15 2025 16.57 3,903.90 3,503.50 4,476.46 4,017.34 3,526.97 3,564.29 2030 19.48 4,750.08 4,156.32 5,570.36 4,874.07 4,106.40 4,056.02

Scenario IV: LCD

Literature on LCD – some findings

Demand Management Aspects
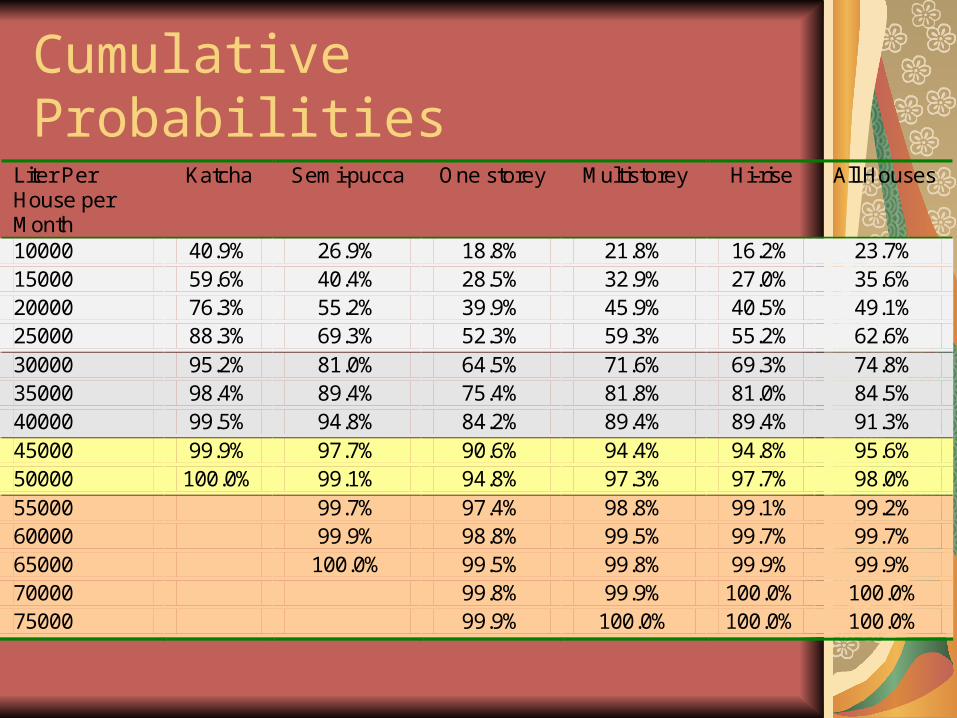
Cumulative Probabilities
Liter Per House per Month
Katcha Semi-pucca One storey Multistorey Hi-rise All Houses
10000 40.9% 26.9% 18.8% 21.8% 16.2% 23.7% 15000 59.6% 40.4% 28.5% 32.9% 27.0% 35.6% 20000 76.3% 55.2% 39.9% 45.9% 40.5% 49.1% 25000 88.3% 69.3% 52.3% 59.3% 55.2% 62.6% 30000 95.2% 81.0% 64.5% 71.6% 69.3% 74.8% 35000 98.4% 89.4% 75.4% 81.8% 81.0% 84.5% 40000 99.5% 94.8% 84.2% 89.4% 89.4% 91.3% 45000 99.9% 97.7% 90.6% 94.4% 94.8% 95.6% 50000 100.0% 99.1% 94.8% 97.3% 97.7% 98.0% 55000 99.7% 97.4% 98.8% 99.1% 99.2% 60000 99.9% 98.8% 99.5% 99.7% 99.7% 65000 100.0% 99.5% 99.8% 99.9% 99.9% 70000 99.8% 99.9% 100.0% 100.0% 75000 99.9% 100.0% 100.0% 100.0%

Cumulative Probabilities
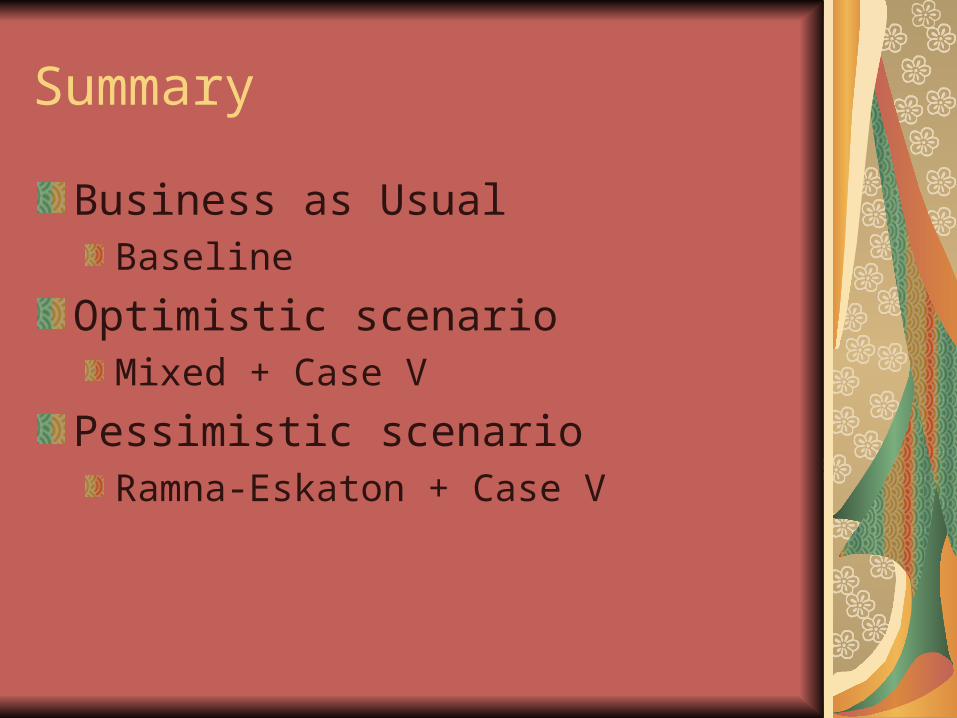
Summary
Business as UsualBaseline
Optimistic scenarioMixed + Case V
Pessimistic scenarioRamna-Eskaton + Case V

Extended DWASA areas
Year Population BAU Optimistic Pessimistic
2005 10.28 2,052 2,052 2,052
2010 12.33 2,470 2,397 2,522
2015 14.72 3,107 2,957 3,236
2020 17.44 3,768 3,551 3,993
2025 20.50 4,410 4,164 4,740
2030 24.10 5,018 4,809 5,445
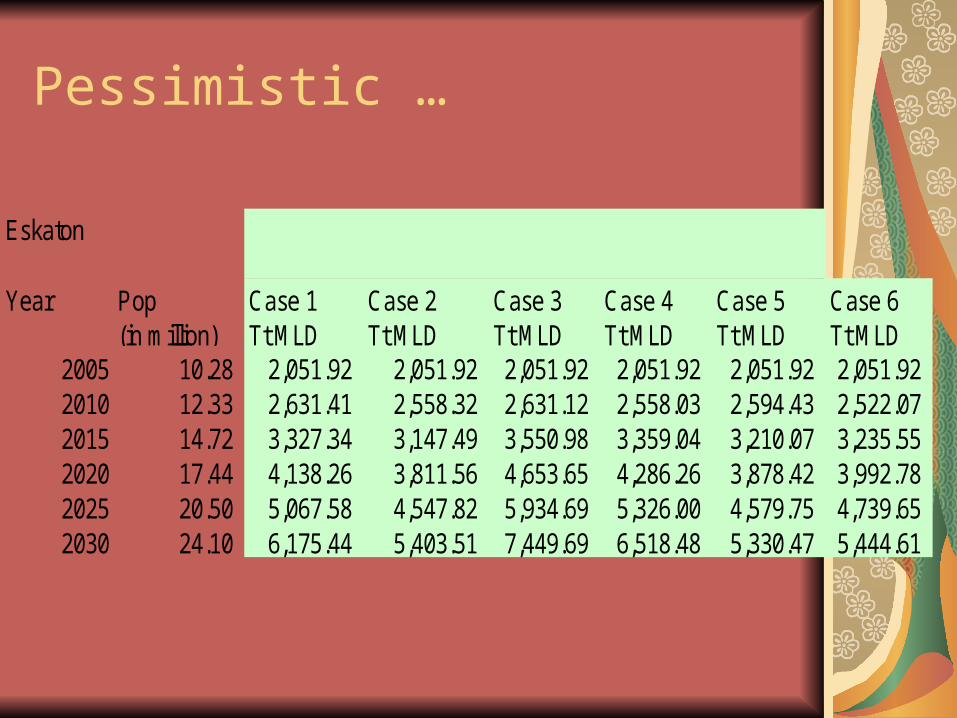
Pessimistic …
Eskaton
Year Pop(in million)
Case 1Tt MLD
Case 2Tt MLD
Case 3Tt MLD
Case 4Tt MLD
Case 5Tt MLD
Case 6Tt MLD
2005 10.28 2,051.92 2,051.92 2,051.92 2,051.92 2,051.92 2,051.92 2010 12.33 2,631.41 2,558.32 2,631.12 2,558.03 2,594.43 2,522.07 2015 14.72 3,327.34 3,147.49 3,550.98 3,359.04 3,210.07 3,235.55 2020 17.44 4,138.26 3,811.56 4,653.65 4,286.26 3,878.42 3,992.78 2025 20.50 5,067.58 4,547.82 5,934.69 5,326.00 4,579.75 4,739.65 2030 24.10 6,175.44 5,403.51 7,449.69 6,518.48 5,330.47 5,444.61

Baseline….
Scenario = Baseline simulation
Year
Population Business As Usual
Case I Case II Case III Case IV Case V
2005 10.28 2,051.92 2,051.92 2,051.92 2,051.92 2,051.93 2,051.92 2010 12.33 2,491.19 2,421.99 2,490.90 2,421.71 2,466.26 2,397.48 2015 14.72 3,011.39 2,848.61 3,191.78 3,019.25 2,951.86 2,956.56 2020 17.44 3,610.97 3,325.89 3,985.66 3,671.00 3,505.16 3,551.49 2025 20.50 4,295.01 3,854.50 4,862.15 4,363.47 4,129.18 4,164.15 2030 24.10 5,107.92 4,469.43 5,850.08 5,118.82 4,864.27 4,809.18
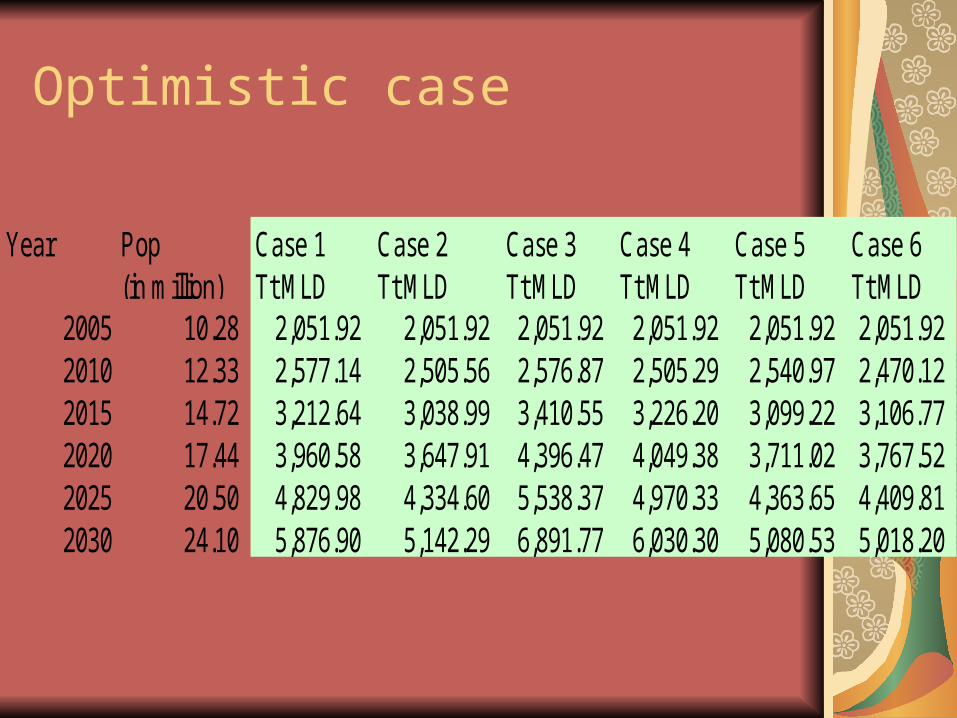
Optimistic case
Year Pop(in million)
Case 1Tt MLD
Case 2Tt MLD
Case 3Tt MLD
Case 4Tt MLD
Case 5Tt MLD
Case 6Tt MLD
2005 10.28 2,051.92 2,051.92 2,051.92 2,051.92 2,051.92 2,051.92 2010 12.33 2,577.14 2,505.56 2,576.87 2,505.29 2,540.97 2,470.12 2015 14.72 3,212.64 3,038.99 3,410.55 3,226.20 3,099.22 3,106.77 2020 17.44 3,960.58 3,647.91 4,396.47 4,049.38 3,711.02 3,767.52 2025 20.50 4,829.98 4,334.60 5,538.37 4,970.33 4,363.65 4,409.81 2030 24.10 5,876.90 5,142.29 6,891.77 6,030.30 5,080.53 5,018.20


![KUNAL N. CHAUDHURY, YUEHAW KHOO, AND AMIT SINGER … · arXiv:1306.5226v5 [cs.CV] 23 Dec 2014 2 KUNAL N. CHAUDHURY, YUEHAW KHOO, AND AMIT SINGER Moreover, we assume that the correspondence](https://static.fdocuments.net/doc/165x107/5f1fee6f7bada87c2060d06d/kunal-n-chaudhury-yuehaw-khoo-and-amit-singer-arxiv13065226v5-cscv-23-dec.jpg)


