Water Consumption Analyzed through STARS
53
1 Water Consumption Analyzed through STARS Courtney Wright April 21, 2014 Envs 4100: Appropriate Technology and Sustainability: The Campus as a Living, Learning Laboratory.
Transcript of Water Consumption Analyzed through STARS

1
Water Consumption Analyzed
through STARS
Courtney Wright April 21, 2014
Envs 4100: Appropriate Technology and Sustainability: The Campus as a Living, Learning Laboratory.

2
Table of Contents III. Executive Summary ..................................................................................................................................................... 3
IV. Introduction: ............................................................................................................................................................... 4
V. Methodology and Data ................................................................................................................................................ 5
VI. Examples of Best Practice on Campus ......................................................................................................................... 6
VII. Examples of Best Practice on Other Campuses ........................................................................................................... 6
VIII. Discussion ................................................................................................................................................................. 7
IX. Limitations of your analysis and future work: .............................................................................................................10
X. Conclusions/ Recommendations .................................................................................................................................11
XI. References ................................................................................................................................................................12
XII. Appendices ..............................................................................................................................................................14
Appendix 1-Current Contact List.............................................................................................................................14
Appendix 2- Contact list and logs .............................................................................................................................14
Appendix 3- Image Archives .......................................................................................................................................15
Appendix 3a ............................................................................................................................................................15
Appendix 3b............................................................................................................................................................16
Appendix 3c ............................................................................................................................................................41

3
III. Executive Summary A major problem that is consistent with every university all over is the excessive amount of water that is consumed each year. Most people who live in areas like Michigan do not see water as an important resource because they are literally surrounded by more of it then they could ever want. However, water is a very important resource and there are places in the United States and throughout the whole world where they do not have that luxury. In those areas they are forced to make the smallest amount of water go a long way and that is how they are taught to live. We need to learn how to conserve our water and not use as much per capita or we will have a problem with water in the future. Just because we appear to have endless water supply it does not necessarily mean that it is safe for us. There are many ways that water can be contaminated then it is no longer able to be used for our purposes. There are so many factors that affect how much water we are able to use so we should not be using it in excess like we are now. We should try to find ways as a university to conserve more water. A big community like a university uses a lot of water for many different things such as domestic use, irrigation, labs, eating, and many other uses. I used a website known as AASHE. AASHE is a program that stands for the Association for the Advancement of Sustainability in Higher Education. More specifically, I used the STARS portion of this program. STARS is the Sustainability Tracking, Assessment & Rating System. It is a self-reporting website where universities get a score of how sustainable they are. I focused on the water category within STARS. . By analyzing all the data on an excel spreadsheet, I discovered that the average amount of water usage per student enrolled is 11,751.53 gallons of water. That is a lot of water consumption for universities that are already making sustainable choices so what about the universities where sustainability is not a priority? How much water are they using? I also explored two different versions of STARS and evaluated them for user friendliness and the information that each one provided. There were many pros and cons to each one. We need to learn from both the older version of STARS and the newer version to really get a good idea of what is necessary for taking the next critical steps to make future decisions for WMUS water conservation practices. I am proposing that we take the information learned from this project seriously and continue to improve. I recommend that we should start making more water sustainable choices. In the future you will need to research best practice results for Western Michigan University in particular, however, with the research that I have done you will have a great start to figure out what the best practice is. Each university is doing different things to try to limit their water usage. By using the information found on STARS you will be able to find best practices in any category not just in water usage.

4
IV. Introduction: “AASHE mission is to empower higher education to lead the sustainability transformation. [They] do this by providing resources, professional development, and a network of support to enable institutions of higher education to model and advance sustainability in everything they do, from governance and operations to education and research.” (AASHE) They provide the opportunity for universities to try to strive in sustainability practices. Once they fill out the STARS form they are able to see where they are in relation to other universities. Then the different institutions are able to see where they are able to improve and hopefully everyone makes plans to get better at each category. AASHE has many goals to support their mission. One of those goals is to help universities educate their students on the knowledge and skills required to tackle sustainability challenges they will face in the future.
STARS is a small portion of AASHE. STARS is a self-reporting project that is done by universities all over the world. Generally, these universities use this form to figure out what their sustainability score is. In each operation there are a certain amount of points you can get. With every sustainable option you do gives you a better score. Your goal is to get the highest score you can meaning that as a university you are making sustainable decisions. By the total score institutions are put into a category. You can get platinum, gold, silver, or bronze. Currently no universities have the platinum title; however, many of them have earned a gold score. In order to get a platinum score they would need to get over 85 points. To be able to get a gold rating you need to score over 65 points, to receive a silver rating you need to receive over 45 points, and then lastly to get a bronze score you need to get above 25 points. They are also able to compare their score with other universities that have reported. They want to see how sustainable they are. STARS stands for Sustainability Tracking, Assessment & Rating System. They have certain goals for this website to be able to show us. The goals are to “Provide a framework for understanding sustainability in all sectors of higher education, enable meaningful comparisons over time and across institutions using a common set of measurements developed with broad participation from the campus sustainability community, create incentives for continual improvement toward sustainability, facilitate information sharing about higher education sustainability practices and performance, [and] build a stronger more diverse campus sustainability community.” (STARS, 2013) There are many categories for a university to fill out when they are completing the form. The categories range from Education &Research, Dining Services, and Waste Management. I decided to focus on one category in particular. I focused on the water category to see what universities were doing on water consumption and storm water management. They are separated in sections called operations. There are two different versions of STARS that I focused on. They are STARS v1.2 and v2.0. There are many differences between the two however; the reason why some universities have not done STARS 2.0 is because it was just put into the system in February of this year. In STARS 1.2 I focused on water consumption and storm water management. In STARS 2.0 I focused on Water Use.
Each credit is given based on certain criteria. STARS takes into consideration two major things. “To what extent does achievement of the credit ensure that people (students, employees and / or local community members) acquire the knowledge, skills, and dispositions to meet sustainability challenges? To what extent does achievement of the credit contribute to: human and ecological health and mitigate negative environmental impacts, secure livelihoods, a sustainable economy and other positive financial impacts, social justice, equity, diversity, cooperation, democracy and other positive social impacts?” (STARS, 2013)
There are many positive effects to lowering our water usage on campus. The university will save water because we do not need as much. It will look better as a university if we are a water conscious university. Lastly, this is a great thing for WMU to look into because it will help our university be a healthier environment for our students. The big problem that we are facing is water conservation and we need to figure out what the best practice will be to preserve our water supply for our future. . This is a problem that impacts all parts of campus because every part of Western uses water in some way and could change something to limit the water usage.

5
V. Methodology and Data In this project, I took the information I analyzed in STARS and put it into three different tables that you can
find in appendices 3a, 3b, and 3c. In 3a you can find the data from the few universities that filled out the STARS
v2.0. The reason why there are so few universities is because this newer version just came out in the past couple
months so not many universities have had a chance to reapply or fill it out and submit it. In 3b you can find the
data from STARS v1.2. In both of these versions you will find the university, city, STARS score, enrollment, water
consumption score, storm water management score and some more relevant data. In 3c you will be able to look at
all the universities from both versions of STARS and looked at more a quantitative side of it. Using this table you
will be able to see what the best practices are that are being done at each of the other universities. I took
quantitative data to show a comparison between 147 universities in order to make a best practice decision for our
university to help reduce water consumption. I also took some qualitative data of what the universities are doing. I
was only able to record the information that the university decided to provide on the STARS form unless they
provided a website of all there initiatives. I chose to do this background research because this is a good starting
point for any future project that may involve water consumption or storm water management. This allows anyone
who is interested in best practices to look back at universities that are like WMU and compare themselves to them
so we can improve our university. I was able to look at how much water each university uses in a year that they
recorded then I was able divide the amount of water consumed as a whole divided by the student enrollment to get
the average gallon per student amount. This total number is important because then we will be able to tell if a
university is doing well or poorly in comparison to the average amount.
I acquired the data for this information off of the STARS website and from the universities who included
another website. Then I used this data to compare the two versions based on the amount of information that was
given and what an outsider was able to acquire from it. When I was comparing the two versions, I looked at the
amount of perfect scores, how much the university thought they could improve, and how much information was
given on best practices. This information allowed me to gather a great amount data that could make a huge
difference in the future.

6
VI. Examples of Best Practice on Campus
During this project, I did not get a chance to evaluate current research projects However, from a basic
search on WMUs webpage, I found these examples of water initiatives: Adding low flow fixtures, installation of an
irrigation control from a building automation system, a chemical free water treatment, retention of storm run-off
for new construction, re-routing illicit discharge to sanitary, touch less faucets, auto flush urinals, waterless urinals,
and water reduction programs for cooling towers, water efficient washing machines in residence halls, and de-
ionized water to clean exterior windows. These are just some of the things that WMU is currently doing on campus.
VII. Examples of Best Practice on Other Campuses There are many examples of practices being done on every university that pursued water consumption and
storm water management. Some of them are better than others. The problem with this website being self-reporting
is that it allows for a university to give them a better score then they actually deserve. An example of this would be
how some universities gave themselves a better score for having a research sized portion of porous paving than a
university that has five full parking lots of porous paving. In appendix 3c you can see the table of all the universities
that I looked at to see what they are doing. I only added the main things that were being done widespread to the
table. The most common thing I saw that was being done was retention ponds, stone swales, and vegetated swales.
Many universities wanted to catch rain water and implement smart irrigation systems. Each university obtained
these goals using different methods. For a specific practice you will have to do extensive research.
For their STARS scores, most universities gave themselves a perfect score in storm water management and
high scores for water consumption. Many of them are doing about three out of the thirteen main things in water
uses on their campuses. These include bottled water, trayless dining, bioretention ponds, low flow fixtures, green
roofs, retention ponds, porous paving, smart irrigation, rain water catch systems, greywater systems, rain gardens,
stone swales, and vegetated swales. There is so much improvement that could be done.

7
VIII. Discussion During this project I found a lot of variations between the two different versions of STARS. The main
differences between the two versions are outlined in this table below.
Figure 1.
Figure 1 shows my reasons why I think it would be very beneficial for STARS to take another look at how
they are allowing universities to fill out the forms. This will allow the university that is filling out the form to know
what specific areas they could improve on. This would also promote other universities to learn from examples of
best practices that other institutions are doing. I think STARS would be a lot better if they combined the two
versions to get a really good qualitative and quantitative data set. Also, this form would benefit by requiring
universities to put the student enrollment and website that you can go to find more information on their sustainable
initiatives. The enrollment would give people something to compare to, to find an institution like their own. If they
were required to leave a website, then universities would be able to get more details on each of the practices that the
university is saying they are doing. This would also give each university more credibility.
V1.2 V2.0 Provided a better qualitative data analysis. Provided a better quantitative data analysis
The scores for this version were given based on answers to yes or no questions. It does not analyze the benefits each project provided the university.
This version provided a more accurate scoring since the scores relied on a more critical analysis of what was being done. Few universities achieved a perfect score.
This version gave more details about the best practice being done on each campus.
Allows for fair comparison between the universities by taking into account the climate of their locations.
It was common that universities provided a link for their website to find more information on each of their practices.
Information about how a university was obtaining their scores was not readily available.
Universities are asked to categorize the climate of their location. This allows for comparison between climates.
This version accounts for baseline data for each institution such as water consumption and enrollment rates. It also includes performance data to see an institution’s progress over the years.

8
From the data I analyzed where all the universities filled out both full time enrollment and water
consumption, I found that on average, universities use 11,751.53 Gallons/ student of water. That number is for the
universities that are pursuing water consumption. Imagine how much higher that number would be if it included
every university. Once WMU figures out where they are at in water consumption per student we will be able to tell
how we are in relation to the average university. This will be able to give us a good idea. By looking into appendix
3a and 3b you can see all the quantitative data that I received from both versions of STARS.
I also looked into the qualitative data that was provided on the STARS website. I wanted to see what the
institutions were doing to get such good scores or some of them getting low scores. I wanted to see if there was a
pattern. Some of the things I found out was this is the area that you could really tell that this form is self-reporting.
You did not need to know how much water was saved from each practice or how beneficial it was to the university.
For some of them it would have been nice to know how big each practice was to see if it was researched based on a
small scale or parking lot sizes. Many of the universities tended to commonly have retention ponds, vegetated
swales, or stone swales. One practice that surprised me, it was in more universities than I thought was green roofs.
Also, one that seemed to not be in as many universities as I thought was rain gardens. I feel that one is easier to
incorporate in than a green roof and could be cheaper. This allowed me to look deeper into each university and
allowed me to see how credible each university was.
STARS v2.0 had a different scoring system. The total score for water consumption was based on water risk.
The closer you were to water meant the lower total score you could get. In places where water is less abundant you
have a higher total score because you are more at risk than others.
Figure 2
Physical Risk
QUANTITY
Points Available For Each
Part
Total Available Points For This
Credit
Low Risk ⅔ 2
Low to Medium Risk 1 3
Medium to High Risk 1⅓ 4
High Risk 1⅔ 5
Extremely High Risk 2 6
Figure 2 is the risk assessment from the STARS website.
An example of when this would be relevant is Arizona has a higher risk on water consumption so their total
score they can get for this section is 5 points meaning they are at a high risk, while a university like Grand Valley
State University has a low to medium risk so their total score is a 3. This is very beneficial to know when looking for
best practices on a university like WMU because then you can look at places that have the same risk score as you.

9
In STARS v1.2 many universities gave themselves perfect scores on storm water management. I did not
agree with most of them. The reason I did not agree with that because I feel that STARS gave the total score too
low so universities did not think they need to improve. Since they can receive a perfect score by having only three
storm water management practices. What is the motivation to continue to improve on that category? I think that
there should not be any or not many perfect scores for any category of STARS since sustainability is something we
can always improve on. Since it is something we can improve, we should not be giving ourselves perfect scores.

10
IX. Limitations of your analysis and future work:
The major limitation of my project was time consumption. It takes a lot of time to do the research in an extensive amount like looking into every university that has posted on the STARS website. Another limitation I had was that WMU has not submitted their form yet and are not pursuing water consumption on the one they are currently working on. This was a limitation because I was not able to compare WMU to other universities that are like us. This limitation caused me to limit my ability to look up best practices for WMU.
In the future, I would really like to help Western Michigan University pursue the water consumption portion of their STARS form so when they turn in their portion they will be able to compare their water usage to other universities all over the world. From that comparison, we will be able to make a better decision on what the best practice would be for our university. Once we have some ideas of what we want to do, we will need to do research on what goes into incorporating one of those ideas into a large scale place such as Western Michigan University.

11
X. Conclusions/ Recommendations After doing this extensive research I think Western Michigan University could incorporate many things into our campus. However, I think we could also improve some of the water consumption practices we currently have. We then have two choices improve what we have or start fresh with a new water consumption project. Everything can be improved to make it better. This research was very important because it allows us a great starting point to jump into water consumption for Western Michigan University.
One of the short-term goals that I think could easily be changed on WMU’s campus is irrigation practices. Sometimes that could be as easy as making sure that sprinklers are only used when needed and planting plants that need little to no irrigation. Western seems to be practicing this already but, I know I have walked on campus and a sprinkler has been watering the sidewalk more than the plants in the garden. Another short-term goal is we can improve by continuing to improve our retention ponds and having a better system for re-routing illicit discharge to sanitary.
WMU has many options they could do to conserve on water consumption. Along-term goal that I think would be very important for WMU to pursue would be putting in a very nice rain garden to help with storm water management. I think it would also be very beneficial for WMU to put a rain catching system whether it’s an underground cistern, more green roofs, or above ground cisterns. I think if we were to incorporate a water catching system it would help the university save on water consumption and money. They could use the water they catch for non-domestic purposes such as irrigation. These long-term goals would require more research on what one would be best and may require a fair amount of expenses at the start, but all of these are being practiced on universities that are striving to reduce their water consumption so it would be beneficial for our university to consider.

12
XI. References "American University." Water. N.p., n.d. Web. 20 Apr. 2014. <http://www.american.edu/finance/sustainability/Water.cfm>.
"Association for the Advancement of Sustainability in Higher Education | News, Resources, Events, and Assessment Tools
for the Campus Sustainability Community." Association for the Advancement of Sustainability in Higher Education | News,
Resources, Events, and Assessment Tools for the Campus Sustainability Community. N.p., n.d. Web. 16 Apr. 2014.
<http://www.aashe.org/>.
"Boston University." Sustainability Water Comments. N.p., n.d. Web. 20 Apr. 2014.
<http://www.bu.edu/sustainability/what-were-doing/water/>.
"Campus Initiatives: Water Use." Elon University. N.p., n.d. Web. 19 Apr. 2014. <http://www.elon.edu/e-
web/bft/sustainability/ci-waterUse.xhtml>.
"Campus Initiatives." Water Management. N.p., n.d. Web. 18 Apr. 2014.
<http://www.fm.wmich.edu/engineering/energy_management/campus_initiatives/water_management>.
"Campus Initiatives." Water – VCU Sustainability. N.p., n.d. Web. 17 Apr. 2014.
<http://www.vcugoesgreen.vcu.edu/initiatives/water.html>.
"Chatham University." Office of Sustainability. N.p., n.d. Web. 20 Apr. 2014.
<http://www.chatham.edu/outreach/sustainability/environment.cfm>.
"Colgate University." Water Conservation and Protection - Colgate University's Sustainability and Climate Action Plan. N.p.,
n.d. Web. 20 Apr. 2014. <https://sites.google.com/a/colgate.edu/2011-2015-sustainability-and-climate-action-plan/water-
conservation>.
"Cornell University." Sustainable Campus. N.p., n.d. Web. 20 Apr. 2014. <http://www.sustainablecampus.cornell.edu/>.
"Current STARS Participants." Institutions. N.p., n.d. Web. 17 Apr. 2014. <https://stars.aashe.org/institutions/>.
"DEEP: Stormwater Management." Eastern Connecticut State University. N.p., n.d. Web. 20 Apr. 2014.
<http://www.ct.gov/deep/cwp/view.asp?a=2721&q=325702&depNav_GID=1654>.
"Drinking Water." Cornell Sustainable Campus. N.p., n.d. Web. 21 Apr. 2014.
<http://www.sustainablecampus.cornell.edu/initiatives/drinking-water>.
"Eco-Efficiency Centre." Dalhousie University. N.p., n.d. Web. 21 Apr. 2014.
<http://www.dal.ca/faculty/management/schools_and_centres/eco-efficiency-centre.html>.
"Emory Sustainability Initiative: Water Conservation." Emory Sustainability Initiative: Water Conservation. N.p., n.d. Web. 19
Apr. 2014. <http://sustainability.emory.edu/page/1009/Water-Conservation>.
"Energy Management." Grand Valley State University- Facilities Services. N.p., n.d. Web. 18 Apr. 2014.
<http://www.gvsu.edu/facilitiesservices/energy-management-36.htm>.
"Garden Waste Reduction." Cal Poly Pomona. N.p., n.d. Web. 20 Apr. 2014.
<http://www.csupomona.edu/~fpm/management/logistics/garden_waste.html>.
"Loyola University Chicago - Institute of Environmental Sustainability." Loyola University Chicago. N.p., n.d. Web. 18 Apr.
2014. <http://www.luc.edu/sustainability/campus/office-of-sustainability/whatisloyoladoing/water/index.shtml>.

13
"Mechanical Distribution." University of Texas at Austin. N.p., n.d. Web. 17 Apr. 2014.
<http://www.utexas.edu/utilities/services/mechanical/#conserve>.
"MSU-Water Home." MSU-Water Home. N.p., n.d. Web. 18 Apr. 2014. <http://www.msu-water.msu.edu/index.asp>.
"Okanagan College." Water. N.p., n.d. Web. 18 Apr. 2014.
<http://www.okanagan.bc.ca/campus_and_community/employees/facilities_management/sustainability/water.html>.
"STARS Overview." | About | AASHE STARS. N.p., n.d. Web. 17 Apr. 2014. <https://stars.aashe.org/pages/about/stars-
overview.html>.
"Sustainable Stanford | Water." Sustainable Stanford | Water. N.p., n.d. Web. 17 Apr. 2014.
<http://sustainable.stanford.edu/water>.
"Sustainability - Macalester College." Sustainability - Macalester College. N.p., n.d. Web. 18 Apr. 2014.
<http://www.macalester.edu/sustainability/>.
"Sustainability and Energy Management." Standford University--Water Efficiency. N.p., n.d. Web. 17 Apr. 2014.
<http://lbre.stanford.edu/sem/water_efficiency>.
"The UNC Policy Manual." The UNC Policy Manual. N.p., n.d. Web. 20 Apr. 2014.
<http://www.northcarolina.edu/apps/policy/index.php>.
"UCSB Sustainability." UCSB Sustainability. N.p., n.d. Web. 17 Apr. 2014. <http://www.sustainability.ucsb.edu/sustaining-
the-campus/water-goals/>.
"University of North Carolina at Greensboro." Facilities Water Conservation Measures at UNCG Comments. N.p., n.d. Web.
17 Apr. 2014. <http://facsustainability.uncg.edu/water-conservation-measures-at-uncg/>.
"University of Ottawa." Water Management. N.p., n.d. Web. 17 Apr. 2014. <http://www.sustainable.uottawa.ca/campus-
initiatives/water-management.html>.
"Water Conservation." University of Richmond-Sustainability. N.p., n.d. Web. 17 Apr. 2014.
<http://www.sustainability.richmond.edu/conservation/water.html>.
"Water Efforts." - Pomona College. N.p., n.d. Web. 18 Apr. 2014.
<http://pomona.edu/administration/sustainability/initiatives/water/efforts.aspx>.
"Water: Green Mountain College." Water: Green Mountain College. N.p., n.d. Web. 18 Apr. 2014.
<http://sustainability.greenmtn.edu/operations/grounds_water/water.aspx>.
"Water." Portland State Finance & Administration: Campus Planning & Sustainability. N.p., n.d. Web. 18 Apr. 2014.
<http://www.pdx.edu/planning-sustainability/water>.
"Water Resources." Mount Holyoke College. N.p., n.d. Web. 18 Apr. 2014.
<https://www.mtholyoke.edu/envsustainability/waterresources>.
"Water." Rochester Institute of Technology. N.p., n.d. Web. 18 Apr. 2014. <http://www.rit.edu/sustainability/water>.
"Water." St. Lawrence University. N.p., n.d. Web. 18 Apr. 2014. <http://www.stlawu.edu/green/water>.

14
XII. Appendices
Appendix 1-Current Contact List
Name Phone Number Email Courtney Wright (616)446-7703 [email protected]
Appendix 2- Contact list and logs
Name Email Dr. Harold Glasser [email protected] Dr. Glasser was consulted throughout the whole project through face to face meetings.

15
Appendix 3- Image Archives
Appendix 3a
STARS 2.0 Baseline year Performance year
University City, State Stars Rating Score
Date submitted
Enrollment
Portable Water Use
Enrollment
Portable water Use
OP-26 Score
recycled water on campus
Arizona State University Tempe, AZ Gold 72.6
Feb. 28, 2014 6,100 865,530,418 11,712
897,492,871 Gallons 1.67/5.0
2,411,796 Gallons
Grand Valley State University
Allendale, MI Gold 65.24
Feb. 28, 2014 5,662 115,030,384 5,705
110,506,529 Gallons 1.71/3.0 N/A
Loyola University Chicago Chicago, IL Gold 67.02
Jan. 17, 2014 3,753 113,582,000 3,961
109,847,000 Gallons 1.01/4.0 0 Gallons
Minnesota State University Moorhead
Moorhead, MN Silver 46.45
Jan. 17, 2014 1,490 39,672,399 1,754
30,807,868 Gallons 2.23/3.0 N/A
Slippery Rock University
Slippery Rock, PA Silver 46.8
Feb. 28, 2014 2,881 68,810,000 2,984
61,858,000 Gallons 1.20/2.0 1,000 Gallons
University of Missouri Columbia, MO Gold 66.51
Feb. 28, 2014 23,869 349,950,000 24,743
319,836,100 Gallons 1.92/4.0 N/A
University of Missouri, Kansas City
Kansas City, MO Silver 60.63
Mar. 10, 2014 1,200 63,250,880 1,300
68,334,288 Gallons 0.00/2.0 N/A
University of Nebraska-Lincoln Lincoln, NE Bronze 31.22
Jan. 23, 2014 8,034 390,546,134 8,347
385,112,288 Gallons 0.89/3.0 0 Gallons
University of Victoria Victoria, BC, CA Gold 66.45
Jan. 29, 2014 2,240 163,425,283 2,472
142,271,178 Gallons 1.24/3.0
18,639,979 Gallons
Wilfrid Laurier University
Waterloo, ON, CA Silver 55.21
Dec. 20, 2013 1,933 49,628,547 3,480
36,967,639 Gallons 2.00/3.0 0 Gallons

16
Appendix 3b
STARS 1.2
University City, State STARS Rating Score Date submitted
Full-time Enrollment
Institution type
Areas of Cultivated land
Undeveloped land
Climate Region
American University
Washington, DC, Gold 83.26 2/12/14 11,781 Doctorate 33 0.00
Mixed- Humid
Appalachian State University Boone, NC Gold 73.1 5/21/12 16,654 Master N/A N/A Cold
Ball State University Muncie, IN Gold 67.61 9/28/12 22,147 Baccalaureate N/A N/A
Mixed- Humid
Bard College Annandale-on-Hudson, NY Silver 50.6 6/14/11 N/A N/A N/A N/A N/A
Baylor University Waco, TX Bronze 32.36 10/11/12 15,029 Master N/A N/A N/A
Boston University Boston, MA Silver 49.85 7/24/13 30,129 Master N/A N/A cold
Bowdoin College Brunswick, ME Silver 54.13 7/11/13 1,834 Baccalaureate 205 N/A Cold
Byrant University Smithfield, RI Silver 47.58 10/24/13 3,487 Baccalaureate 40 280.00 Cold
California State Polytechnic University, Pomona Pomona, CA Silver 49.45 5/4/11 N/A N/A N/A N/A N/A
California State University , Channel Islands Camarillo, CA Silver 60.61 6/30/11 N/A N/A N/A N/A N/A
California State University, Chico Chico, CA Gold 67.26 11/19/13 15,375 Master 82 N/A Mixed- Dry

17
OP-22 Score
Water consumption baseline year
Performance Year
Water consumption, performance year
Water per Capita
OP-23 Score
3.11/7.00 124,148,668 Gallons May 2012-April 2013 121,998,828 10,356 2.00/2.00
6.14/7.00 122,552,500 Gallons July 2010-June 2011 104,719,666 6,288 2.00/2.00
0.00/7.00 269,182,005 Gallons July 2011-June 2012 278,154,140 12,559 2.00/2.00
6.09/7.00 49,745,439 Gallons N/A 42,778,695 N/A 2.00/2.00
5.61/7.00 383,895,731 Gallons June 2010- May 2011 451,010,700 30,009 0.00/2.00
2.29/7.00 430,268,134 Gallons Jan. 2012- Dec. 2012 387,438,180 12,859 2.00/2.00
3.92/7.00 49,669,725 Gallons July 2011-June 2012 47,864,104 26,098 2.00/2.00
0.00/7.00 N/A N/A N/A N/A 2.00/2.00
4.15/7.00 621,343,280 Gallons N/A 557,378,644 N/A 1.00/2.00
7.00/7.00 151,161,076 Gallons N/A 139,117,528 N/A 2.00/2.00
1.42/7.00 80,394,292 Gallons Oct. 2012-Sept. 2013 77,544,412 5,044 2.00/2.00
18
University City, State STARS Rating Score
Date submitted
Full-time Enrollment
Institution type
Areas of Cultivated land
Undeveloped land
Climate Region
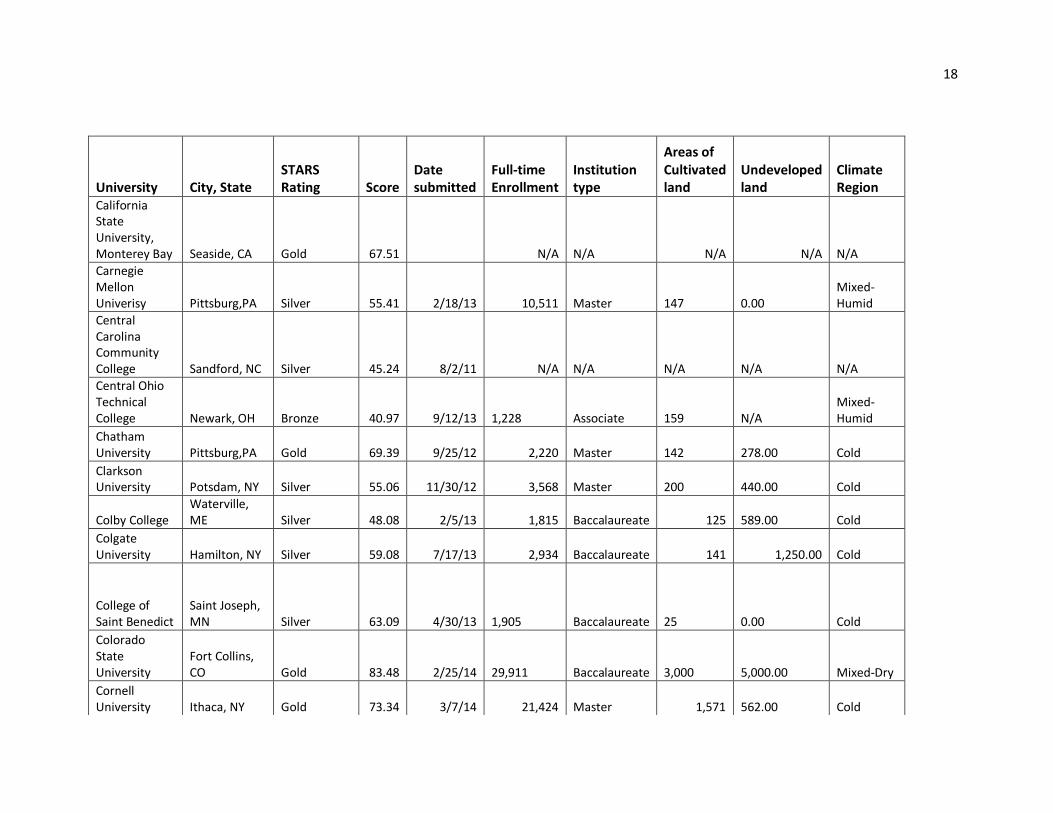
California State University, Monterey Bay Seaside, CA Gold 67.51 N/A N/A N/A N/A N/A
Carnegie Mellon Univerisy Pittsburg,PA Silver 55.41 2/18/13 10,511 Master 147 0.00
Mixed- Humid
Central Carolina Community College Sandford, NC Silver 45.24 8/2/11 N/A N/A N/A N/A N/A
Central Ohio Technical College Newark, OH Bronze 40.97 9/12/13 1,228 Associate 159 N/A
Mixed-Humid
Chatham University Pittsburg,PA Gold 69.39 9/25/12 2,220 Master 142 278.00 Cold
Clarkson University Potsdam, NY Silver 55.06 11/30/12 3,568 Master 200 440.00 Cold
Colby College Waterville, ME Silver 48.08 2/5/13 1,815 Baccalaureate 125 589.00 Cold
Colgate University Hamilton, NY Silver 59.08 7/17/13 2,934 Baccalaureate 141 1,250.00 Cold
College of Saint Benedict
Saint Joseph, MN Silver 63.09 4/30/13 1,905 Baccalaureate 25 0.00 Cold
Colorado State University
Fort Collins, CO Gold 83.48 2/25/14 29,911 Baccalaureate 3,000 5,000.00 Mixed-Dry
Cornell University Ithaca, NY Gold 73.34 3/7/14 21,424 Master 1,571 562.00 Cold

19
OP-22 Score
Water consumption baseline year
Performance Year
Water consumption, performance year
Water per Capita
OP-23 Score
2.11/7.00 39,948,975 Gallons N/A 44,305,630 N/A 2.00/2.00
0.00/7.00 123,907,000 Gallons July 2011-June 2012 198,337,000 18,869 2.00/2.00
0.00/7.00 N/A N/A N/A N/A 2.00/2.00
7.00/7.00 8,529,352 Gallons N/A 7,277,050 5,926 2.00/2.00
7.00/7.00 29,364,000 Gallons Jan. 2010- Dec. 2010 2,574,000 1,159 2.00/2.00
4.22/7.00 37,702,000 Gallons July 2010-June 2011 33,099,000 9,277 2.00/2.00
0.00/7.00 N/A N/A N/A N/A 2.00/2.00
7.00/7.00 113,726,668 Gallons July 2011-June 2012 72,024,172 24,548 2.00/2.00
4.67/7.00 85,000,000 Gallons N/A 70,000,000 36,745 2.00/2.00
3.63/7.00 349,171,320 Gallons July 2012-June 2013 361,670,998 12,092 2.00/2.00
4.76/7.00 475,739,480 Gallons Aug. 2012-Jul.-2013 403,637,505 18,840 2.00/2.00

20
University City, State STARS Rating Score Date submitted
Full-time Enrollment
Institution type
Areas of Cultivated land
Undeveloped land
Climate Region
Dalhousie University Halifax, NS, CA Silver 57.73 8/12/11 N/A N/A N/A N/A N/A
DePauw University Greencastle, IN Silver 53.17 3/4/14 2,390 Baccalaureate 50 520.00
Mixed-Humid
Dickinson College Carlisle, PA Gold 69.73 4/30/12 2,394 Baccalaureate 134 N/A Marine
Duke University Durham, NC Gold 70.54 10/18/13 14,593 Master 1,410 7,060.00 Hot-Humid
Earlham College Richmond, IN Bronze 41.4 5/24/13 1,135 Baccalaureate 200 600.00 Mixed-Dry
Eastern Connecticut State University Willimantic, CT Silver 47.4 11/9/12 4,816 Baccalaureate 102 73.00 Mixed-Dry
Elon University Elon, NC Silver 63.42 2/5/14 5,888 Master 277 N/A Mixed- Humid
Emory University Atlanta, GA Gold 68.69 7/25/11 N/A N/A N/A N/A N/A
Estrella Mountain Community College Avondale, AZ Bronze 35.3 2/10/14 N/A N/A N/A N/A Hot- Dry
Fayetteville State University Fayetteville, NC Reporter ? 2/9/13 5,932 Master 165 29.00
Mixed- Humid
Fleming College Lindsay, ON,CA Bronze 39.32 3/20/13 6,001 N/A 141 321.00 Cold
Florida Gulf Coast University Fort Myers, FL Silver 46.5 7/28/11 N/A N/A N/A N/A N/A
Florida State University Tallahassee, FL Silver 50.21 8/1/11 N/A N/A N/A N/A N/A
Frostburg State University Frostburg, MD Silver 52.35 5/16/13 4,876 Baccalaureate 71 130.00
Mixed- Humid

21
OP-22 Score Water consumption baseline year Performance Year
Water consumption, performance year
Water per Capita
OP-23 Score
2.37/7.00 296,934,933 Gallons N/A 284,313,056 N/A 2.00/2.00
3.64/7.00 63,277,500 Gallons N/A 54,075,000 22,626 2.00/2.00
6.31/7.00 41,298,112 Gallons June 2010- July 2011 30,597,750 12,781 2.00/2.00
2.49/7.00 497,927,144 Gallons July 2012-June 2013 445,091,650 30,500 2.00/2.00
0.00/7.00 22,917,319.48 Gallons July 2009-June 2010 45,462,109.09 40,055 2.00/2.00
0.00/7.00 N/A N/A N/A N/A 2.00/2.00
3.43/7.00 46,408,816 Gallons June 2012-May 2013 50,485,316 8,574 2.00/2.00
3.98/7.00 274,574,000 Gallons N/A 253,871,000 N/A 2.00/2.00
0.00/7.00 N/A N/A N/A N/A 1.00/2.00
N/A N/A N/A N/A N/A N/A
7.00/7.00 70,662 gallons N/A 42,757 7 0.00/2.00
.92/7.00 18,227,000 Gallons N/A 29,498,000 N/A 2.00/2.00
7.00/7.00 163,931,403 Gallons N/A 104,292,790 N/A 2.00/2.00
4.28/7.00 30,129,950 Gallons N/A 26,576,800 5,451 1.00/2.00

22
University City, State STARS Rating Score
Date submitted
Full-time Enrollment
Institution type
Areas of Cultivated land
Undeveloped land
Climate Region
Furman University Greenville, SC Silver 61.37 1/31/13 2,692 Baccalaureate 350 N/A
Mixed- Humid
George Mason University Fairfax, VA Silver 51.98 8/9/11 N/A` N/A N/A N/A N/A
Green Mountain College Poultney, VT Gold 73.16 7/29/11 N/A N/A N/A N/A N/A
Haverford College Haverford, PA Bronze 37.45 7/28/11 N/A N/A N/A N/A N/A
Indiana University Bloomington
Bloomington, IN Silver 51.69 1/5/11 N/A N/A N/A N/A N/A
Ithaca College Ithaca, NY Gold 68.05 11/20/13 5,581 Baccalaureate 351 317.50 Cold
Jefferson Community and Technical College Louisville, KY Silver 58.8 1/31/14 9,921 Associate 96 73.67
Mixed-Humid
King's University
Edmonton, AB,CA silver 52.43 11/27/12 637 Baccalaureate N/A N/A N/A
Lakeland Community College Kirtland, OH Reporter ? 6/1/11 N/A N/A N/A N/A N/A
Lawrence University Appleton, WI Silver 54.97 6/17/13 1,500 Baccalaureate 55 400.00
Mixed-Humid
Luther College Decorah, IA Silver 50.9 7/29/11 N/A N/A N/A N/A N/A
Macalester college Saint Paul, MN Silver 61.9 7/19/11 N/A N/A N/A N/A N/A

23
OP-22 Score
Water consumption baseline year
Performance Year
Water consumption, performance year
Water per Capita
OP-23 Score
6.39/7.00 110,637,900 Gallons July 2011-June 2012 88,091,900 32,724 2.00/2.00
0.00/7.00 133,082 Gallons N/A 166,254 N/A 2.00/2.00
2.65/7.00 6,928,097 Gallons N/A 7,057,006 N/A 2.00/2.00
1.92/7.00 35,800 Gallons N/A 33,468 N/A 2.00/2.00
4.64/7.00 667,000,000 Gallons N/A 589,000,000 N/A 2.00/2.00
0.00/7.00 135,000,000 Gallons June 2012-May 2013 162,262,500 29,074 2.00/2.00
7.00/7.00 13,431.50 Gallons Jan. 2011- Dec. 2011 9,319.50 1 2.00/2.00
0.00/7.00 N/A N/A N/A N/A 0.00/2.00
N/A N/A N/A N/A N/A N/A
6.25/7.00 74,169 Gallons Jan. 2012- Dec. 2012 53,598 36 2.00/2.00
5.20/7.00 53,319,497 Gallons N/A 41,129,835 N/A 2.00/2.00
1.53/7.00 30,849,764 Gallons N/A 30,427,144 N/A 2.00/2.00

24
University City, State STARS Rating Score
Date submitted
Full-time Enrollment
Institution type
Areas of Cultivated land
Undeveloped land
Climate Region
Maryville College Maryville, TN Bronze 32.91 1/18/12 N/A N/A N/A N/A N/A
Miami University Oxford, OH Silver 45.39 3/6/13 16,210 Master 650 915.00
Mixed-Humid
Michigan State University
East Lansing, MI Silver 52.15 4/14/11 N/A N/A N/A N/A N/A
Middlebury College
Middlebury, VT Gold 66.9 1/31/11 N/A N/A N/A N/A N/A
Mills College Oakland, CA Silver 49.21 2/5/13 1,546 Master 90 35.00 Marine
Missouri University Of Science and Technology Rolla, MO Silver 49.24 9/10/12 7,522 Baccalaureate 236 N/A
Mixed-Humid
Moraine Valley Community College Palos Hills, IL Bronze 42.27 1/28/11 N/A N/A N/A N/A N/A
Mount Holyoke College
South Hadley, MA Silver 47.19 9/6/12 N/A Baccalaureate 175 541.00 Cold
Muhlenberg College Allentown, PA Bronze 33.11 6/25/13 2,154 Baccalaureate 82 184.00 Marine Niagara College of Applied Arts and Technology
Welland, ON, CA Bronze 35.74 10/3/13 N/A N/A N/A N/A
Mixed-Humid

25
OP-22 Score
Water consumption baseline year
Performance Year
Water consumption, performance year
Water per Capita
OP-23 Score
0.00/7.00 N/A N/A N/A N/A 1.00/2.00
.95/7.00 216,093,460 Gallons July 2011-June 2012 212,880,050 13,133 2.00/2.00
5.37/2.00 2,047,555,000 Gallons N/A 1,670,408,000 N/A 2.00/2.00
7.00/7.00 75,000,000 Gallons N/A 52,786,697 N/A 2.00/2.00
7.00/7.00 35,716,242 Gallons June 2011-june 2012 25,950,526 16,786 0.00/2.00
4.01/7.00 97,454,000 Gallons July 2010-June 2011 92,454,000 12,291 2.00/2.00
0.00/7.00 N/A N/A N/A N/A 2.00/2.00
3.22/7.00 35,519,902 Gallons N/A 33,801,118 N/A 2.00/2.00
0.00/7.00 34,773,330 Gallons 2010-2011 36,562,100 16,974 2.00/2.00
0.00/7.00 N/A N/A N/A N/A 2.00/2.00

26
University City, State STARS Rating Score
Date submitted
Full-time Enrollment
Institution type
Areas of Cultivated land
Undeveloped land
Climate Region
Northern Arizona University Flagstaff, AZ Gold 66.39 10/8/12 18,292 Baccalaureate N/A N/A Mixed- Dry
Okanagan College
Kelowna, BC,CA Silver 48.72 7/19/11 N/A N/A N/A N/A N/A
Oklahoma State University Stillwater, OK Bronze 27.67 1/13/12 N/A N/A N/A N/A N/A
Oregon State University
Klamath Falls, OR Bronze 39.89 12/13/11 N/A N/A N/A N/A N/A
Pace University Pleasantville, NY Bronze 31.41 8/19/11 N/A N/A N/A N/A N/A
Pennsylvania State University
University Park, PA Silver 58.79 7/29/11 N/A N/A N/A N/A N/A
Pomona College Claremont, CA Gold 65.14 6/3/11 N/A N/A N/A N/A N/A
Portland State University Portland, OR Gold 73.12 2/21/14 20,226 Doctorate N/A N/A Marine
Purdue University
West Lafayette, IN Silver 50.16 3/27/13 36,193 Baccalaureate 2,602 N/A
Mixed-Humid
Raritan Valley Community College
North Branch, NJ Bronze 36.09 8/5/11 N/A N/A N/A N/A N/A
Rio Salado College Tempe, AZ Silver 53.98 8/12/11 N/A N/A N/A N/A N/A
Rochester Institute of Technology Rochester, NY Silver 56.75 7/29/13 14,573 Baccalaureate 200 179.00
Mixed-Humid

27
OP-22 Score
Water consumption baseline year
Performance Year
Water consumption, performance year
Water per Capita
OP-23 Score
3.90/7.00 206,235,408 Gallons July 2011-June 2012 240,745,708 13,161 2.00/2.00
4.05/7.00 16,027,523 Gallons N/A 14,870,506 N/A 2.00/2.00
0.88/7.00 419,010 Gallons N/A 401,207 N/A 2.00/2.00
5.99/7.00 53,678 Gallons N/A 56,933 N/A 2.00/2.00
0.04/7.00 N/A N/A N/A N/A 0.00/7.00
4.12/7.00 995,368,965 Gallons N/A 891,615,973 N/A 2.00/2.00
4.44/7.00 105,205,278 Gallons N/A 85,135,938 N/A 2.00/2.00
7.00/7.00 157,204,613 Gallons 2012-2013 94,238,765 4,659 2.00/2.00
2.51/7.00 1,464,466,323 Gallons 2011-2012 1,346,840,950 37,213 2.00/2.00
0.00/7.00 N/A N/A N/A N/A 2.00/2.00
0.00/7.00 N/A N/A N/A N/A 2.00/2.00
6.17/7.00 198,780,868.70 Gallons 2011-2012 170,453,000 11,696 2.00/2.00

28
University City, State STARS Rating Score
Date submitted
Full-time Enrollment
Institution type
Areas of Cultivated land
Undeveloped land
Climate Region
Royal Roads University
Victoria, BC, CA Silver 59.04 9/14/10 N/A N/A N/A N/A N/A
Saint Louis University
Saint Louis, MO Bronze 39.16 10/9/11 N/A N/A N/A N/A N/A
Santa Clara University
Santa Clara, CA Silver 61.88 1/23/11 N/A N/A N/A N/A N/A
Sewanee - The University of the South Sewanee, TN Silver 47.92 6/20/13 1,557 Doctorate 450 12,554.00
Mixed-Humid
Simon Fraser University
Burnaby, BC, CA Silver 47.43 5/3/11 N/A N/A N/A N/A N/A
Southern Illinois University Edwardsville
Edwardsville, IL Bronze 32.25 3/22/13 10,160 Baccalaureate 1,600 1,060.00
Mixed-Humid
Southern Oregon University Ashland, OR Silver 59.16 2/6/14 4,572 Master N/A N/A Marine
St. John's University Queens, NY Gold 66.03 4/27/12 21,354 Baccalaureate 105 N/A N/A
St. Lawrence University Cantan, NY Silver 47.43 8/28/13 2,398 Master 200 800.00 Cold
Stanford University Stanford, CA Gold 68.39 6/29/12 15,666 Baccalaureate N/A 4,908.00 Mixed-Dry
State University of New York at Fredonia Fredonia, NY Bronze 34.69 1/31/11 N/A N/A N/A N/A N/A

29
OP-22 Score
Water consumption baseline year
Performance Year
Water consumption, performance year
Water per Capita
OP-23 Score
0.00/7.00 N/A N/A N/A N/A 0.00/0.00
7.00/7.00 2,573,433 Gallons N/A 1,923,241 N/A 0.00/0.00
2.30/7.00 120,989,174.02 Gallons N/A 121,332,529.86 N/A 2.00/2.00
0.97/7.00 19,906,650 Gallons Jan. 2012- Dec. 2012 19,753,151 12,687 2.00/2.00
3.25/7.00 177,392,844 Gallons N/A 180,144,460 N/A 2.00/2.00
7.00/7.00 113,919 Gallons 2010-2011 78,965 8 2.00/2.00
4.29/7.00 70,464,503.71 Gallons 2011-2012 65,729,589.22 14,377 2.00/2.00
6.95/7.00 2,000,000 Gallons 2009-2010 1,426,639.79 67 2.00/2.00
7.00/7.00 32,118,022 Gallons July 2012-June 2013 10,181,500 4,246 2.00/2.00
1.56/7.00 1,175,231,000 Gallons July 2010-June 2011 1,166,060,000 74,433 2.00/2.00
0.00/7.00 N/A N/A N/A N/A 2.00/2.00

30
University City, State STARS Rating Score
Date submitted
Full-time Enrollment
Institution type
Areas of Cultivated land
Undeveloped land
Climate Region
State University of New York at Geneseo Geneseo, NY Silver 46.38 2/26/13 5,435 Baccalaureate N/A N/A N/A
The Ohio State University Columbus, OH Silver 59.1 12/16/12 N/A Master N/A N/A
Mixed-Humid
The Ohio State University at Lima Lima, OH Silver 47.56 1/21/14 942 Master 60 505.00
Mixed-Humid
The Ohio State University at Mansfield Mansfield, OH Silver 47.53 1/14/14 1,060 Master 32 582.00
Mixed-Humid
The Ohio State University at Marion Marion, OH Silver 51.84 1/2/14 1,050 Master 49 123.42
Mixed-Humid
The Ohio State University at Newark Newark, OH Silver 48.43 9/12/13 2,478 Master 159 N/A
Mixed-Humid
Thompson Rivers University
Kamloops, BC,CA Silver 48.57 12/19/11 N/A N/A N/A N/A N/A
Tuffs University Medford, MA Silver 62.73 8/1/11 N/A N/A N/A N/A N/A
Universidad de Monterrey
San Pedro Garza Garcia, NL,MX Reporter
University of Alberta
Edmonton, AB, CA Silver 61.6 2/3/12 N/A N/A N/A N/A N/A
University of Arkansas
Feyetteville, AR Silver 60.32 2/14/14 22,225 Baccalaureate 519.03 121.67
Mixed-Humid

31
OP-22 Score
Water consumption baseline year
Performance Year
Water consumption, performance year
Water per Capita
OP-23 Score
4.65/7.00 60,931,038 Gallons Jan. 2012- Dec. 2012 50,929,319 9,371 2.00/2.00
0.00/7.00 N/A N/A N/A N/A 2.00/2.00
3.51/7.00 6,996,529.40 Gallons July 2011-June 2012 7,608,435.87 8,077 2.00/2.00
6.05/7.00 4,246,690.64 Gallons July 2011-June 2012 3,059,532.27 2,886 2.00/2.00
0.00/7.00 N/A N/A N/A N/A 2.00/2.00
7.00/7.00 8,529,352 Gallons July 2011-June 2012 7,277,050 2,937 2.00/2.00
0.00/7.00 N/A N/A N/A N/A 0.00/0.00
0.76/7.00 76,604,915 Gallons N/A 77,697,004 N/A 1.00/2.00
N/A
3.35/7.00 493,255,980 Gallons N/A 459,978,755 N/A 2.00/2.00
7.00/7.00 398,708,610 Gallons July 2012-June 2013 234,589,850 10,555 2.00/2.00
32
University City, State STARS Rating Score
Date submitted
Full-time Enrollment
Institution type
Areas of Cultivated land
Undeveloped land
Climate Region
University of British Columbia
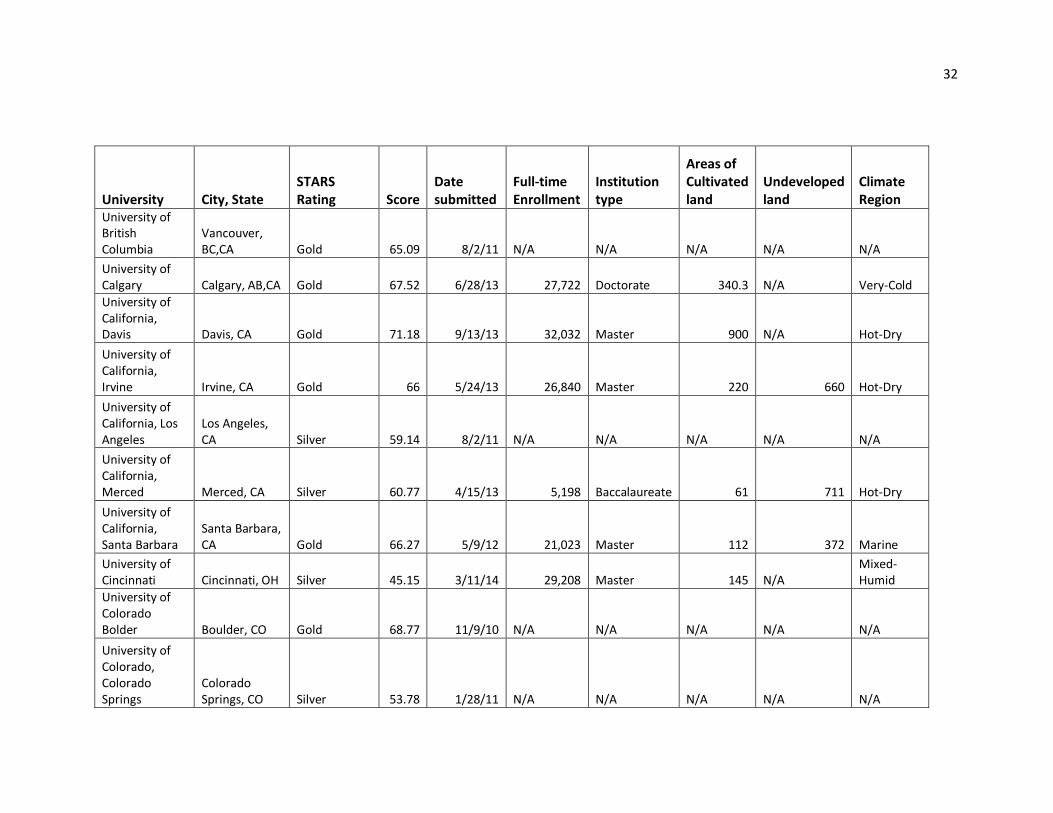
Vancouver, BC,CA Gold 65.09 8/2/11 N/A N/A N/A N/A N/A
University of Calgary Calgary, AB,CA Gold 67.52 6/28/13 27,722 Doctorate 340.3 N/A Very-Cold
University of California, Davis Davis, CA Gold 71.18 9/13/13 32,032 Master 900 N/A Hot-Dry
University of California, Irvine Irvine, CA Gold 66 5/24/13 26,840 Master 220 660 Hot-Dry
University of California, Los Angeles
Los Angeles, CA Silver 59.14 8/2/11 N/A N/A N/A N/A N/A
University of California, Merced Merced, CA Silver 60.77 4/15/13 5,198 Baccalaureate 61 711 Hot-Dry
University of California, Santa Barbara
Santa Barbara, CA Gold 66.27 5/9/12 21,023 Master 112 372 Marine
University of Cincinnati Cincinnati, OH Silver 45.15 3/11/14 29,208 Master 145 N/A
Mixed-Humid
University of Colorado Bolder Boulder, CO Gold 68.77 11/9/10 N/A N/A N/A N/A N/A
University of Colorado, Colorado Springs
Colorado Springs, CO Silver 53.78 1/28/11 N/A N/A N/A N/A N/A

33
OP-22 Score
Water consumption baseline year
Performance Year
Water consumption, performance year
Water per Capita
OP-23 Score
7.00/7.00 1,031,394,988 Gallons N/A 762,415,338 N/A 2.00/2.00
7.00/7.00 406,990,658.90 Gallons
April 2012- March 2013 308,739,496.55 11,137 2.00/2.00
4.69/7.00 1,103,845,000 Gallons July 2010-June 2011 984,119,000 30,723 2.00/2.00
4.93/7.00 690,503,484 Gallons Jan. 2011-Dec. 2011 597,188,988 22,250 2.00/2.00
0.00/7.00 589,508,505 Gallons N/A 648,615,402 N/A 2.00/2.00
7.00/7.00 51,289,592 Gallons 2010-2011 68,398,688 13,159 2.00/2.00
2.03/7.00 232,240,956 Gallons Jan. 2010-Dec. 2010 234,657,912 11,162 2.00/2.00
5.18/7.00 633,686,480 Gallons July 2012-June 2013 534,858,856 18,312 2.00/2.00
5.65/7.00 313,695,000 Gallons N/A 245,685,000 N/A 2.00/2.00
2.13/7.00 33,154,696 Gallons N/A 34,342,610 N/A 2.00/2.00

34
University City, State STARS Rating Score
Date submitted
Full-time Enrollment
Institution type
Areas of Cultivated land
Undeveloped land
Climate Region
University of Connecticut Storrs, CT Reporter
University of Dayton Dayton, OH Silver 45.46 1/31/14 8,900 Doctorate 317 N/A N/A
University of Denver Dever, CO Gold 65.74 7/20/11 N/A N/A N/A N/A N/A
University of Florida Gainesville, FL Silver 62.51 1/31/11 N/A N/A N/A N/A N/A
University of Houston Houston, TX, Silver 54.31 2/3/11 N/A N/A N/A N/A N/A
University of Illinois at Chicago Reporter
University of Illinois, Urbana-Champaign
Urbana Champaign, IL Gold 74.51 7/31/13 44,197 Doctorate 1,700 4,500
Mixed-Humid
University of Massachusetts Amherst Amherst, MA Gold 70.93 1/31/14 26,746 Master N/A N/A Cold
University of Minnesota, Duluth Duluth, MN Reporter
University of Minnesota, Twin cities Minneapolis Silver 64.54 10/25/12 45,809 Baccalaureate N/A N/A Cold
University of Montana Missoula, MT Silver 49.07 3/21/14 13,643 Master 50 N/A Cold

35
OP-22 Score
Water consumption baseline year
Performance Year
Water consumption, performance year
Water per Capita
OP-23 Score
N/A
0.00/7.00 N/A N/A N/A N/A 2.00/2.00
3.55/7.00 114,102,456 Gallons N/A 109,035,000 N/A 2.00/2.00
6.41/7.00 1,431,700,000 Gallons N/A 1,075,036,000 N/A 2.00/2.00
4.88/7.00 429,528,000 Gallons N/A 371,627,000 N/A 2.00/2.00
N/A
7.00/7.00 1,470,345,000 Gallons July 2011-June 2012 1,023,235,000 23,152 2.00/2.00
7.00/7.00 382,000,000 Gallons July 2010-June 2011 223,864,836 8,370 2.00/2.00
N/A
2.82/7.00 631,677,522 Gallons July 2010-June 2011 561,618,596 12,260 2.00/2.00
2.59/7.00 223,854 Gallons Jan. 2013-Dec. 2013 239,209 18 2.00/2.00

36
University City, State STARS Rating Score
Date submitted
Full-time Enrollment
Institution type
Areas of Cultivated land
Undeveloped land
Climate Region
University of Mount Union
Mount Union,OH Bronze 40.28 4/27/11 N/A N/A N/A N/A N/A
University of New Hampshire Durham, NH Gold 67.29 8/2/11 N/A N/A N/A N/A N/A
University of North Carolina at Chapel Hill Chapel Hill, NC Silver 53.11 1/31/11 N/A N/A N/A N/A N/A
University of North Carolina at Greensboro
Greensboro, NC Silver 61.73 2/28/14 15,683 Baccalaureate 230 25
Mixed-Humid
University of North Texas Denton, TX Silver 54.45 1/26/12 N/A N/A N/A N/A N/A
University of Notre Dame
Notre dame, IN Silver 57.85 8/17/11 N/A N/A N/A N/A N/A
University of Ottawa
Ottawa, ON, CA Silver 58.86 4/10/13 42,027 Master 105 0 Cold
University of Richmond Richmond, VA Silver 48.95 2/18/13 3,868 Baccalaureate 326 53
Mixed-Humid
University of South Florida Tampa, FL Gold 75.37 1/14/14 41,047 Doctorate 600 44 Hot-Humid
University of Texas at Arlington Arlington, TX Silver 46.66 2/1/13 229,117 Master N/A N/A Hot-Dry
University of Texas at Austin Austin, TX Silver 51.19 1/31/11 N/A N/A N/A N/A N/A
University of Utah
Salt Lake City, UT Bronze 35.74 8/11/11 N/A N/A N/A N/A N/A
University of Vermont Burlington, VT Gold 65.35 3/19/14 12,723 Doctorate 861 3,395 Cold
37
OP-22 Score
Water consumption baseline year
Performance Year
Water consumption, performance year
Water per Capita
OP-23 Score
0.00/7.00 N/A N/A N/A N/A 2.00/2.00
0.00/7.00 N/A N/A N/A N/A 2.00/2.00
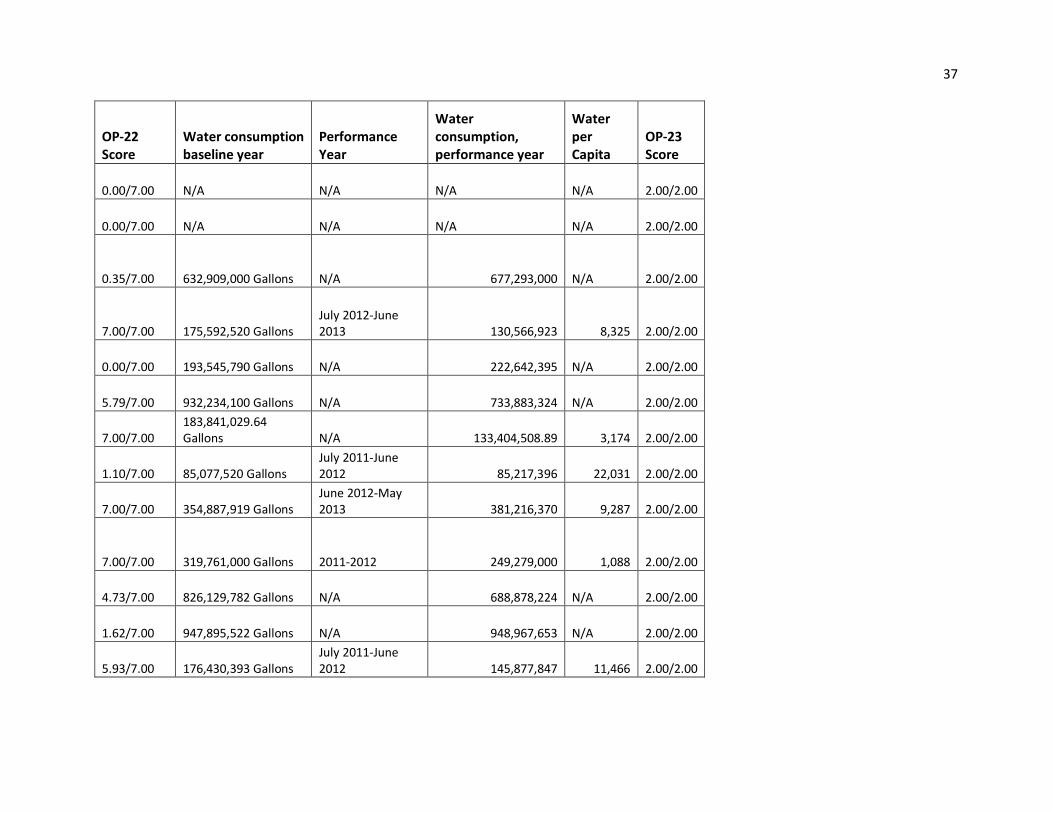
0.35/7.00 632,909,000 Gallons N/A 677,293,000 N/A 2.00/2.00
7.00/7.00 175,592,520 Gallons July 2012-June 2013 130,566,923 8,325 2.00/2.00
0.00/7.00 193,545,790 Gallons N/A 222,642,395 N/A 2.00/2.00
5.79/7.00 932,234,100 Gallons N/A 733,883,324 N/A 2.00/2.00
7.00/7.00 183,841,029.64 Gallons N/A 133,404,508.89 3,174 2.00/2.00
1.10/7.00 85,077,520 Gallons July 2011-June 2012 85,217,396 22,031 2.00/2.00
7.00/7.00 354,887,919 Gallons June 2012-May 2013 381,216,370 9,287 2.00/2.00
7.00/7.00 319,761,000 Gallons 2011-2012 249,279,000 1,088 2.00/2.00
4.73/7.00 826,129,782 Gallons N/A 688,878,224 N/A 2.00/2.00
1.62/7.00 947,895,522 Gallons N/A 948,967,653 N/A 2.00/2.00
5.93/7.00 176,430,393 Gallons July 2011-June 2012 145,877,847 11,466 2.00/2.00

38
University City, State STARS Rating Score
Date submitted
Full-time Enrollment
Institution type
Areas of Cultivated land
Undeveloped land
Climate Region
University of Washington, Seattle Seattle, WA Gold 70.23 10/17/12 43,307 Master 139 110 Marine
University of Wisconsin-Green Bay Green Bay, WI Silver 49.62 9/15/11 N/A N/A N/A N/A N/A
University of Wisconsin-Oshkosh Oshkosh, WI Gold 67.35 4/25/13 9,560 Master 131 49 Cold
University of Wisconsin- River Falls River Falls Silver 58.09 4/15/13 5,568 Master 226 N/A Cold
University of Wisconsin- Stevens Point
Stevens Point, WI Gold 68.81 7/17/12 8,498 Baccalaureate 71 2,392 Cold
Université Laval Quebec, QC, CA Gold 73.28 1/24/14 40,515 Doctorate N/A N/A Very-Cold
Virginia Commonwealth University Richmond, VA Silver 51.13 7/25/12 28,775 Baccalaureate 68 578
Mixed-Humid
Virginia Tech Blacksburg, VA Silver 63.3 3/19/13 31,342 Baccalaureate N/A N/A Mixed- Humid
Wartburg College Waverly, IA Silver 55.23 3/5/14 1,680 Baccalaureate 160 5 Cold
Washington University in St. Louis Saint Louis, MO Silver 53.15 8/6/11 N/A N/A N/A N/A N/A
Weber State University Ogden, UT Bronze 30.98 9/20/11 N/A N/A N/A N/A N/A

39
OP-22 Score
Water consumption baseline year
Performance Year
Water consumption, performance year
Water per Capita
OP-23 Score
4.79/7.00 501,706,532 Gallons Jan. 2011- Dec. 2011 425,263,430 9,820 2.00/2.00
0.90/7.00 48,785,201 Gallons N/A 48,785,201 N/A 2.00/2.00
7.00/7.00 65,665,325 Gallons Jan. 2011- Dec. 2011 48,893,422 5,114 2.00/2.00
1.00/7.00 42,129,500 Gallons Jan. 2012- Dec. 2012 38,578,100 6,929 2.00/2.00
0.00/7.00 9,141,197 Gallons July 2010-June 2011 9,753,700 1,148 2.00/2.00
6.17/7.00 222,077,900 Gallons May 2011-April 2012 173,616,520 4,285 2.00/2.00
0.00/7.00 306,639,000 Gallons 2010-2011 364,669,000 12,673 2.00/2.00
0.00/7.00 307,043,287 Gallons Jan. 2011-Dec. 2011 441,333,886 14,081 2.00/2.00
0.00/7.00 2,220,148 Gallons Jun. 2012-May 2013 2,196,613 1,308 2.00/2.00
0.00/7.00 N/A N/A N/A N/A 2.00/2.00
2.48/7.00 41,656,400 Gallons N/A 46,797,202 N/A 2.00/2.00
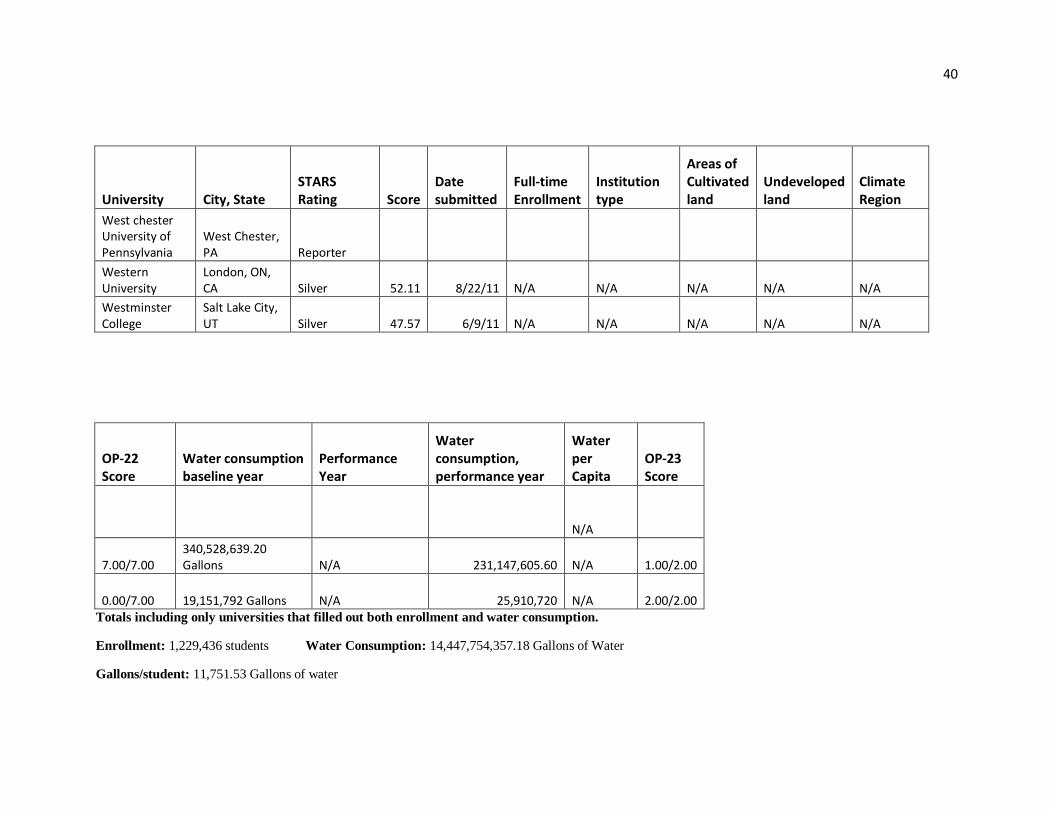
40
University City, State STARS Rating Score
Date submitted
Full-time Enrollment
Institution type
Areas of Cultivated land
Undeveloped land
Climate Region
West chester University of Pennsylvania
West Chester, PA Reporter
Western University
London, ON, CA Silver 52.11 8/22/11 N/A N/A N/A N/A N/A
Westminster College
Salt Lake City, UT Silver 47.57 6/9/11 N/A N/A N/A N/A N/A
OP-22 Score
Water consumption baseline year
Performance Year
Water consumption, performance year
Water per Capita
OP-23 Score
N/A
7.00/7.00 340,528,639.20 Gallons N/A 231,147,605.60 N/A 1.00/2.00
0.00/7.00 19,151,792 Gallons N/A 25,910,720 N/A 2.00/2.00 Totals including only universities that filled out both enrollment and water consumption.
Enrollment: 1,229,436 students Water Consumption: 14,447,754,357.18 Gallons of Water
Gallons/student: 11,751.53 Gallons of water

41
Appendix 3c
University Bottle Fillers
Trayless Dining
Rainwater capture program
water efficient irrigation
green roof
bio retention
ponds
rain gardens
porous paving
Retention Ponds
Stone Swales
Vegetated Swales
Greywater reuse
system
Low water
fixtures
American University
X x x x x(8) x x
Appalachian State University
x x x(3) x x x
Arizona State University
x x x
Ball State University
x x Bard College x x x Baylor University x Boston University x x x Bowdoin College x x x x Byrant University x California State Polytechnic University, Pomona
x
University Bottle Fillers
Trayless Dining
Rainwater capture program
water efficient irrigation
green roof
Bio retention ponds
rain gardens
porous paving
Retention Ponds
Stone Swales
Vegetated Swales
Greywater reuse
system
Low water
fixtures

42
California State University , Channel Islands
x
California State University, Chico
x x x
California State University, Monterey Bay
Carnegie Mellon Univerisy
x x x
Central Carolina Community College
x x x
Central Ohio Technical College
x x
Chatham University
x x x x
Clarkson University
x x x x
Colby College x x x
Colgate University
x x x x College of Saint Benedict
x

43
University Bottle Fillers
Trayless Dining
Rainwater capture program
water efficient irrigation
green roof
Bio retention
ponds
rain gardens
porous paving
Retention Ponds
Stone Swales
Vegetated Swales
Greywater reuse
system
Low water
fixtures
Colorado State University
x Cornell University x x X x x x
Dalhousie University
X x x x
DePauw University
x(5) x
Dickinson College X x
Duke University x
Earlham College x X x
Eastern Connecticut State University
x x x
Elon University x x x
Emory University Estrella Mountain Community College
x x
Fayetteville State University
Fleming College
Florida Gulf Coast University
X x x
Florida State University
x x x
44
University Bottle Fillers
Trayless Dining
Rainwater capture program
water efficient irrigation
green roof
Bio retention
ponds
rain gardens
porous paving
Retention Ponds
Stone Swales
Vegetated Swales
Greywater reuse
system
Low water
fixtures
Frostburg State University
x x(3) x x
Furman University
X x x x
George Mason University
x X x x x
Grand Valley University
x x x
Green Mountain College
x x x x x x
Haverford College
x X x x x Indiana University Bloomington
x x X x
Ithaca College x x(5) X x x x
Jefferson Community and Technical College
x X x x
King's University
Lakeland Community College
Lawrence University
x x
Loyola University Chicago
x x x x
Luther College x x x

45
University Bottle Fillers
Trayless Dining
Rainwater capture program
water efficient irrigation
green roof
Bio retention ponds
rain gardens
porous paving
Retention Ponds
Stone Swales
Vegetated Swales
Grey water reuse
system
Low water
fixtures
Macalester college
x X x Maryville College x x x Miami University
Michigan State University
x x x X x x
Middlebury College
x x X x x x
Mills College
Missouri University Of Science and Technology
X x x x
Moraine Valley Community College
X x
Mount Holyoke College
x x
Muhlenberg College
x x Niagara College of Applied Arts and Technology
x x

46
University Bottle Fillers
Trayless Dining
Rainwater capture program
water efficient irrigation
green roof
Bio retention ponds
rain gardens
porous paving
Retention Ponds
Stone Swales
Vegetated Swales
Greywater reuse
system
Low water
fixtures
Northern Arizona University
x x
Okanagan College x x x x Oklahoma State University
x x
Oregon State University
x x x x Pace University
Pennsylvania State University
x(5) x x x
Pomona College x x Portland State University
x x x
Purdue University
x x x
Raritan Valley Community College
Rio Salado College
x x
Rochester Institute of Technology

47
University Bottle Fillers
Trayless Dining
Rainwater capture program
water efficient irrigation
green roof
Bio retention ponds
rain gardens
porous paving
Retention Ponds
Stone Swales
Vegetated Swales
Greywater reuse
system
Low water
fixtures
Royal Roads University
Saint Louis University
Santa Clara University
x X x
Sewanee - The University of the South
x X x x x
Simon Fraser University
x X x x x
Slippery Rock University
x x x x Southern Illinois University Edwardsville
x x x
Southern Oregon University
x x x
St. John's University
X
St. Lawrence University
x x x x
Stanford University
x X x x x
State University of New York at Fredonia
x x

48
University Bottle Fillers
Trayless Dining
Rainwater capture program
water efficient irrigation
green roof
bioretention ponds
rain gardens
porous paving
Retention Ponds
Stone Swales
Vegetated Swales
Greywater reuse
system
Low water
fixtures
State University of New York at Geneseo
The Ohio State University
x X x x
The Ohio State University at Lima
x x x
The Ohio State University at Mansfield
x x x
The Ohio State University at Marion
x x
The Ohio State University at Newark
x x x
Thompson Rivers University
Tuffs University x x
Universidad de Monterrey
University of Alberta
x x X x x
University of Arkansas
x x X x x
University of
British Columbia x X x x x

49
University Bottle Fillers
Trayless Dining
Rainwater capture program
water efficient irrigation
green roof
Bio retention ponds
rain gardens
porous paving
Retention Ponds
Stone Swales
Vegetated Swales
Greywater reuse
system
Low water
fixtures
University of Calgary
x x x x University of California, Davis
x x x x x x
University of California, Irvine
x x
University of California, Los Angeles
University of California, Merced
x x x x
University of California, Santa Barbara
x x x x x x x
University of Cincinnati
x x x x x University of Colorado Bolder
x x x x
University of Colorado, Colorado Springs
x x x
University of Connecticut
University of Dayton
x x x x

50
University Bottle Fillers
Trayless Dining
Rainwater capture program
water efficient irrigation
green roof
bioretention ponds
rain gardens
porous paving
Retention Ponds
Stone Swales
Vegetated Swales
Greywater reuse
system
Low water
fixtures
University of Denver
x X x
University of Florida
x X x x
University of Houston
x University of Illinois at Chicago
University of Illinois, Urbana-Champaign
x x X x x
University of Massachusetts Amherst
x
X x x x
University of Minnesota, Duluth
University of Minnesota, Twin cities
x x X x x x
University of Missouri, Kansas City
x(2) x(5)
University of Montana
X
University of Mount Union
X x x

51
University Bottle Fillers
Trayless Dining
Rainwater capture program
water efficient irrigation
green roof
bioretention ponds
rain gardens
porous paving
Retention Ponds
Stone Swales
Vegetated Swales
Greywater reuse
system
Low water
fixtures
University of New Hampshire
x X x
University of North Carolina at Chapel Hill
x X x x x
University of North Carolina at Greensboro
x x x x x x
University of North Texas
X x
University of Notre Dame
x x
University of Ottawa
x x x x x
University of Richmond
x x x
University of South Florida
x X x x x
University of Texas at Arlington
x X
University of Texas at Austin
University of Utah
x x X x x
University of Vermont
x(4) X x x x
University of Victoria
x x x

52
University Bottle Fillers
Trayless Dining
Rainwater capture program
water efficient irrigation
green roof
bioretention ponds
rain gardens
porous paving
Retention Ponds
Stone Swales
Vegetated Swales
Greywater reuse
system
Low water
fixtures
University of Washington, Seattle
x x x(2) x
University of Wisconsin-Green Bay
x x x
University of Wisconsin-Oshkosh
x x x
University of Wisconsin- River Falls
X x x x
University of Wisconsin- Stevens Point
x x x x
Université Laval
Virginia Commonwealth University
x x x X x x
Virginia Tech x x X x x x
Wartburg College x x
Washington University in St. Louis
x x X x x
Weber State University
x
West chester University of Pennsylvania Western University x X Westminster College X x x Wilfrid Laurier University x x

53
For the above graph in appendix 3c, an x means the university has the desired item. If they mentioned they had more in the report it has ( ) around the total number they have. These x’s does not mean that they have a great one in progress or even one that is used throughout campus. Some of them include research practices which could be not bigger than a parking space. Also I put an x next to the university if they were practicing anything like it. For example if they had a rain water catching system at all then they would get an x.