Water Balance of a Rain Garden - Schuykill Action Network
23
Andrea L. Welker, PhD, PE, ENV SP, F.ASCE Water Balance of a Rain Garden 1
Transcript of Water Balance of a Rain Garden - Schuykill Action Network

Andrea L. Welker, PhD, PE, ENV SP, F.ASCE
Water Balance of a Rain Garden
1
Outcomes
2
DESCRIBE WHAT A RAIN IS AND DOES
DESCRIBE WATER BUDGET OF RAIN GARDEN ON VILLANOVA’S CAMPUS

Outline
• What is a rain garden?• Research Question• Site Background• Method• Results• Design Application
3
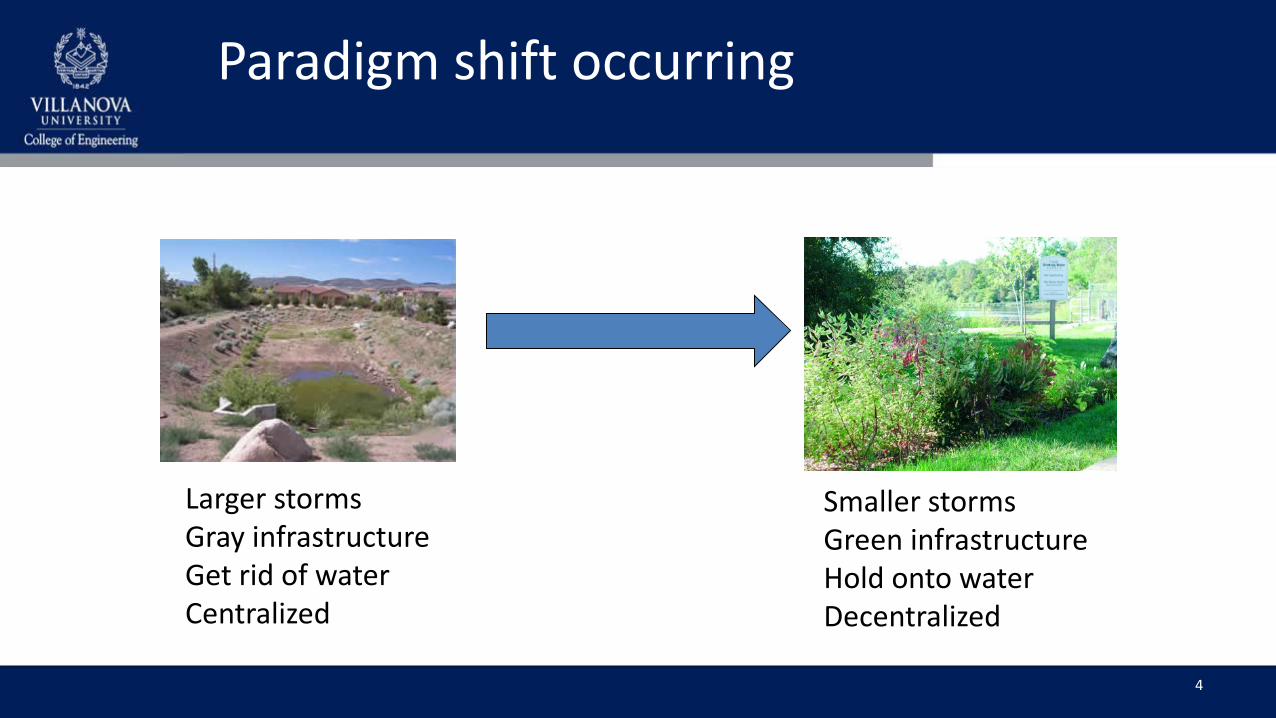
Larger stormsGray infrastructureGet rid of waterCentralized
Smaller stormsGreen infrastructureHold onto waterDecentralized
Paradigm shift occurring
4

Many names for these…
5
Low Impact Development (LID)Best Management Practices (BMP)Green Stormwater Infrastructure (GSI)Stormwater Control Measures (SCM)Stormwater Management Practices (SMP)Sustainable Urban Drainage Systems (SUDS)
Sustainable Drainage Systems (SuDS)
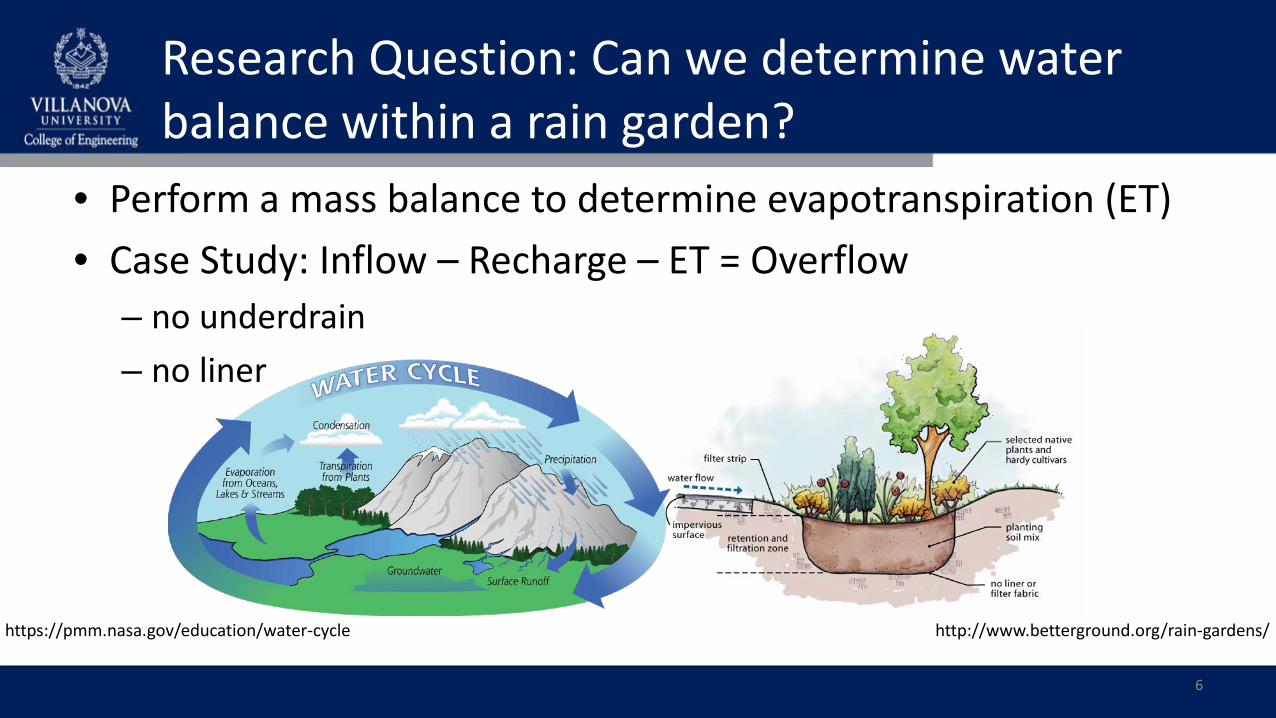
Research Question: Can we determine water balance within a rain garden?
• Perform a mass balance to determine evapotranspiration (ET)• Case Study: Inflow – Recharge – ET = Overflow
– no underdrain– no liner
https://pmm.nasa.gov/education/water-cycle http://www.betterground.org/rain-gardens/
6
7
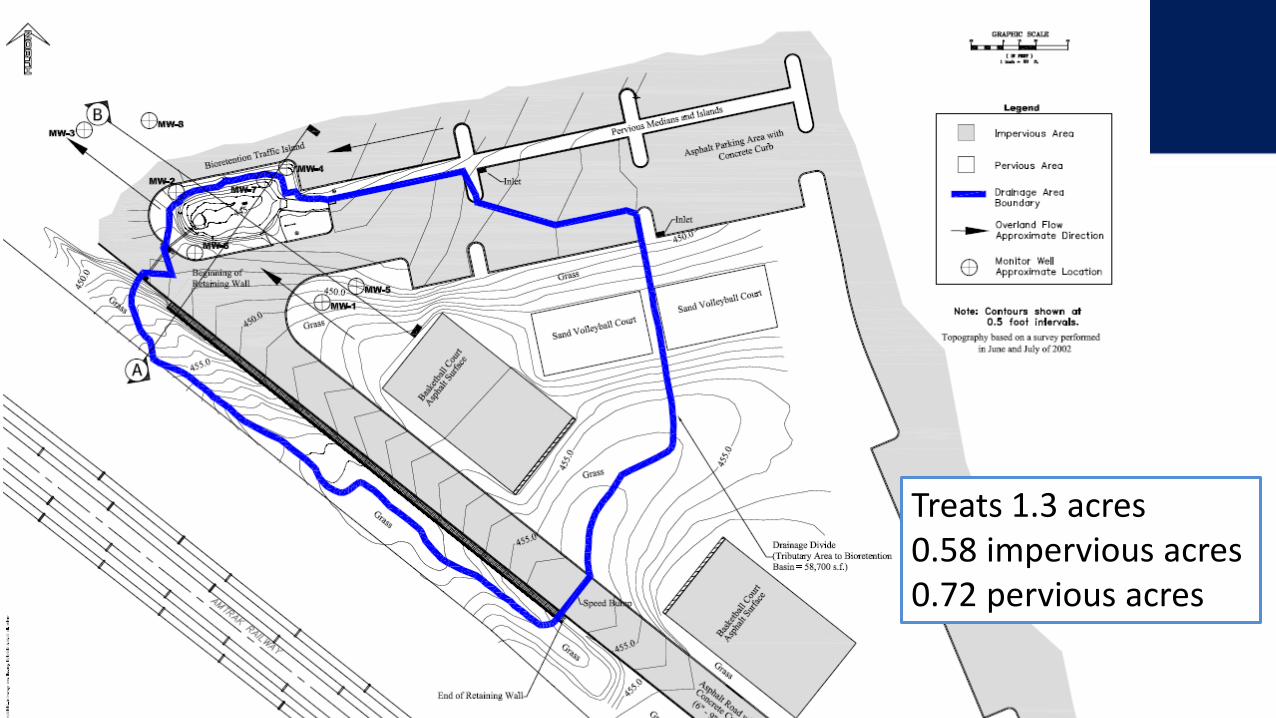
Treats 1.3 acres0.58 impervious acres0.72 pervious acres
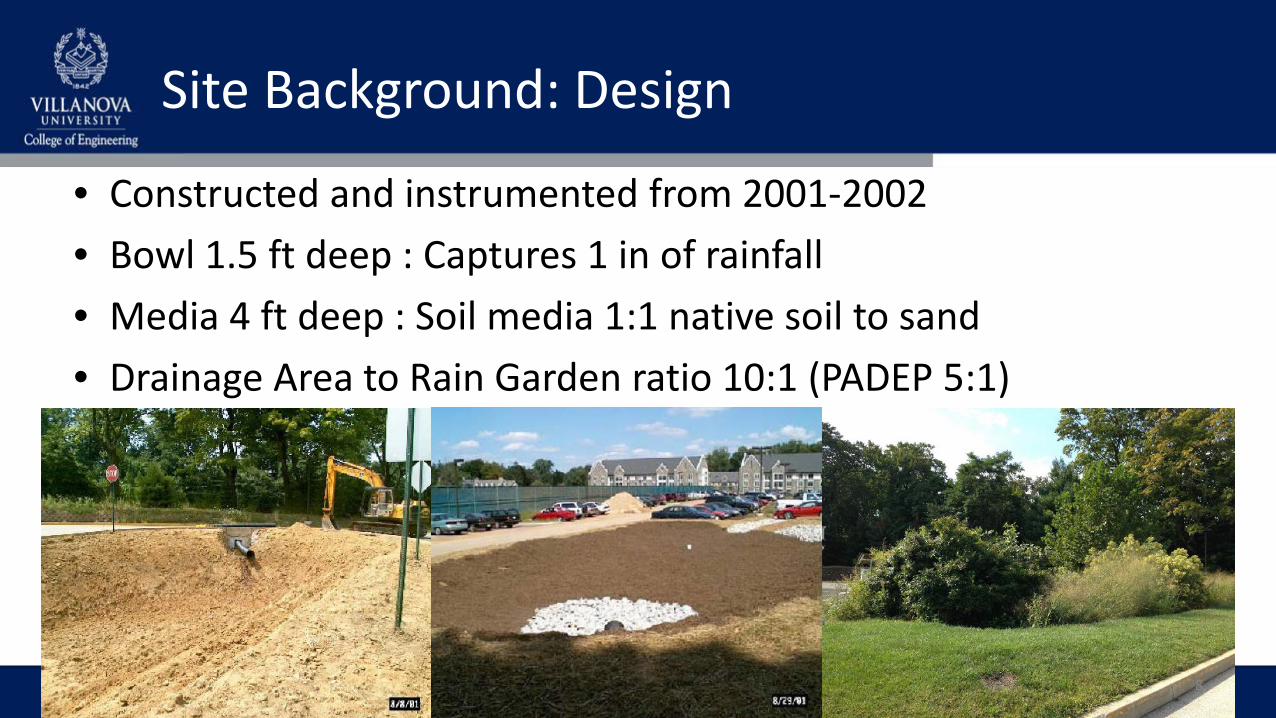
Site Background: Design
• Constructed and instrumented from 2001-2002• Bowl 1.5 ft deep : Captures 1 in of rainfall• Media 4 ft deep : Soil media 1:1 native soil to sand • Drainage Area to Rain Garden ratio 10:1 (PADEP 5:1)
8
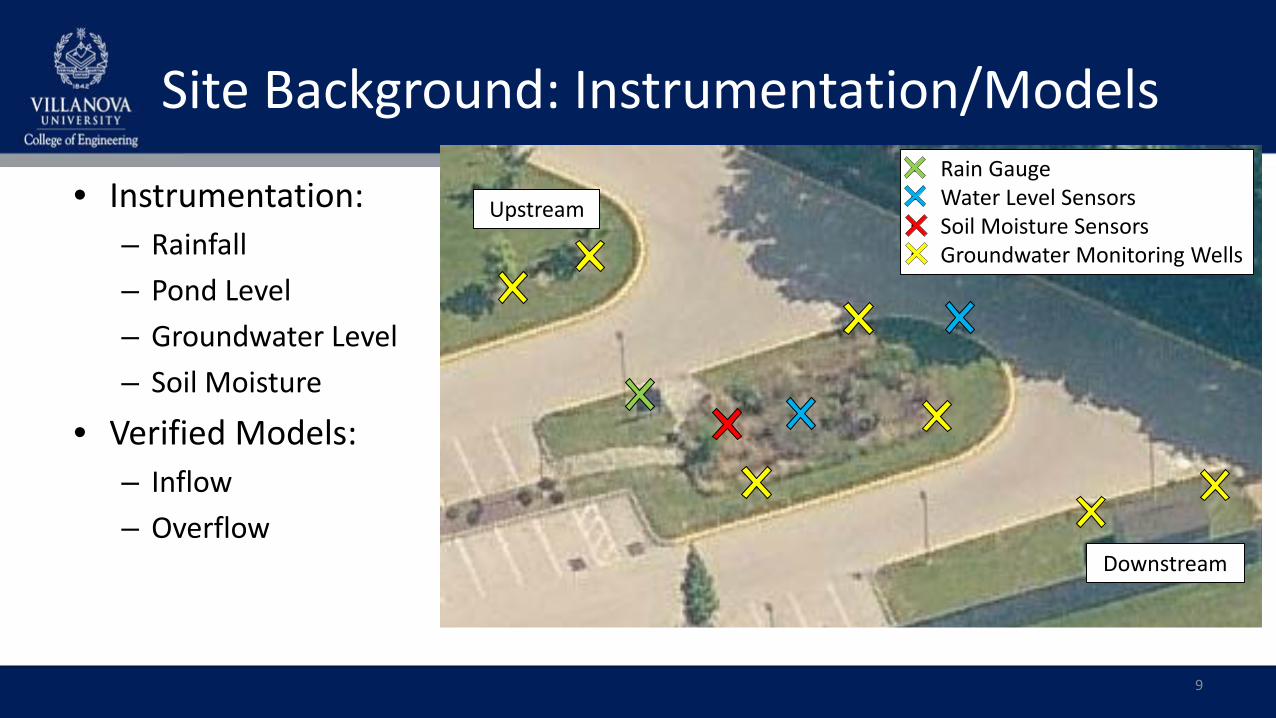
Site Background: Instrumentation/Models
• Instrumentation:– Rainfall– Pond Level– Groundwater Level– Soil Moisture
• Verified Models:– Inflow– Overflow
9
• Rain Gauge• Water Level Sensors• Soil Moisture Sensors• Groundwater Monitoring Wells
Upstream
Downstream
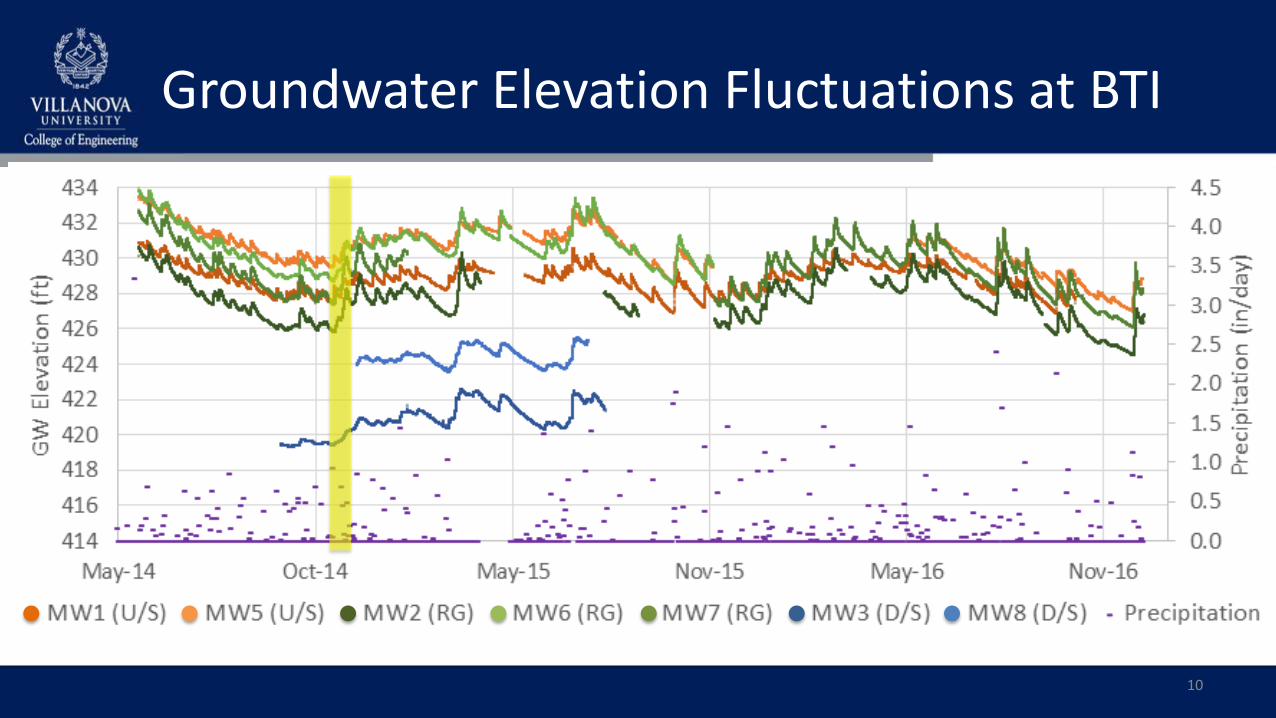
Groundwater Elevation Fluctuations at BTI
10

Mounding Event Example (P = 2.24in)
11
0.0
1.0
2.0
3.0
4.0
5.0
6.0
7.0-0.1
0
0.1
0.2
0.3
0.4
0.5
0.6
0.7
11/23/14 11/25/14 11/27/14 11/29/14 12/1/14 12/3/14 12/5/14
Prec
ipita
tion
(mm
/5m
in)
Chan
ge in
Gro
undw
ater
Ele
vatio
n (m
)
MW1 (U/S) MW5 (U/S) MW6 (RG) MW2 (RG) MW7 (RG) MW3 (D/S) Rain
0.70 in
0.45 in 0.12 in 0.57 in 0.40 in
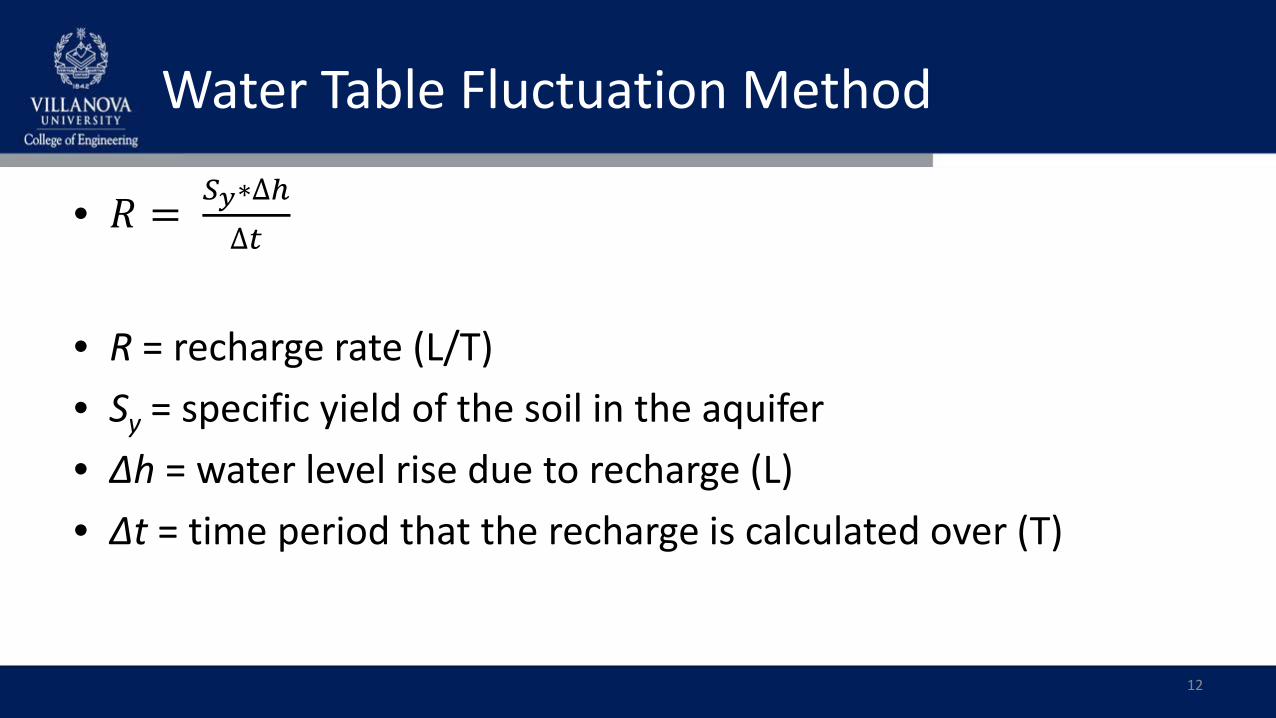
Water Table Fluctuation Method
• 𝑅𝑅 = 𝑆𝑆𝑦𝑦∗∆ℎ∆𝑡𝑡
• R = recharge rate (L/T)• Sy = specific yield of the soil in the aquifer• Δh = water level rise due to recharge (L)• Δt = time period that the recharge is calculated over (T)
12
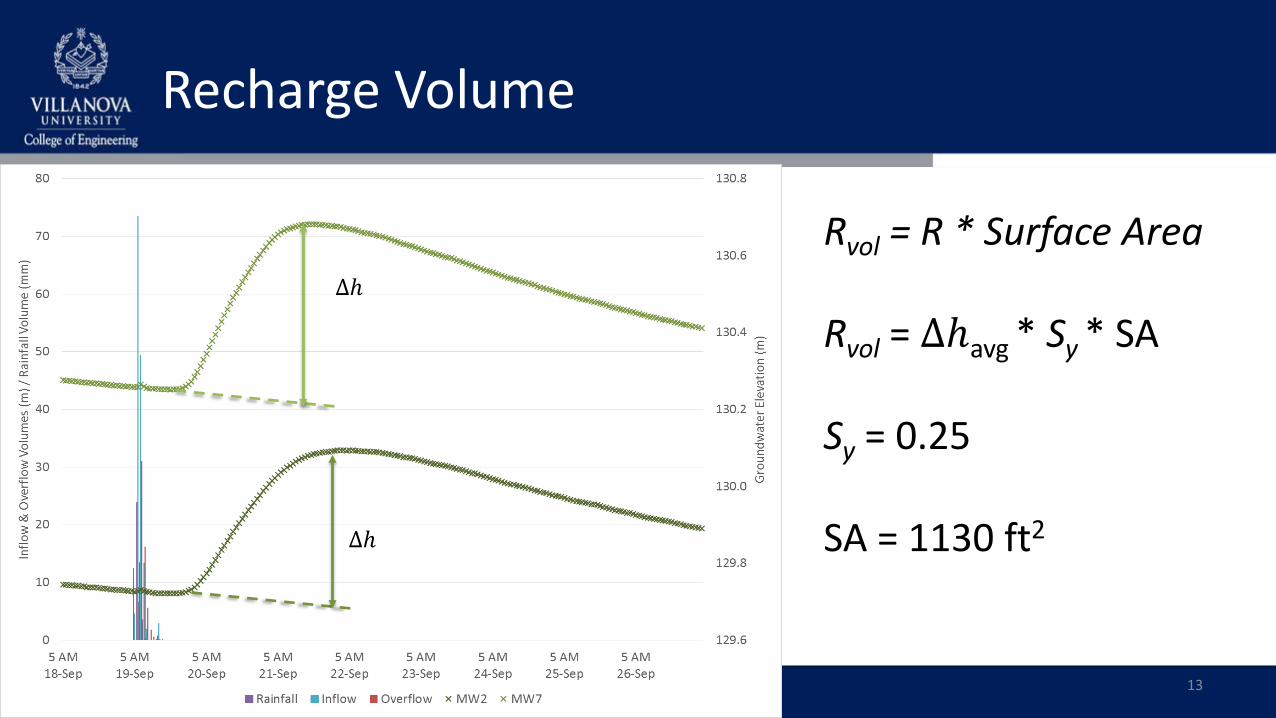
Recharge Volume
13
∆ℎ
∆ℎ
Rvol = R * Surface Area
Rvol = ∆ℎavg * Sy * SA
Sy = 0.25
SA = 1130 ft2
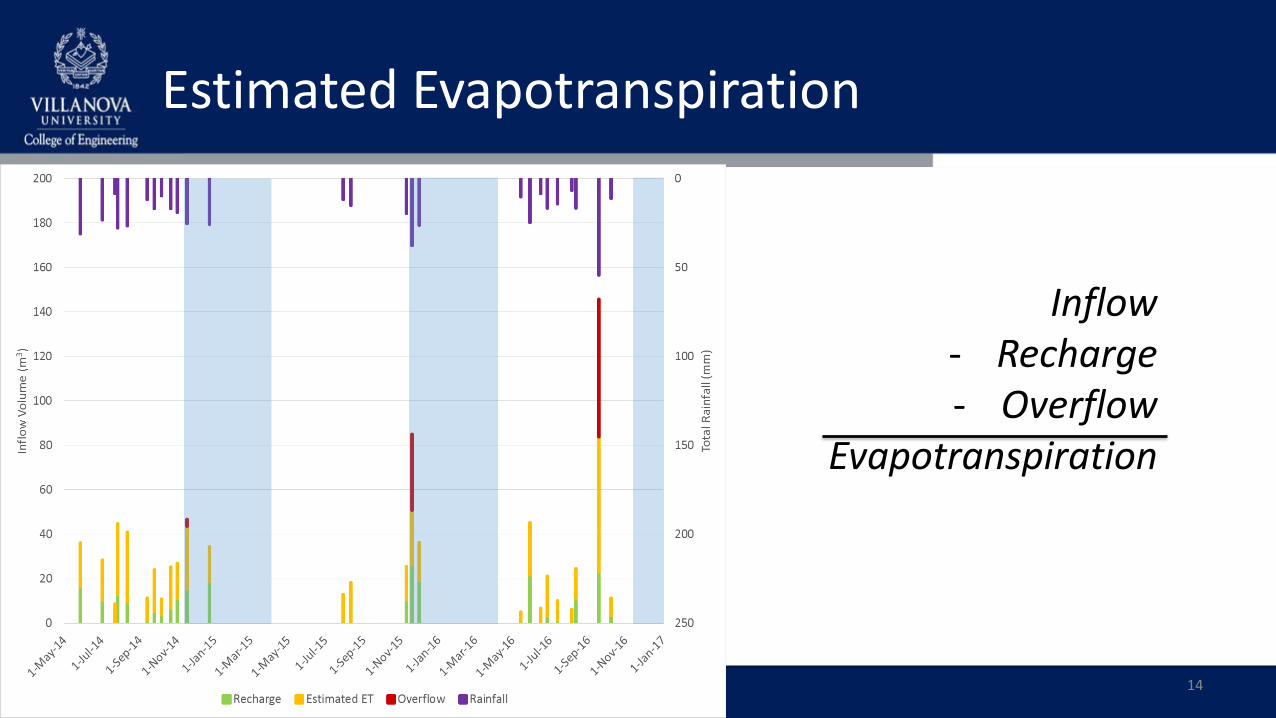
Estimated Evapotranspiration
14
Inflow- Recharge- Overflow
Evapotranspiration

Small Events
15
m3 cm % Inflow % RainMinimum 4.0 0.08 54% 7%Maximum 18.7 0.35 100% 22%Average 11.3 0.21 83% 16%
ET Fraction14Sample Size
Volume
• Storm less than 0.71 in• No overflow• Limited recharge
m3 cm % Inflow % RainMinimum 0.0 0.00 0% 0%Maximum 11.3 0.21 46% 13%Average 2.8 0.05 17% 4%
Recharge FractionVolumep
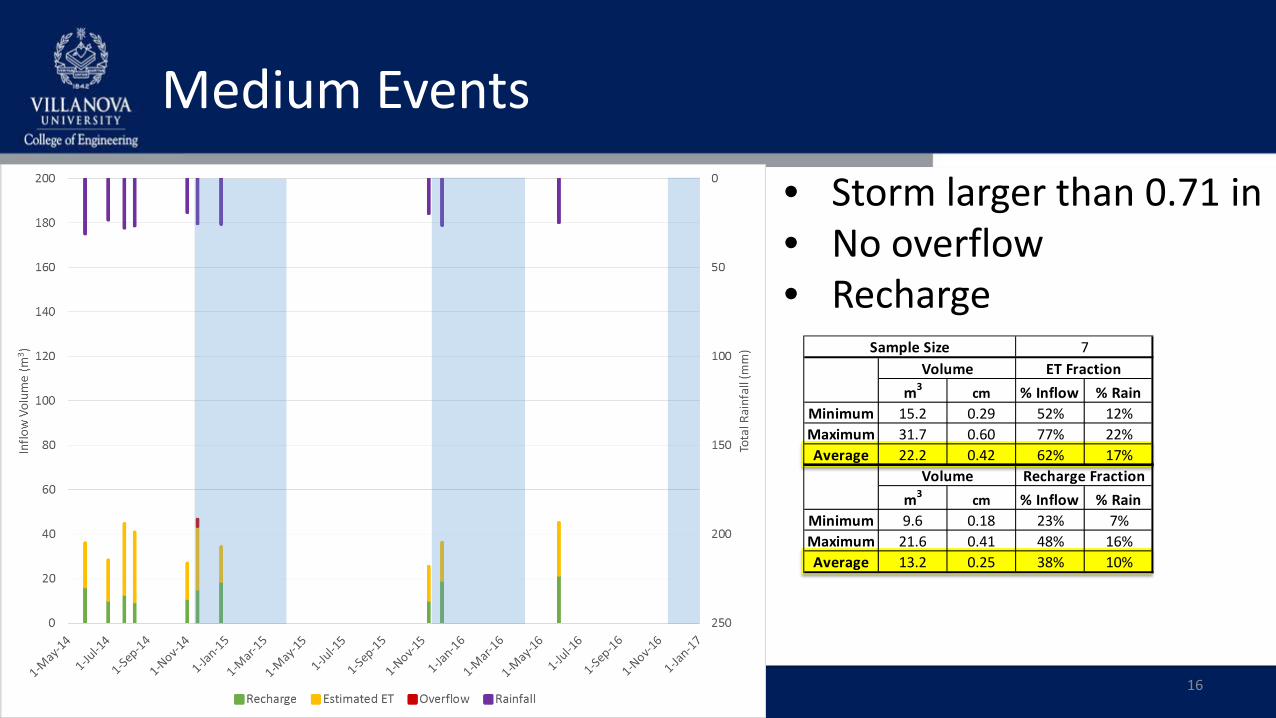
Medium Events
16
m3 cm % Inflow % RainMinimum 15.2 0.29 52% 12%Maximum 31.7 0.60 77% 22%Average 22.2 0.42 62% 17%
ET Fraction7Sample Size
Volume
• Storm larger than 0.71 in• No overflow• Recharge
m3 cm % Inflow % RainMinimum 9.6 0.18 23% 7%Maximum 21.6 0.41 48% 16%Average 13.2 0.25 38% 10%
Recharge Fraction Volume

Medium Storm Event
17
Rainfall = 0.92 in
Inflow = 999 ft3
Recharge = 371 ft3
Estimated ET = 628 ft3
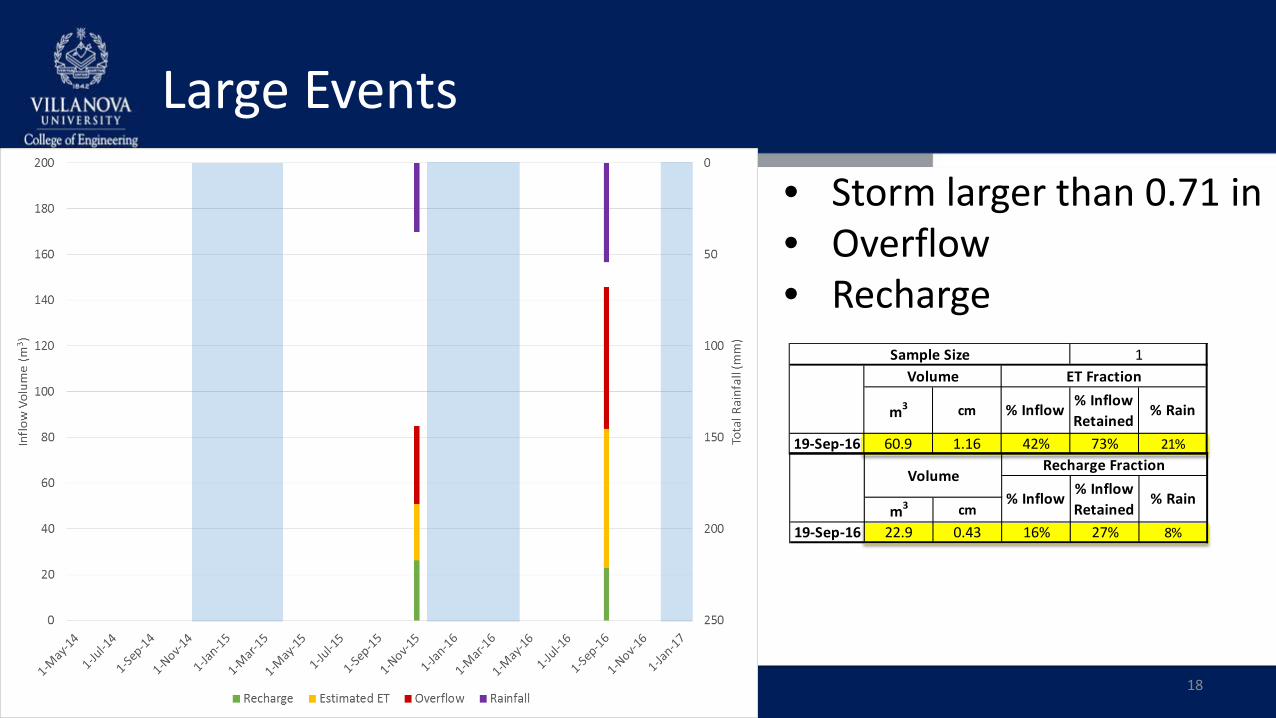
Large Events
18
19-Sep-16 60.9 1.16 42% 73% 21%
1ET FractionVolume
m3 cm % Inflow % Inflow Retained
% Rain
Sample Size
• Storm larger than 0.71 in• Overflow• Recharge
m3 cm19-Sep-16 22.9 0.43 16% 27% 8%
Recharge Fraction
% Inflow % Inflow Retained
% RainVolume
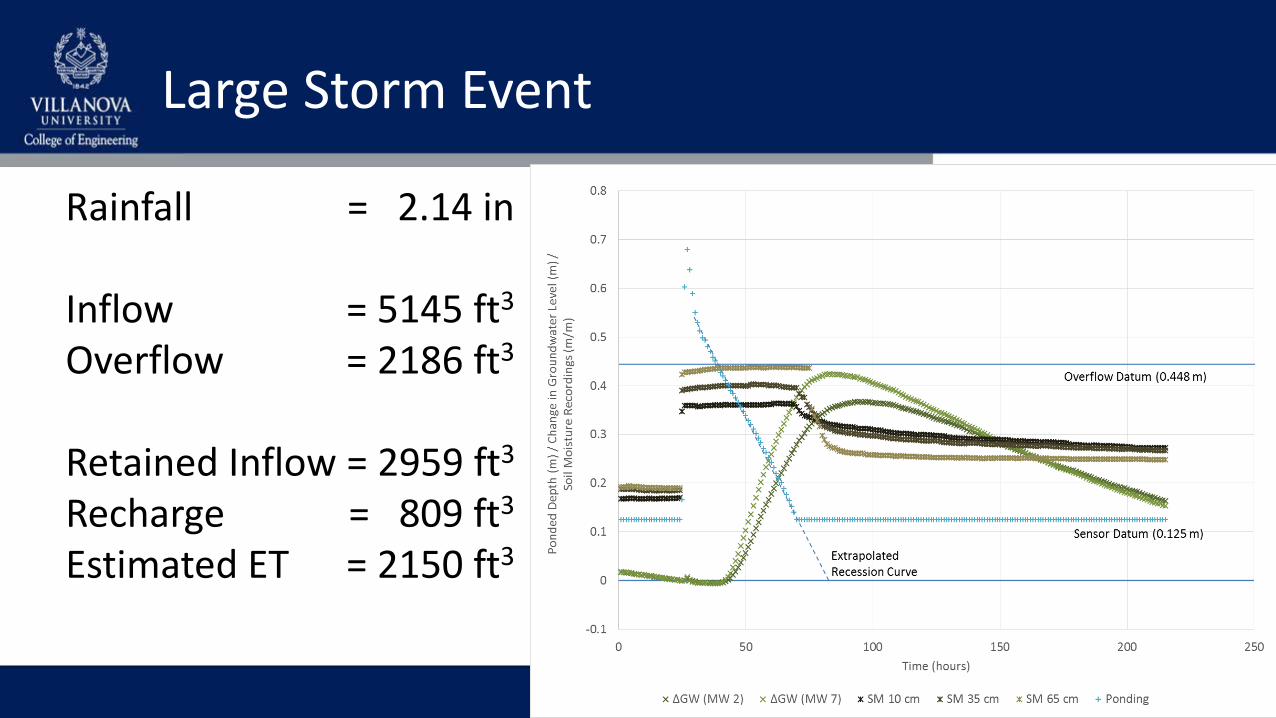
Large Storm Event
19
Rainfall = 2.14 in
Inflow = 5145 ft3
Overflow = 2186 ft3
Retained Inflow = 2959 ft3
Recharge = 809 ft3
Estimated ET = 2150 ft3

Estimated Hydrologic Budget
20
Avg. Inflow
Avg. Recharge
Avg. ET Estimate
mm in m3 m3 m3
6.4 - 12.7 0.25 - 0.50 9.2 2.0 7.212.7 - 19.1 0.50 - 0.75 19.9 5.6 14.319.1 - 25.4 0.75 - 1.00 30.6 9.3 21.325.4 - 38.1 1.00 - 1.50 46.7 14.8 31.938.1 - 50.8 1.50 - 2.00 68.1 22.1 46.050.8 - 63.5 2.00 - 2.50 89.6 29.4 60.2
Rainfall Range

Design Applications
• Promote Evapotranspiration– Use liner – Reduce head– Soil with high void space
• Benefits– Avoid contaminating high water table– Prevent damage to structures
21
https://stormwater.pca.state.mn.us/index.php?title=Stormwater_infiltration_and_groundwater_mounding

Design Applications
• Promote Recharge– Avoid compacting native soil– Increase ponding time
• Benefits– Promote base flow in streams– Aid in reversing drought conditions
22
https://stormwater.pca.state.mn.us/index.php?title=Stormwater_infiltration_and_groundwater_mounding
Acknowledgements
• Villanova Urban Stormwater Partnership/Villanova Center for Resilient Water Systems
• Pennsylvania DEP• William Penn Foundation
23
These are my views and not the views of the organizations listed