Water and Sanitation in Urban Areas - Skoch Group · Water and Sanitation in Urban Areas The...
24
Water and Sanitation in Urban Areas The Overall Scenario ‘Water is life’ and ‘safe water’ means ‘better life’. Water is a universal solvent that transforms into solid, liquid or vapour. For the purposes of consumption, the basic element is the rainfall or precipitation, which flows into runoff in rivers and streams and percolates into the ground to become groundwater. As a saying in Thirukkural, a famous Tamil epic, “rain (water) sustains life; it is a food in itself and helps in preparation of food as well.” Water sustains life in the earth; however, about 97 per cent of the water is in the oceans or as snow on the mountain peaks or underground, which cannot be used as it is either salty or not easily accessible. Thus, the fresh water resource in the globe is hardly 2.7 per cent, of which, about 75.2 per cent lies frozen in polar regions and 22.6 per cent is present as groundwater which cannot be easily used. A tiny fraction of the planet’s water is renewed and made fresh by solar-powered ‘water cycle’. This is available in the lakes, rivers, atmosphere, soil, etc. This calls for judicial utilisation of the limited and finite resource. The use of water in the world has increased more than 35 times over the past three centuries. Globally, 3,240 cu.km (cubic kilometre) of fresh water is withdrawn and used annually; of this, 69 per cent is used for agriculture, 23 per cent for industries and 8 per cent for domestic purposes. As far as India is concerned, its geographical area is 329 million hectares (Mha) and the mean annual rainfall is about 1170 mm. This gives it an annual precipitation of about 4,000 cu.km. River basin is the basic hydrologic unit for planning and development of water resources. 5
Transcript of Water and Sanitation in Urban Areas - Skoch Group · Water and Sanitation in Urban Areas The...

Water and Sanitation in Urban Areas
The Overall Scenario
‘Water is life’ and ‘safe water ’ means ‘better life’. Water is a universal solvent that transforms into solid, liquid or vapour. For the purposes of consumption, the basic element is the rainfall or precipitation, which flows into runoff in rivers and streams and percolates into the ground to become groundwater. As a saying in Thirukkural, a famous Tamil epic, “rain (water) sustains life; it is a food in itself and helps in preparation of food as well.”
Water sustains life in the earth; however, about 97 per cent of the water is in the oceans or as snow on the mountain peaks or underground, which cannot be used as it is either salty or not easily accessible. Thus, the fresh water resource in the globe is hardly 2.7 per cent, of which, about 75.2 per cent lies frozen in polar regions and 22.6 per cent is present as groundwater which cannot be easily used. A tiny fraction of the planet’s water is renewed and made fresh by solar-powered ‘water cycle’. This is available in the lakes, rivers, atmosphere, soil, etc. This calls for judicial utilisation of the limited and finite resource.
The use of water in the world has increased more than 35 times over the past three centuries. Globally, 3,240 cu.km (cubic kilometre) of fresh water is withdrawn and used annually; of this, 69 per cent is used for agriculture, 23 per cent for industries and 8 per cent for domestic purposes.
As far as India is concerned, its geographical area is 329 million hectares (Mha) and the mean annual rainfall is about 1170 mm. This gives it an annual precipitation of about 4,000 cu.km. River basin is the basic hydrologic unit for planning and development of water resources.
5
82 U r b a n r e n e w a l : P O l i c y a n d r e S P O n S e • M . r a M a c h a n d r a n
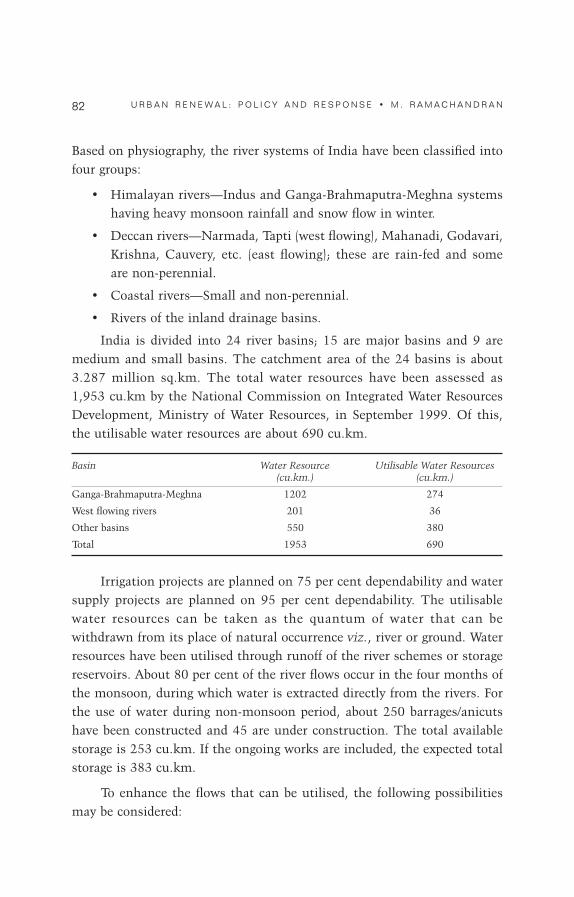
Based on physiography, the river systems of India have been classified into four groups:
• Himalayan rivers—Indus and Ganga-Brahmaputra-Meghna systems having heavy monsoon rainfall and snow flow in winter.
• Deccan rivers—Narmada, Tapti (west flowing), Mahanadi, Godavari, Krishna, Cauvery, etc. (east flowing); these are rain-fed and some are non-perennial.
• Coastal rivers—Small and non-perennial.
• Rivers of the inland drainage basins.
India is divided into 24 river basins; 15 are major basins and 9 are medium and small basins. The catchment area of the 24 basins is about 3.287 million sq.km. The total water resources have been assessed as 1,953 cu.km by the National Commission on Integrated Water Resources Development, Ministry of Water Resources, in September 1999. Of this, the utilisable water resources are about 690 cu.km.
Basin WaterResource UtilisableWaterResources (cu.km.) (cu.km.)
Ganga-Brahmaputra-Meghna 1202 274
West flowing rivers 201 36
Other basins 550 380
Total 1953 690
Irrigation projects are planned on 75 per cent dependability and water supply projects are planned on 95 per cent dependability. The utilisable water resources can be taken as the quantum of water that can be withdrawn from its place of natural occurrence viz., river or ground. Water resources have been utilised through runoff of the river schemes or storage reservoirs. About 80 per cent of the river flows occur in the four months of the monsoon, during which water is extracted directly from the rivers. For the use of water during non-monsoon period, about 250 barrages/anicuts have been constructed and 45 are under construction. The total available storage is 253 cu.km. If the ongoing works are included, the expected total storage is 383 cu.km.
To enhance the flows that can be utilised, the following possibilities may be considered:

83w a T e r a n d S a n i T a T i O n i n U r b a n a r e a S
• Artificial recharge of groundwater.
• Inter-basin water transfer wherever feasible.
• Recycling and reuse of treated wastewater.
• Rainwater harvesting, watershed development and revival of traditional water resources.
Groundwater is widely dispersed. It is an important source for irrigation and drinking. More than 45 per cent of the irrigation demand and about 25 per cent of domestic demand is met from groundwater. The increasing use of groundwater is due to its easy extraction. Unfortunately, it is more intensively used in those areas, where it should be restricted (Tamil Nadu, Karnataka, etc.). For planned development of groundwater, its quality and quantity assessment in space and time is necessary. As per the National Water Policy, development of groundwater sources should be limited to utilisation of replenishable component. As per the Central Ground Water Board (CGWB) estimate, the total utilisable groundwater resource is 393 cu.km.
Variations in the nature and composition of rock types and the geological structures and hydro-geo-morphological conditions have given rise to a varied groundwater situation in the country. The high-relief regions of the northern and north-east areas occupied by the Himalayan ranges, Rajasthan, the central and southern regions have very high runoff and limited groundwater storage. The large alluvial tract extending over 2,000 km from Punjab to Assam, often referred to as Sindhu-Ganga-Brahmaputra plains, is the most potential groundwater region. The groundwater regime in the coastal areas suffers from salinity.
The National Commission on Integrated Water Resource Development has projected the domestic water demand at 220 lpcd for urban and 150 lpcd for rural areas for the years 2010, 2025 and 2050 as 42 cu.km, 55 cu.km and 90 cu.km, respectively, at low demand scenario. The domestic water demand is expected to increase from the present 5 per cent to 7 per cent and 9 per cent respectively, of the total demand for all uses during 2025 and 2050. The total water demand for all uses in these years will be 694 cu.km, 784 cu.km and 973 cu.km respectively, as against the total utilisable surface and groundwater potential of 996 cu.km. Hence, no

84 U r b a n r e n e w a l : P O l i c y a n d r e S P O n S e • M . r a M a c h a n d r a n
scarcity is expected in the overall scenario. However, there will be scarcity in some regions due to temporal and seasonal variations in the country.
The EnvironmentalAtlasofIndia, published by the Central Board for Pollution Control (CPCB), Ministry of Environment and Forests, in 2001 gives a detailed account of surface and groundwater potential and quality in India. The national norm of per capita water supply in urban areas is 70 lpcd in those towns where no sewerage system exists or is contemplated, 135 lpcd where sewerage schemes exist and 150 lpcd in case of metro and megacities. Wherever there are public standposts, 40 lpcd is the norm. We have recently adopted a benchmark of 135 lpcd for the urban areas as a whole.
Globally, about 40 per cent of the world’s population lacks freshwater and in the next decade about US $800 billion is to be invested to bring freshwater to the uncovered population. Water stress is more severe in India, China and Africa. Climate change may add to the stress that already exists.
Urban water Supply
Water is a state subject in India and the responsibility for planning, design, implementation, operation and maintenance of water supply systems lies with the concerned Urban Local Bodies (ULBs) and state governments. At the Central level, the Ministry of Urban Development is the nodal Ministry for formulation of policies, strategies and guidelines and assists the states by providing financial assistance for development of urban water supply and sanitation sector in the cities and towns. The Central Public Health and Environmental Engineering Organisation (CPHEEO) is the Technical arm of the Ministry and assists in preparation of policy guidelines, technical manuals, etc., related to urban water supply and sanitation. The overall management of water resources in regard to policy framework rests with the Ministry of Water Resources. Other ministries, such as Ministry of Health and Family Welfare, Ministry of Environment and Forests, Planning Commission, etc., have also got coordinating role relating to water quality, environment, etc. Provision of water supply and sanitation facilities has been given emphasis from First Five Year Plan onwards as a developmental activity and it was given more thrust during

85w a T e r a n d S a n i T a T i O n i n U r b a n a r e a S
the decade 1981-1990 when the ‘International Drinking Water Supply and Sanitation Decade’ was implemented. The National Water Policy of 1987 updated in 2002, assigns overriding priority for drinking water supply from all the available water resources.
As regards coverage of urban population with drinking water facilities, the CPHEEO, based on the information from the states and union territories (UTs), has assessed that about 91 per cent of the urban population has got access to safe drinking water supply facilities at present. However, the water quantity and quality may not be as per the norms in case of some cities.
The demand for safe drinking water is ever on the increase, whereas the available resources—fresh water and funds—are limited. The urban water supply sector suffers from various problems, such as intermittent supply, inadequacy, inequity and poor quality, etc. According to a study carried out by Ministry of Urban Development in association with Asian Development Bank (ADB) in 2007, piped water supply available per day—on an average—is 5 hours in Chennai, 12 hours in Chandigarh, 8.3 hours in Kolkata, 7 hours in Varanasi, 2.5 hours in Surat, 4.5 hours in Bangalore, 4 hours in Mumbai and 1 hour in Visakhapatnam. The poor, particularly those living in slums and squatter settlements, are generally deprived of safe potable water. Several studies conducted in the country have shown water losses due to leakage, pilferage, etc., to be about 14 per cent to 60 per cent of the total flow in the systems. It has been noticed that maximum leakage occurs in the distribution network and 80 per cent of the loss occurs in house connections. As water supply is by and large intermittent, external pollution gets sucked into the system through the points of leak, causing health hazards during non-supply hours when the system is not under pressure. The study indicates the percentage of Unaccounted for Water (UfW) varies from about 60 per cent in Nashik to 14 per cent in Jabalpur.
water Quality
The CPCB is the central agency designated for monitoring water quality (WQ) of the water bodies, including groundwater. The beneficial use of river water has been classified into five categories in terms of

86 U r b a n r e n e w a l : P O l i c y a n d r e S P O n S e • M . r a M a c h a n d r a n
‘primary water quality’, namely, total coliforms, pH, dissolved oxygen and biological oxygen demand (BOD). With a view to evaluate the water quality profile of a river in its entire stretch and identify the reaches where there are significant gaps between the norm and actual quality, the National Sanitation Foundation Water Quality Index (USA) is being used by the CPCB. Accordingly, the rivers have been classified as very good, good, moderately polluted, polluted, severely polluted, etc.
Similarly, groundwater quality also has been classified based upon the presence of pathogenic organisms, organic and inorganic contaminants. Excess chemical constituents such as sodium, nitrate, fluoride, chloride, iron, arsenic, etc., make the groundwater non-palatable without proper treatment. High nitrate contents in the groundwater are found in Andhra Pradesh (AP), Bihar, etc. High fluoride content is found in AP, Tamil Nadu, Rajasthan, Gujarat, etc., and high arsenic content is found in West Bengal, Bihar, etc.
Wherever the groundwater is contaminated with such excessive concentrations, requisite specific treatment options have to be employed by the concerned agency in charge of water supply before its supply to the community as per the manual guidelines.
As is evident from above, there is a need for a systematic approach for identification and reduction of leakage along with preventive maintenance which has to be undertaken by all the ULBs as an integral part of the operation and maintenance of the water supply systems on a regular basis, to save precious quantity of treated water and to increase revenues to make the systems self-sustaining. In the wake of decreasing fresh water availability and increasing water demand, conservation of water is a sinequanon in the present day context. Conservation of water can be accomplished in many ways. One of them is metering, which will act as an incentive for those who wish to conserve water and act as a disincentive to those who waste water. Metering helps increase the total quantum of water available, enables reduction of waste and increases efficiency and sustainability of the water supply system, which is an important O&M function. It can thus help in ensuring universal access to safe drinking water to all the citizens. Another important measure is water audit which entails an examination of the actual extent of water loss and the reasons thereof. The Government of Maharashtra has taken a positive step in

87w a T e r a n d S a n i T a T i O n i n U r b a n a r e a S
this direction by making water audit mandatory for some categories of ULBs. Some measures have also been taken to provide incentives for the institutionalisation of water audit.
investment during Plans
The investment towards water supply and sanitation, both urban and rural, has been to the order of about 1.46 per cent in the First Five Year Plan, rising to about 2.89 per cent in the Tenth Five Year Plan. The plan outlay for urban water supply and sanitation sector has ranged from 1.28 per cent of the total outlay in the First Five Year Plan to 1.3 per cent in the Tenth Five Year Plan. Compared to the Ninth Five Year Plan, when the plan outlay for both urban and rural water supply and sanitation sector was about 4.46 per cent, the proportion of outlay for urban water supply and sanitation sector stood at 2.16 per cent. However, during the Tenth Five Year Plan, the plan outlay for water supply and sanitation sector, both urban and rural, is about 2.89 per cent, while the percentage of outlay for urban water supply and sanitation sector is about 1.3 per cent only.
The percentage of urban population having access to water supply and sanitation services is expected to reach about 91 per cent and 63 per cent, respectively, by the end of the Tenth Five Year Plan.
In the context of the International Drinking Water Supply and Sanitation Decade Programme (IDWSSD), it was targeted to cover 100 per cent of the urban population with safe and adequate drinking water supply by the end of the eighties. But due to various constraints, such as lack of financial resources, inadequate manpower and institutional capacity, the target still remains elusive. The assessment made by CPHEEO, based on the information received from the States/UTs, reveals that accessibility of the urban population to drinking water supply at present is about 91 per cent. But the coverage figures do not indicate quantity and quality and regularity of the water supply to the citizens or adherence to national norms.
11th Five year Plan Projections
The Working Group for formulation of the 11th Five Year Plan constituted by the the Planning Commission has assessed the requirement

88 U r b a n r e n e w a l : P O l i c y a n d r e S P O n S e • M . r a M a c h a n d r a n
of funds for achieving population coverage of 100 per cent with drinking water supply, sewerage and sanitation, solid waste management and drainage facilities in urban areas by the end of the Tenth Five Year Plan (March 31, 2007) as Rs. 129,237 crore. Against this, the tentative outlay for the urban water supply and sanitation sector and other basic urban infrastructure is Rs. 25,500 crore under the 63 mission cities component of Jawaharlal Nehru National Urban Renewal Mission (JNNURM) and Rs. 6,400 crore under Urban Infrastructure Development Scheme for Small & Medium Towns (UIDSSMT), leaving a huge gap of Rs. 97,337 crore. From this, it is evident that the Government has to give a still greater emphasis on urban water supply and sanitation sector in order to achieve the goals of covering the entire urban population with water supply and sanitation services. The Millennium Development Goal (MDG) envisages “halving by 2015 the proportion of people without sustainable access to safe drinking water and basic sanitation services.”
These coverage figures indicate accessibility only and the quality and quantity of the services may not be as per the norms in some cases. Therefore, the true challenge of MDG is not merely to achieve access to water supply and sanitation infrastructure to 100 per cent before 2015, but also to increase the accessibility in a meaningful way with a reliable and sustainable water supply and sanitation services from a very low level to about 50 per cent. This would require adjustment of polices, institutional framework and incentivising the activities. Instead, if the states and ULBs do not consider such changes and continue business as usual, then it is unlikely that the MDG could be met.
The 11th Five Year Plan envisages augmentation of water supply and sanitation services in urban areas to reach the prescribed norms, higher degree of reliability, assurance of water quality, high standard of operation and maintenance, accountability to customers and in particular, special emphasis to meet the needs of the urban poor and levy and recover user charges to finance the operation and maintenance activity as well as to facilitate further investments. Achieving these tasks depends largely on the willingness of the State Governments and ULBs to restructure water supply organisations, levy reasonable and affordable water rates, take up reforms in billing and collection, accounting procedure, etc., to make cities become creditworthy in order to access market funding.
89w a T e r a n d S a n i T a T i O n i n U r b a n a r e a S
issues
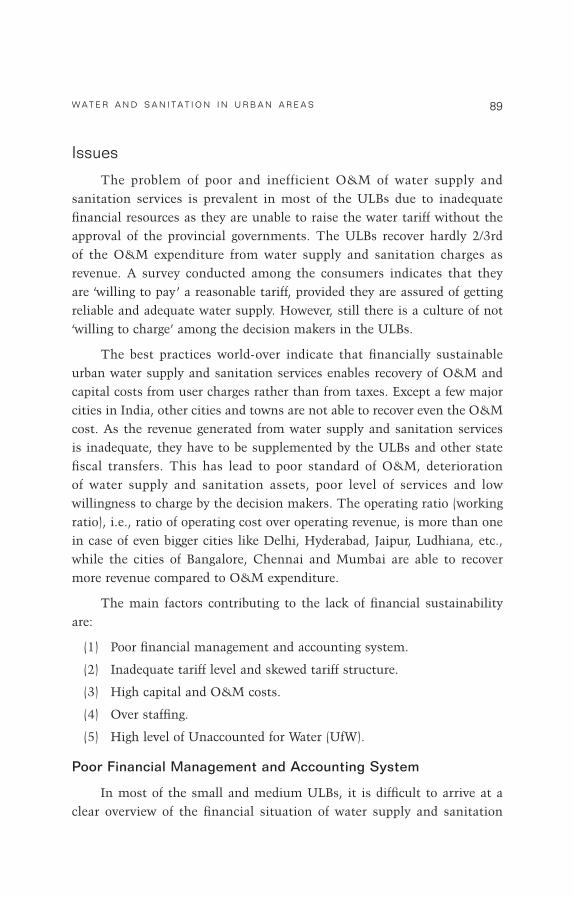
The problem of poor and inefficient O&M of water supply and sanitation services is prevalent in most of the ULBs due to inadequate financial resources as they are unable to raise the water tariff without the approval of the provincial governments. The ULBs recover hardly 2/3rd of the O&M expenditure from water supply and sanitation charges as revenue. A survey conducted among the consumers indicates that they are ‘willing to pay’ a reasonable tariff, provided they are assured of getting reliable and adequate water supply. However, still there is a culture of not ‘willing to charge’ among the decision makers in the ULBs.
The best practices world-over indicate that financially sustainable urban water supply and sanitation services enables recovery of O&M and capital costs from user charges rather than from taxes. Except a few major cities in India, other cities and towns are not able to recover even the O&M cost. As the revenue generated from water supply and sanitation services is inadequate, they have to be supplemented by the ULBs and other state fiscal transfers. This has lead to poor standard of O&M, deterioration of water supply and sanitation assets, poor level of services and low willingness to charge by the decision makers. The operating ratio (working ratio), i.e., ratio of operating cost over operating revenue, is more than one in case of even bigger cities like Delhi, Hyderabad, Jaipur, Ludhiana, etc., while the cities of Bangalore, Chennai and Mumbai are able to recover more revenue compared to O&M expenditure.
The main factors contributing to the lack of financial sustainability are:
(1) Poor financial management and accounting system.
(2) Inadequate tariff level and skewed tariff structure.
(3) High capital and O&M costs.
(4) Over staffing.
(5) High level of Unaccounted for Water (UfW).
Poor Financial Management and Accounting System
In most of the small and medium ULBs, it is difficult to arrive at a clear overview of the financial situation of water supply and sanitation

90 U r b a n r e n e w a l : P O l i c y a n d r e S P O n S e • M . r a M a c h a n d r a n
tariffs. There are subsidies in the accounts and cash-based single entry accounting system is widely used in India, which does not provide sufficient information for preparing accurate financial statements that are needed to make sound management and investment decisions. There is limited autonomy in staffing and financial matters.
Inadequate and Skewed Tariff Structure
The decision makers are not willing to raise the water tariff though the consumers are willing to pay for improved and reliable water supply and sanitation services. In the absence of a policy framework, metering, poor reliability of meter reading, unreliable water supply and sanitation services, the bills are often prepared based on assessed consumption or on lumpsum basis. Domestic tariffs are adequate only to cover 10 per cent of the O&M costs, where the connections are metered and 15 per cent in cities with unmetered connections. The industrial and commercial supplies are charged several times compared to domestic tariff. Among the megacities, only Mumbai, Chennai and Bangalore have high level of tariff when compared with full cost i.e., O&M plus capital.
High Capital and O&M Costs
Day by day, the availability of fresh water for drinking water supply is becoming scarce and major cities have to go a long distance in search of reliable and dependable water source resulting in high capital cost of providing water supply to the growing population. Besides, these megacities are overstaffed and the expenditure on establishment and electric power is enormous and the increased O&M costs are aggravated by high UfW and low revenue. Since the ULBs are having shortage of financial resources, they are unable to take up rehabilitation and renovation of old and dilapidated pipes in the distribution system, where more than 80 per cent of the UfW occurs. Therefore, the ULBs have to undertake identification of leakage and bring the UfW below the present level of 20-50 per cent to 15 per cent by way of replacing the old and dilapidated pipe networks with new pipes.
PPPs could be encouraged in the area of O&M, distribution and billing and collection of revenue from customers. States should actively consider exploiting the transfer of responsibility for O&M of water supply

91w a T e r a n d S a n i T a T i O n i n U r b a n a r e a S
and sanitation schemes to ULBs, including devolving power to revise tariff on their own. Adequate revenue has to be generated through water tax, realistic user charges, connection fees, development charges, etc.
Capacity Building in Urban Water Supply and Sanitation
To upgrade the skills of in-service engineers and technicians, the CPHEEO is conducting training courses such as PG course in Public Health Engineering, short-term course for diploma engineers and refresher courses for the engineers and technicians through 31 training institutes across the country, including IITs, engineering colleges, PHE departments, water boards, etc. However, these courses are mainly oriented towards technical aspects and seldom address the commercial, managerial and strategic aspects of water supply and sanitation sector. Topics such as reform polices, tariff corporatisation, private participation through regulatory framework, etc., do not appear in the curriculum.
In most of the State PHE Departments and Water Boards, recruitment of fresh engineers have been frozen and as a result, the current staff is overburdened without skills and capacity needed to contribute to the shift from the development of infrastructure to the provision of services. There seems to be little interest among the new graduates to join water supply and sanitation sector due to slow pace of recruitment and get more attracted towards other sectors such as IT. Moreover, the engineers and staff normally have less inclination to work in maintenance works compared to the development of infrastructure. Due to this, the O&M function is not effective in most of the ULBs. Therefore, some of the major cities have outsourced its functions so as to induct efficiency and increase the revenue base.
High Level of Unaccounted for Water (UfW)
Studies undertaken in several cities on leak detection in water supply transmission and distribution network reveals that the wastage of precious treated water through leakage in the pipe network and service connections vary between 20 to 50 per cent of the total water supplied and more than 80 per cent of the leak is through the house service connections. This unaccounted for water (UfW) constitutes both physical losses through leaks, etc., and non-physical losses through unauthorised connections,
92 U r b a n r e n e w a l : P O l i c y a n d r e S P O n S e • M . r a M a c h a n d r a n
pilferage, etc. Therefore, it is high time that such non-revenue water is brought down to the permissible and manageable level of 15 per cent, which will result in the following advantages:
• Increased quantum of per capita supply and consumer satisfaction.
• Increased pressure.
• Increased revenue.
• Decreased fresh water requirement.
• Decreased contamination through leaky joints and cross connections.
In order to supplement the efforts of the State governments and ULBs, the Central government and the Ministry of Urban Development launched the JNNURM in December 2005, which is a reform-oriented and demand-driven programme. Infrastructure projects are fashioned in such a manner as to recover the cost of O&M, to ensure the water supply system sustainable in the long run. Under JNNURM, the Urban Infrastructure and Governance (UIG) envisages provision of funds to all the 63 mission cities, including mega and metro cities and state capitals, to implement infrastructure facilities including water supply, sewerage and sewage treatment, storm water drainage and solid waste management, roads, etc. So far, 107 water supply projects have been sanctioned for 46 cities to provide water supply facilities. The sanctioned water supply schemes when completed will be able to provide at least 135 lpcd water in all the sanctioned NURM cities.
At present, operation and maintenance of water supply systems in the cities is by and large inefficient and the duration of supply varies from 2 to 6 hours in most of the cities. The water supply services are not sustainable at present in the cities due to inadequate revenue generation as a result of lower/inappropriate tariffs structure not commensurate with the production and distribution cost and the ULBs largely depend on the State governments for subsidy to sustain the system.
The 11th Plan Document indicates that requirement of funds to achieve 100 per cent population coverage in urban areas with drinking water supply alone by 2012 would be more than Rs. 53,000 crore, whereas the plan outlay made under JNNURM is only about Rs. 25,500 crore for

93w a T e r a n d S a n i T a T i O n i n U r b a n a r e a S
not only water supply and sanitation sector but also for other sectors like roads, etc. Therefore, the fund allocation is too low to achieve the desired targets of 100 per cent coverage.
Unsafe water supply and inadequate sewerage and sanitation and waste disposal results in spread of water-borne or water-related diseases among the people. The WHO estimate indicates that about 80 per cent of all diseases in the world are associated with unsafe drinking water and poor environmental hygiene. Most infectious diseases are caused by pathogens such as bacteria, viruses or parasitic worms, and a disease is transmitted by the passing of these organisms from one person to another or through intermediate hosts. Four types of water-related diseases—water-borne, water-washed, water-based and water-related—affect human beings.
The World Bank reports that 30 per cent of the total disease burden in developing countries like India results from contamination at the household level and that 75 per cent of life years are lost within this 30 per cent due to lack of good water supply and sanitation and prevalence of risky hygiene behaviour.
The WHO has formulated an indicator called DALY (Disability-Adjusted-Life-Years) as a summary measure of population health, integrating mortality with morbidity and disability in a single unit. DALYs show the relative importance of health problems and can be combined with data on costs and effectiveness of interventions to establish which interventions would be most cost effective. The DALY is the measure of choice to monitor the burden of disease in relation to improvements in water supply and sanitation. One DALY represents the loss of one healthy year of life. For each disease, DALYs are calculated as the sum of productivity life lost due to disability caused due to ill-health condition.
Water-borne, water-washed diseases such as cholera, typhoid, dysentery, etc., are transmitted through faecal-oral route and they can be prevented by providing safe drinking water and adequate sanitation and waste disposal facilities. Water-based and water-related vector diseases can also be prevented by these measures, including better personal hygiene. Thus, it can be inferred that safe drinking water and adequate sanitation and waste disposal facilities can bring down the DALYs among the urban population and help increase their productivity.

94 U r b a n r e n e w a l : P O l i c y a n d r e S P O n S e • M . r a M a c h a n d r a n
As per the Planning Commission's estimation about 60 per cent of the GDP is from urban India, which means that better living conditions in the urban areas only can sustain this. The Ministry's efforts in sanctioning of infrastructure projects under JNNURM along with their implementation, including mandatory and optional reforms at the State and ULB levels, will lead to better living conditions for the people.
The Ministry has sanctioned 365 infrastructure projects at a total cost of Rs. 35,808.91 crore so far. Of these, 110 projects have been sanctioned for provision of water supply, which constitute about 41 per cent value of all the projects. Similarly, 74 sewerage and sewage treatment projects have been sanctioned for about 21 per cent of the total amount of the projects sanctioned. Similarly, projects for solid waste management have been approved for 4.33 per cent and stormwater drainage projects have been approved for 9.24 per cent of the total value. Thus, more than 75 per cent of the projects have been sanctioned for the basic and essential services, namely water supply, sewerage and sewage treatment, solid waste management and stormwater drainage for the 46 mission cities, including 28 million plus cities. This indicates the keenness of the states and ULBs to provide basic services like water supply. If all the sanctioned projects are completed as per the stipulated time period indicated in the DPRs, then the water supply in terms of their quantity, quality, duration of supply, etc., will improve to a greater extent.
While sanctioning the projects, the Ministry has advised the ULBs to ensure achievement of 24x7 water supply, reduction of non-revenue water, recovery of user charges, improvement of billing and collection and revenue, better financial management through double entry accounting, etc., as reform measures. To enable volumetric measurement and billing with a view to reduce NRW, funds have been provided in the cost estimates for purchase of water meters, house service connections, etc. A few specific projects have also been sanctioned for distribution network, which will bring down the leakage and wastage of water as well as reduction in contamination due to cross connection and entry of contaminated water through leaky pipes and joints.
The current state of delivery of urban services also leaves much to be desired. About 40 per cent of urban households do not have proper

95w a T e r a n d S a n i T a T i O n i n U r b a n a r e a S
sanitation and only 85 per cent of the urban population has access to safe water supply, which is even less (65 per cent) in slums. Despite an improvement in the figures and statistics as compiled by the Government of India and research institutions over the last decade, universal coverage of the population as far as the water sector is concerned, is still an unmet goal. To meet the MDG, investments required alone in urban water sector for 2007-2012 is about Rs. 385 billion. The focus of the urban local bodies, as well as the state and national governments, has to be on addressing this significant infrastructure deficit by considering not just the bricks and mortar aspects but also the service delivery.
Here I would like to make a reference to the National Urban Sanitation Policy which has just been approved by the Government of India. This policy calls upon cities to draw city-wide sanitation-plans and strategies to be implemented in a fixed time-period. All Indian cities and towns are to become totally sanitised, healthy and livable and ensure and sustain good public health and environmental outcomes for all their citizens with a special focus on hygienic and affordable sanitation facilities for the urban poor and women.
The National Urban Sanitation Policy launched on November 12, 2008, is the result of the vision of MoUD and the National Inter-ministerial Task force on Universal Sanitation in Urban Areas. The Policy was finalised after an intensive consultative process. There was a conscious attempt to take the views of every stakeholder. Several workshops were held over two years to discuss the draft policy and it has undergone several key iterations. Both in Navi Mumbai and Hyderabad, the participation was heartening and encouraging. It was also a pleasure to see states and cities show such a high level of interest in a subject which has been neglected historically. It is hoped that the launch of this policy will bring about a wave of change in the sanitation sector and ultimately lead to a demand for better sanitation. The policy has been discussed with several ministries and their comments have been incorporated.
The policy is an effort to address urban sanitation in a holistic manner. It was indeed apt that this policy was launched in the International Year of Sanitation. Sanitation is not only a basic necessity but is also a human right. In fact, the National Human Rights Commission is also examining

96 U r b a n r e n e w a l : P O l i c y a n d r e S P O n S e • M . r a M a c h a n d r a n
this issue and the MoUD has been requested to urge all ULBs to take necessary steps to eliminate open defecation completely. As we are also aware, open scavenging, which is illegal, is yet to be eliminated in our country.
In India, almost 50 million people defecate in the open everyday. This means almost 12,500 tonnes of human waste is left in the open everyday due to the lack of proper sanitation facilities. The biggest impact of this lack of sanitation is on the public health, especially the high incidence of water-borne diseases in our country, mainly affecting children. A Water and Sanitation Programme study for East Asian countries estimates that almost US $9 billion or 2-6 per cent of their GDP is lost every year due to inadequate sanitation. With such alarming figures, we need to ask ourselves why urban sanitation is not being addressed more urgently. Why is it that authorities have not been able to provide citizens a better alternative? More importantly, why is it that people are not demanding better sanitation? These are relevant questions that began the discussion on the need for a comprehensive urban sanitation policy.
The discussion on what an urban sanitation policy should entail began unraveling several issues which dogged the sector. Issues such as ULBs requiring more power and funds to execute projects, the space constraints faced by the poor and most importantly the need for people to demand better sanitation were identified as core issues. The situational analysis conducted by the Task Force revealed that safe confinement and disposal of wastes is an area which has been greatly ignored. Almost 23 million urban households rely on on-site arrangements and surprisingly little action has been taken to assure safe management of excreta in such cases.
The national policy addresses these and many other issues. It attempts to address the institutional issues, plight of the urban poor, issue of manual scavengers, lack of awareness on sanitation, lack of integrated planning and lack of technical know-how and capacity which causes most of our infrastructure to operate in a sub-optimal manner. It is estimated that only 10 per cent of our cities have a sewerage network and the existing treatment systems have a capacity to treat only 21 per cent of the 30,000 mld of wastewater generated. This implies that almost 80 per cent

97w a T e r a n d S a n i T a T i O n i n U r b a n a r e a S
of our wastewater is directly let out into our rivers without any treatment. The biggest impact of poor sanitation is on public health, especially the incidence of water-borne diseases affecting mainly children.
The policy is the first step to begin the process of cleaning up our environment and many more steps have to be taken urgently. The vision of the policy is to make all Indian cities totally sanitised, healthy and liveable for all its citizens especially the urban poor. The policy, for the first time, provides the necessary framework to states to approach urban sanitation in an integrated manner. It requires each state to formulate its own state sanitation strategies and cities to make individual sanitation plans. It is encouraging to note that states like Maharashtra and West Bengal have taken the lead and are in the final stages of having an approved state sanitation strategy. Madhya Pradesh, Orissa and Uttar Pradesh have also begun the process of developing a state sanitation strategy. All other states can take a cue from these states and start the process of drafting individual state sanitation strategies, taking into account their own circumstances and focus on achieving outcomes and not on blindly creating infrastructure.
The Ministry is willing to support states to develop state sanitation strategies and city sanitation plans. The Central and State governments’ support to ULBs will be increasingly reoriented to reward the achievement of outcomes, which means moving away from the current practice of input and process funding where focus has been merely on hardware. With guidance and support of the Central and State governments, the ULBs will be responsible for the implementation of the plan and the operation and maintenance of any created infrastructure.
States will be encouraged to prepare state-level sanitation strategies and identified cities will be urged to prepare model city sanitation plans. The Government of India will provide assistance for the preparation of the detailed project reports as per the city sanitation plan as soon as it gets requests for funding. Funding projects from existing schemes such as JNNURM and UIDSSMT will be encouraged. In addition, synergies with other schemes being implemented by MoUD, such as the scheme for new satellite townships and counter magnet cities, and 10 per cent lumpsum provision for north-eastern states, including Sikkim, which provide funds for the creation of urban infrastructure facilities, will also be attempted. It

98 U r b a n r e n e w a l : P O l i c y a n d r e S P O n S e • M . r a M a c h a n d r a n
is recognised that in spite of access to these schemes, there may be a deficit of funds in which case the option of approaching bilateral and multilateral agencies will be explored. I will also call upon the states to explore PPP options especially in areas such as creation of public amenities, treatment of sewage, etc., where we have had some success stories.
To provide a catalyst to all these state and city activities and recognise excellent performance in this area, the Government of India has instituted an annual recognition award scheme for cities called the “Nirmal Shahar Puraskar”. The award is based on the premise that periodic assessment of performance of cities that is made public, will lead to greater community awareness, demand for improved sanitation and promote healthy competition amongst cities. The proposed awards will not be merely an assessment of hardware or expenditure incurred in urban sanitation, but how these have led to achievements of milestones of 100 per cent safe disposal of wastes from the city on a continuous basis. To start this process, the MoUD proposes to carry out a rating exercise of all Class 1 cities and publish the results nationally within a year.
The Ministry is also proposing a National Level Communication Campaign to generate awareness on sanitation, both at the household level and at the service-provider level. The aim of this exercise is to generate awareness of the benefits of a hygienic and clean environment and thereafter bring about behavioural changes. The lack of knowledge on the health improvements that are likely to accrue due to better sanitation practices, in turn creates a lack of demand for improved sanitation provision. A communication and awareness campaign on health risks due to poor sanitation is crucial to motivate the public to change their behaviour and to take appropriate action. Further, the message that sanitation must be accessible to all and not just a few should be advocated.
Another area of focus of this policy is the treatment and re-use of wastewater. A recent study by the Water and Sanitation Programme (2008) on productive use of domestic wastewater identified the enormous health, environmental and socio-economic costs of not improving sanitation and the potential benefits from treatment and reuse of wastewater. Increasingly, cities around the world are beginning to recognise the value of recycling wastewater and are implementing projects to recycle and reuse the treated wastewater for non-potable applications. Singapore recycles and

99w a T e r a n d S a n i T a T i O n i n U r b a n a r e a S
reuses all its wastewater, with 90 per cent being used by industries and 10 per cent used to augment the city’s drinking water requirement. Even in India, Bangalore and Chennai have begun a few projects on recycle and reuse of domestic wastewater for industrial usage. All of these have been implemented with private sector participation. With the growing demand for water in future, there will be a need for many more such projects, and an opportunity for private sector participation.
In line with the thrust of the Mission on provision of basic services in the urban area, 110 water supply projects, 74 sewerage projects, 41 drainage (including storm water drainage) projects and 31 solid waste management projects have been approved.
Service level benchmarks
Yet another initiative taken by the Ministry is the formulation of service level benchmarks in four core areas—water supply, sanitation, solid waste management and stormwater drainage. Some of the benchmarks in the sanitation area include complete elimination of open defecation, 100 per cent coverage, adequacy and collection efficiency of wastewater network services, reuse and recycling of treated wastewater at least to the extent of 20 per cent, redressal of at least 80 per cent of customer complaints within 24 hours, 100 per cent cost recovery in wastewater management, etc. The intention behind the formulation of benchmarks is to shift the focus from infrastructure to service delivery. These benchmarks are complied with respect to every project sanctioned by this Ministry as well as externally aided projects in this sector. The intention is also to monitor the level to which benchmarks have been achieved.
With a view to handholding and capacity building, the Ministry has organised several regional workshops to educate the ULBs in preparation of good quality DPRs. In collaboration with the ADB and World Bank, guidelines on ‘Service Level Benchmarks’ have been prepared and circulated to all the states and ULBs for adoption. National Urban Sanitation Policy has been formulated and disseminated to all the States and ULBs for planning, design and implementation of sewerage and sanitation schemes in the urban areas with a view to achieve sanitised and open defecation-free cities and towns.

100 U r b a n r e n e w a l : P O l i c y a n d r e S P O n S e • M . r a M a c h a n d r a n
The outcomes for urban water supply under JNNURM will be:
• Financially self-sustainable cities.
• Universal access to basic services.
• City-wide framework for planning and governance.
• Modern financial management systems.
• Transparent and accountable government and service delivery.
Till November 2008, 110 water supply projects were sanctioned at a cost of Rs. 13,054.03 crore for 46 cities in various states and additional Central assistance to the tune of Rs. 6,624.03 crore has been committed and Rs. 2,080.58 crore has been released for the sanctioned schemes. The sanctioned water supply schemes when completed will be able to provide at least 135 lpcd water in all the sanctioned NURM cities. The sanction of projects under JNNURM is linked to implementation of various reforms. Some of the reforms specific to the water sector are levy of reasonable user charges by the ULBs with the objective of recovery of full cost of operation and maintenance, provision of basic services including water supply to the urban poor, revision of bye-laws to make rainwater harvesting mandatory and water conservation, bye-laws for re-use of recycled water, formulation and implementation of differential tariff based on volumetric consumption, etc. Under JNNURM, projects are sanctioned with the following pre-conditions:
• Reduction of Unaccounted for Water (UfW i.e., NRW) below 15 per cent.
• Cost recovery for meeting operation and maintenance cost of water supply system/connection charges.
• User charges shall be based on telescopic charges based on differential water tariff linked to consumption.
• 100 per cent metering of all the connections, including bulk consumers.
• Creation of water districts with bulk flow metering and district metering areas.
• Water audit and continuous monitoring.
Three projects have been approved under JNNURM for recycling of wastewater for potable and non-potable uses in Bangalore, Nagpur and

101w a T e r a n d S a n i T a T i O n i n U r b a n a r e a S
Chandigarh. We have also approved 44 projects which are designed for 24X7 water supply.
Investments in urban infrastructure have however, not always resulted in corresponding improvements in levels of service delivery. This is especially the case in Water Supply and Sanitation (WSS) services, where large sections of the urban population, usually the poor, are unable to access safe, reliable and affordable WSS services. There is a need for a shift in focus towards service delivery. To emphasise the aspect of service delivery, the Ministry has taken the initiative of bringing out a Handbookof Service Delivery Benchmarks. This handbook provides a standardised framework for performance monitoring of water supply, sanitation and solid waste management services. In respect of the water supply sector, the benchmarks include the following:
Coverage of water supply connection 100 per cent
Per capita availability of water at consumer end 135 lpcd
Extent of metering of water connections 100 per cent
Extent of non-revenue water 20 per cent
Continuity of water supply 24x7
Efficiency in redressal of customer complaints 80 per cent
Quality of water supplied 100 per cent
Cost recovery in water supply services 100 per cent
Efficiency in collection of water supply-related charges 90 per cent
Number of persons receiving less than 70 lpcd 0 per cent
We intend making the achievement of these benchmarks mandatory in the case of all projects sanctioned by the Ministry as well as externally aided projects in the water sector.
The Ministry has also instituted the National Urban Water Awards in association with CII and ASCI. These awards have been instituted with the explicit purpose of honouring ULBs, water boards and organisations that assist them in taking significant steps towards effective water management and improvements in service delivery. The awards cover a spectrum of good practices that enhance the quality of service delivery levels to citizens
102 U r b a n r e n e w a l : P O l i c y a n d r e S P O n S e • M . r a M a c h a n d r a n
at large and the poor and marginalised in particular. They aim to provide a forum to showcase urban initiatives and provide inspiring models in water management for others to follow. Some of the award-winning entries were for conjunctive use of surface and groundwater by Belgaum City Corporation, Combined Water Supply scheme for 156 villages and two towns in Daryapur and tapping sub-surface flow of the stream in hilly regions—Uttarakhand Koop. The intention is to institutionalise this award and use it as a forum for recognising and publicising best practices.
Another area of focus for the Ministry is to encourage private sector participation in the water supply sector through PPP arrangements which will bring in operational efficiency in the sector. The Government has set up the India Infrastructure Project Development Fund with the intention of encouraging PPP and provides assistance for up to 75 per cent of the project development cost. A few cases pertaining to the water sector in Hyderabad, Nasik, etc., have already been approved under this scheme. The Jamshedpur Utility and Services Company is already involved in providing water supply to the city of Jamshedpur and has established very high standards.
The challenge of providing water of adequate quantity and quality is immense and it will require effort not only on the part of all three levels of government, but also the corporate sector and the community as a whole. Given the challenges in the water sector and provision of adequate and safe drinking water to all our citizens, it is important that all stakeholders are fully involved in provision of these services. As we move towards more sustainable paradigms, greater participation of the private sector shall become a reality. We are already aware about examples like Tirupur and Navi Mumbai. The capacities needed in the sector not only relate to technologies but also appropriate management practices. Sharing of best practices across the world provides us with useful insights in to how cities which are similarly placed in other parts of the world have managed to overcome their problems. Here it is pertinent to look at the extremely high standards that some organisations like the Thames Valley Authority have set for itself. To cite an example, though they have achieved a failure rate of less than 1 per cent for their water samples, they have been trying to explain how they intend to improve the quality of the water supply. Similarly, the Manila Water Company has reported a
103w a T e r a n d S a n i T a T i O n i n U r b a n a r e a S
13 per cent increase in its net income for the first quarter of 2008. The company’s financial performance is largely a result of its aggressive capital investments over a period of past 11 years. The level of non-revenue water has been maintained at 20 per cent and the collection efficiency is as high as 99 per cent. Given these examples, it is extremely important that the water boards and water utilities in the country move towards greater efficiency and accountability. The JNNURM reforms cover both the ULBs and parastatals and it is extremely important that key reforms, like full recovery of operation and maintenance charges, double entry accrual-based accounting system, public disclosure, reuse of recycled water and water conservation, adoption of benchmarks and mechanism for ensuring accountability to citizens, are implemented in these organisations as well.