Water Analysis - University of Novi Sad i HPLC u analizi... · • High pressure • High...
112
Organic and Inorganic Micropollutants Pat Sandra Research Institute for Chromatography, Kortrijk, Belgium Ghent University, Belgium Water Analysis
-
Upload
truongkhue -
Category
Documents
-
view
214 -
download
0
Transcript of Water Analysis - University of Novi Sad i HPLC u analizi... · • High pressure • High...

Organic and InorganicMicropollutants
Pat SandraResearch Institute for Chromatography, Kortrijk, Belgium
Ghent University, Belgium
Water Analysis
New Developments inGC and GC/MSfor the analysis
of trace and ultratracecontaminants in water samples

State-of-the-artHPLC and LC/MS
technologiesfor water analysis
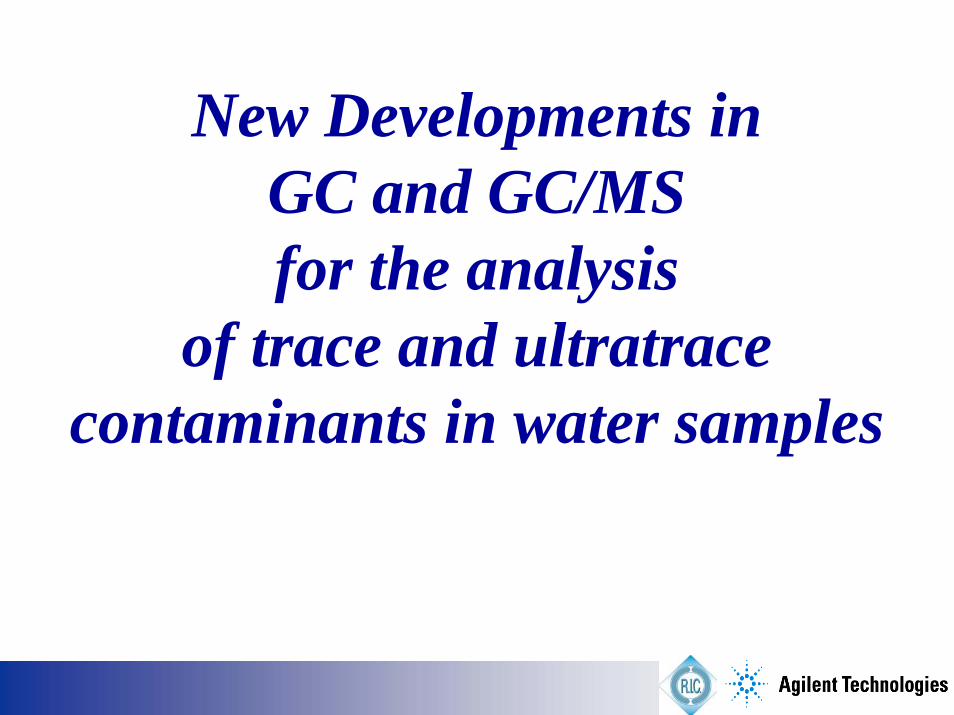
Micropollutants ?
• Those listed in official methods• VOCs• Semi-VOCs• PAHs• …
• Endocrine disrupting chemicals• Detergents• Organotin compounds• …
• Drug residues• Pharmaca• Contraceptiva• …
• Odour compounds
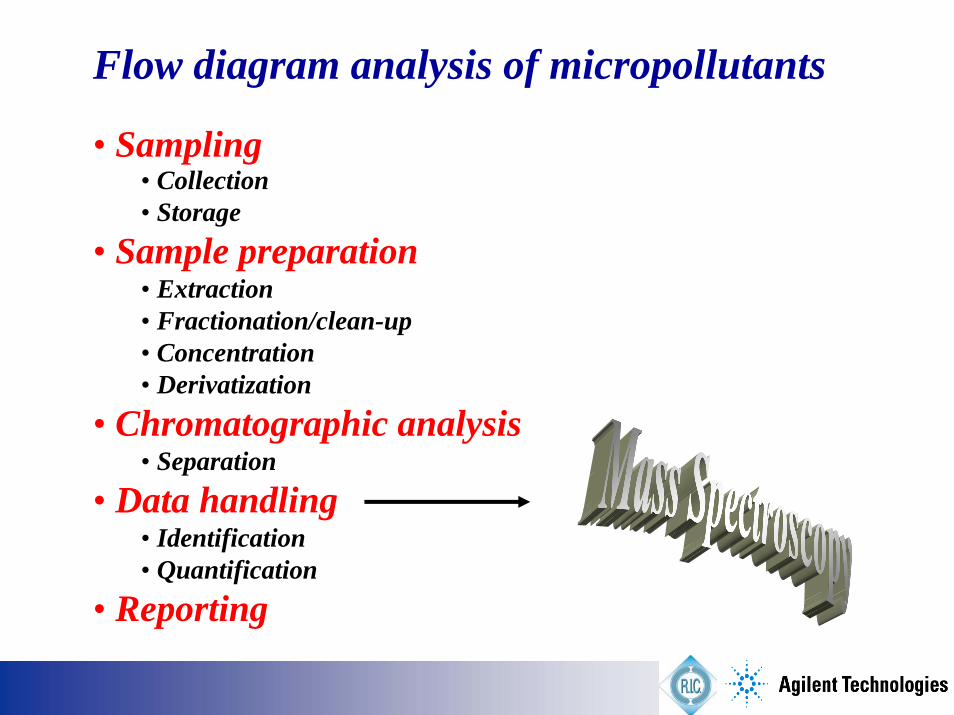
Flow diagram analysis of micropollutants
• Sampling• Collection• Storage
• Sample preparation• Extraction• Fractionation/clean-up• Concentration• Derivatization
• Chromatographic analysis• Separation
• Data handling• Identification• Quantification
• Reporting

What chromatographic technique to select ?
• For target compound analysis
If capillary GC can be applied, this shouldalways be the technique of choice !
• For multi-residue analysis
The application of both GC and LC ismandatory !GC preferably on a PDMS type columnLC preferably on a ODS type column

The “21st century” triangle ?
High
Throughput
Productivity Resolution
Robust

High Resolution GC PCB analysis
8 10 12 14 16 18 20
Hz
100
200
300
400
500
600
700
800
900
1000
ECD1 A, (HRES-PCB\LCIE0005.D) 8
.143
8.5
85 8.7
87 8
.906
- P
CB
8 8
.933
9.3
08
9.7
20 -
PC
B 18
9.7
72 9
.933
10.
112
10.
371 1
0.44
0 1
0.50
3 1
0.61
2 -
PCB
28 1
0.65
2 -
PCB
31
10.
850
10.
963
11.
006
11.
120
11.
278
11.
319
- PC
B 52
11.
419
11.
487
11.
514
11.
758
- PC
B 44
11.
842
11.
988
12.
021
12.
134
12.
194
12.
286
12.
401
12.
484
12.
547
- PC
B 70
12.
645
12.
784
12.
980
13.
095
- PC
B 10
1 1
3.21
3 1
3.34
9 13.
445
13.
553
13.
596
13.
654
13.
753
13.
822
13.
858
14.
108
- PC
B 10
5 1
4.19
4 1
4.27
5 1
4.34
6 1
4.37
8
14.
584
14.
626
14.
698
14.
821
- PC
B 15
3 1
4.91
3 -
PCB
151
15.
089
15.
155
15.
238
15.
289
15.
396
- PC
B 13
8 1
5.45
5 1
5.56
9 1
5.67
9 1
5.73
1 1
5.83
5 1
5.96
3 1
6.06
7 1
6.20
9 1
6.32
4 1
6.42
3 1
6.55
7 1
6.61
8 1
6.75
6 -
PCB
180
16.
816
16.
911
17.
066
17.
422
17.
462
17.
550
17.
617
17.
749
18.
092 1
8.51
5 -
PCB
195
19.
008
- PC
b 19
4
20.
148
105 m x 0.25 mm i.d. x 0.25 µm df RTX-51 mL/min hydrogen, constant flow100°C – 1 min – 40°C/min – 168°C – 0.1 min - 3°C/min – 290°C – 24.25 min (60 min)
40 m x 0.10 mm i.d. x 0.10 µm df DB-5
0.4 mL/min hydrogen, constant flow
80°C – 1 min –100°C/min – 160°C – 0 min - 9°C/min – 290°C –10 min (21 min)
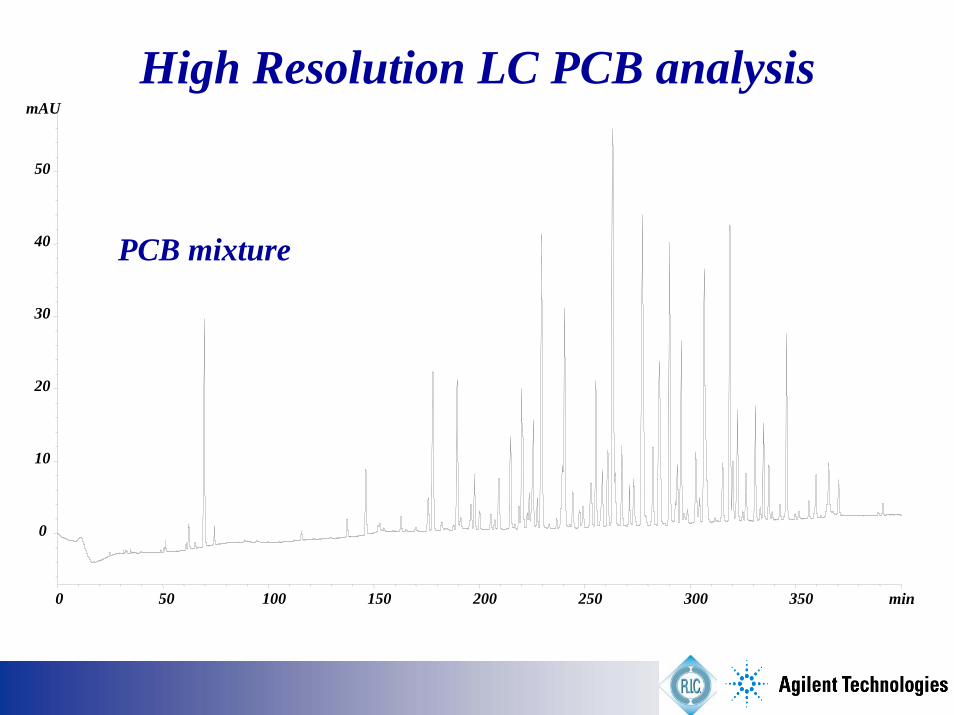
High Resolution LC PCB analysis
min0 50 100 150 200 250 300 350
mAU
0
10
20
30
40
50
PCB mixture
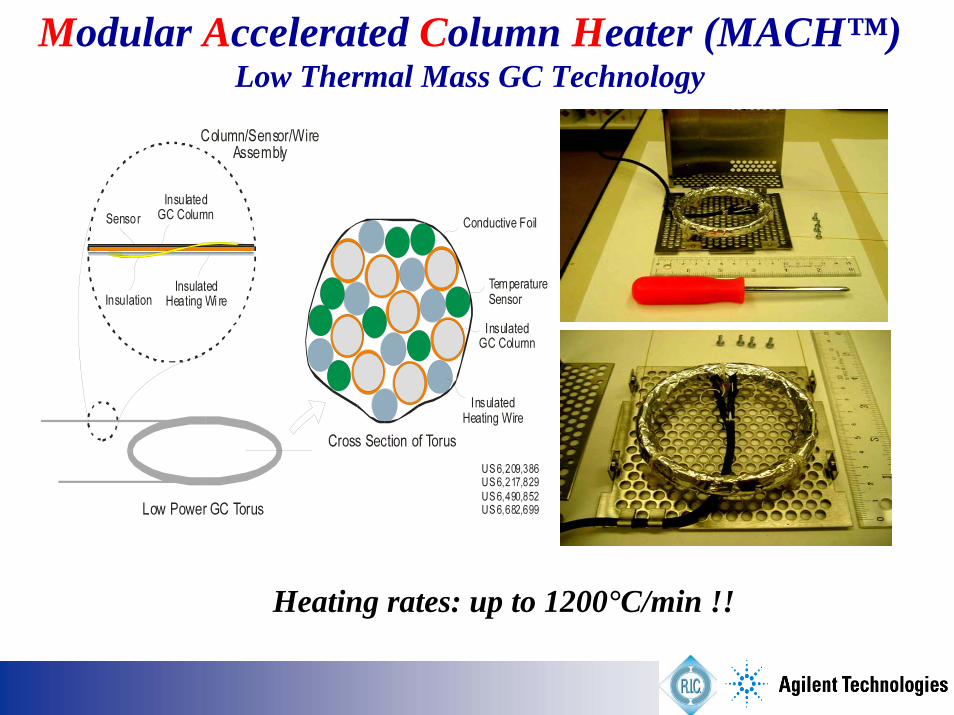
Modular Accelerated Column Heater (MACH™)Low Thermal Mass GC Technology
Heating rates: up to 1200°C/min !!

Gerstel MACH™ Twin Module
0.70 0.80 0.90 1.00 1.10 1.20 1.30 1.40 1.50 1.60 1.70 1.80 1.90 2.00 2.10
5000
10000
15000
20000
25000
30000
35000
40000
45000
50000
Time-->
Abundance
TIC: PCB-2.D
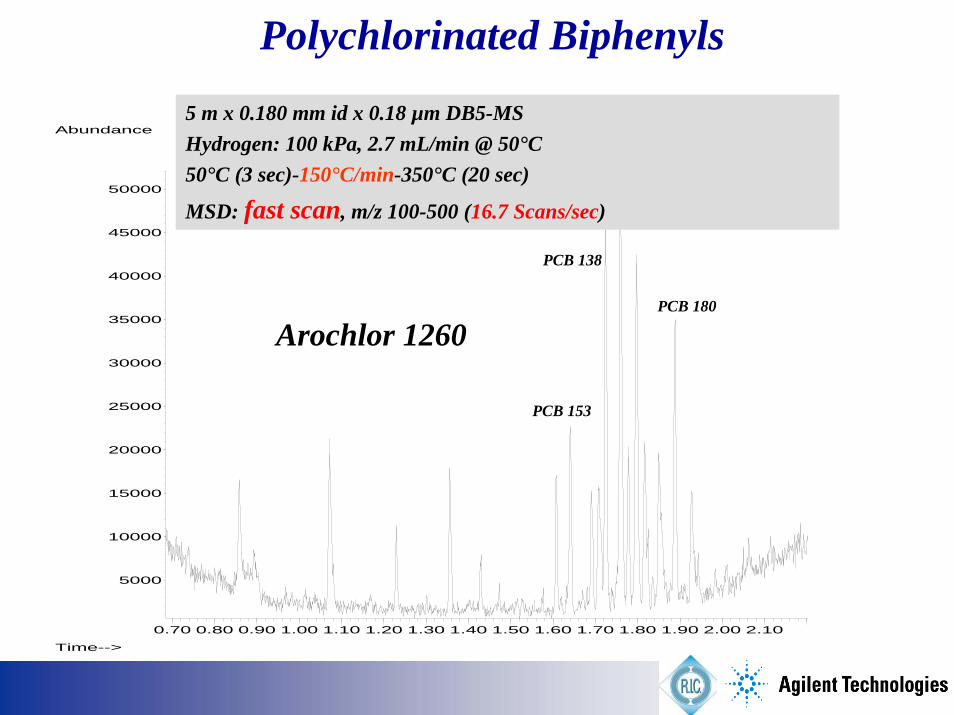
Polychlorinated Biphenyls
5 m x 0.180 mm id x 0.18 µm DB5-MSHydrogen: 100 kPa, 2.7 mL/min @ 50°C50°C (3 sec)-150°C/min-350°C (20 sec)
MSD: fast scan, m/z 100-500 (16.7 Scans/sec)
Arochlor 1260PCB 180
PCB 138
PCB 153

Recent developments – state-of-the art !
• In capillary GC and GC-MS
• In HPLC and LC/MS
• In sample preparation

Recent developments – state-of-the art !
• In capillary GC and GC-MS
• The concept of retention time locking• Deconvolution reporting software• Method translation software• Microfluidics• SCAN/SIM mode• Electron impact ionization• Positive and negative chemical ionization
Recent developments – state-of-the art !
• In HPLC and LC/MS
• Sub 2 µm particles• High pressure• High temperature
• Modes of ionization• ESI-APCI-APPI
• Mass Analyzer• Single quadrupole• Triple quadrupole• Ion trap• Time-of-flight
Recent developments – state-of-the art !
• In sample preparation

Recent developments – state-of-the art !
• In sample preparation
In the era of green chemistry … environmentalanalysis should be “environmentally” friendly !
The time is over that 1 L water is extracted with250 mL dichloromethane !
• Important
• miniaturization or even solventless !• from trace to ultratrace … contamination !• the problem of “adsorption” on the walls

Recent developments – state-of-the art !
• In capillary GC and GC-MS
• The concept of retention time locking• Deconvolution reporting software• Method translation software• Microfluidics• SCAN/SIM mode• Electron impact ionization• Positive and negative chemical ionization

1995: Agilent 6890 GCRetention Time Locking.
The ability to exactly match chromatographic retention times in one GC system to those in another GC system, using the same
nominal column.Identical Retention Times from Column to Column, Instrument to
Instrument, Lab to Lab, Country to Country

6.00 8.00 10.00 12.00 14.00 16.00 18.00 20.00
-12000000
-10000000
-8000000
-6000000
-4000000
-2000000
0
2000000
4000000
6000000
8000000
1e+07
1.2e+07
1.4e+07
1.6e+07
1.8e+07
2e+07
2.2e+07
Time-->
Abundance
TIC: WAXTEST.D (*)Signal: INJ00002.D\FID1A.CH (*)
GC-FID
GC-MS
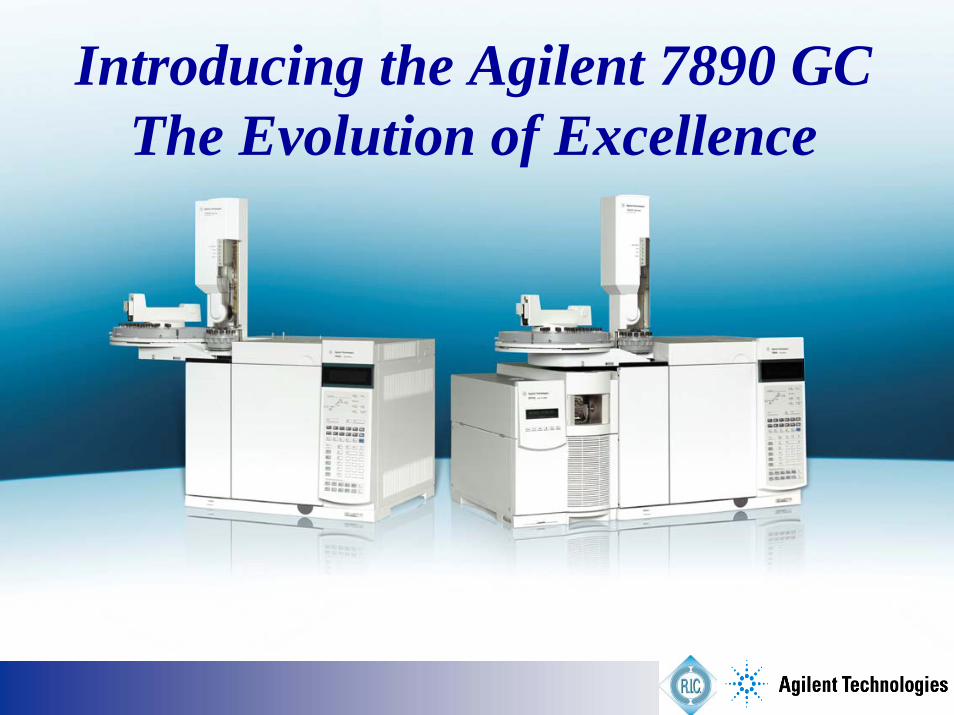
Introducing the Agilent 7890 GCThe Evolution of Excellence
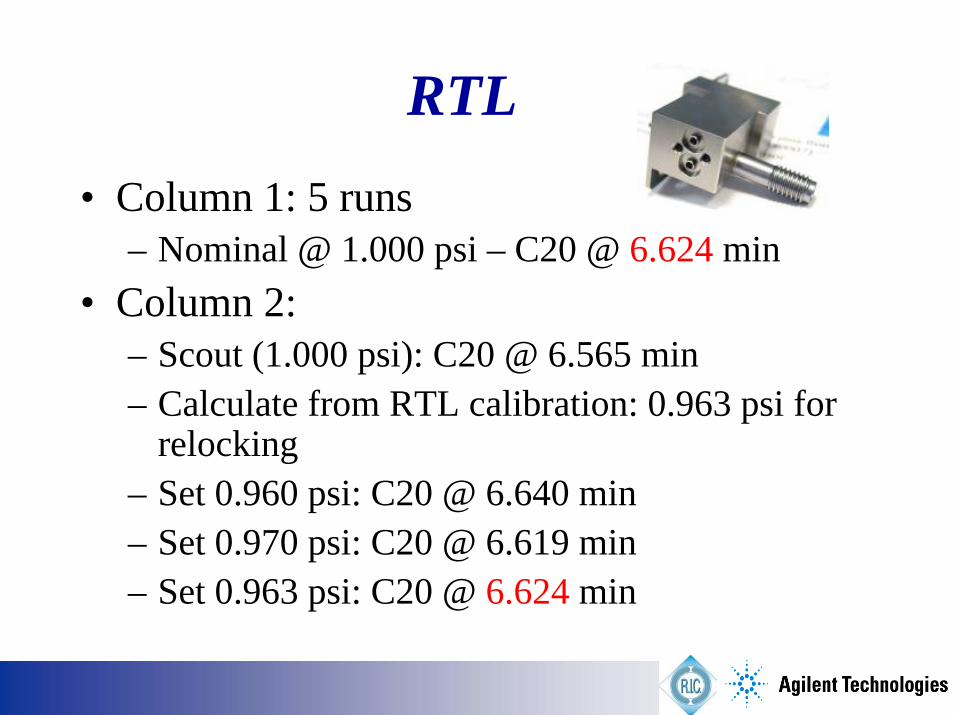
RTL
• Column 1: 5 runs– Nominal @ 1.000 psi – C20 @ 6.624 min
• Column 2:– Scout (1.000 psi): C20 @ 6.565 min– Calculate from RTL calibration: 0.963 psi for
relocking– Set 0.960 psi: C20 @ 6.640 min– Set 0.970 psi: C20 @ 6.619 min– Set 0.963 psi: C20 @ 6.624 min
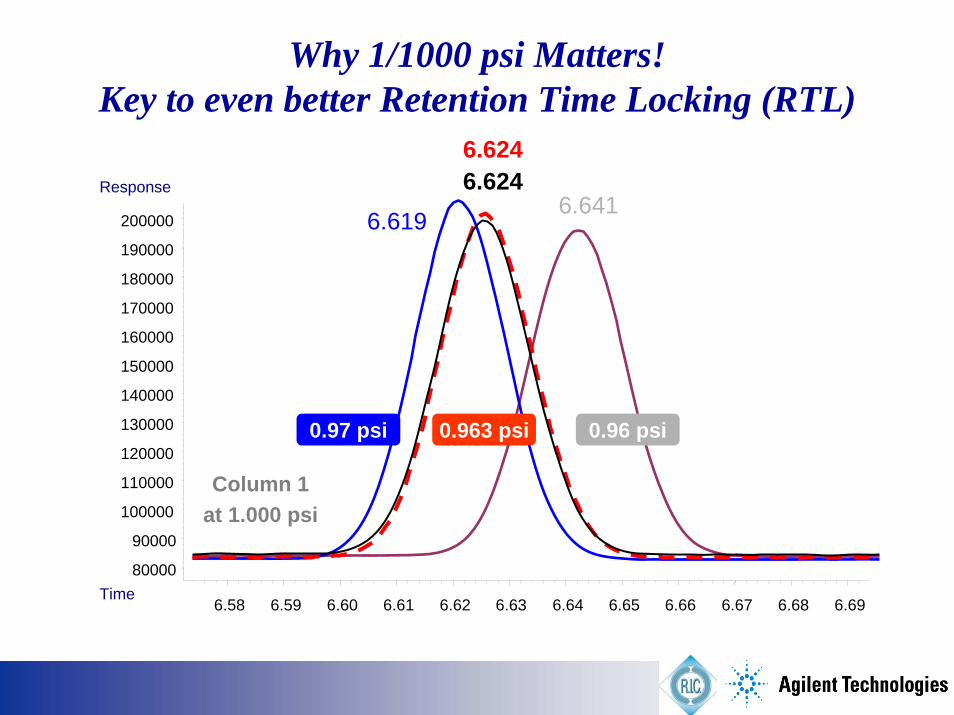
Why 1/1000 psi Matters!Key to even better Retention Time Locking (RTL)
6.58 6.59 6.60 6.61 6.62 6.63 6.64 6.65 6.66 6.67 6.68 6.69
80000
90000
100000
110000
120000
130000
140000
150000
160000
170000
180000
190000
200000
Time
Response6.641
6.619
6.6246.624
Column 1 at 1.000 psi
0.97 psi 0.963 psi 0.96 psi

Determination of Hydrocarbon Oil Index15 m x 530 μm x 0.15 µm HP-1 (SIMDIST)
min0 5 10 15 20 25
Norm.
0
50
100
150
200
250
300
350
400
450
FID1 A, (D:\FRANK\DATA\10-4-06\OIL\ASTM2 2006-10-05 09-28-57\101F0103.D)
C10
C20
C40
diesel
mineral oil
Integration parameters forgroup type separation verycritical

Recent developments – state-of-the art !
• In capillary GC and GC-MS
• The concept of retention time locking• Deconvolution reporting software• Method translation software• Microfluidics• SCAN/SIM mode• Electron impact ionization• Positive and negative chemical ionization
10.00 15.00 20.00 25.00 30.00 35.00
200000
400000
600000
800000
1000000
1200000
1400000
1600000
1800000
2000000
Time-->
Abundance
TIC: ERC-C5.D
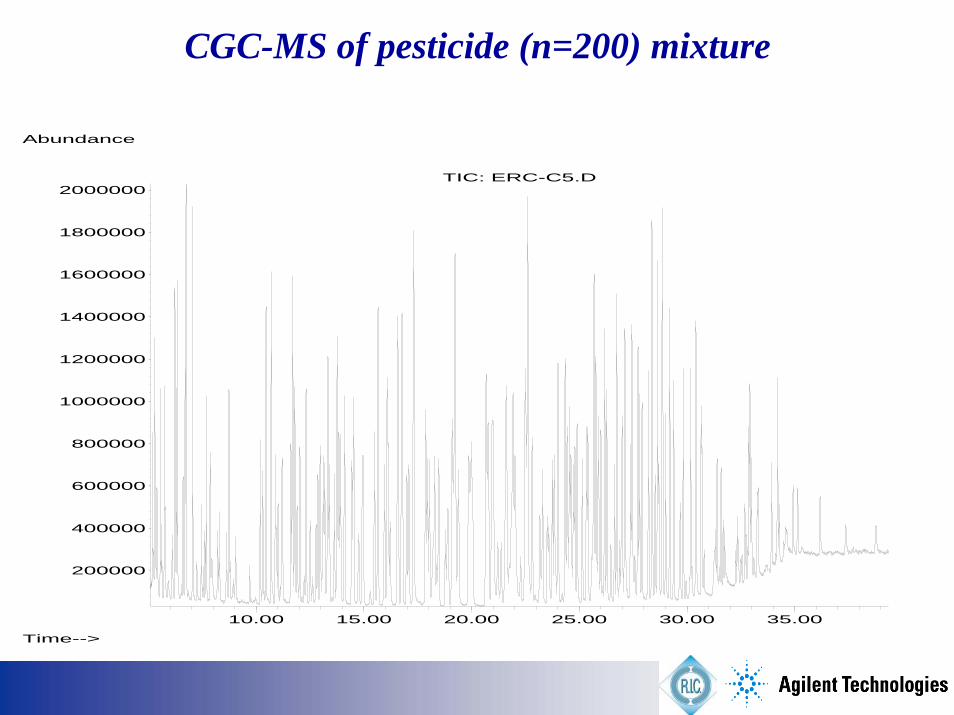
CGC-MS of pesticide (n=200) mixture

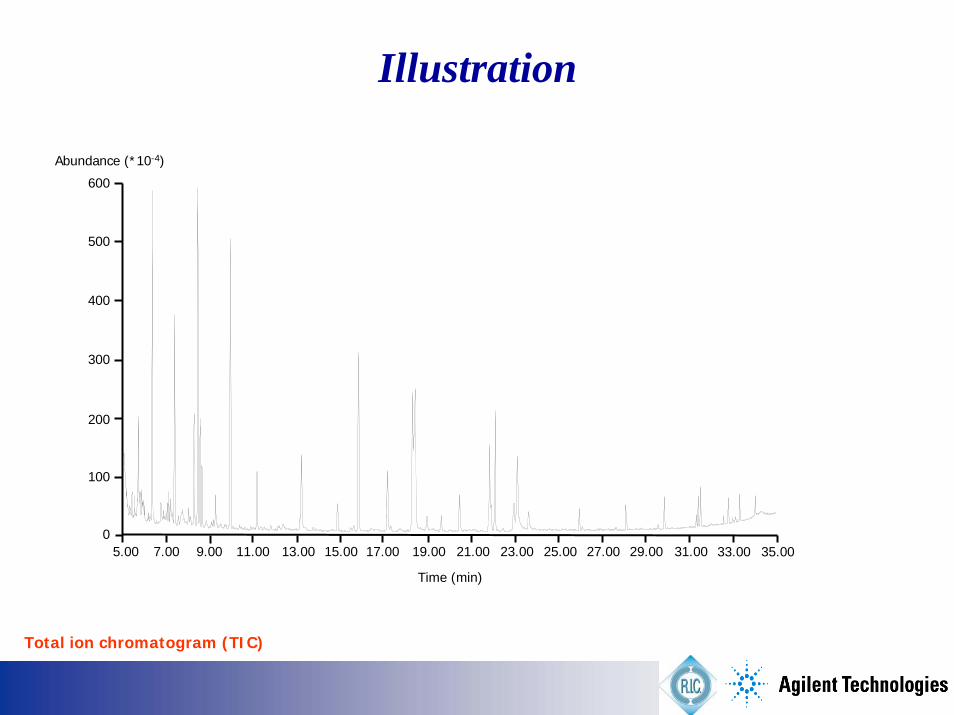
Illustration
Total ion chromatogram (TIC)
Time (min)
Abundance (*10-4)
5.00 7.00 9.00 11.00 13.00 15.00 17.00 19.00 21.00 23.00 25.00 27.00 29.000
200
100
300
400
500
600
31.00 33.00 35.00

DRS result
EIC: m/z 183, 197, 283
1 Chlorpyrifos
2 Procymidone
3 Permethrin I
4 Permethrin II
1
2
3
4
Time (min)
Abundance (*10-3)
5.00 7.00 9.00 11.00 13.00 15.00 17.00 19.00 21.00 23.00 25.00 27.00 29.000
80
40
120
160
200
240
31.00 33.00 35.00
N
ClCl
ClO
PO
OS
OO
Cl
Cl
O
N OCl
Cl
O
O
N OCl
Cl
O
O

Recent developments – state-of-the art !
• In capillary GC and GC-MS
• The concept of retention time locking• Deconvolution reporting software• Method translation software• Microfluidics• SCAN/SIM mode• Electron impact ionization• Positive and negative chemical ionization

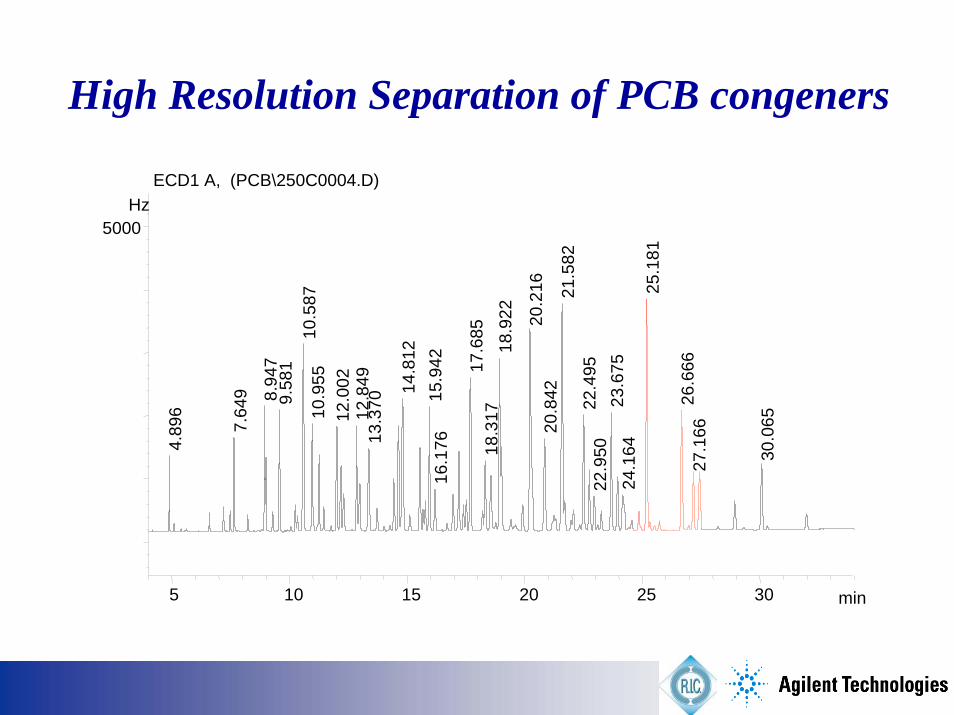
High Resolution Separation of PCB congeners
min5 10 15 20 25 30
Hz5000
ECD1 A, (PCB\250C0004.D)4.
896
7.64
9 8.94
79.
581
10.5
8710
.955
12.0
0212
.849
13.3
70
14.8
1215
.942
16.1
76
17.6
8518
.317
18.9
22 20.2
1620
.842
21.5
8222
.495
22.9
5023
.675
24.1
6425
.181
26.6
6627
.166
30.0
65

Fast RTL GC-µECD
• 30 m x 250 µm i.d. x 0.25 µm HP-5MS
• 71 kPa hydrogen.• 70°C - 2 min -
25°C/min - 150°C -3°C/min - 200°C -8°C/min - 300°C
• 10 m x 100 µm i.d. x 0.10 µm HP-5MS
• 233 kPa hydrogen.• 70°C - 0.45 min -
110°C/min - 150°C -13.2°C/min - 200°C -35.2°C/min - 300°C
Both splitless injection !
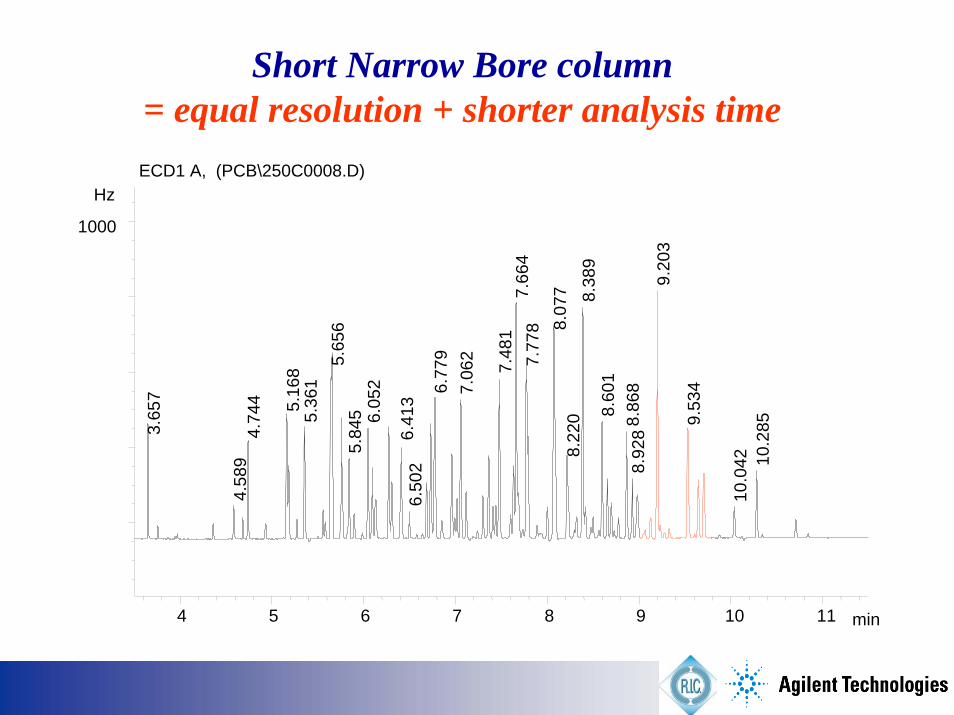
Short Narrow Bore column = equal resolution + shorter analysis time
min4 5 6 7 8 9 10 11
Hz
1000
ECD1 A, (PCB\250C0008.D)3.
657
4.58
94.
744 5.16
85.
361
5.65
65.
845 6.
052
6.41
36.
502
6.77
97.
062
7.48
17.
664
7.77
8 8.07
78.
220
8.38
98.
601
8.86
88.
928
9.20
3
9.53
4
10.0
42 10.2
85
Recent developments – state-of-the art !
• In capillary GC and GC-MS
• The concept of retention time locking• Deconvolution reporting software• Method translation software• Microfluidics• SCAN/SIM mode• Electron impact ionization• Positive and negative chemical ionization

QuickSwap for MS no-vent and Backflush
S/SL Inlet
Aux EPC In
5 psi during run
90 psi during backflush
MSD Transfer line
Quick Swap restrictor
Carrier/Aux flow Column flow
During run
During backflush
25+ psi during run
1 psi during backflush

12 14 16 18 20 22 24
-1200000
-1000000
-800000
-600000
-400000
-200000
200000
400000
600000
800000
1000000
1200000
Time, min
Abundance
PBB Mix-3 (scan) with Quick Swap (A)
PBB Mix-3 (scan) without Quick Swap (B)
*
Analysis of Polybrominated biphenyls: no cold spot
6.00 8.00 10.00 12.00 14.00 16.00 18.00 20.00 22.00 24.00 26.00 28.00
-5000000
0
5000000
1e+07
1.5e+07
2e+07
Time-->
Abundance
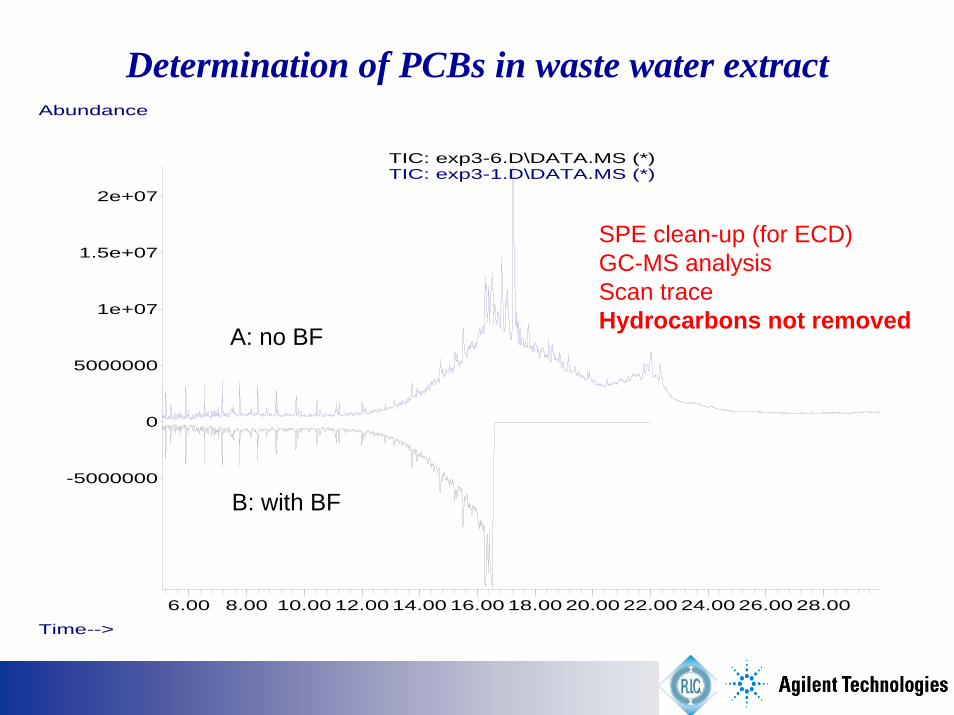
TIC: exp3-6.D\DATA.MS (*)TIC: exp3-1.D\DATA.MS (*)
A: no BF
B: with BF
SPE clean-up (for ECD)GC-MS analysisScan traceHydrocarbons not removed
Determination of PCBs in waste water extract

6.00 8.00 10.00 12.00 14.00 16.00 18.00 20.00 22.00 24.00 26.00 28.00
-150000
-100000
-50000
0
50000
100000
150000
200000
Time-->
Abundance
TIC: exp3-6.D\DATASIM.MS (*)TIC: exp3-1.D\DATASIM.MS (*)
A: no BF
B: with BF
GC-MS analysisSIM tracePCBs detected – same in both runs

Recent developments – state-of-the art !
• In capillary GC and GC-MS
• The concept of retention time locking• Deconvolution reporting software• Method translation software• Microfluidics• SCAN/SIM mode• Electron impact ionization• Positive and negative chemical ionization

PCI versus EI - Phthalates
TIC with most having m/z 149
MH+: m/z = 223
M+: m/z = 222
EI
PCI-NH4+
149
149

Abundance
Abundance
5.00 10.00 15.00 20.00 25.00 30.00 35.002e+076e+071e+08
1.4e+081.8e+082.2e+082.6e+08
3e+083.4e+08
TIC: 19AP001.D
EI/MS
10.00 15.00 20.00 25.00 30.00 35.00 40.00
200000
600000
1000000
1400000
1800000
2200000
2600000
Time-->
TIC: 21AP010.D
NCI/MS

Recent developments – state-of-the art !
• In HPLC and LC/MS
• Sub 2 µm particles• High pressure• High temperature
• Modes of ionization• ESI-APCI-APPI
• Mass Analyzer• Single quadrupole• Triple quadrupole• Ion trap• Time-of-flight

Using - smaller particle sizes
(sub-2 micron) - short columns- high pressure- high temperature
fast analysis with no lossin efficiency
High Productivity – High Throughput

Pesticides in water (DIN 38 407 F12)(triazines, phenylurea)
Classical method >60 min – 1200 method: 15 min with maintained R

Selectivity changes at increased temperaturePhenylurea pesticides – 15 cm x 4.6 mm i.d. x 1.8 µm
80°C
40°C
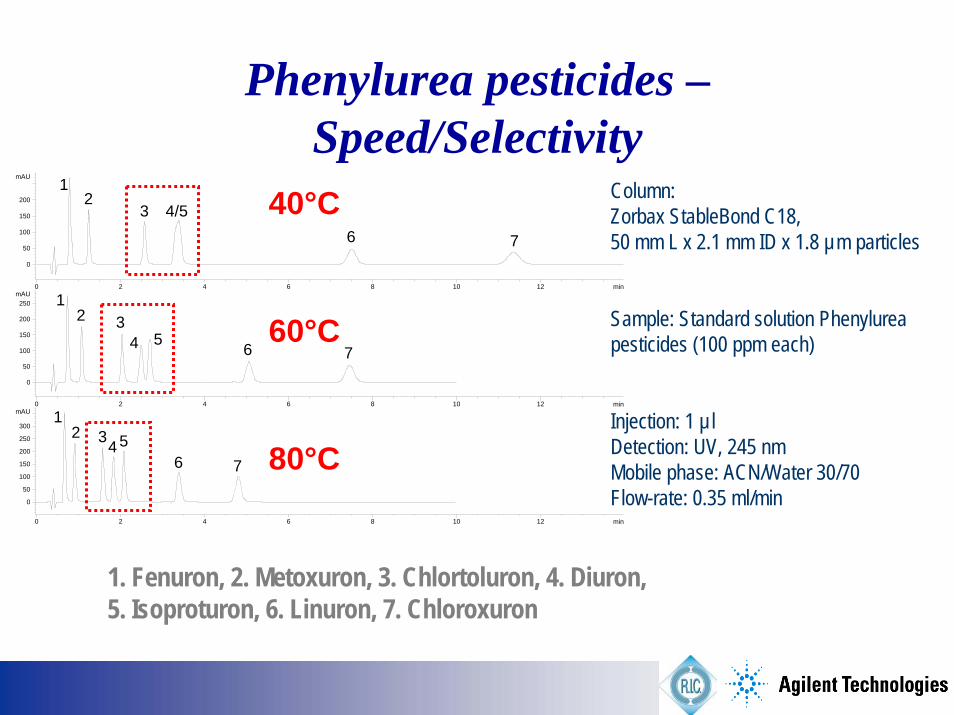
Phenylurea pesticides –Speed/Selectivity
Column: Zorbax StableBond C18, 50 mm L x 2.1 mm ID x 1.8 µm particles
Sample: Standard solution Phenylureapesticides (100 ppm each)
Injection: 1 µlDetection: UV, 245 nmMobile phase: ACN/Water 30/70Flow-rate: 0.35 ml/min
min0 2 4 6 8 10 12
mAU
0
50
100
150
200
min0 2 4 6 8 10 12
mAU
0
50
100
150
200
250
min0 2 4 6 8 10 12
mAU
0
50
100
150
200
250
300
1 2
3 4/5 6 7
1 2 3
4 5 6 7
1 2 3 4 5
6 7
40°C
60°C
80°C
1. Fenuron, 2. Metoxuron, 3. Chlortoluron, 4. Diuron,5. Isoproturon, 6. Linuron, 7. Chloroxuron
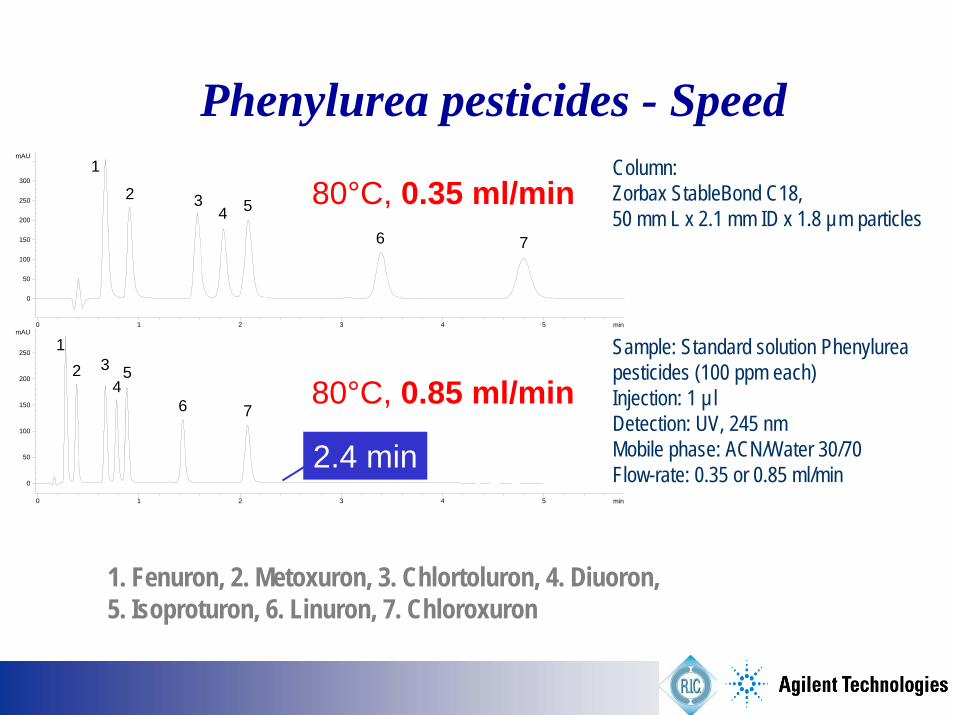
Phenylurea pesticides - SpeedColumn: Zorbax StableBond C18, 50 mm L x 2.1 mm ID x 1.8 µm particles
Sample: Standard solution Phenylureapesticides (100 ppm each) Injection: 1 µlDetection: UV, 245 nmMobile phase: ACN/Water 30/70Flow-rate: 0.35 or 0.85 ml/min
min0 1 2 3 4 5
mAU
0
50
100
150
200
250
300
min0 1 2 3 4 5
mAU
0
50
100
150
200
2501
2 3 4
5
6 7
1
2 3 4 5
6 7
80°C, 0.35 ml/min
80°C, 0.85 ml/min
2.4 min
1. Fenuron, 2. Metoxuron, 3. Chlortoluron, 4. Diuoron,5. Isoproturon, 6. Linuron, 7. Chloroxuron

16 PAHs in < 4 min
0 1 2 3 4
1
9
10
1112
13
1415
16
5
6
78
32
4
Column: ChromSphere 3 PAH, 100 mm x 2 mm, 3 µmMobile phase: water/acetonitrile, gradient 50 to 100% BTemperature: 30°CInjection: 1 µlSample: 100 ppm PAH mixtureDetection: DAD, 254 nm
1.6 mL/min560 bar

Agilent 1200 HT system equipped with 10 port switching valve: allows elimination of rinsing and regenerationtime
High Throughput
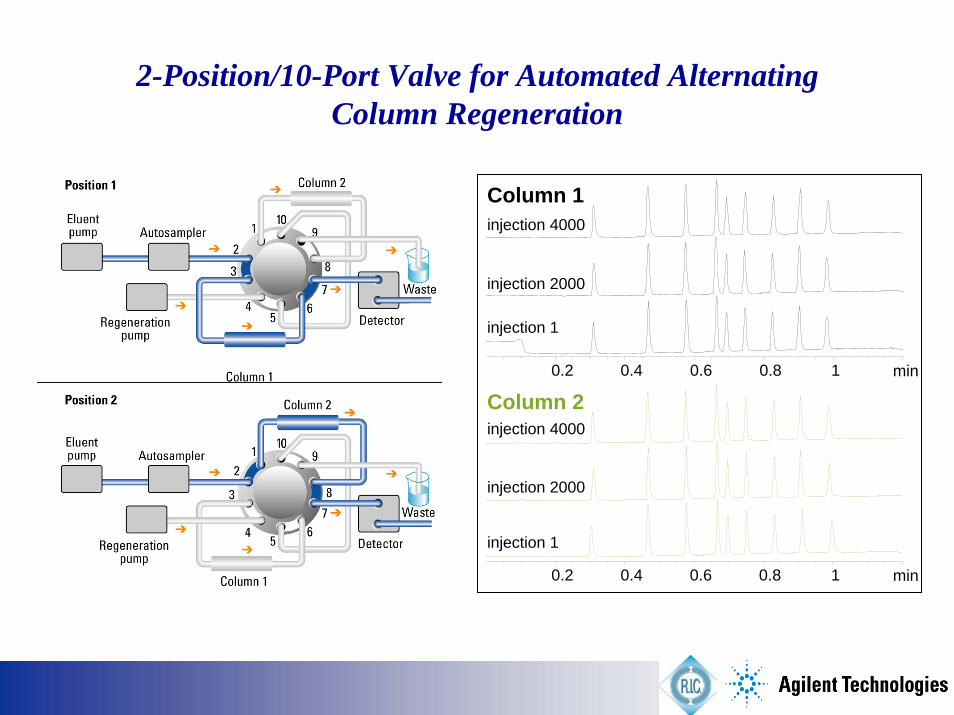
2-Position/10-Port Valve for Automated Alternating Column Regeneration
min0.2 0.4 0.6 0.8 1
injection 1
injection 4000Column 2
Column 1injection 4000
injection 2000
injection 2000
injection 1
min0.2 0.4 0.6 0.8 1
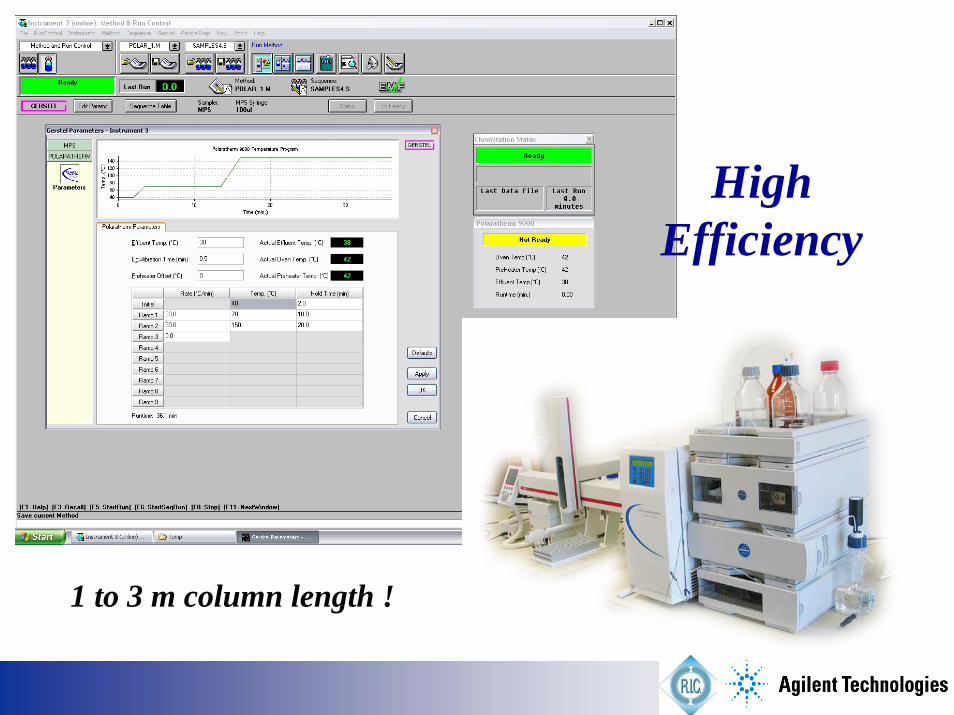
HighEfficiency
1 to 3 m column length !

5 10 15 20
mAU
0
50
100
150
200
250
25 cm
min20 40 60 80
mAU
0
20
40
60
80
100 cm

Recent developments – state-of-the art !
• In HPLC and LC/MS
• Sub 2 µm particles• High pressure• High temperature
• Modes of ionization• ESI-APCI-APPI
• Mass Analyzer• Single quadrupole• Triple quadrupole• Ion trap• Time-of-flight

Relative Applicability of Ionization TechniquesM
olec
ular
Wei
ght
Analyte Polarity
100,000
nonpolar very polar10
APCI
ESI
APPI
EI

Agilent G1978A Multimode Source
• Liquid enters the grounded nebulizer
• A charged aerosol is made in the ESI Zone
• The aerosol is dried by IR lamps
• Neutral analytes and ESI charged analytes pass through the APCI Zone
• ESI and APCI ions enter the capillary
Capillary
HPLC inlet
Nebulizer
Drying gas
Corona needle
ESI Zone
APCI ZoneThermalcontainer
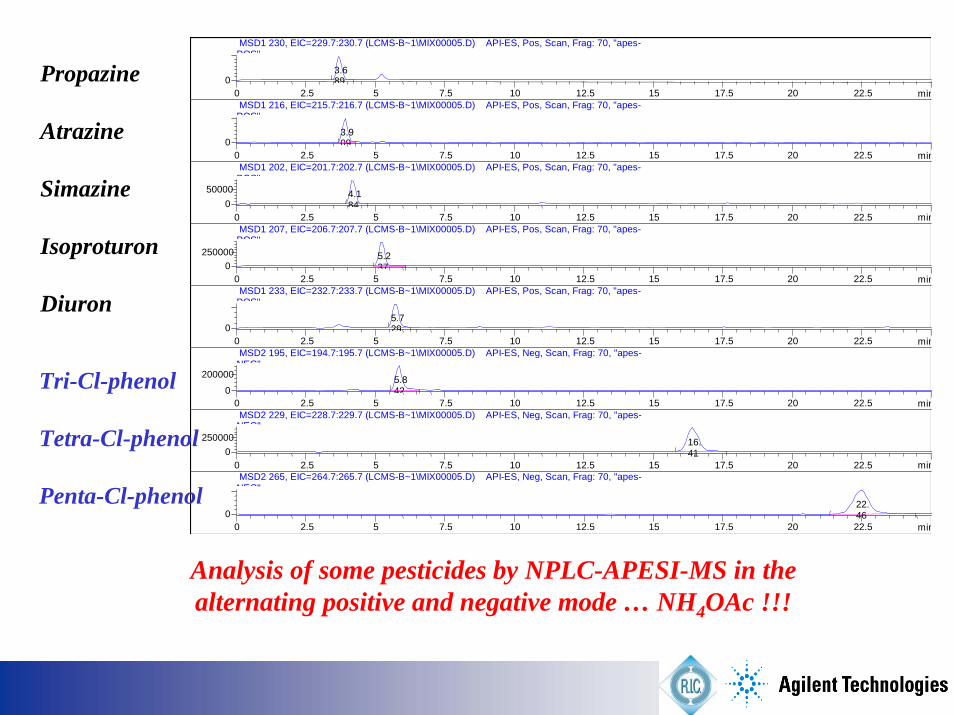
Analysis of some pesticides by NPLC-APESI-MS in the alternating positive and negative mode … NH4OAc !!!
min0 2.5 5 7.5 10 12.5 15 17.5 20 22.50
MSD1 230, EIC=229.7:230.7 (LCMS-B~1\MIX00005.D) API-ES, Pos, Scan, Frag: 70, "apes-POS"
3.689
min0 2.5 5 7.5 10 12.5 15 17.5 20 22.50
MSD1 216, EIC=215.7:216.7 (LCMS-B~1\MIX00005.D) API-ES, Pos, Scan, Frag: 70, "apes-POS"
3.909
min0 2.5 5 7.5 10 12.5 15 17.5 20 22.50
50000 MSD1 202, EIC=201.7:202.7 (LCMS-B~1\MIX00005.D) API-ES, Pos, Scan, Frag: 70, "apes-POS"
4.184
min0 2.5 5 7.5 10 12.5 15 17.5 20 22.50
250000 MSD1 207, EIC=206.7:207.7 (LCMS-B~1\MIX00005.D) API-ES, Pos, Scan, Frag: 70, "apes-POS"
5.237
min0 2.5 5 7.5 10 12.5 15 17.5 20 22.50
MSD1 233, EIC=232.7:233.7 (LCMS-B~1\MIX00005.D) API-ES, Pos, Scan, Frag: 70, "apes-POS"
5.729
min0 2.5 5 7.5 10 12.5 15 17.5 20 22.50
200000 MSD2 195, EIC=194.7:195.7 (LCMS-B~1\MIX00005.D) API-ES, Neg, Scan, Frag: 70, "apes-NEG"
5.842
min0 2.5 5 7.5 10 12.5 15 17.5 20 22.50
250000 MSD2 229, EIC=228.7:229.7 (LCMS-B~1\MIX00005.D) API-ES, Neg, Scan, Frag: 70, "apes-NEG"
16.41
min0 2.5 5 7.5 10 12.5 15 17.5 20 22.50
MSD2 265, EIC=264.7:265.7 (LCMS-B~1\MIX00005.D) API-ES, Neg, Scan, Frag: 70, "apes-NEG"
22.469
Propazine
Atrazine
Simazine
Isoproturon
Diuron
Tri-Cl-phenol
Tetra-Cl-phenol
Penta-Cl-phenol

Adapting an LC Method for LC/MSAP ESI
Replace non-volatile buffer with volatile buffere.g. NH4
+ -OAc, NH4+ -OOCH
Volatile buffer concentration should be < 10 mM
AP CIMust use volatile bufferVolatile buffer concentration should be < 60 mM

Buffers for APESI and APCI
Positive Ion (use pH <7.0; 5 preferred)Acetic acid, CH3COOH
Formic acid, HCOOH
Negative Ion (pH > 7.0; 9 preferred)Ammonium hydroxide
Triethylamine
Post-column addition of acid or base may be used to adjust the pH if the chromatography won't work at the desired pH

LC/MS Portfolio

Recent developments – state-of-the art !
• In HPLC and LC/MS
• Sub 2 µm particles• High pressure• High temperature
• Modes of ionization• ESI-APCI-APPI
• Mass Analyzer• Single quadrupole• Triple quadrupole• Ion trap• Time-of-flight
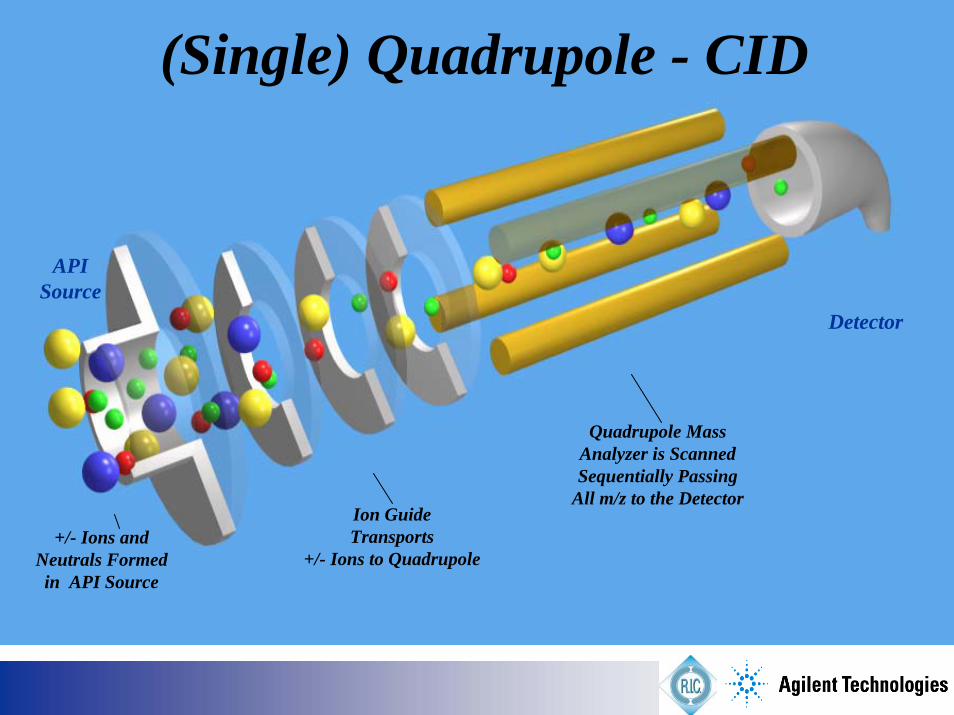
APISource
Detector
(Single) Quadrupole - CID
Ion GuideTransports
+/- Ions to Quadrupole
Quadrupole MassAnalyzer is ScannedSequentially Passing
All m/z to the Detector
+/- Ions andNeutrals Formedin API Source

min0 5 10 15 20 25
0
500
1000
1500
2000
2500
3000
Oxamyl (80V)Ideal fragmentor voltage: 60V
Carbendazime (80V)Ideal fragmentor voltage: 120V
Methomyl (80V)Ideal fragmentor voltage: 60V
LC-Q-MS

FRAGMENTOR=60 V
FRAGMENTOR=80 V
m/z50 100 150 200 250 300
0
20
40
60
80
100 192.
119
3.1
m/z50 100 150 200 250 300
0
20
40
60
80
100
192.
0
160.
1
193.
1
m/z50 100 150 200 250 300
0
20
40
60
80
100
160.
1
192.
0
161.
1
132.
1
FRAGMENTOR=120 V
N
NN
OO
CH3Mw = 191
[M+H]+
CARBENDAZIME - ACN/H2O (50:50) - Formate 50 mM
FRAGMENTOR = 80 V
N
NN
OO
CH3Mw = 191
FRAGMENTOR = 40 V
160.0
192.0
50 100 150 200 250 300 350 m/z0.00
0.25
0.50
0.75
1.00
1.256x10
Intens.
160.0
192.0
50 100 150 200 250 300 350 m/z0
2
4
6
5x10Intens.
FRAGMENTOR = 120 V
160.0
192.0
50 100 150 200 250 300 350 m/z0
1
2
34x10
Intens.

CARBAMATES IN DRINKING WATER
Waldbronn Analytical Division, Liquid ChromatographyDER30
EPA METHOD 531

1. Column Hypersil ODS (100 mm, 2.1 mm, 5 µm)
2. Mobile phase A: 90% 10mM NH4+OAc - 10% MeOH
B: 10% 10mM NH4+OAc - 90% MeOH
90%A 10%A in 10 min
3. Oven temperature 25°C
4. Flow rate 0.25 ml/min
5. Ionization mode Electrospray (ESI) - +
6. Fragmentor voltage 60 V
7. Capillary voltage 4000V
8. Drying gas 12 l/min 350°C
9. Nebulizer gas 35 psi

Direct injection – water sample – 100 µL injection
min4 5 6 7 8 9 10 11 12
MSD1 278, EIC=277.7:278.7 API-ES, Pos, SIM, Frag: 60
min4 5 6 7 8 9 10 11 12
MSD1 116, EIC=115.7:116.7 API-ES, Pos, SIM, Frag: 60
min4 5 6 7 8 9 10 11 12
MSD1 222, EIC=221.7:222.7 API-ES, Pos, SIM, Frag: 60
min4 5 6 7 8 9 10 11 12
MSD1 202, EIC=201.7:202.7 API-ES, Pos, SIM, Frag: 60
min4 5 6 7 8 9 10 11 12
MSD1 239, EIC=238.7:239.7 API-ES, Pos, SIM, Frag: 60

min4 5 6 7 8 9 10 11 12
*MSD1 278, EIC=277.7:278.7 API-ES, Pos, SIM, Frag: 60
4.26
6
Oxamyl
min4 5 6 7 8 9 10 11 12
*MSD1 116, EIC=115.7:116.7 API-ES, Pos, SIM, Frag: 60
10.0
33
Aldicarb
min4 5 6 7 8 9 10 11 12
*MSD1 222, EIC=221.7:222.7 API-ES, Pos, SIM, Frag: 60
11.3
37
Carbofuran
min4 5 6 7 8 9 10 11 12
*MSD1 202, EIC=201.7:202.7 API-ES, Pos, SIM, Frag: 60
11.8
20
Carbaryl
min4 5 6 7 8 9 10 11 12
*MSD1 239, EIC=238.7:239.7 API-ES, Pos, SIM, Frag: 60"
12.4
50
Pirimicarb
Direct injection – 0.3 ppb spiked water sample – 100 µL injection

SPE Conditions
1. SPE Cartridge C18 – Agilent - Supelco - Varian
2. Conditioning 2 x 3 mL MeCN-MeOH 50%-50% 1 x 3 mL MeOH2 x 3 mL H2O
3. Loading 50 mL Sample
4. Washing 2 x 3 mL H2O
5. Drying the cartridge under vacuum for 10 minutes
6. Elution 3 x 1 mL MeCN-MeOH 50%-50%
7. Evaporate to dryness and redissolve in 200 µL H2O -> LCMS

min2 4 6 8 10 12
*MSD1 TIC, MS File API-ES, Pos, SIM, Frag: 60
2 4 6 8 10 12
*MSD1 278, EIC=277.7:278.7 API-ES, Pos, SIM, Frag: 60
3.98
4
Oxamyl
2 4 6 8 10 12
*MSD1 163, EIC=162.7:163.7 API-ES, Pos, SIM, Frag: 60
4.93
0
Methomyl
2 4 6 8 10 12
*MSD1 116, EIC=115.7:116.7 API-ES, Pos, SIM, Frag: 60
9.99
3
Aldicarb
2 4 6 8 10 12
*MSD1 222, EIC=221.7:222.7 API-ES, Pos, SIM, Frag: 60
11.3
08
Carbofuran
2 4 6 8 10 12
*MSD1 202, EIC=201.7:202.7 API-ES, Pos, SIM, Frag: 60
11.7
80
Carbaryl
min2 4 6 8 10 12
*MSD1 239, EIC=238.7:239.7 API-ES, Pos, SIM, Frag: 60
12.4
14
Pirimicarb
SPE – 0.05 ppb – LC/MS Analysis

LC-MS-MS
Oxamyl (50V)Ideal fragmentor voltage: 60V
Carbendazime (50V)Ideal fragmentor voltage: 80V
Methomyl (50V)Ideal fragmentor voltage: 50V
2 4 6 8 10 Time [min]0
1
2
3
4
5
5x10
Intens.
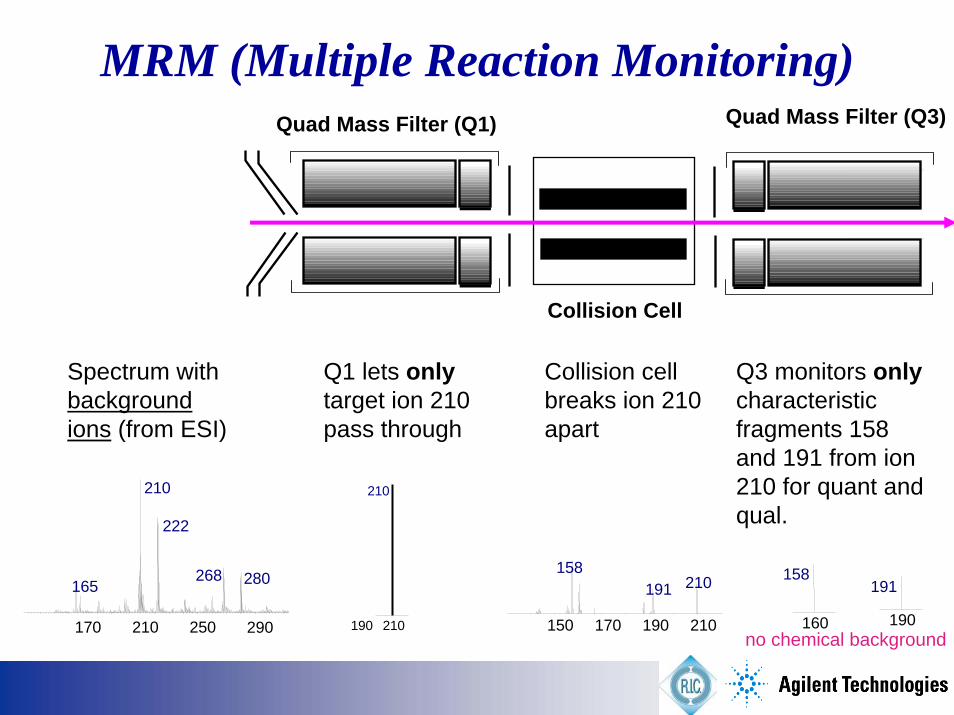
MRM (Multiple Reaction Monitoring)
170 210 250 290
210
222
268 280165
Quad Mass Filter (Q3)Quad Mass Filter (Q1)
Collision Cell
Spectrum with backgroundions (from ESI)
Q1 lets onlytarget ion 210 pass through
190 210
210
Collision cell breaks ion 210 apart
150 170 190 210
210158
191
Q3 monitors onlycharacteristic fragments 158 and 191 from ion 210 for quant and qual.
160
158
190
191
no chemical background

Pharmaceuticals
Dec., 2006Page 73
Filter water samples in the field or in the laboratory using 0.7-µm glass fiber filters.
Pump 1-L of the filtered water sample, at a flow rate of 10 mL/min, through an Oasis HLB (SPE) cartridge containing 0.5 g of sorbent.
Elute the HLB column with 6 mL of methanol followed by 4 mL of 0.1% TFA in methanol.
Add internal standard (ISTD). The extract is reconstituted to 1 mL.
The resulting solvent extract is then concentrated to approximately 100 µL.
1 L final volume of 1 mL.
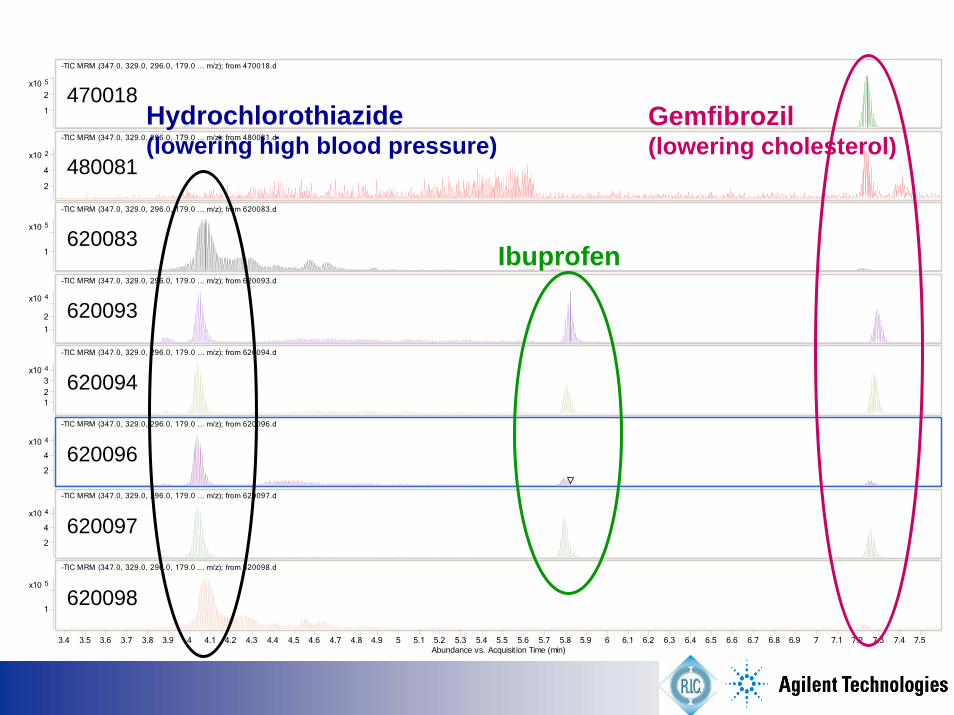
Pharmaceuticals in waste water
Pharmaceuticals
Dec., 2006Page 74
5x10
1
2
Abundance vs. Acquisition Time (min)3.4 3.5 3.6 3.7 3.8 3.9 4 4.1 4.2 4.3 4.4 4.5 4.6 4.7 4.8 4.9 5 5.1 5.2 5.3 5.4 5.5 5.6 5.7 5.8 5.9 6 6.1 6.2 6.3 6.4 6.5 6.6 6.7 6.8 6.9 7 7.1 7.2 7.3 7.4 7.5
-TIC MRM (347.0, 329.0, 296.0, 179.0 ... m/z); from 470018.d
2x10
2
4
-TIC MRM (347.0, 329.0, 296.0, 179.0 ... m/z); from 480081.d
5x10
1
-TIC MRM (347.0, 329.0, 296.0, 179.0 ... m/z); from 620083.d
4x10
1
2
-TIC MRM (347.0, 329.0, 296.0, 179.0 ... m/z); from 620093.d
4x10
123
-TIC MRM (347.0, 329.0, 296.0, 179.0 ... m/z); from 620094.d
4x10
2
4
-TIC MRM (347.0, 329.0, 296.0, 179.0 ... m/z); from 620096.d
4x10
2
4
-TIC MRM (347.0, 329.0, 296.0, 179.0 ... m/z); from 620097.d
5x10
1
-TIC MRM (347.0, 329.0, 296.0, 179.0 ... m/z); from 620098.d
470018
480081
620083
620093
620094
620096
620097
620098
Hydrochlorothiazide(lowering high blood pressure)
Ibuprofen
Gemfibrozil(lowering cholesterol)

TOF- Identification of Unknowns with Accurate Mass Measurement
– Use of databases for compound id from empirical formula
– Use of in-source accurate-mass fragmentation for confirmation

Analysis of a unknown compound and identification
• Extracted mass spectrum peak 5.29
3

3

3
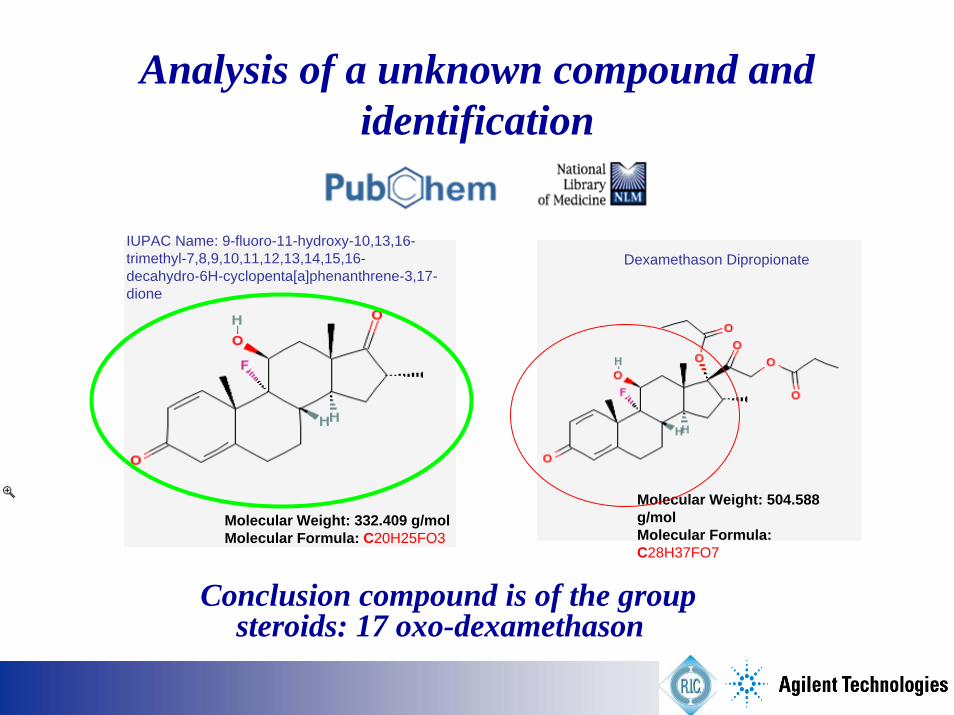
Analysis of a unknown compound and identification
Conclusion compound is of the groupsteroids: 17 oxo-dexamethason
Molecular Weight: 504.588 g/molMolecular Formula: C28H37FO7
Molecular Weight: 332.409 g/molMolecular Formula: C20H25FO3
IUPAC Name: 9-fluoro-11-hydroxy-10,13,16-trimethyl-7,8,9,10,11,12,13,14,15,16-decahydro-6H-cyclopenta[a]phenanthrene-3,17-dione
Dexamethason Dipropionate
3

Recent developments – state-of-the art !
• In sample preparation
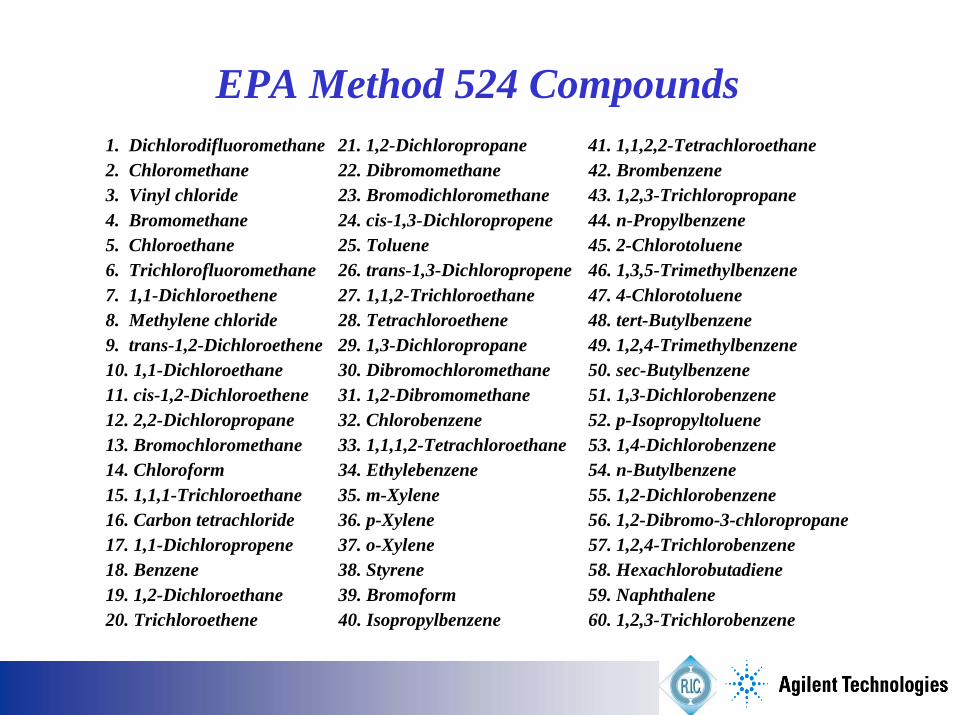
EPA Method 524 Compounds1. Dichlorodifluoromethane 21. 1,2-Dichloropropane 41. 1,1,2,2-Tetrachloroethane2. Chloromethane 22. Dibromomethane 42. Brombenzene3. Vinyl chloride 23. Bromodichloromethane 43. 1,2,3-Trichloropropane4. Bromomethane 24. cis-1,3-Dichloropropene 44. n-Propylbenzene5. Chloroethane 25. Toluene 45. 2-Chlorotoluene6. Trichlorofluoromethane 26. trans-1,3-Dichloropropene 46. 1,3,5-Trimethylbenzene7. 1,1-Dichloroethene 27. 1,1,2-Trichloroethane 47. 4-Chlorotoluene8. Methylene chloride 28. Tetrachloroethene 48. tert-Butylbenzene9. trans-1,2-Dichloroethene 29. 1,3-Dichloropropane 49. 1,2,4-Trimethylbenzene10. 1,1-Dichloroethane 30. Dibromochloromethane 50. sec-Butylbenzene11. cis-1,2-Dichloroethene 31. 1,2-Dibromomethane 51. 1,3-Dichlorobenzene12. 2,2-Dichloropropane 32. Chlorobenzene 52. p-Isopropyltoluene13. Bromochloromethane 33. 1,1,1,2-Tetrachloroethane 53. 1,4-Dichlorobenzene14. Chloroform 34. Ethylebenzene 54. n-Butylbenzene15. 1,1,1-Trichloroethane 35. m-Xylene 55. 1,2-Dichlorobenzene16. Carbon tetrachloride 36. p-Xylene 56. 1,2-Dibromo-3-chloropropane17. 1,1-Dichloropropene 37. o-Xylene 57. 1,2,4-Trichlorobenzene18. Benzene 38. Styrene 58. Hexachlorobutadiene19. 1,2-Dichloroethane 39. Bromoform 59. Naphthalene20. Trichloroethene 40. Isopropylbenzene 60. 1,2,3-Trichlorobenzene

Analytes Added to Method 524.2
61. Acetone 73. 1-Chlorbutane
62. Diethyl ether 74. Chloroacetonitrile
63. Methyl iodide 75. 2-Nitropropane
64. Acrylonitrile 76. Methylmethacrylate
65. Allyl Chloride 77. 1,1-Dichloro-2-propanone
66. Carbon disulfide 78. 4-Methyl-2-pentanone (MIBK)
67. Methyl-tert-butyl ether 79. Ethylmethacrylate
68. Propionitrile 80. 2-Hexanone
69. 2-Butanone 81. trans-1,4-Dichloropropanone
70. Methacrylonitrile 82. Pentachloroethane
71. Methyl acrylate 83. Hexachloroethane
72. Tetrahydrofuran 84. Nitrobenzene

Volatile Organic Compounds (VOCs)
• Purge and Trap (P&T)
• Static Headspace (SHS)
• Solid Phase Microextraction (SPME)
• Headspace Sorptive Extraction (HSSE)
EPA Method 524.2

Volatile Organic Compounds (VOCs)… the Purgeables
1
23
4
5 6
7
8 910,11
12
13
14
15 1617,18
19
20
2122
23
24
26
2728
29,30
31
32
33
34
3536
37
3839
40,41
42
43,44
45
4647
48
49
50
51
52
53
54
55
56
57
58
59,60
61
62
63,64
65 66
67
68
69
70
71
7273
74
7576
77
78
79
80
81
82
83
84
85
86
87
88
89
25
0.00 5.00 10.00 15.00 20.00 25.00
Column: 60m x 0.25mm x 1.4 µm, DB-VRX
Semivolatile Organic Compounds (SVOCs)
• Liquid-liquid Extraction (LLE)
• Solid Phase Extraction (SPE)
• Solid Phase Microextraction (SPME)
• Stir Bar Sorptive Extraction (SBSE-Twister)
EPA Method 525.2

1 Isophorone
2 1,3-Dimethyl-2-nitrobenzene (SS)
3 Dichlorovos
4 Hexchlorocyclopentadiene
5 EPTC
6 Mevinphos
7 Vernolate
9 Dimethyl phthalate
10 Terrazole (aka Etridazole)
11 2,6-Dinitrotoluene
12 Tillam (aka Pebulate)
13 Acenaphthylene
14 Acenaphthene-d10 (IS#1)
15 Chlorneb
16 2-Chlorobiphenyl
17 Tebuthiuron
18 2,4-Dinitrotolune
19 Molinate
20 Diethyl phthalate
21 Fluorene
22 Propachlor
23 Ethoprop
24 Cycloate
25 Chlorpropham
26 Trifluralin
27 a-BHC
28 2,3-Dichlorobiphenyl
29 Hexachlorobenzene
30 Gesatamine (aka Atraton)
31 Prometon
32 Atrazine
33 Simazine
34 b-BHC
35 Pentachlorophenol
36 Propazine
37 g-BHC
38 Terbufos
39 Pronamide
40 Diazinon
41 Phenanthrene-d10 (IS#2)

42 Chlorothalonil
43 Phenanthrene
44 Terbacil
45 Methyl paraoxon
46 Disulfoton
47 Anthracene
48 d-BHC
49 2,4,5-Trichlorobiphenyl
50 Metribuzin
51 Alachlor
52 Simetryn
53 Ametryn
54 Heptachlor
55 Prometryne
56 Prebane (aka Terbutryne)
57 Bromacil
58 Di-n-butyl phthalate
59 2,2´,4,4´-Tetrachlorobiphenyl
60 Metolachlor
61 Dursban (aka Chlorpyrifos)
62 Cyanazine
63 Dacthal (aka DCPA methyl ester)
64 Aldrin
65 Triadimefon
66 Dephenimid
67 MGK-264 (isomer A)
68 MGK-264 (isomer B)
69 Heptachlor epoxide
70 2,2´,3´,4,6-Pentachlorobiphenyl
71 Merphos
72 g-Chlordane
73 Tetrachlorvinphos (aka Stirifos)
74 Butachlor
75 Pyrene-d10 (SS)
76 Pyrene
77 a-Chlordane
78 Endosulfan I
79 trans-Nonachlor
80 Fenamiphos
81 Napropamide

82 Tricyclazole
83 p,p´-DDE
84 DEF
85 2,2´,4,4´,5,6´-Hexachlorobiphenyl
86 Dieldrin
87 Carboxin
88 Endrin
89 Chlorobenzilate
90 Endosulfan II
91 p,p´-DDD
92 Endrin aldehyde
93 Norflurazon
94 Benzyl butyl phthalate
95 Endosulfan sulfate
96 p,p´-DDT
97 Hexazinone
98 bis(2-Ethylexyl) adipate
99 Triphenylphosphate (SS)
100 Endrin ketone
101 2,2´,3,3´,4,5´,6,6´-Octachlorobiphenyl
102 Benz[a]anthracene
103 Chrysene-d12 (IS#3)
104 2,2´,3,3´,4,5´,6,6´-Octachlorobiphenyl
105 Methoxychlor
106 Chrysene
107 bis(2-Ethylhexyl)phthalate
108 Fenarimol
109 cis-Permethrin
110 trans-Permethrin
111 Benzo[b]fluoranthene
112 Benzo[k]fluoranthene
113 Fluridone
114 Benzo[a]pyrene
115 Pereylene-d12 (SS)
116 Ideno[1,2,3-cd]pyrene
117 Dibenz[a,h]anthracene
118 Benzo[g,h]perylene

The Semivolatile Organic Compounds (VOCs)
6.0 7.0 8.0 9.0 10.0 11.0 12.0 13.0 14.0 15.0 16.0 17.0 18.0 19.0 20.0 21.0 22.0 23.0 24.0 25.0 26.0 27.0 28.0
1-5
6-1927-48
20-26
49-71
72-99
100-115
116-118
Column: 30 m x 0.25 mm x 0.25 µm, DB-5MS


Analytes Interferences
Condition Loadsample
Wash Elute
All modes of LC availableReversed Phase - Normal Phase - Ion Exchange, RAM, MIP, etc.NOT Size Exclusion
-

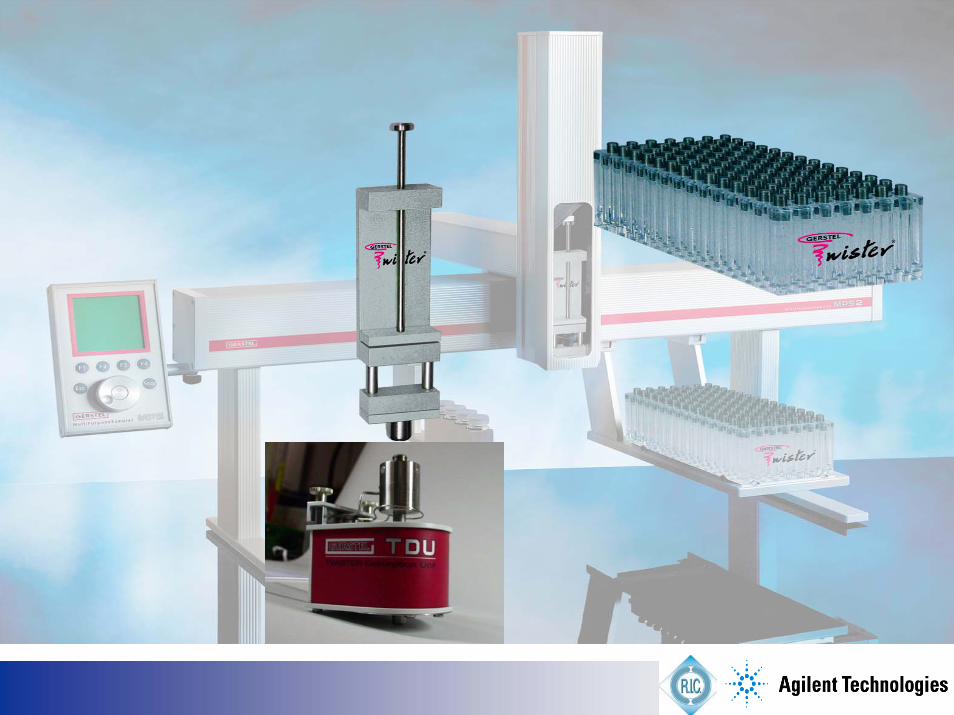
Multipurpose Sampler for Automated Sample Prep/Injection

Automated – Miniaturized – Solvent Free- Static Headspace (SHS)- In-tube Extraction (ITEX)- Dynamic Headspace (DHS)- Solid Phase Micro-Extraction (SPME)- Stir Bar Sorptive Extraction (SBSE)(TwisterTM)- Headspace Sorptive Extraction (HSSE)
- passive sampling (PSSE) - PATCH- Automatic Liner Exchange (ALEXTM)- LC-GC (on-line clean-up/fractionation)- Solid Phase Extraction (not on line yet)

Gerstel GmbHMulheim a/d RuhrGermany
Channel partner Agilent

CH3
Si O
CH3Best GC stationary phase (apolar)
Decomposition products very specific and not related with solutes of interest
Retention indices available for a wide number of compounds
PDMS/water distribution ∼ Octanol/water distribution, Ko/w values can be applied(if not available log P can be calculated using KOWWIN)
Best Sorptive Extraction MediumPDMS
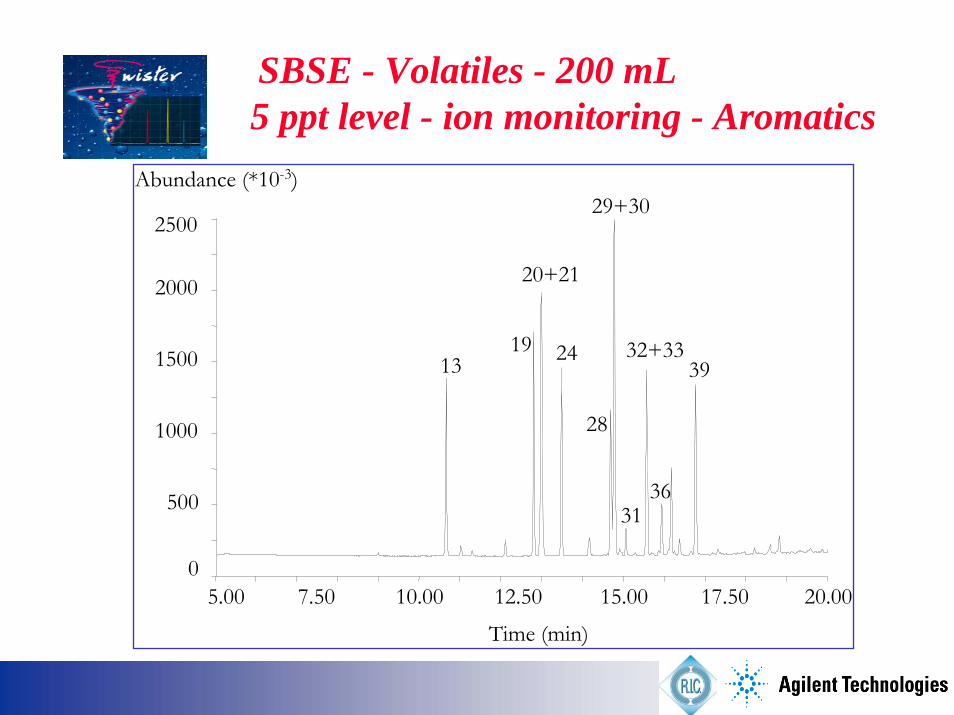
SBSE - Volatiles - 200 mL5 ppt level - ion monitoring - Aromatics
0
500
1000
1500
2000
2500
Abundance (*10-3)
5.00 7.50 10.00 12.50 15.00 17.50 20.00
Time (min)
1319
20+21
24
28
29+30
32+33
3136
39
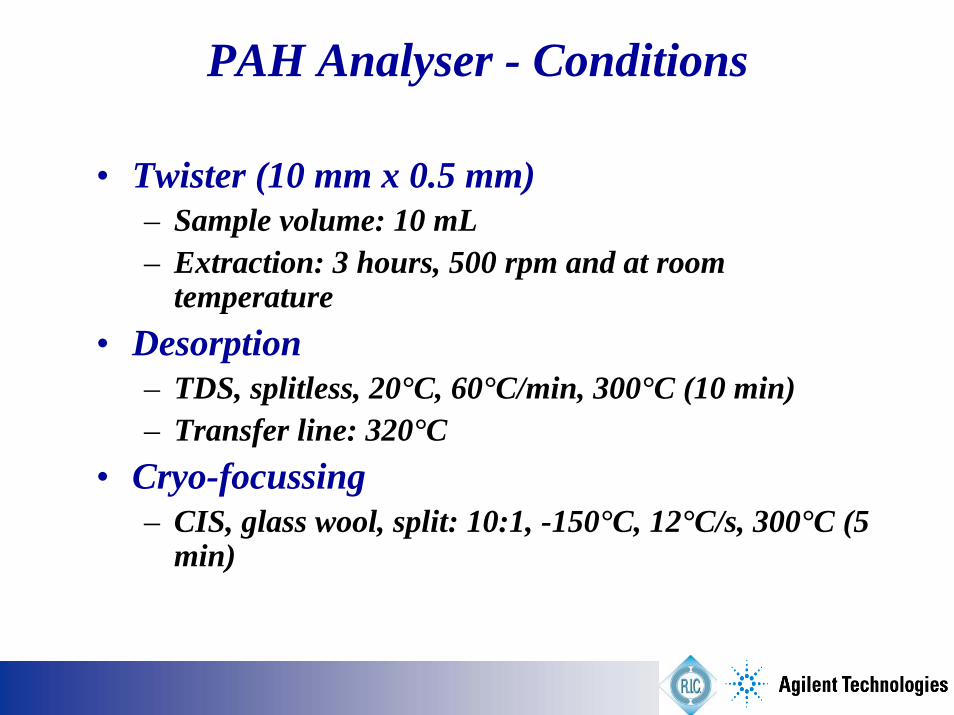
PAH Analyser - Conditions
• Twister (10 mm x 0.5 mm)– Sample volume: 10 mL– Extraction: 3 hours, 500 rpm and at room
temperature• Desorption
– TDS, splitless, 20°C, 60°C/min, 300°C (10 min)– Transfer line: 320°C
• Cryo-focussing– CIS, glass wool, split: 10:1, -150°C, 12°C/s, 300°C (5
min)

Linearity
Benzo(g,h,i)perylene
y = 79,392x + 259,29R2 = 0,9998
0
5000
10000
15000
20000
25000
30000
35000
40000
45000
0 100 200 300 400 500 600
ppt
Peak
Are
a
Fluoranthene
y = 272,03x + 641,24R2 = 0,9999
0
20000
40000
60000
80000
100000
120000
140000
160000
0 100 200 300 400 500 600
ppt
Peak
Are
a
Detection LimitsRepeatability
Compounds Linearity Detection Limit [ppt]
Naphthalene 0.99846 0.4 A-Methylnaphthalene 0.99829 0.5 2-Methylnaphthalene 0.99886 0.7 Acenaphthylene 0.99928 0.3 Acenaphthene 0.99954 1.3 Fluorene 0.99990 1.9 Phenanthrene 0.99992 0.8 Anthracene 0.99933 1.1 Fluoranthene 0.99990 0.1 Pyrene 0.99994 0.7 Benzo(a)anthracene 0.99727 0.1 Chrysene 0.99895 0.2 Benzo(b)fluoranthene 0.99550 0.2 Benzo(k)fluoranthene 0.99820 0.4 Benzo(a)pyrene 0.99611 1.0 Indeno(1.2.3)pyrene 0.99995 1.3 Dibenz(a.h)anthracene 0.99972 0.3 Benzo(g.h.i)perylene 0.99975 0.2
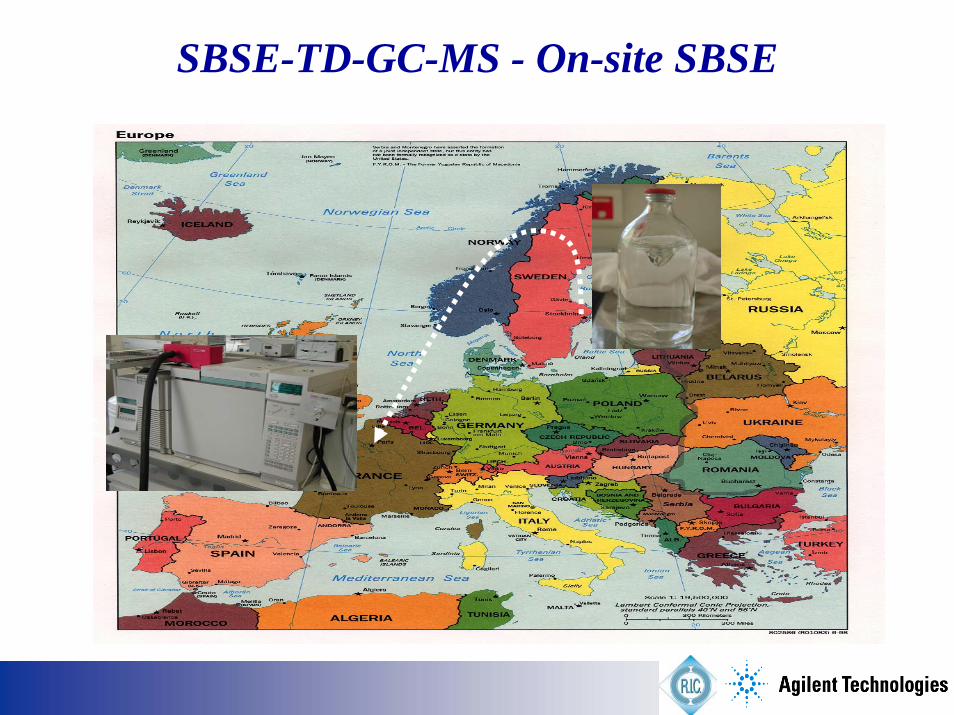
SBSE-TD-GC-MS - On-site SBSE

MSdetection
sniffingdetection Phenolic
2,4,6-tribromoanisole :5.6 ng/l
phenol
Phenolic Phenolic
2,4,6-trichlorophenol
246-tribromophenol
bromodichloroanisol
dibromochloroanisol
CC
CHC
CH
CBr
Cl
Cl
OCH3
CC
CHC
CH
CBr
Br
Cl
OCH3
SBSE-TD-GC-SNIF/MS

EDCs
• Natural and synthetic hormones• Phytoestrogens• Alkylphenols and bisphenol A• Polycyclic aromatic hydrocarbons (PAHs)• Polychloro and bromo biphenyls (PCBs, PBrBs)• Dioxins anf furans• Polybrominated biphenyl ethers (PBDEs)• Organotin compounds• Phthalates• Pesticides• ….

Pyrethroids Log Ko/w Retention time (min)
SIM ions SIM group
Cis-Resmethrin 7.11 27.79 123/128 1 Trans-Resmethrin 7.11 27.97 123/128 1 Bifenthin 8.15 28.87 181/165 2 Fenpropathrin 5.62 29 97/181 2 λ-Cyhalothrin 6.85 30.4 181/197 3 Acrinathrin 6.73 30.73 181/93 3 Cis-Permethrin 6.18 31.4 183/163 4 Trans-permthrin dimethyl d6 (I.S.) 31.54 183/169 4 Trans-permethrin 6.18 31.58 183/163 4 Cypermethrin I 6.38 32.73 181/163 5 Cypermethrin II 6.38 32.89 181/163 5 Cypermethrin III 6.38 33.01 181/163 5 Cypermethrin IV 6.38 33.07 181/163 5 Fenvalerate 6.76 34.33 125/167 6 Esfenvalerate 6.76 34.75 125/167 6 Deltamethrin 6.18 35.92 181/253 7
Typical example: Pyrethroids
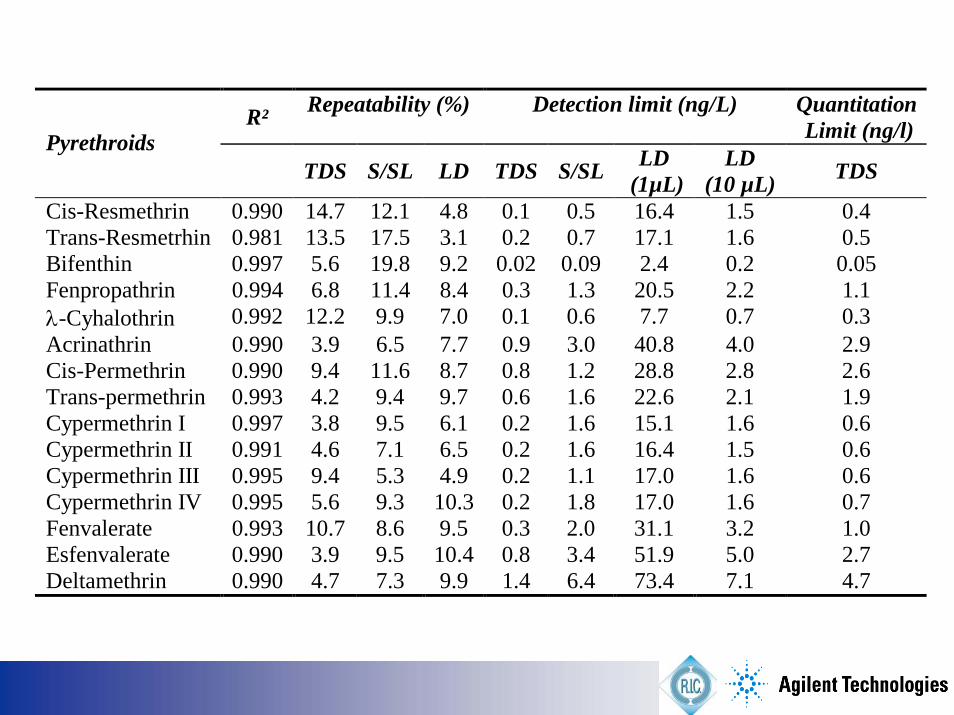
R² Repeatability (%) Detection limit (ng/L) Quantitation Limit (ng/l) Pyrethroids
TDS S/SL LD TDS S/SL LD (1µL)
LD (10 µL) TDS
Cis-Resmethrin 0.990 14.7 12.1 4.8 0.1 0.5 16.4 1.5 0.4 Trans-Resmetrhin 0.981 13.5 17.5 3.1 0.2 0.7 17.1 1.6 0.5 Bifenthin 0.997 5.6 19.8 9.2 0.02 0.09 2.4 0.2 0.05 Fenpropathrin 0.994 6.8 11.4 8.4 0.3 1.3 20.5 2.2 1.1 λ-Cyhalothrin 0.992 12.2 9.9 7.0 0.1 0.6 7.7 0.7 0.3 Acrinathrin 0.990 3.9 6.5 7.7 0.9 3.0 40.8 4.0 2.9 Cis-Permethrin 0.990 9.4 11.6 8.7 0.8 1.2 28.8 2.8 2.6 Trans-permethrin 0.993 4.2 9.4 9.7 0.6 1.6 22.6 2.1 1.9 Cypermethrin I 0.997 3.8 9.5 6.1 0.2 1.6 15.1 1.6 0.6 Cypermethrin II 0.991 4.6 7.1 6.5 0.2 1.6 16.4 1.5 0.6 Cypermethrin III 0.995 9.4 5.3 4.9 0.2 1.1 17.0 1.6 0.6 Cypermethrin IV 0.995 5.6 9.3 10.3 0.2 1.8 17.0 1.6 0.7 Fenvalerate 0.993 10.7 8.6 9.5 0.3 2.0 31.1 3.2 1.0 Esfenvalerate 0.990 3.9 9.5 10.4 0.8 3.4 51.9 5.0 2.7 Deltamethrin 0.990 4.7 7.3 9.9 1.4 6.4 73.4 7.1 4.7
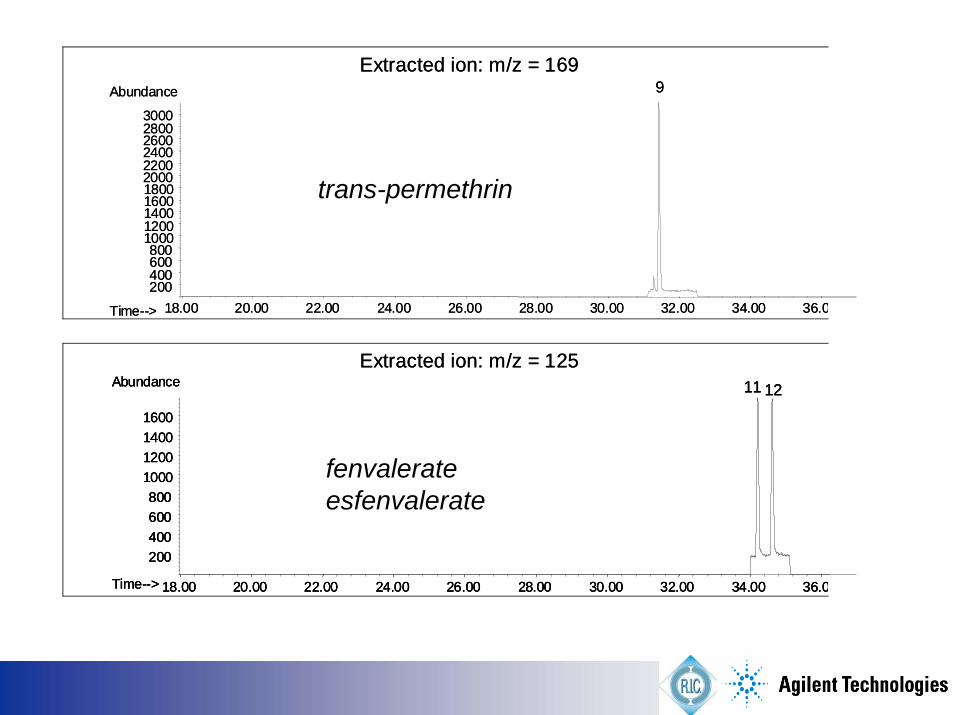
18.00 20.00 22.00 24.00 26.00 28.00 30.00 32.00 34.00 36.0200400600800
10001200140016001800200022002400260028003000
Time-->
Abundance 9Extracted ion: m/z = 169
18.00 20.00 22.00 24.00 26.00 28.00 30.00 32.00 34.00 36.0200400600800
10001200140016001800200022002400260028003000
Time-->
Abundance 9Extracted ion: m/z = 169
18.00 20.00 22.00 24.00 26.00 28.00 30.00 32.00 34.00 36.0
200400600800
1000120014001600
Time-->
Abundance 11 12
Extracted ion: m/z = 125
18.00 20.00 22.00 24.00 26.00 28.00 30.00 32.00 34.00 36.0
200400600800
1000120014001600
Time-->
Abundance 11 12
18.00 20.00 22.00 24.00 26.00 28.00 30.00 32.00 34.00 36.0
200400600800
1000120014001600
Time-->
Abundance 11 12
Extracted ion: m/z = 125
trans-permethrin
fenvalerateesfenvalerate

Aqueous Samples.
In situ derivatization to increase log P
• NaEt4B (pH control)
• Cl COOEt (pyridine/ethanol)
• (CH3COO)2O (pH 12)
• …

Organo-Sn Speciation
• SPME - capillary GC/ICPMS
• SBSE – capillary GC/ICPMS
• In-situ derivatisation - SPME - RTL - ID - capillary GC/MS
- sub ng/L for water samples- µg/kg for sediment samples- robust and fully validated (accreditation)

10 12 14 16 18 20 22 24
40000
80000
120000
160000
200000
240000
Time, min
Abundance
MBT
MBT(d9)
DBT
DBT(d9)
TBT
TBT(d9)
DPhT(d10)MPhT
MPhT(d9)
DPhT
TPhT
TPhT(d15)
EDC Analysis
7 8 9 10 11 12 13 14 15 16
20000
40000
60000
80000
100000
Time, min
Abundance
MBT
MBT(d-9)
DBT
DBT(d-18)
TBT
TBT(d-27)
Water at20 ng/L
PACS-2

10.0011.0012.0013.0014.0015.0016.0017.0018.0019.0020.0021.0022.0023.0024.000
200
400
600
800
1000
1200
1400
1600
1800
2000
2200
2400
2600
2800
3000
3200
3400
3600
3800
4000
4200
4400
4600
4800
5000
Time-->
Abundance
Ion 128.00 (127.70 to 128.70): CAL4.D
CPDCP
TCPTeCP PCP
Ion 164.00 (163.70 to 164.70): CAL4.DIon 196.00 (195.70 to 196.70): CAL4.DIon 232.00 (231.70 to 232.70): CAL4.DIon 266.00 (265.70 to 266.70): CAL4.D
In-situ acetylated Cl-phenols – ng/L !

In-situ Derivatisation-SBSE-TD-GC-MS(SIM) Analysis of Alkylphenols in water *
Sample volume 10 mL, 60 min extractionK2CO3 0.5g, acetic anhydride 0.5 mLcal: 1.0 – 1000 ng L-1 (7 points) → r2 > 0.9981sensitivity (MDL (n = 6), 3.0SD) → 0.11 – 3.6 ng L-1
recovery (10 ng L-1) → 85-106 % (RSD < 3-11 %, n = 6)
1
2
3
15 16 17 18 19 20 21 22 23 24 25
70000
Retention time / min
m/z 135
m/z 164m/z 192m/z 107
m/z 220
Abu
ndan
ce
m/z 248m/z 234m/z 312
60000
50000
40000
30000
20000
10000
0
4
7
85
6
1: 4-t-butylphenol, 2: 4-n-pentylphenol3: 4-n-hexylphenol, 4: 4-t-octylphenol5: 4-n-heptylphenol, 6: nonylphenol7: 4-n-octylphenol, 8: bisphenol A
(50 ng l-1 each)
ppt !* S. Nakamura et al, J. Chromatogr. A, 1038 (2004) 291


![Pressure Filters - ULBRICH HYDROAUTOMATIK s.r.o. · Filtration ratio are also available by using special composed filter media. β for particles > x µm Particle size x [µm] (for](https://static.fdocuments.net/doc/165x107/5f0b0adc7e708231d42e90c8/pressure-filters-ulbrich-hydroautomatik-sro-filtration-ratio-are-also-available.jpg)


![Matter wave interferomery with poorly collimated beams x [µm] Ben McMorran, Alex Cronin Department of Physics x [µm]](https://static.fdocuments.net/doc/165x107/56649caf5503460f949729a2/matter-wave-interferomery-with-poorly-collimated-beams-x-m-ben-mcmorran.jpg)