Water: A Tale of Two Liquids - aux.uibk.ac.ataux.uibk.ac.at/c724117/publications/gallo-cr.pdf ·...
38
Water: A Tale of Two Liquids Paola Gallo,* ,† Katrin Amann-Winkel, ‡ Charles Austen Angell, § Mikhail Alexeevich Anisimov, ∥ Fre ́ de ́ ric Caupin, ⊥ Charusita Chakravarty, # Erik Lascaris, ∇ Thomas Loerting, ○ Athanassios Zois Panagiotopoulos, ◆ John Russo, ¶,□ Jonas Alexander Sellberg, ■ Harry Eugene Stanley, ∇ Hajime Tanaka, ¶ Carlos Vega, ◊ Limei Xu, ●,⬟ and Lars Gunnar Moody Pettersson ‡ † Dipartimento di Matematica e Fisica, Universita ̀ Roma Tre, Via della Vasca Navale 84, 00146 Rome, Italy ‡ Department of Physics, AlbaNova University Center, Stockholm University, SE-106 91 Stockholm, Sweden § Department of Chemistry and Biochemistry, Arizona State University, Tempe, Arizona 85287, United States ∥ Institute for Physical Science and Technology and Department of Chemical and Biomolecular Engineering, University of Maryland, College Park, Maryland 20742, United States ⊥ Institut Lumiè re Matie ̀ re, UMR5306 Universite ́ Claude Bernard Lyon 1-CNRS, Universite ́ de Lyon, Institut Universitaire de France, 69622 Villeurbanne, France # Department of Chemistry, Indian Institute of Technology Delhi, Hauz Khas, New Delhi 110016, India ∇ Center for Polymer Studies and Department of Physics, Boston University, Boston, Massachusetts 02215, United States ○ Institute of Physical Chemistry, University of Innsbruck, 6020 Innsbruck, Austria ◆ Department of Chemical and Biological Engineering, Princeton University, Princeton, New Jersey 08544, United States ¶ Institute of Industrial Science, University of Tokyo, 4-6-1 Komaba, Meguro-ku, Tokyo 153-8505, Japan ■ Biomedical and X-ray Physics, Department of Applied Physics, AlbaNova University Center, KTH Royal Institute of Technology, SE-106 91 Stockholm, Sweden ◊ Departamento de Quimica Fisica, Facultad de Ciencias Quimicas, Universidad Complutense de Madrid, 28040 Madrid, Spain ● International Centre for Quantum Materials and School of Physics, Peking University, Beijing 100871, China ⬟ Collaborative Innovation Center of Quantum Matter, Beijing 100871, China □ School of Mathematics, University of Bristol, Bristol BS8 1TW, United Kingdom ABSTRACT: Water is the most abundant liquid on earth and also the substance with the largest number of anomalies in its properties. It is a prerequisite for life and as such a most important subject of current research in chemical physics and physical chemistry. In spite of its simplicity as a liquid, it has an enormously rich phase diagram where different types of ices, amorphous phases, and anomalies disclose a path that points to unique thermodynamics of its supercooled liquid state that still hides many unraveled secrets. In this review we describe the behavior of water in the regime from ambient conditions to the deeply supercooled region. The review describes simulations and experiments on this anomalous liquid. Several scenarios have been proposed to explain the anomalous properties that become strongly enhanced in the supercooled region. Among those, the second critical-point scenario has been investigated extensively, and at present most experimental evidence point to this scenario. Starting from very low temperatures, a coexistence line between a high-density amorphous phase and a low-density amorphous phase would continue in a coexistence line between a high-density and a low-density liquid phase terminating in a liquid−liquid critical point, LLCP. On approaching this LLCP from the one-phase region, a crossover in thermodynamics and dynamics can be found. This is discussed based on a picture of a temperature-dependent balance between a high-density liquid and a low-density liquid favored by, respectively, entropy and enthalpy, leading to a consistent picture of the thermodynamics of bulk water. Ice nucleation is also discussed, since this is what severely impedes experimental investigation of the vicinity of the proposed LLCP. Experimental investigation of stretched water, i.e., water at negative pressure, gives access to a different regime of the complex water diagram. Different ways to inhibit crystallization through confinement and aqueous solutions are discussed through results from experiments and simulations using the most sophisticated and advanced techniques. continued... Special Issue: Water - The Most Anomalous Liquid Received: January 3, 2016 Published: July 5, 2016 Review pubs.acs.org/CR © 2016 American Chemical Society 7463 DOI: 10.1021/acs.chemrev.5b00750 Chem. Rev. 2016, 116, 7463−7500
Transcript of Water: A Tale of Two Liquids - aux.uibk.ac.ataux.uibk.ac.at/c724117/publications/gallo-cr.pdf ·...

Water: A Tale of Two LiquidsPaola Gallo,*,† Katrin Amann-Winkel,‡ Charles Austen Angell,§ Mikhail Alexeevich Anisimov,∥
Frederic Caupin,⊥ Charusita Chakravarty,# Erik Lascaris,∇ Thomas Loerting,○
Athanassios Zois Panagiotopoulos,◆ John Russo,¶,□ Jonas Alexander Sellberg,■ Harry Eugene Stanley,∇
Hajime Tanaka,¶ Carlos Vega,◊ Limei Xu,●,⬟ and Lars Gunnar Moody Pettersson‡
†Dipartimento di Matematica e Fisica, Universita Roma Tre, Via della Vasca Navale 84, 00146 Rome, Italy‡Department of Physics, AlbaNova University Center, Stockholm University, SE-106 91 Stockholm, Sweden§Department of Chemistry and Biochemistry, Arizona State University, Tempe, Arizona 85287, United States∥Institute for Physical Science and Technology and Department of Chemical and Biomolecular Engineering, University of Maryland,College Park, Maryland 20742, United States⊥Institut Lumiere Matiere, UMR5306 Universite Claude Bernard Lyon 1-CNRS, Universite de Lyon, Institut Universitaire de France,69622 Villeurbanne, France#Department of Chemistry, Indian Institute of Technology Delhi, Hauz Khas, New Delhi 110016, India∇Center for Polymer Studies and Department of Physics, Boston University, Boston, Massachusetts 02215, United States○Institute of Physical Chemistry, University of Innsbruck, 6020 Innsbruck, Austria◆Department of Chemical and Biological Engineering, Princeton University, Princeton, New Jersey 08544, United States¶Institute of Industrial Science, University of Tokyo, 4-6-1 Komaba, Meguro-ku, Tokyo 153-8505, Japan■Biomedical and X-ray Physics, Department of Applied Physics, AlbaNova University Center, KTH Royal Institute of Technology,SE-106 91 Stockholm, Sweden◊Departamento de Quimica Fisica, Facultad de Ciencias Quimicas, Universidad Complutense de Madrid, 28040 Madrid, Spain●International Centre for Quantum Materials and School of Physics, Peking University, Beijing 100871, China⬟Collaborative Innovation Center of Quantum Matter, Beijing 100871, China□School of Mathematics, University of Bristol, Bristol BS8 1TW, United Kingdom
ABSTRACT: Water is the most abundant liquid on earth and also the substance withthe largest number of anomalies in its properties. It is a prerequisite for life and as such amost important subject of current research in chemical physics and physical chemistry.In spite of its simplicity as a liquid, it has an enormously rich phase diagram wheredifferent types of ices, amorphous phases, and anomalies disclose a path that points tounique thermodynamics of its supercooled liquid state that still hides many unraveledsecrets. In this review we describe the behavior of water in the regime from ambientconditions to the deeply supercooled region. The review describes simulations andexperiments on this anomalous liquid. Several scenarios have been proposed to explainthe anomalous properties that become strongly enhanced in the supercooled region.Among those, the second critical-point scenario has been investigated extensively, and at present most experimental evidencepoint to this scenario. Starting from very low temperatures, a coexistence line between a high-density amorphous phase and alow-density amorphous phase would continue in a coexistence line between a high-density and a low-density liquid phaseterminating in a liquid−liquid critical point, LLCP. On approaching this LLCP from the one-phase region, a crossover inthermodynamics and dynamics can be found. This is discussed based on a picture of a temperature-dependent balance between ahigh-density liquid and a low-density liquid favored by, respectively, entropy and enthalpy, leading to a consistent picture of thethermodynamics of bulk water. Ice nucleation is also discussed, since this is what severely impedes experimental investigation ofthe vicinity of the proposed LLCP. Experimental investigation of stretched water, i.e., water at negative pressure, gives access to adifferent regime of the complex water diagram. Different ways to inhibit crystallization through confinement and aqueoussolutions are discussed through results from experiments and simulations using the most sophisticated and advanced techniques.
continued...
Special Issue: Water - The Most Anomalous Liquid
Received: January 3, 2016Published: July 5, 2016
Review
pubs.acs.org/CR
© 2016 American Chemical Society 7463 DOI: 10.1021/acs.chemrev.5b00750Chem. Rev. 2016, 116, 7463−7500

These findings represent tiles of a global picture that stillneeds to be completed. Some of the possible experimentallines of research that are essential to complete this pictureare explored.
CONTENTS
1. Introduction 74642. Several Scenarios 74653. Liquid−Liquid Transition 74664. Competition between Two Alternative Structures 7470
4.1. Experimental Structural Results 74714.2. Order Parameter 7472
5. Nucleation of Ice from Supercooled Water 74765.1. Local Structural Ordering in Water Has an
Impact on Ice Nucleation 74786. Relation between Dynamics and Thermodynam-
ics 74807. Stretched Water 74828. Thermodynamics and Dynamics of Confined
Water 74859. Thermodynamics and Dynamics of Aqueous
Solutions 748510. Future Directions 7487
10.1. Ultrafast Probing 748810.2. Second-Component Studies 748810.3. Studies at Negative Pressure 7488
Author Information 7490Corresponding Author 7490Notes 7490Biographies 7490
Acknowledgments 7491Dedication 7492References 7492
1. INTRODUCTIONWater is the most abundant liquid, exhibits the most anomalousbehavior, and is a prerequisite for life on this planet and probablyfor life elsewhere.1−10 It shows a density maximum at 4 °C (277K) under ambient conditions, and the solid phase has a lowerdensity than the liquid (ice floats in the liquid).11−13 Itsthermodynamic response functions, such as specific heat, CP,compressibility, κT, and thermal expansion coefficient, αP, all ofwhich can be determined by entropy or volume fluctuations, i.e.
κ⟨ Δ ⟩ =V Vk T( )2B T (1)
⟨ Δ ⟩ =S Nk C( )2B P
and
α⟨Δ Δ ⟩ =V S Vk TB P
also show anomalous behaviors.4−6,13−18
For example, at atmospheric pressure κT increases whenT < 46°C (319 K) but exhibits normal behavior when T > 46 °C.Similarly, at atmospheric pressure Cp increases when T < 35 °C(308 K) and the value of αP becomes negative, indicating that thevolume expands below 4 °C. One characteristic of the threethermodynamic properties shown in eq 1 is that they are relatedto fluctuations in liquid water that increase upon cooling below acertain temperature instead of decrease as in simple liquids.Figure 1 shows how this anomalous behavior becomes more
pronounced in the deeply supercooled region and seems todiverge when T approaches −45 °C (228 K).12 Figure 2 uses
simulations of the TIP4P/2005 water model19 to show thestructurally anomalous regime in water that encloses the regionof diffusional anomaly which in turn encloses the region ofdensity anomaly. This nested structure gives rise to the idea of acascade of anomalies, where progressive enhancement of thedegree of structural anomaly gives rise to various transport andthermodynamic anomalies. Comparisons of the cascadestructure and the order maps of a number of tetrahedral liquidsare now available and indicate the complexity of describing thethermodynamics of these systems.20−22
Here, we review the behavior of water in the anomalous regimefrom ambient conditions to the deeply supercooled region. Theregime above 232 K (temperature of homogeneous icenucleation) and below the crystallization temperature 160 K ofamorphous ice (at ambient pressure) has provided the mostinformation since it is more accessible. Among several theoreticalscenarios, a liquid−liquid phase transition and an associatedcritical point (LLCP) are conjectured23 and are assumed to lie in
Figure 1. Anomalous thermodynamic properties of water compared tosimple liquids. Schematic comparison of the isobaric temperaturedependence of the density ρ, thermal expansion coefficient αP,isothermal compressibility κT, and isobaric heat capacity, CP, for waterand a simple liquid. Reproduced with permission from ref 4. Copyright2003 by IOP Publishing.
Figure 2.Thermodynamics of the condensed phases of water, illustratedfor the TIP4P/2005 rigid-body model of water.19 Data for the phaseboundaries are taken from ref 24. Boundaries of the structural, density,pair-entropy, and diffusivity anomalies are taken from ref 25. Theexperimental TMD line shown in filled black diamonds is taken from ref26. TheWidom line (see the definition in section 6) is taken from ref 27.Reproduced from ref 21 with permission from the PCCP OwnerSocieties.
Chemical Reviews Review
DOI: 10.1021/acs.chemrev.5b00750Chem. Rev. 2016, 116, 7463−7500
7464
the regime between 232 and 160 K, the so-called no-man’s landin the phase diagram, so named because ice nucleation occurs toorapidly for conventional measurement techniques. We connectthe thermodynamic behavior of liquid waterits restructuring,anomalous behavior, and dynamics in the ambient andmoderately supercooled regimes where experimental andsimulation data are more accessibleto its behavior in thedeeply supercooled region where an LLCP, real or virtual, may belocated.This review is structured as follows: in the next section we
describe the scenarios that have been proposed over the years toexplain water anomalies in the supercooled state. The followingsection focuses on the most extensively investigated scenario, theone that foresees the presence of a liquid−liquid transitionterminating in a second-order critical point. Section 4 deals withtheoretical and experimental results on the competition betweenthe two alternative structures that exist in water, described as alow- and a high-density liquid, and with how two-statethermodynamics can explain “liquid polymorphism”. Section 5deals with the important phenomenon of nucleation thatprevents experiments, at least so far, from accessing the regionwhere the LLCP is supposedly located. Due to these difficultiesmany alternative routes have been tried to clarify water behaviorin the supercooled realm, and these are described in theremaining sections. Section 6 describes the close relationbetween dynamics and thermodynamics that in recent yearswas very much explored because of the possibility to locate froma dynamic crossover in water an important precursor of a critical
point, the Widom line. The possibility to reach the low-temperature region with stretched water is explored in section 7.Other possible routes are confined water (section 8) and aqueoussolutions (section 9). Depending on the kind of confinement andon the solution, supercooling can be easier and the properties ofwater can remain bulk-like. The last section is devoted to explorepossible future directions.
2. SEVERAL SCENARIOS
Over the past years, different scenarios have been proposed toexplain the origin of the anomalies briefly described in thepreceding section.23,28−32 The first was in 1982 in a remarkablepaper by Robin Speedy,33 which has become known as the“Speedy stability limit conjecture”. It has the same form ofmetastable water phase diagram as that yielded by empiricalequations of state for water produced by the water and steamengineers. It was followed in 1992 by the famous “second critical-point hypothesis” of Poole, Sciortino, Essmann, and Stanley23 onthe basis of molecular dynamics simulations of the ST2 model.This has been by far the most influential scenario and has beensupported, explained, and contested by various authors, e.g.,Tanaka,34−36 Anisimov,37−39 Stanley, and co-workers,23,40−42
Limmer and Chandler,43,44 and Nilsson and Pettersson45 toname a few. Then, among scenarios that are qualitatively distinct,there is the “critical-point-free” scenario, initially presented in1994 as one of two cases within a bond-modified van der Waalsmodel of the tetrahedral liquid state by Poole et al.46 and recentlyrevisited by one of the present authors.32 This was followed in
Figure 3. Scenarios that might account for the behavior observed in Figure 1. (A) Speedy’s stability limit conjecture,33 (B) Poole et al.’s second criticalpoint,23 (C) Poole et al.’s “weak bond”-modified van der Waals model, now the critical-point-free scenario,46 and (D) Sastry et al.’s singularity-freescenario.31 Continuous blue curves show the known equilibrium coexistence lines between liquid, solid, and vapor with the triple point marked as T.Liquid−vapor equilibrium terminates at the critical point C. The long-dashed purple line shows the line of density maxima (LDM), and the short-dashedand dotted green lines are the lines of isothermal compressibility maxima (LMκT) andminima (LmκT), respectively. Dash−dotted lines indicate lines ofinstability. In scenarios A and C, the LDM keeps a negative slope and ends at a line of instability. In scenarios B and D, the LDM reaches a maximumtemperature and changes its slope, eventually merging with a line of density minima (not shown for clarity). When the scenario comprises a liquid−liquid transition, it is displayed with a continuous orange line (LLT), and the liquid−liquid critical point is shown as an orange plus. Adapted from ref 47.Copyright 2014 National Academy of Sciences.
Chemical Reviews Review
DOI: 10.1021/acs.chemrev.5b00750Chem. Rev. 2016, 116, 7463−7500
7465

1996 by the “singularity-free” scenario of Sastry et al.,31 based onlattice model calculations.The essential differences between these four scenarios are
depicted in the series of phase diagrams of Figure 3, adapted fromthe recent paper of Pallares et al.,47 and may be summarized asfollows (see also the figure caption).In the “stability limit conjecture” scenario, Figure 3A, the
boundary of the liquid state at high temperatures (the well-known spinodal limit to the stability of the superheated liquidstate that terminates at the liquid−gas critical point) is reversingits temperature dependence where the line of density maximameets the liquid−vapor spinodal at negative pressure. It thenretraces to establish the limit to supercooling of the ambientpressure and low-pressure liquid. Debenedetti4 correctly arguesthat the intersection between a liquid−vapor spinodal and themetastable continuation of the liquid−vapor equilibrium linemust be a critical point. However, this is not necessary if the lineof instability at positive pressure is not a liquid−vapor spinodalbut rather a line of instability toward another phase. The critical-point-free scenario31,32 (Figure 3C) provides such a line (seebelow).Figure 3B shows the second critical-point scenario in its most
familiar form, wherein a second critical point exists at positivepressure, where it terminates a line of liquid−liquid transition.From the second critical point emanates a Widom line, the locusof extrema of the correlation length. This scenario also includesother lines of response function maxima, extending to lower andnegative pressures. Near the critical point these lines merge withthe Widom line.In Figure 3C is depicted the critical-point-free scenario by
which is meant that the liquid−liquid transition exists but theLLCP has moved sufficiently to negative pressures that it meetsthe liquid−vapor spinodal and the fluctuations characteristic ofeach merge and lose identity.Finally, the singularity-free scenario (Figure 3D) is charac-
terized by sharp but nondivergent maxima in the differentresponse functions, occurring at different temperatures butwithout a liquid−liquid transition and with a critical point only at0 K.Only in the first of the above scenarios does the form agree
with that of the various multiparameter empirical equations ofstate, for which the spinodal limit to liquid stability reverses itsposition in pressure and retraces to positive pressures. Only inthe second and third of these scenarios does a liquid−liquidcoexistence line exist. Also, only in one of these does a secondcritical point exist.
3. LIQUID−LIQUID TRANSITIONAmong the scenarios presented in section 2, the second critical-point scenario23 (Figure 3B) with the possible existence of aliquid−liquid critical point (LLCP) and its associated criticalfluctuations, which are considered as the source of wateranomalies,5,6,28−30,40,48,49 has been investigated extensively bothin amorphous glassy water and in deeply supercooled liquidwater, see, for example refs 49−52. Although most authors are ofthe opinion that the critical zone in real water lies fully at positivepressures and that scenario B of section 2 is the appropriatedescription of real water behavior, the issue is not yet settled.There is a powerful argument by Binder (see ref 53) to the effectthat in a metastable system a true critical point cannot existbecause the diverging time scale needed for its ergodicmanifestation would cross the finite lifetime for the liquidimposed by crystallization kinetics. This argument, which
however only concerns the immediate vicinity of the criticalpoint, leads us to refer to a critical “zone”within which ergodicityin principle cannot be established but on either side of which aliquid−liquid line or a Widom line could exist and could play arole in the physics of the liquid. With this caveat the secondcritical-point scenario and its associated liquid−liquid phasetransition (LLPT) will be the focus of the present review.In the mid-1980s, Mishima et al.52,54 amorphized ice Ih at 77 K
by compression beyond 1.1 GPa and observed a first-order-likephase transition from high-density amorphous ice (HDA) tolow-density amorphous ice (LDA) by heating the pressure-amorphized material at ambient pressure.54 LDA and HDA differin structure and density, where both states consist of fullyhydrogen-bonded tetrahedral networks, but in HDA five firstneighbors exist where the fifth molecule sits on an interstitialplace between the first and the second shell.55 The radialdistribution functions of LDA and HDA are examined in thearticle “X-ray and Neutron Scattering of Water”56 containedwithin this issue.The idea that water is a “mixture” of two different structures
dates back to the 19th century57,58 and was reinvigorated in thelate 20th century.59−61 In 1992, in a seminal paper,23 usingmolecular dynamics simulations on the ST2 model of water,Poole, Sciortino, Essman, and Stanley found a first-order phasetransition from low-density liquid (LDL) to high-density liquid(HDL) with an LLCP located at TC ≈ 235 K and PC ≈ 200MPa.28−30 In this scenario the LLPT is determined by extendingthe HDA and LDA first-order phase transition into the highertemperature and lower pressure region of the phasediagram,41,54,62−68 see Figure 4. If there is a second criticalpoint as suggested in Figure 3B it may be at either positive ornegative pressure. While most simulation work suggests it to beat positive pressure, a couple suggest it to be at negative pressure,as summarized in ref 69. From the experimental side the questionof the location of a possible second critical point is still open,especially because its location is presumed to be in no-man’sland, where rapid crystallization takes place and experimentshave to probe the liquid very fast.The most elegant technique to date to study the transition was
employed by Mishima,48,70 who studied decompression- andcompression-induced melting of high-pressure ices in thestability domain of hexagonal ice. On the basis of subtletemperature changes in the sample Mishima claims to be able todetect the transition from the high-pressure ice to either HDL orLDL first, which is then immediately followed by crystallization.In order to avoid the direct transition from the metastable high-pressure ice phase to hexagonal ice, skipping over the liquidphase, Mishima used water in oil emulsions. The key finding ofthis work is a kink in the metastable melting line of ices IV and Vbut a rather smooth metastable melting line of ice III. The kink isinterpreted by Mishima to indicate a transition from melting toLDL rather than HDL. On the basis of the density difference ofabout 20% between LDL and HDL and the Clausius−Clapeyronequation, the slope of the high-pressure melting line needs tochange by about 20% at the LDL−HDL first-order transitionline, which is the case for ices IV and V but not for III. On thebasis of these findings Mishima locates the first-order liquid−liquid transition line from 0.075 GPa/223 K to 0.10 GPa/215 Kfor H2O and very close to that for D2O.
70 According toMishima’sinterpretation of the data, there is no kink in the melting line ofice III, which passes through 230 K and 0.01 GPa, i.e., the first-order liquid−liquid transition line and the metastable ice IIImelting line do not intersect. As a consequence, Mishima is able
Chemical Reviews Review
DOI: 10.1021/acs.chemrev.5b00750Chem. Rev. 2016, 116, 7463−7500
7466

to locate the second critical point between the melting lines of iceIII and IV, i.e., at positive pressures between about 0.02 and 0.07GPa and between 223 and 230 K.If Mishima’s interpretation is correct, this settles the discussion
and the critical point is at positive pressure. There is, however,some doubt about the method when working very close toambient pressure, which is necessary to locate the metastable iceIII melting line. Thus, the ice III melting line might be smooth orthere might be a kink overlooked by Mishima. Furthermore,there is no direct evidence provided by Mishima that the high-pressure ices in emulsions indeed first melt to the liquid ratherthan directly transform to stable hexagonal ice. For these reasonswe consider Mishima’s work to represent the best experimentalnarrowing down of the location of the second critical point, if itexists at all, but it does not completely rule it out to be at negativepressure.About a decade later, Mishima again utilized the property of
emulsified water to hinder crystallization andmapped the specificvolume of supercooled water.71−73 He noted a slightly concave-downward change in the plot of volume against temperature athigh pressures, which favors the scenario in Figure 3B over thescenario in Figure 3A. The second critical point is roughlysuggested to be located at 0.05 GPa and 223 K, in agreement withhis own earlier work on the metastable melting lines of high-pressure ices.
Using neutron diffraction, first Bellissent-Funel68 and thenSoper and Ricci67 verified the structure transformation in liquidwater from LDL to HDL with increasing pressure at ambienttemperature, see Figure 5. They found that the main difference
between LDL and HDL lies in the second shell, i.e., the secondshell of LDL sits at approximately the tetrahedral distance, butthe second shell of HDL substantially collapses with interstitialmolecules and contributions from less specific, bifurcatedhydrogen bonds.74 Using similar techniques, Bellissent-Funelet al. further demonstrated that the structure of liquid waterbecomes HDA when cooled at high pressures but changes toLDA when cooled at low pressures. This again indicates acontinuation of the LDA−HDA transition line to a LLPT inwater64,65 and is consistent with results obtained usingdilatometry and powder X-ray diffraction.66,67
The phase diagram of noncrystalline water including apostulated location of a liquid−liquid critical point is shown inFigure 4. This diagram is restricted to pressures p < 0.35 GPabecause the HDA−LDA and the liquid−liquid transitionassociated with these glassy ices is most relevant for ourunderstanding of ambient pressure water. The two correspond-ing glass transition temperatures Tg,1 and Tg,2 separating theglassy solids LDA and HDA from the ultraviscous liquids LDLand HDL are taken from refs 76 and 77, respectively. The twoglass transition temperatures are clearly distinct both at ambientpressure78 and at high pressure, in particular at the binodalseparating HDA and LDA at 0.2 GPa.76,77 Furthermore, Tg,1decreases with pressure, whereas Tg,2 increases. Such behaviorwas found for the ST2 model of water76 and in a Jagla-likemodel.79 However, it was not found for the SPC/E model ofwater.76
The phase diagram of noncrystalline water extending to apressure of about 10 GPa is shown in Figures 3 and 4 of ref 80.Above a pressure p ≈ 0.8 GPa a third form of amorphous ice,called very-high-density amorphous ice (VHDA), becomes themost stable form of amorphous ice. A sudden change incompressibility81 and in dynamic properties82 marks thetransition between HDA and VHDA. The possibility of furtherliquid−liquid critical points was raised in computationalwork,83−86 although the methods used in refs 83 and 84 wereseriously questioned by the considerations and the results of Liuet al.87 Very recent in situ experiments on the dynamics of HDAand VHDA suggest that if there is such a critical point associatedwith HDA−VHDA, it has to be located at very low temperaturesnear 0.8 GPa.82 A more detailed account of the nature of therelationship between HDA and VHDA can be found in earlierreview articles, see refs 80, 88, and 89. In the present reviewwe donot touch further on the question about the relation between
Figure 4. Phase diagram of noncrystalline water (adapted from ref 75,courtesy of Stephan Fuhrmann and Thomas Loerting). No-man’s landindicates the region in which only crystalline ices have been observed sofar. It is enclosed by the homogeneous crystallization line TH from thetop and the crystallization line TX from the bottom. Two ultraviscousliquid domains, low- and high-density liquid water (LDL and HDL), canbe found just below TX. The two corresponding glass transitiontemperatures Tg,1 and Tg,2 separating the glassy solids LDA and HDAfrom the ultraviscous liquids LDL and HDL are taken from refs 76 and77, respectively. Please note the metastable extension of Tg,1 into thestability region of HDA and ofTg,2 into the stability region of LDA/LDL.A first-order liquid−liquid phase transition line (LLPT) ends in thepurported liquid−liquid critical point (LLCP).
Figure 5. Radial oxygen−oxygen pair-distribution functions for HDLand LDL demonstrating the structural difference between high- andlow-density water at ambient temperature. Adapted with permissionfrom ref 67. Copyright 2000 by the American Physical Society.
Chemical Reviews Review
DOI: 10.1021/acs.chemrev.5b00750Chem. Rev. 2016, 116, 7463−7500
7467

HDA and VHDA and the possibility of yet another liquid−liquidtransition.The transition between HDA and LDA under pressure was
studied byMishima and Suzuki,90 Klotz et al.,91 and Yoshimura etal.92 Their experiments demonstrate the first-order nature of thetransition by revealing phase boundaries between two phases,phase coexistence, and a discontinuous change of structuralproperties at the transformation. Going beyond these studies,Winkel et al.93,94 saw evidence of a first-order transition in theultraviscous liquid domain at ∼140 K and 100 MPa underdecompression (i.e., on the downstroke). The location of theultraviscous liquid domains for HDL and LDL is mapped byseveral experiments on the glass transition of amorphous ices, seeFigure 4 in ref 77 and refs 76 and 95.A glass transition onset temperature of∼136 Kwas detected in
LDA by following the change in heat capacity upon heating LDAice at ambient pressure at a rate of 10 K/min.96−98 Although LDAcan be prepared in several waysby vapor deposition, byhyperquenching, and by the transformation fromHDA describedaboveall studies find a similar increase in heat capacity,ΔCp of∼1 J K−1 mol−1.99 The real nature of this extremely weak signalhas been discussed for decades.32,100 The main point of thecontroversy concerns the question of whether a liquid nature isreached prior to crystallization101 and the question whethertranslational motion102 or rather defect dynamics as in acrystalline system103 is observed above Tg. More recently, theinterpretation that LDA undergoes a glass−liquid transition atthe calorimetric glass transition near 136 K has receivedconsiderable support.80,104,105 In the most recent scenario, thefeeble signal is explained by the suspected strong or evensuperstrong nature of the low-density liquid near the glasstransition temperature.32,100,106 This suspicion found recentconfirmation by dielectric measurements, indicating that LDL isactually the strongest of all known liquids.78,107
The glass transition of high-density amorphous ices wasstudied by in situ high-pressure methods by Mishima,108,109
Andersson,95,110,111 and Loerting et al.82,112,113 These measure-ments were recently reviewed in ref 77. All measurementsindicate that the glass transition at elevated pressures of p > 200MPa appears to be at Tg > 140 K. These measurements alsoindicate that the glass transition in HDA can be observed even atpressures < 200 MPa, where LDA is thermodynamically favoredover HDA,114 i.e., metastability alone does not preclude theobservation of glass transitions if the time scale of thetransformation to the thermodynamically more stable phase issignificantly longer than the time scale of equilibration. Thetransformation time scales can in fact greatly exceed thoserequired for the equilibration of HDA, even at ambient pressure.Thus, measurements of HDA become possible in an extendedtemperature range and reveal an ambient-pressure heat capacitystep and a dielectric relaxation time that indicates a glasstransition at 116 K.78 This glass transition in HDA is 20 K lowerthan the glass transition in LDA and thus represents water’ssecond glass transition. The possibility that two distinct glasstransitions occur has been further supported by the simulationresults of Xu et al.115,116 and Giovambattista et al.,76 whichindicate that the experimental observations are qualitativelyconsistent with water and water-like models having a LLPT, e.g.,the ST2 water model, but not with models lacking two liquidphases, e.g., SPC/E water. Also, a Jagla-like, square-shouldermodel liquid has been shown to exhibit two Tg lines,79
supporting the view that polymorphic liquids can be expectedto have two such (intersecting) Tg lines.
The hypothesized LLCP is located in the deeply supercooledregion, the no-man’s land below the temperature of homoge-neous nucleation.23,28−30,40,48,49 Various potential model stud-ies27−30,37,38,87,120−133 have demonstrated the existence of anLLCP, and Table 1 provides the reported location of the LLCP inthe various long-range all-atom models.
Some models show a number of water’s anomalies but do nothave an LLCP, e.g., the short-range monatomic mWmodel.135,136 On the other hand, other short-range monatomicmodels, e.g., the Jagla model, do show the presence of anLLCP.137 The use of the technique of successive umbrellasampling grand canonical Monte Carlo and of finite-size scalinghas allowed to prove rigorously that the Jagla LLCP is a second-order critical point that belongs to the Ising universality class andto determine with great precision its location.138 Importantly, theestimate of the LLCP position that was previously obtained bymolecular dynamics (MD) simulation137 is in very goodagreement with the true location of the LLCP in the model, asfound with the rigorous finite-size scaling approach.138 Theseresults prove that the techniques for locating the LLCP at themaximum temperature of the spinodals in MD finite-sizesimulations are valid and lead to the same result as the rigoroustechnique.The liquid−liquid transition phenomenon for a one-
component liquid also applies to other network-forming,tetrahedrally coordinated liquids where simulations show thepossible existence of an LLCP, see for example refs 139−144.The landmark paper by Poole, Sciortino, Essman, and
Stanley23 that first proposed the possibility of an LLPT in amolecular model of water described their molecular dynamicssimulations as using the 5-site, rigid ST2 model145 that includesboth Coulombic and van der Waals forces. Long-rangeinteractions for the Coulombic forces were taken into accountusing the reaction-field method. We label this variant of themodel ST2c to distinguish it from the two other variants that wewill introduce below. Poole et al. observed that at sufficiently lowtemperatures the liquid isotherms exhibit behavior consistentwith an approach to a critical point, which they proposed wouldterminate a liquid−liquid coexistence line in the deeplysupercooled region of the phase diagram. More recently, Liu etal.118 used grand canonical Monte Carlo to study the ST2 modelwith an Ewald summation of electrostatic interactions. Thisapproach determines the free energy of the system as a functionof density but does not permit precise control of other orderparameters.
Table 1. Critical Temperature, Tc, Pressure, Pc, and Density,ρc, Reported Using Different Water Potentialsa
potential Tc (K) Pc (MPa) ρc (g/cm3)
ST2c23 235 200 1ST2c122 245 180 0.94ST2a43 − − −ST2b,c44 − − −ST2b87 237 ± 4 167 ± 24 0.99 ± 0.02ST2c134 247 ± 3 185 ± 15 0.955 ± 0.010TIP4P133 190 150 1.06TIP4P/200527 193 135 1.012TIP4P-EW124 210 310 1.09TIP5P121 217 ± 3 340 ± 20 1.13 ± 0.04TIP5P-E123 210 310 1.09
aST2a, ST2b, and ST2c are variants of ST2 as described in the text.
Chemical Reviews Review
DOI: 10.1021/acs.chemrev.5b00750Chem. Rev. 2016, 116, 7463−7500
7468
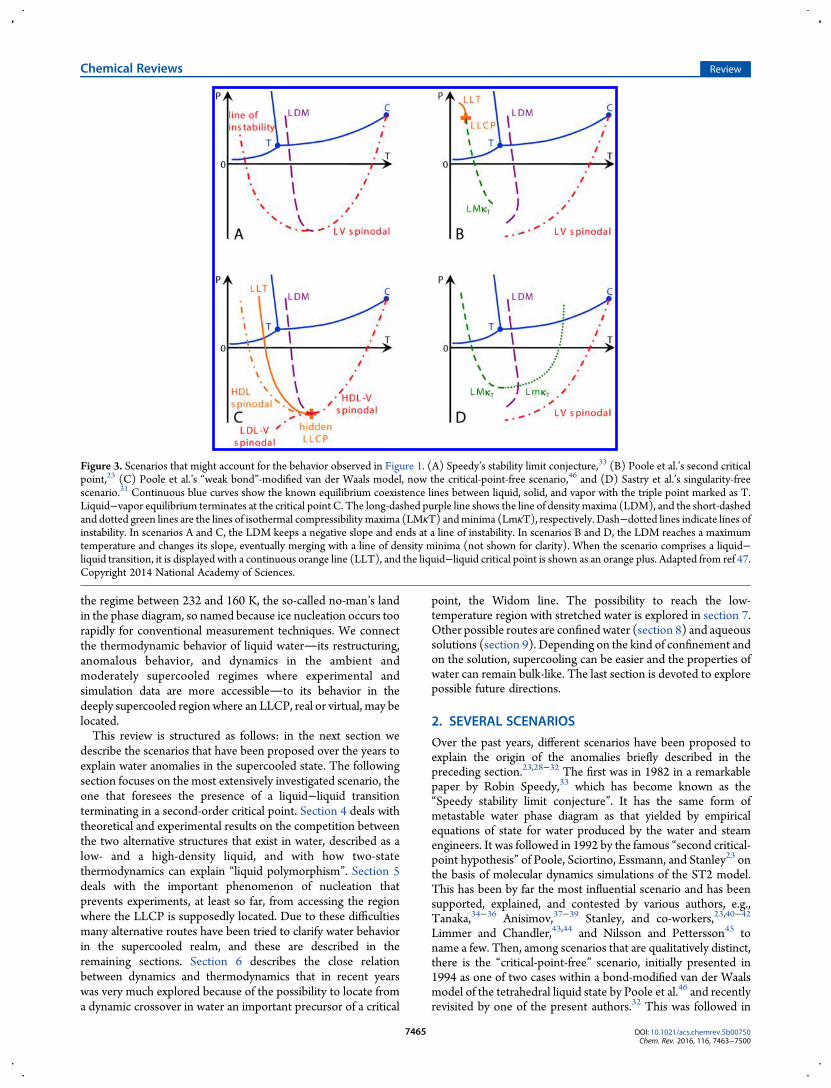
An Ewald summation of Coulombic interactions requires anassumption about the dielectric properties of the mediumsurrounding the system at infinite distance. Reference 118 usedvacuum boundary conditions (ϵ∞= 1), which we will refer to asthe ST2b model. Limmer and Chandler43,44 studied differentversions of the ST2 model using a hybrid Monte Carlo approachin which both the density ρ and the orientational order parameterQ6 that discriminates between disordered liquid and crystallineenvironments can be controlled. They did not find evidence of anLLPT for any model variation and suggested that results pointingto an LLPT were due to insufficient equilibration and sampling.A subsequent study by Liu et al.117 used NPT Monte Carlosampling and a weighted histogram analysis method to obtain thefree energy as a function of ρ, Q6, and temperature T. Theexistence of an LLPT for the ST2b (ϵ∞= 1)model was confirmed(see Figure 6). For the ST2a (ϵ∞ → ∞) model, rapid
crystallization to an unphysical high-density (ρ ≈ 1.5−1.7 g/cm3) dipolar-ordered ice phase was observed. A phase diagramsimilar to that shown in Figure 6 (shifted to slightly highertemperatures and pressures) was obtained by Cuthbertson andPoole134 and Poole et al.146 for the ST2c (reaction field) modelusing molecular dynamics and umbrella sampling Monte Carlo,respectively. The most comprehensive study to date of an LLPTin a molecular model of water was reported recently by Palmer etal.,119 who focused on the ST2b (ϵ∞= 1) model. Six differentcomputational protocols were used to obtain the free energy as afunction of ρ, Q6, and temperature T, and all three basins (HDL,LDL, and crystal) were sampled reversibly (see Figure 7). Thefree-energy barrier between HDL and LDL was obtained as afunction of system size and found to be consistent with the N2/3
scaling law expected for a first-order phase transition.At LLPT conditions, both liquids are metastable with respect
to crystallization, and if the time is sufficiently long and thesystem size sufficiently large, crystallization will eventually occur.Unlike the mW model,147 crystallization time scales for the ST2model of water are longer than the time scales for equilibration of
the liquid. For example, in a study of the ST2c (reaction field)model using an N = 4000 molecule system, Yagasaki et al.148
observed liquid−liquid coexistence at T = 235 K forapproximately 800 ns, followed by ice nucleation and crystalgrowth. In that study a rectangular simulation box was used tominimize the interfacial energy and allow liquid−liquidcoexistence to develop. These results were later criticized byOverduin and Patey,149 who found that the density differencesthat are observed for TIP4P/2005 and TIP5Pwater using smallersimulation cells disappear when larger cells (N = 32 000) areconsidered.Using the same force-field model as Yagasaki et al., Kesselring
et al.150,151 performed many 1 μs simulations of systems rangingin size from 216 to 729 molecules and found LDL to be stablewith respect to the crystal in over 98% of their runs. Small crystalnuclei (“crystallites”) are easily detected using the bond orderparameter d3 introduced by Ghiringhelli et al.
152 This parametercharacterizes the bond between twomolecules and is designed todistinguish between a fluid and a diamond structure. A moleculeis typically considered part of a crystal if three of its four bondsexhibit d3 < 0.87. In the simulations done by Kesselring et al., tinycrystallites grew and then melted within 1 μs. On the basis of thefew crystallization events that occurred, they estimated that thecritical size of a crystallite is approximately 70 ± 10 moleculesbefore spontaneous crystallization occurs.Two recent studies by Sciortino and co-workers rigorously
examine the LLPT for a general model of tetrahedrallycoordinated liquids140 and for variations of the ST2 model ofwater.153 They show that bond flexibility affects the relativestability of the liquid and crystal phases. On increasing bondflexibility, the liquid−liquid critical point moves to a temperaturewhere the liquid is more stable than ice. Taken together with thework of Palmer et al.,119 these studies conclusively show that theclaim of Limmer and Chandlerthat the liquid−liquidtransition is a misinterpreted crystallization transition in allatomistic models of wateris incorrect in its generality. It iscertainly true for the mW model, while for TIP4P/2005 water
Figure 6. Pressure−temperature projection of the metastable phasebehavior of the ST2b model for water from Liu et al.117 showing theliquid−liquid coexistence curve (black squares), the LDL spinodal (uptriangles), and the HDL spinodal (down triangles). Solid and dashedlines are a guide to the eye, and the red circle is the critical point from ref118. Reproduced with permission from ref 117. Copyright 2012American Institute of Physics.
Figure 7. Free-energy surface of the ST2 model with vacuum boundaryconditions at 228.6 K and 2.4 bar from Palmer et al.119 These conditionscorrespond to liquid−liquid equilibrium. Contours are spaced 1 kBTapart. Reproduced with permission from ref 119. Copyright 2014Macmillan Publishers Limited.
Chemical Reviews Review
DOI: 10.1021/acs.chemrev.5b00750Chem. Rev. 2016, 116, 7463−7500
7469

the situation is unclear.27,148,149,154 The origin of the discrepancybetween different simulations using the ST2 model has still notbeen clearly identified, but potential contributions are discussedin ref 155.We conclude this section by noting that the strong debate
about the potential existence of a LLPT in real and simulatedsupercooled water has driven a rapid development of computa-tional methodologies and led to rigorous sampling of low-temperature properties in several water models. However, toconclusively determine which case describes real water we willneed new experimental data that go deeper into no-man’s land.
4. COMPETITION BETWEEN TWO ALTERNATIVESTRUCTURES
The anomalies of supercooled water and the possibility ofmetastable liquid−liquid separation in water can be explained ifwater is viewed as a mixture of two interconvertible organizationsof hydrogen bonds whose ratio is controlled by thermodynamicequilibrium.38,39,156,157 Beginning with the mixture models ofWhiting and Rontgen,57,58 two-scale models137,158 have oftenbeen invoked as possible explanations of the thermodynamic anddynamic anomalies of liquid water. These models posit aseparation of the energy states available to water molecules intotwo distinct groups: one corresponding to low-energy/low-entropy ordered configurations and the other to high-energy/high-entropy configurations. In this picture the complexity ofwater is thus modeled by a mixture of these two structural motifs.Conceptually similar but differently formulated approaches
have been taken using two-state models. Tanaka34,36,156
recognizes that in any liquid locally favored structures with lowconfigurational entropy are formed in a sea of random, normal-liquid structures with high configurational entropy. A phenom-enological two-state model approximates this picture as abimodal distribution of possible molecular configurations andsees cold and supercooled liquid water as a “mixture” of twodistinct competing states, where the fraction of each state iscontrolled by pressure and temperature. Anisimov and co-workers38,39,159 describe a competition between an ideal entropyof mixing and a nonideal part of the Gibbs energy of mixing. Theexistence of two structures does not necessarily mean that theywill phase separate.39,157,159 If these structures form an idealsolution, the liquid will remain homogeneous at any temperatureor pressure, while the competition between the two structuresmay cause the density maximum and nondiverging anomalies of
the response functions.157 However, if the solution is nonideal, apositive excess Gibbs energy of mixing could lead to phaseseparation if the nonideality of mixing of these two states isstrong enough. If the excess Gibbs energy is primarily associatedwith a heat of mixing, the separation will be energy driven. If theexcess Gibbs energy is primarily associated with excess entropy,the separation will be entropy driven. The entropy-driven natureof this separation means that if the two states were unmixed theywould allow more possible statistical configurations and thus ahigher entropy.One example of this is the Woodcock−Angell−Cheeseman
(WAC) model160 modified by Lascaris.161 The original WACmodel was for liquid silica (SiO2), a close relative of water. Bothliquids are tetrahedral and consist of large four-coordinatedatoms (O in water, Si in silica) surrounded by twice as manysmaller atoms (H in water, O in silica), but unlike most watermodels the WAC model has no explicit bonds and is simply amixture of Si4+ and O2− ions. It was recently found that the WACmodel is remarkably close to having a LLCP,162 and it wassubsequently demonstrated that by decreasing the ion charge themodel can be tuned such that a LLCP appears, as indicated by thecrossing of the isochores and the diverging response functionmaxima at the state point where the LLCP is located.42,122
Increasing the charge separates the isochores and greatly reducesthe magnitude of the response function maxima. In addition, theresponse function maxima move to separate state points,indicating that the LLCP has disappeared.161 Changing the ioncharge in the WAC model has this effect due to the Gibbs freeenergy of mixing, ΔGmix = ΔHmix − TΔSmix. Because increasingthe charge makes the Si−O bond more attractive, more Si ionsare drawn into the first coordination shell. This increases theHDL entropy and thus the ΔSmix. The result is that ΔGmixbecomes negative at all temperatures and pressures, and noliquid−liquid transition occurs. A decrease in the ion chargereverses this effect. These considerations suggest that the liquid−liquid transition in the modified WAC model may be entropydriven, a scenario that has also been proposed for water.39
According to Mishima and Stanley,40 if the intermolecularpotential of a pure fluid exhibits two minima, the interplaybetween the two indicates that a liquid−liquid separation may bepresent. Another possibility is a double-step potential caused byhydrogen-bond bending, as shown by Tu et al.164 A liquid−liquidtransition in the two-scale spherically symmetric Jagla rampmodel of anomalous liquids has been demonstrated,137 and the
Figure 8. Low-density fraction from simulations of water-like models, and the predictions from the two-state thermodynamics (Reproduced withpermission from ref 163. Copyright 2014 AIP Publishing LLC): (a) ST2(II) (denoted ST2b in Table 1), a version of the ST2model.163 Fraction x is thelow-density fraction. Symbols are simulation data. Solid curves are theoretical predictions. Dashed curve is a mean-field approximation. (b) mWmodel.Reproduced with permission from ref 136. Copyright 2013 AIP Publishing LLC. Solid curves are theoretical predictions which include clustering ofwater molecules with average aggregation number N = 6.
Chemical Reviews Review
DOI: 10.1021/acs.chemrev.5b00750Chem. Rev. 2016, 116, 7463−7500
7470

LLCP has rigorously been proven to be second order andbelonging to the Ising universality class.138 Ponyatovsky et al.165
andMoynihan166 assume that water is a “regular binary solution”of two states, and this implies that the phase separation is drivenby energy. Cuthbertson and Poole134 and Holten et al.163 applythe energy-driven version of the two-state thermodynamics todescribe the fraction of molecules in the high-density structure oftwo versions of the ST2 model of water, which exhibits liquid−liquid separation. Holten et al.136 also describe the thermody-namic anomalies of the mW model with the same equation ofstate as used in ref 39 to correlate thermodynamic anomalies inreal supercooled water. Although direct computations of thefraction of molecules involved in the low-density structure in theST2 and mWmodels are in agreement with the prediction of thetwo-state thermodynamics136,159 (see Figure 8), in the mWmodel the athermal, entropy-driven nonideality of mixing of thetwo alternative structures is not sufficiently strong to causeliquid−liquid phase separation. The situation in real waterremains less certain, but the recent correlation of availableexperimental data39,167 (see Figure 9) favors a nonideality inentropy-driven mixing of the alternative molecular configura-tions. Thus, from a phenomenological point of view and even
without a microscopic understanding of the differences betweenthe alternative configurations, the two-state model clearly yieldsan equation of state of supercooled water that can be fitted toagree remarkably well with experimental results34,39,156,167 (seeFigure 9).A difficulty associated with correlating data that are obtained in
the experimentally accessible region (above the ice homoge-neous nucleation temperature) is accurately locating the liquid−liquid critical point and determining the critical pressure basedon these data. Using the optimization shown in Figure 10, any
critical pressure value above 100 MPa is excluded and the lowerlimit is uncertain. This is in contrast to the extensively studiedwater models, the ST2 model and the TIP4P/2005 modelproposed by Abascal and Vega,170 for which the critical points arelocated at about 180 and 135 MPa, respectively, see Table 1.However, any attempt to predict the location of a possible LLCPbecomes highly uncertain because the anomalous behaviorintensifies as it moves into regions of lower temperature andhigher pressure where measurements are lacking (see Figure 10).Indeed, we note the uncertainty in the location of a possibleLLCP in the TIP4P/2005 model as there have been differentproposals,27,148,154 and the existence of an LLCP in the modelhas been questioned.149,171
4.1. Experimental Structural Results
More generally, two-state thermodynamics can explain “liquidpolymorphism”, defined as the existence of a single-componentsubstance in more than one different liquid form.72,156,157,172−175
Liquid polymorphism has been experimentally observed or
Figure 9. Density of cold and supercooled water as a function oftemperature along isobars. Reproduced with permission from ref 39.Copyright 2012 MacMillan Publishers. Symbols represent experimentaldata.71,168,169 Black curves are the predictions of the two-state model.39
TM (dark red) indicates the melting temperature, and TH indicates thehomogeneous nucleation temperature. The thick blue line is thepredicted liquid−liquid equilibrium curve, with the critical point C. Thered line is the line of maximum density, and the green line is the line of aconstant LDL fraction of about 0.12.
Figure 10.Optimization of the critical-point location (Reproduced withpermission from ref 39. Copyright 2012Macmillan Publishers Limited).For a given location of the critical point and a particular set of theadjustable parameters, the residual for each experimental data point iscomputed as the difference between the measured value and thecomputed value of that property. These individual residuals are madedimensionless by an experimental uncertainty and then summed, withthe lowest value of the sum of squared residuals that can be achieved foreach location of the critical point by varying the adjustable parameters.The solid red line is the hypothesized liquid−liquid transition curve. Thedashed curve shows the temperature of homogeneous ice nucleation.The blue dotted curve is the liquid−liquid transition curve suggested byMishima,71 and the green dotted curve is the singularity line suggestedby Kanno and Angell.18
Chemical Reviews Review
DOI: 10.1021/acs.chemrev.5b00750Chem. Rev. 2016, 116, 7463−7500
7471

theoretically suggested in molten silicon, liquid phosphorus,triphenyl phosphate, and in some other molecular-network-forming substances.21,144,157,172,173 Recent experiments176−182
suggest the existence of a bimodal distribution of molecularconfigurations in water. From a molecular point of view, waterdoes not consist of distinct species. It is the nature of thehydrogen-bonding network that implies that fluctuations indensity, correlated with local tetrahedral ordering, give rise tostructurally distinct regions of local order that in turn give rise topseudobinary behavior. Indeed, data from small-angle X-rayscattering (SAXS) have been interpreted in terms of densityinhomogeneities in the liquidwith an average spatial extent of∼1 nm at ambient conditions183that grow upon super-cooling.184 Although this interpretation has beencriticized,185−187 it has received support from a purely statisticalmechanical perspective.188
X-ray absorption spectroscopy (XAS) has also indicated thepresence of two types of local structure in liquid water: verytetrahedral and very disordered.179,189,190 The former wouldcorrespond to LDL and the latter to HDL. There is generalagreement that the pre- (535 eV) and main-edge peaks (537−538 eV) in the XAS of liquid water are fingerprints of distorted Hbonds, whereas the postedge (540−541 eV) is associated withstrong H bonds and is further enhanced for tetrahedral H-bondstructures.179,189−193 Interpretations of the spectra in terms ofstructure either emphasize the ultrafast nature of the X-ray probeand suggest small, instantaneous distortions around a mainlytetrahedral network193−196 or propose fluctuations that are of asufficiently long duration and are sufficiently extended that adistinction in terms of local HDL and LDL environmentsbecomes meaningful.176,183,185,197
The most direct evidence of bimodality in terms of localstructures is found in X-ray emission spectroscopy (XES) inwhich the sharp, nonbonding lone-pair peak of gas-phase waterbecomes broadened and shifted down in energy in crystalline ice(see Figure 11). In water we observe two sharp peaks that
interconvert but do not broaden with increasing temper-ature.180,181,183,198−201 The peak close to the peak in tetrahedralice is assigned to local LDL-like tetrahedral coordination, and theother peak, close to the gas-phase position, is assigned todisordered HDL-like local structures with broken or weakened Hbonds. The origin of the split is under debate,202,203 with oneinterpretation in terms of differences in final state198,199 and theother in terms of differences in the initial state.180,183,204
However, both interpretations require the existence of twodifferent local environments. As further support for a bimodaldistribution of structures, we note the recent time-resolvedoptical Kerr effect (OKE) measurements by Taschin et al.177
OKE involves low-energy vibrations in the H-bonding networkwhere there are clearly identified signatures of HDL and LDLwith the same temperature dependence as in the otherspectroscopies.Using an X-ray free-electron laser the transformation of water
structure in micrometer-sized water droplets has been observedas they are cooled to below the temperature of homogeneousnucleation178 (see Figure 12). The droplets are injected intovacuum, where they almost instantly cool through evaporation,and a diffraction pattern is obtained from individual dropletswhen they are hit by the 50 fs duration, intense X-ray pulses. Thetemperature of the droplets can be controlled by varying thedistance between the nozzle where the droplets are generatedand the region where they interact with the X-rays. If thediffraction pattern exhibits Bragg spots the droplets are icecontaining, and if it exhibits diffuse rings the droplets are liquid.The lowest temperature at which liquid droplets are still presentis 227 K, i.e., 5 K below the previous upper boundary of the no-man’s land. Analysis of the data shows a continuous butaccelerated transformation of the structure toward an LDL-dominated liquid.178 Thus, the structure of water is LDA when itcools through the no-man’s land (to T < 136 K) withoutcrystallization.99,206−209
The transition curve from ref 178 now provides experimentaldata based on which molecular simulations can be calibrated, buteven more importantly it also gives information on the locationof a potential LLCP or LLPT.45 In Figure 8 we show thetemperature- and pressure-dependent fraction of the low-densityspecies in two different models of water. The ST2 model hasrecently been shown to exhibit liquid−liquid coexistence, and aLLCP and the shape of the low-density fraction curves clearlydepend on whether they approach the LLPT or traverse the one-phase region and then the sharpness of the rise depends on thedistance in pressure and temperature from the critical point. Thiswas used by Nilsson and Pettersson45 to deduce an LLCP, real orvirtual, in the range of pressure 500−1500 bar. A virtual LLCPwould exhibit instability between HDL and LDL as for a realLLCP but would lead to crystallization before the correlationlength can develop a divergence.211
4.2. Order Parameter
In the present section we will focus on characterizing the localstructure related to HDL and LDL based on various orderparameters. Since the focus is on the local environment we willhere use the terminology locally favored structures to distinguishfrom the global structure of LDL. We define the locally favoredstates as states in which a water molecule is hydrogen bondedwith four neighbors with a high tetrahedral symmetry and there isno penetration of other water molecules inside the first shell. Theother component instead shows significant local disorder with afifth neighbor at interstitial position.
Figure 11. Experimental O 1s soft X-ray emission spectra of gas-phasewater, liquid water at different temperatures, and amorphous andcrystalline ice, with an energy scale displaying the full spectrum (A) oronly the lone-pair, 1b1 region (B). The excitation energy is 550 eV, wellabove the ionization threshold. Peak components are labeled based onthemolecular orbitals for a water molecule. The highest peak (1b1) splitsinto double peaks (1b1′ and 1b1″). XES spectra of amorphous (−190 °C(83 K)) and crystalline ice from Gilberg et al.205 are included forcomparison. Figure adapted with permission from ref 180. Copyright2008 by Elsevier.
Chemical Reviews Review
DOI: 10.1021/acs.chemrev.5b00750Chem. Rev. 2016, 116, 7463−7500
7472

A two-order parameter model36 provides a framework forunderstanding the spectroscopic results and the variousthermodynamic features in terms of two competing orderparameters: a density-dependent order metric that promotesclose-packed structures in both the crystal and the liquid and ananisotropic or bond-driven order parameter that promotes open,tetrahedral local order. The local structure of the liquid tends tocorrespond to that of the underlying crystalline phase, and atriple point is seen, i.e., a point where the low-density crystal, thehigh-density crystal, and the liquid are in equilibrium.35 Glass-forming tendencies are most pronounced in the neighborhood ofthe triple point,212,213 where structural frustration due tocompetition between the two order metrics is mostpronounced.36
The connection between the two-order parameter descriptionof water-like liquids and an atomistic picture of liquid statestructure and dynamics was first provided by Errington andDebenedetti using the rigid-body SPC/E water model.214 Thisconnection requires that local order metrics be defined in termsof particle positions. A suitable order metric that defines density-driven local order applicable to both simple and complex fluids isthe translational- or pair-ordering metric in terms of the atom−atom pair-correlation function g(r).215 In the case of H2O, thisorder parameter may be defined as
∫τξ
ξ ξ= | − |ξ
g1
( ) 1 dC 0 oo
C
(2)
where ξ = rρ1/3 is the distance r between the oxygen atoms of apair of molecules divided by the mean pair separation ρ−1/3,where ρ is the number density N/V, and gOO(ξ) is the oxygen−
oxygen pair-correlation function. A convenient measure of localtetrahedrality associated with a given oxygen atom i is given by
∑ ∑ ψ= − += = +
⎜ ⎟⎛⎝
⎞⎠q 1
38
cos( )13j k j
jktet1
3
1
4 2
(3)
where ψjk is the angle between the bond vectors rij and rik where jand k in the two summations label the four nearest oxygen atoms.At low densities or temperatures the probability distributions oftetrahedral order P(qtet) have a peak at high tetrahedrality. Atintermediate densities or temperatures P(qtet) has a bimodal orshoulder structure with a second peak at intermediatetetrahedrality. Order maps displaying the correlation betweentranslational and tetrahedral order provide an interaction-independent summary of the variation of structural order overa wide range of state points. In the case of SPC/E and other rigid-body models of water, one can define a structurally anomalousregion in the phase diagram such that all state points in thisregime fall on essentially the same curve in the (qtet, T) plane.This strong correlation between tetrahedral- and pair-orderindicates that distortions from local tetrahedrality in thehydrogen-bonded network reduce pair correlations and enhancedisorder in the anomalous regime. At high densities, tetrahedralorder ceases to be significant and the system behaves as a simpleliquid dominated by pair ordering.The phenomenological order parameter in the two-state
model is the extent of the “reaction” between the two alternativestructures39,159,163 (see Figure 8). Thermodynamically, thisorder parameter belongs to the Ising model universality classand it is a nonconserved dynamic property.174 However, two-state thermodynamic models cannot microscopically describe
Figure 12. Ultrafast X-ray probing of water structure below the homogeneous ice nucleation using micrometer-sized water droplets falling in vacuum,Reproduced with permission from ref 178. Copyright 2014 Macmillan Publishers Limited. (a) Scattering structure factor, S(q). Data reveal acontinuously increasing split of the principal S(q) maximum into two well-separated peaks, S1 and S2 (dashed lines). (b) Experimental tetrahedrality (g2)values, derived from the measured split, Δq, between the two peaks in (a) as calibrated against a fit to molecular dynamics data. g2 is the height of thesecond peak in the O−O pair-distribution function. Error bars are estimated from the maximum and minimumΔq values allowed by the uncertainty inthe S1 and S2 peak positions. Also shown is the fourth-order polynomial least-squares fit to the experimental data (black solid line), where the last (that is,low-T) two data points for the 12 μm diameter droplets and the last data point for the 9 μm diameter droplets are ignored owing to high nonlinearity inthe detector response (see ref 178). For comparison, the temperature dependences of g2 for the TIP4P/2005 (red dashed line) and SPC/E (purpledashed line) models are depicted along with the characteristic value of g2 for LDA ice210 (blue dash-dotted line).
Chemical Reviews Review
DOI: 10.1021/acs.chemrev.5b00750Chem. Rev. 2016, 116, 7463−7500
7473

the alternative liquid structures in water, thus hindering attemptsto build the two-state thermodynamics from purely microscopicinformation.The most popular order parameters used in microscopic two-
state models of water are the tetrahedral order parameterqtet
136,215 (defined in eq 3), g5(r) (the average density of fifth-nearest neighbor),134 ζ (the distance between the first andsecond shell),216 and the local structure index (LSI).217−221
Here we consider several properties of supercooled liquidwater that can be defined using the order parameter. In referenceto a possible liquid−liquid phase transition in water, evidence hasbeen found that there are two different forms of the liquid thatdiffer in the structure of their second-nearest neighbor shell.67
The low-energy/low-entropy state is characterized by an opentetrahedral structure and the high-energy/high-entropy state by acollapsed second-nearest neighbor shell with substantial shellinterpenetration.40 The microscopic pathway to the crystal-lization of supercooled water is also relevant in that hydrogenbonding causes water to acquire a high degree of translationalorder prior to crystallization, i.e., in supercooled water moleculesprogressively organize themselves in well-defined shells. Incontrast, simple liquids such as hard-sphere fluids have a highdegree of orientational order prior to crystallization and acquiretranslational order only after a liquid-to-solid transition.222 Thus,to detect locally favored states in water, the order parameter musttake into account the structure up to the second-nearest neighborshell, defined in terms of the network of hydrogen bonds, and bebased on translational order rather than orientational order.Thus, tetrahedral order only takes into account the firstcoordination shell and is obtained from bond angles ratherthan bond distances, and g5(r) ignores the underlying hydrogen-bond network.We thus next consider the order parameter ζ,216 which
measures the distance between the shells of the second and firstnearest neighbors. This is obtained by reconstructing thenetwork of hydrogen bonds and then computing for eachwater molecule the difference between the radial distance of theclosest oxygen in the second shell and that of the farthest oxygenatom in the first shell. Locally favored states (S) are representedby a Gaussian population centered around a finite value of ζ, andthe disordered state is characterized by a Gaussian population
centered around a null value of ζ, with substantial shellinterpenetration (ζ < 0).Figure 13a shows that by decomposing the two populations for
many state points it is possible to extract the fraction s of locallyfavored states, where s is the order parameter that indicates thedegree of structural order. This fraction can then be fitted with atwo-state model (see the lines in Figure 13a), which is obtainedsolely from microscopic information. Note that the isobarsbecome mechanically unstable at high pressure and lowtemperature, indicating the presence of a liquid−liquid criticalpoint (full symbol).The structural order parameter estimated using microscopic
measurements enables us to predict quantitatively the magnitudeof the anomalies and compare them with those obtained insimulations. Figure 13b compares the simulations (symbols)with the two-state model predictions (lines) for the densityanomaly of TIP4P/2005. The two-state model agrees with themeasured anomalies, indicating that a microscopic two-statedescription of the phase behavior of water is possible. Reference216 carries out extended analyses for both the TIP4P/2005 andthe TIP5P models of water.Although it was recently proposed that a liquid−liquid phase
separation can only occur on time scales shorter than theequilibration time of the simulated (or real) liquidand thusonly liquid−solid transitions are possible43,44results fromseveral water models showing strong fluctuations between high-and low-density liquid indicate the presence of an HDL−LDLtransition.134,138,150 The extensive study by Palmer et al.119 usingseveral different computational protocols verifies a metastableliquid−liquid coexistence for the ST2 model. For othersimulation models, such as TIP4P/2005, the situation is lessclear (see discussion in section 3). The studies above wereperformed in the deeply supercooled and pressurized region ofthe phase diagram, while water anomalies set in already underambient conditions. As already discussed, these anomalies find asimple description in a two-state model, and evidence of abimodal distribution of local, instantaneous structures has beenfound in ambient real water both from X-ray spectros-copies179−181,183 and from measurements of the optical Kerreffect.177 However, no molecular dynamics simulation has so far
Figure 13. Two-state model for TIP4P/2005 water. (a) Values of the fraction of the locally favored S state (s) as a function of temperature for allsimulated pressures. Symbols mark the values obtained by decomposition of the order parameter distribution, P(ζ), at the corresponding state point.Continuous lines are fits according to the two-state model. (b) Temperature dependence of density for several pressures. Continuous lines aresimulation results, while symbols are obtained from the two-state model. Reproduced with permission from ref 216. Copyright 2014 MacmillanPublishers Limited.
Chemical Reviews Review
DOI: 10.1021/acs.chemrev.5b00750Chem. Rev. 2016, 116, 7463−7500
7474
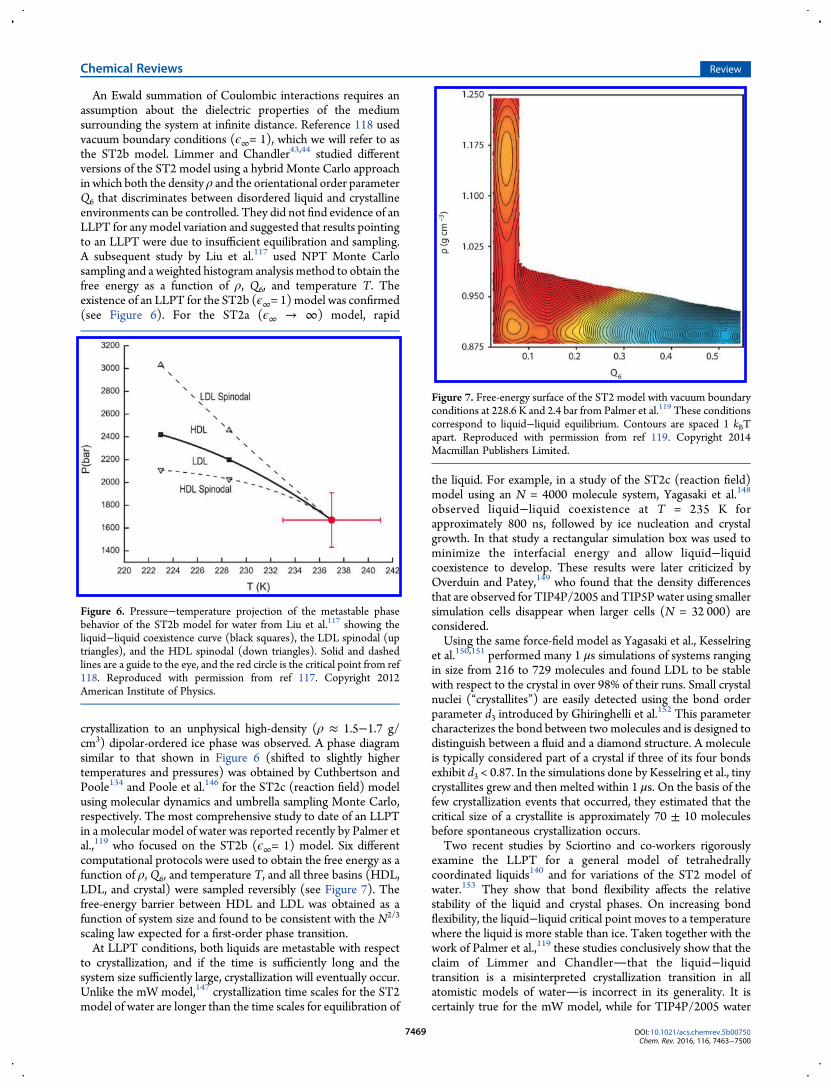
shown a bimodal structural distribution under ambientconditions.On the other hand, Sciortino and co-workers219,221 applied the
local-structure index (LSI) of Shiratani and Sasai217,218 to theinherent structure of SPC/E water and found that the resultingdistribution of this order parameter was bimodal in terms ofHDL and LDL at all investigated temperatures. The inherentstructure223 is obtained by removing thermal disorder, i.e.,quenching the instantaneous structure to the nearest localminimum through minimizing the energy in an optimization ofthe geometry.The LSI for each molecule i is acquired by putting the
distances of the nearest neighbors j from the reference molecule iin increasing order, i.e., r1 < r2 < r3 < ··· < rn(i) < 3.7 Å < rn(i)+1,where n(i) is the number of molecules within 3.7 Å frommolecule i (using the positions of the oxygen atoms). The LSIdistinguishes molecules with well-separated first and secondcoordination shells from molecules in a disordered environment,containingmolecules in interstitial positions, using the parameterI(i) defined by
∑= Δ − Δ=
I in i
j i i( )1( )
[ ( ; ) ( )]j
n i
1
( )
mean2
(4)
Here, Δ(j;i) = rj+1 − rj and Δmean(i) is the average of Δ(j;i) overall neighbors j of molecule i within the cutoff. The LSI measures
the degree of order in the pair-correlation function out to thesecond shell for a given oxygen; a high value indicates a highlystructured, locally favored tetrahedral or LDL-like, localenvironment, while a low value indicates a highly disordered,more close-packed or HDL-like structure.217,218 A connectionbetween the inherent structure of the more realistic TIP4P/2005water model and the phase diagram of water was made byWikfeldt et al.220 They found a perfectly bimodal distribution ofstructures separated at the same LSI value for all temperaturesand pressures (Figure 14A−C). The fraction in each distributionis plotted in Figure 14D, where a weak dependence ontemperature is seen in the ambient regime, but as thetemperature is decreased into the supercooled regime, anaccelerated conversion of low-LSI (HDL) species into high-LSI (LDL) is observed fully consistent with recent measure-ments on micrometer-sized water droplets where a continuousbut accelerated transformation to a highly tetrahedral liquid wasobserved down to 227 K.178 Interestingly, the 3:1 ratio betweenHDL- and LDL-like local environments in the inherent structureat ambient conditions is very close to what has been concludedfrom spectroscopic measurements.177,179−181,183
A direct connection with thermodynamics is found for thecrossing point, i.e., where the populations in the two distributionsare equal. At each investigated pressure the crossing pointcoincides with theWidom line (see the definition in section 6) inthe model where fluctuations are maximal. A further observation
Figure 14. Analysis of the inherent structure in simulations of TIP4P/2005 water. (A−C) Plot of the temperature-dependent distributions of LSI valuesat (A) 1, (B) 1000, and (C) 1500 bar. (D) Fraction of molecules in each distribution as a function of temperature and pressure. TheWidom line (see thedefinition in section 6) at each pressure is indicated by a vertical line and corresponds to the crossing point between the high- and low-LSI distributions.Figure adapted with permission from ref 220. Copyright 2011 Royal Society of Chemistry.
Chemical Reviews Review
DOI: 10.1021/acs.chemrev.5b00750Chem. Rev. 2016, 116, 7463−7500
7475

regarding the inherent structure can be made from thetemperature dependence within each distribution where withincreasing temperature the low-LSI (HDL-like) species exhibitincreasing disorder (shift to lower LSI values) while themaximum of the high-LSI (LDL-like) distribution remains atfixed LSI value while the magnitude decreases. This is consistentwith the temperature dependence of the two lone-pair peaks inX-ray emission spectroscopy180,181,183 as well as the temperatureevolution of X-ray absorption spectra of water.190 However, insimulations of ambient water published so far the bimodality ofthe inherent structure becomes smeared out and more of anaverage is observed.
5. NUCLEATION OF ICE FROM SUPERCOOLED WATERIce crystallization creates a severe obstacle to experimentallydetermining whether there actually exists a liquid−liquidcoexistence line and LLCP. Thus, nucleation of ice from theliquid and, in particular, the nucleation rate become essential todetermine when designing experiments that aim to study water inno-man’s land. Below the melting point, water is metastable andwill eventually freeze into its thermodynamically stable phase(ice). The transformation involves overcoming a free energybarrier so that the freezing is an activated process. Often thetransformation into ice occurs on the surface of solid impurities(heterogeneous nucleation). Some solid compounds, such asAgI224 or feldspar,225 are quite efficient in reducing the freeenergy barrier for nucleation. Dust particles of the Sahara desertthus play a key role in the freezing of water in the upperatmosphere.225 In the absence of impurities, metastable liquidwater can survive even at temperatures well below the meltingpoint until a critical nucleus of ice appears in the bulk(homogeneous nucleation). By condensing micrometer-sizedwater droplets (microdroplets) from saturated vapor inexpansion cloud chambers, it has been possible to preparemetastable liquid water at temperatures down to 232 K.226−228
Below this temperature (known as the homogeneous nucleationtemperature TH) water freezes too quickly for traditionalmeasurement techniques. Note that this is different from themicrometer-sized droplets of Figure 12, which were generateddirectly as liquid droplets.178
From the fraction of droplets containing ice as a function oftime at a given temperature it is possible to experimentallydetermine the nucleation rate, J, i.e., the number of critical iceclusters per unit of volume and time. Classical nucleation theory(CNT) has often been used to describe the experimental results.According to CNT, J is given by229−231 J = K* exp(−ΔG*/(kBT)), where K* is a kinetic prefactor related to the timerequired for a particle of the fluid to be incorporated into a solidcluster and ΔG* is the free energy barrier. In CNT ΔG* isrelated to the interfacial free energy γsl between the two phases,ice Ih and liquid, and to their chemical potential difference Δμand is given by the relation ΔG* ∝ (γsl)
3/(Δμ)2. Δμ is wellknown from experiments and increases as the temperaturedecreases (thus reducing the free energy barrier), but theexperimental value of γsl for the ice Ih−water interface is not sowell known (values between 25 and 35 mN/m have beenreported232,233). By inserting solid clusters of ice Ih (seeds) insimulations of supercooled water and using CNT to interpret theresults it has been possible to estimate J from computersimulations234,235 in a range of temperatures larger than previousstudies.236−242
Various experimental techniques to determine J are comparedin Figure 15. Above TH, 232 K, microdroplets have been
produced in (water-in-oil) emulsions using microfluidic devicesby Stan et al.243 and Riechers et al.,244 whereas Stockel et al.245
levitated single water droplets in an electrodynamic balance andMurray et al.246 determined the nucleation rate from micro-droplets supported on a hydrophobic substrate. All thesetechniques agree within the error bars of the experiments246
and have determined J within an order of magnitude between235 and 244 K to 7 × 10⁸ and 5 × 10⁻¹⁰ cm−3 s−1,respectively.243−246,255 If CNT is applied to the experimentaldata in this temperature regime, the fit closely resembles that of a“fragile” liquid. Below 232 K, however, nonconventionaltechniques that cool water rapidly and simultaneously detectice nucleation have to be applied to overcome the homogeneousnucleation temperature, which has resulted in that variousmeasurements do not agree. Hagen et al.247 used an expansioncloud chamber to nucleate microdroplets between 228 and 233 Kand obtained J of 2 × 10¹⁷ and 2 × 1012 cm−3 s−1, respectively.Hagen et al. relied on using a droplet growth model247 that mayintroduce large uncertainties in the estimation of the temperatureand droplet size.246 Very recently, Sellberg et al.178 exploited theintense 50 fs X-ray pulses from the Linac Coherent Light Source(LCLS) free-electron X-ray laser to measure the structure ofwater in microdroplets evaporatively cooled in vacuum to a rangeof temperatures down to 227 K, i.e., 5 K below TH. On the basisof these data Laksmono et al.248 analyzed the ice fraction andobtained J ranging from 2 × 10¹¹ to 4 × 1012 cm−3 s−1 as thetemperature decreased from 232 to 227 K.248 Sellberg et al. and
Figure 15. Comparison of experimentally determined nucleation rates Jof water using microdroplets (black hollow markers243−247 and red andbrown filled dots248), nanodroplets (blue hollow markers249,250), thinfilms (green open diamonds and triangles,251,252 and hyperquenchedwater.253,254 Data of microdroplets (red solid line) and nanodroplets(blue symbols) follow different trajectories where the nanodroplet datamight be affected by the large surface area to volume ratio and elevatedinternal pressure. An upper limit for the nucleation rate maximumwithinno-man’s land Jmax (pink solid line) and a corresponding lower limit Jmin(pink dashed line) were calculated from hyperquenching experimentson microdroplets.99,206−209 The expected CNT behavior for a “fragile”(black dotted line) and a “strong” (green solid line) liquid are includedas guides to the eye. We follow Jenniskens and Blake251 to obtain the“fragile liquid”CNT curve and also include an expected extension of thenucleation rate into no-man’s land (green curve) based on therequirement to lie between the upper and the lower limits fromhyperquenched microdroplets. Figure adapted from ref 248. Copyright2005 American Chemical Society.
Chemical Reviews Review
DOI: 10.1021/acs.chemrev.5b00750Chem. Rev. 2016, 116, 7463−7500
7476

Laksmono et al. determined the droplet diameters through exsitu optical microscopy and scanning electron microscopy butwere forced to rely on Knudsen theory of evaporation, which wascalibrated toward reference data above 250 K, to determine thedroplet temperature as well as to MD simulations of dropletcooling to verify the Knudsen model.178
Huang and Bartell,249 Manka et al.,256 and Babhe et al.250 useda different approach and condensed water vapor in a supersonicflow, which reduced the droplets to nanometer-sized dimensions(nanodroplets). This reduces the probability of nucleation butalso increases the surface-to-volume ratio and internal Laplacepressure and therefore may not be representable of bulk water atambient pressure.248 These measurements have yielded J of∼1023 cm−3 s−1 between 170 and 215 K with nearly notemperature dependence,249,250,256 which would be the expectedbehavior if water behaves as a “fragile” liquid in this temperatureregime. However, additional information obtained from hyper-quenching experiments using micrometer-sized water dropletscan be used to place upper and lower limits on the maximumnucleation rate99,206−209 at temperatures further into no-man’sland. These limits can be defined based on the observation thatessentially all droplets crystallize in huge ensembles of droplets of3 μm in diameter, when they are cooled at 104 K/s, whereascrystallization was not detected when cooled at 107 K/s throughthe 70 K broad no-man’s land.99,206−209 These limits are includedin Figure 15.Finally, the crystallization rate has also been measured in the
temperature range between 122 and 143 K using thin films ofamorphous ice created by vapor deposition. Jenniskens andBlake251 obtained J ranging from 4 × 10¹² to 7 × 1014 cm−3 s−1
between 122 and 140 K, respectively, in support of waterbehaving as a “strong” liquid around the glass transitiontemperature of 136 K96,98,258 and in agreement with dielectricrelaxation and calorimetric measurements.78 In contrast, SafarikandMullins252 obtained much lower values of J ranging from 3 ×10⁷ to 2 × 1011 cm−3 s−1 between 134 and 142 K. Thesemeasurements are clearly inconsistent with each other and maybe affected by the growth rate that limits the crystallization rate atthese temperatures and therefore renders it difficult to obtain J.The nucleation rate in hyperquenched microdroplets asextracted from the data of Hage et al.253,254 is even more than10 orders of magnitude smaller than the rates extracted from thethin film measurements. Thus, it remains a challenge todistinguish between crystal growth in preseeded amorphous icefrom nucleation in seed-free amorphous ice.Results for the TIP4P/2005 model of water are shown in
Figure 16. The agreement with experiment is good. From thecomputer simulation, it has been estimated thatK* is of the orderof 1031 cm−3 s−1 at 235 K and γsl of about 29mN/m at themeltingpoint (decreasing with temperature). At moderate supercooling,the growth rate of ice, u, is fast, so that the limiting step forcrystallizing a certain fraction of the sample ϕ into ice is the time,τν, required for the formation of a critical cluster. However, at lowT, u is small259 and the time τx required to crystallize a certainfraction ϕ of the sample provides an important measure.According to Avrami’s equation2,260 this time depends on J and uas τx ∝ (Ju3)−1/4. Since J increases while u decreases as thetemperature becomes lower, the time scale τx has a minimum.The existence of this minimum has been obtained from bruteforce simulations for the mWmodel of water.135 It has also beenestimated for the TIP4P/2005 model for which results arepresented in Figure 17. For this model τx reaches a value of about10 μs at the minimum. To avoid crystallization one must cross
the 50 K region around this minimum at least 10 times faster,which means that the cooling rate must be about 50 K/(1 μs) = 5× 10⁷ K/s. This estimate is in reasonable agreement with theexperimental finding that to form water in the glassy state (thusavoiding crystallization) the liquid phase must be cooled at rateshigher than 106−107 K/s99 and is also consistent with themaximum J in no-man’s land discussed in connection with Figure15.Obviously, water is not an easy glass former as one requires
high cooling rates to form the glass (i.e., amorphous water). Incomputer simulations it has been found that certain responsefunctions (as compressibility, heat capacity) reach a maximumwhen the liquid is cooled at constant pressure. For TIP4P/2005(at 1 bar) a maximum in the isothermal compressibility has beenfound27,257,261,262 at 232 K, indicating crossing of theWidom line(see the definition and discussion about the Widom line in waterin section 6). Results for this maximum are given in Figure 18,where it is shown that the results of several groups are in
Figure 16. Nucleation rate J as determined for the TIP4P/2005 model(blue solid line) compared to experiments (filled squares) ofPruppacher,255 Murray et al.,246 and Manka et al.256 Experimentalresults from Laksmono et al.248 (filled circles) and Hagen et al.247 (filledtriangles) were also included. The horizontal line corresponds to log10 J(cm−3 s−1) = 8, which is the approximate value of J at the homogeneousnucleation temperature in experiments (i.e., about 38 K below themelting point). Figure adapted with permission from ref 235. Copyright2014 American Institute of Physics.
Figure 17. τx for ϕ = 0.7 for the TIP4P/2005 model as a function of thesupercooling. τx is the time necessary to crystallize 70% of the system inan infinitely large system (blue line). (Inset) Plot of the nucleation time,τν, versus the supercooling for systems having different numbers, N, ofmolecules of water. Figure reproduced with permission from ref 235.Copyright 2014 American Institute of Physics.
Chemical Reviews Review
DOI: 10.1021/acs.chemrev.5b00750Chem. Rev. 2016, 116, 7463−7500
7477

agreement. As discussed above, for this model Wikfeldt et al.220
evaluated the amount of HDL and LDL as a function of T atroom pressure with assignment based on the inherent structure.At 232 K, the populations of the two species cross. An issue withsimulations at low temperatures is equilibration, and it has beensuggested that this maximum may be due to transient icecoarsening.44 However, as can be seen in Figure 16, the value of Jat 232 K and 1 bar (where the maximum in compressibilityoccurs and 20 K below the melting point of the model) is terriblysmall (i.e., 10−70 cm−3s−1) so that no ice formation is observed inthe simulations; see also the discussion in section 3. In fact, a keyquestion concerning the possible existence of a liquid−liquid
critical point in supercooled water23,117,119 (and/or the existenceof a Widom line in response functions) is if the liquid can beequilibrated before it freezes. Limmer and Chandler43 pointedout that a relevant magnitude is the ratio between τx and τe (i.e.,the time required to equilibrate the system). If this ratio is large/small, the system can/cannot be equilibrated before it freezes. Itis also important to point out that both τx and τe may depend onthe system size.263 For the mW model the maximum in thecompressibility at ambient pressure cannot be reached sincewater freezes first. This is a clear case where the ratio of τx to τe isclose to one and one cannot observe some of the water anomaliesbecause water simply freezes first. However, for TIP4P/2005water at room pressure this seems not to be the case, and themaximum in compressibility occurs without any indication of iceformation. It would be of interest to analyze this ratio at higherpressures. The fact that two different water models behavedifferently means that “chemistry matters” and one cannot expectuniversal behavior for all water models. Thus, it is difficult toestablish definite conclusions. Further studies both fromexperiment and from simulations determining both equilibrationand nucleation times in droplets between the nanometer and themicrometer scale would be very useful to clarify the value of theratio between τx and τe in real water.
5.1. Local Structural Ordering in Water Has an Impact on IceNucleation
Structural ordering in water involves both translational andorientational ordering, reflecting the nature of hydrogen bondingthat selects not only distance but also orientation. It has beenproposed that the local structural ordering in water controls notonly water’s anomalies but also ice nucleation and that thisfeature may be generic to so-called water-type liquids.35,36
Figure 18. Isothermal compressibility of TIP4P/2005 water at 1 (blue),70 (green), and 1200 bar (red) as a function of temperature. Symbolsindicate the simulated values: squares (with error bars) obtained byBresme et al.257 and circles (without error bars) obtained previously byAbascal and Vega.27 Curves represent values calculated from the two-structure equation of state. Figure reproduced with permission from ref257. Copyright 2014 American Institute of Physics.
Figure 19. (Top) Crystal planes for the stable phases and ice 0. (Bottom left) Distribution of the average angle ⟨cos θ⟩ between the dipole moment of amolecule and its hydrogen-bonded neighbors for TIP4P/2005 water at T = 200 K and P = 1 bar in the liquid phase and the ice Ic, Ih, and ice 0 phases.(Bottom right) The same as in the left panel but for second-nearest neighbors. Adapted from ref 242. Copyright 2014 Macmillan Publishers Limited.
Chemical Reviews Review
DOI: 10.1021/acs.chemrev.5b00750Chem. Rev. 2016, 116, 7463−7500
7478

An analysis of locally favored structures in simulated waterreveals that a large fraction of second-nearest neighborsparticipates in five-membered rings of hydrogen-bondedmolecules and that this fraction increases with decreasingtemperature and pressure. These five-membered rings, beingabsent in the stable crystalline phases of ice (the cubic andhexagonal polytypes), have been proposed to be responsible forthe long lifetime of the locally favored states36,157 and to act as asource of frustration against crystallization to ice I.216,242 As thetemperature decreases, the lifetime of hydrogen bonds increasesand the opening of five-membered rings to form six-memberedrings becomes increasingly rare. This can partly explain whywater has such a large metastability gap, in which, in the absenceof impurities, it can persist in its liquid form down to 40 degrees(°C or K) below the melting temperature.Work by Molinero and collaborators has shown that
homogeneous crystal nucleation starts from tetrahedrallyordered regions inside the liquid phase.135 In the language oftwo-state models, crystallization should thus be initiated fromlocally favored structures, which already have the full transla-tional symmetry of the crystal up to the second shell. Theselocally favored structures have long lifetimes at supercooledconditions due to the inclusion of five-membered rings ofhydrogen-bonded molecules, which severely constrains theorientational degrees of freedom of the involved water moleculesand thus stops the development of the orientational ordernecessary to trigger the liquid-to-ice I transition. The differencesin local structure between the supercooled liquid phase and theice I phase can be measured with quantities such as the dipole−dipole spatial correlation or the topology of hydrogen-bondloops (see Figure 19).To overcome frustration effects, the pathway to crystallization
can occur through intermediate steps, in line with Ostwald’sempirical step rule of phases264 (see, e.g., ref 265 for a theoreticalbasis in terms of minimum entropy production). In fact, in manymolecular and soft-matter systems, crystallization does not occurdirectly into the stable crystalline phase but instead involves oneor more intermediate steps where the melt crystallizes first inmetastable phases.264 These metastable crystals are structurallymore similar to the melt than to the stable phase. This structuralsimilarity leads to a significant reduction of the interfacial energy,although the bulk free energy of metastable states is onlyintermediate between the one of the melt and that of the stablephase.The idea of two-step water crystallization involving a
metastable phase was recently put forward in ref 242. Theauthors identified a novel metastable phase, called ice 0, with atetragonal unit cell with 12 molecules, the thermodynamic andstructural properties of which are intermediate between the meltand the solid crystalline phase. This is shown in Figure 19, wherethe average dipole−dipole orientation is computed betweenmolecules which are first neighbors (bottom left) and second-nearest neighbors (bottom right). The angle distribution is verysimilar between the supercooled phase and ice 0, in contrast withthe distributions of both the hexagonal and the cubic ice forms.Moreover, ice 0 is rich in five-membered rings, which are alsovery common within the locally favored structures wherecrystallization first originates.The structural similarity between supercooled water and the
metastable ice 0 form plays an important role in homogeneousice nucleation. According to Ostwald’s step rule of phases, first asmall nucleus of the metastable phase should form, which laterconverts to the stable ice I form. It is thus natural to expect that
close to the homogeneous nucleation line, where the size of thecritical nucleus is negligible, the rate of ice nucleation should becontrolled by the thermodynamic properties of ice 0. Reference242 has indeed shown that the homogeneous nucleation line forthe mW model of water coincides with a line of constantthermodynamic driving force with respect to ice 0 (i.e., thehomogeneous nucleation line is the locus of constant chemicalpotential difference between the melt and ice 0). This scenariowas confirmed both by direct simulations and by computation ofthe nucleation rates of ice.In Figure 20 the phase diagram of mW water is reported, with
dots representing the locus of homogeneous nucleation and the
dashed line that of constant driving force with respect to ice 0.This suggests that it is possible to derive the homogeneousnucleation line from purely thermodynamic arguments.Furthermore, by adopting translational order of the secondshell as the order parameter, it is possible to describe the phasebehavior of liquid water to a good approximation from purelymicroscopic information.Locally favored states are stabilized by five-membered rings of
hydrogen-bonded molecules, which act as a source of frustrationagainst crystallization to ice I. This dynamical pathway reflects inthe crystallization transition, in which the metastable crystallinephase can play an important role. In particular, there is evidencethat a novel metastable phase, ice 0, being structurally similar tothe supercooled melt, can act as an intermediate step duringcrystallization. Water would first transform into small nuclei ofthis phase that then grow into the stable crystalline phases.According to this scenario, the homogeneous nucleation linewould then be controlled by the thermodynamic properties of ice0.
Figure 20. (Top) Snapshot of two configurations with the birth of asmall crystalline nucleus (left) and a section of a nucleus of critical size(right). The color code is yellow for ice Ic, green for ice Ih, and magentafor ice 0. (Bottom) P−T phase diagram of mW water. Continuous linesindicate coexistence between the liquid phase and different crystalstructures: ice Ih/Ic (blue), ice 0 (red), and clathrate CS-II (green).Dashed lines indicate constant chemical potential differences betweenthe liquid and ice Ih/Ic (βΔμ = −0.721, in blue) and the liquid and ice 0(βΔμ = −0.365, in red). The green dashed-dotted line is the Ic/CS-IIcoexistence line. Red open circles indicate state points wherehomogeneous nucleation is observed in simulations. Adapted from ref242. Copyright 2014 Macmillan Publishers Limited.
Chemical Reviews Review
DOI: 10.1021/acs.chemrev.5b00750Chem. Rev. 2016, 116, 7463−7500
7479
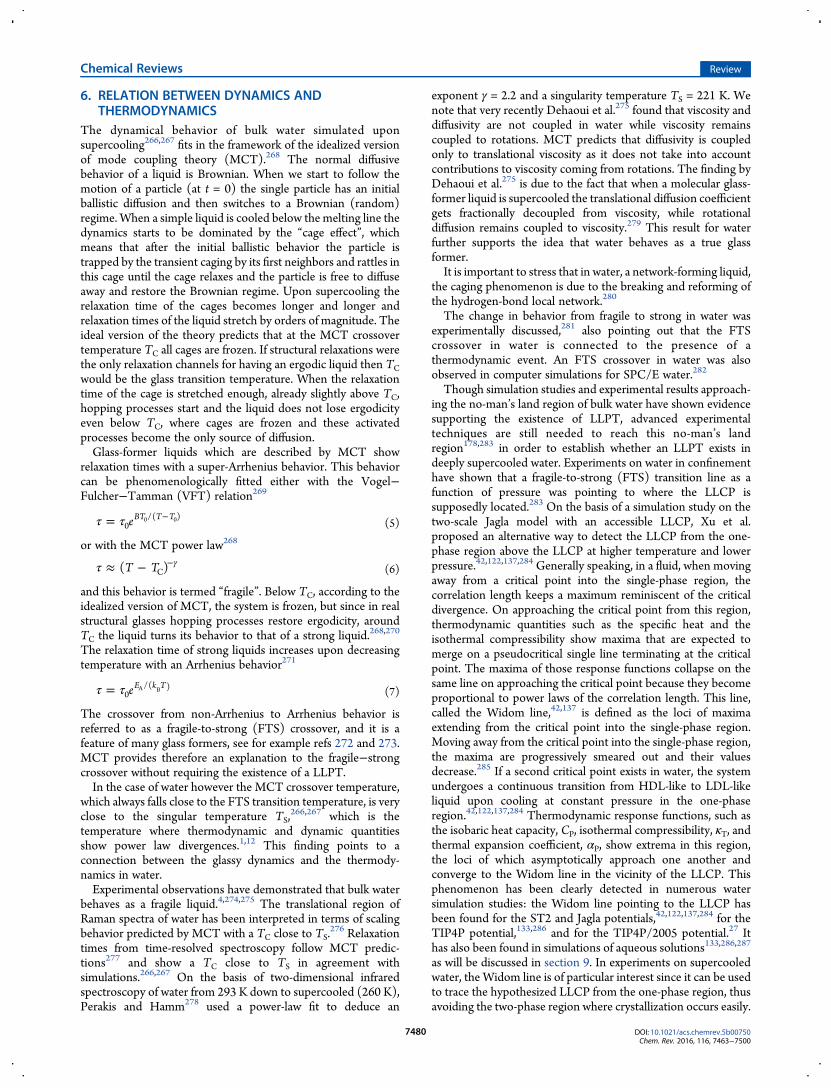
6. RELATION BETWEEN DYNAMICS ANDTHERMODYNAMICS
The dynamical behavior of bulk water simulated uponsupercooling266,267 fits in the framework of the idealized versionof mode coupling theory (MCT).268 The normal diffusivebehavior of a liquid is Brownian. When we start to follow themotion of a particle (at t = 0) the single particle has an initialballistic diffusion and then switches to a Brownian (random)regime.When a simple liquid is cooled below the melting line thedynamics starts to be dominated by the “cage effect”, whichmeans that after the initial ballistic behavior the particle istrapped by the transient caging by its first neighbors and rattles inthis cage until the cage relaxes and the particle is free to diffuseaway and restore the Brownian regime. Upon supercooling therelaxation time of the cages becomes longer and longer andrelaxation times of the liquid stretch by orders of magnitude. Theideal version of the theory predicts that at the MCT crossovertemperature TC all cages are frozen. If structural relaxations werethe only relaxation channels for having an ergodic liquid then TCwould be the glass transition temperature. When the relaxationtime of the cage is stretched enough, already slightly above TC,hopping processes start and the liquid does not lose ergodicityeven below TC, where cages are frozen and these activatedprocesses become the only source of diffusion.Glass-former liquids which are described by MCT show
relaxation times with a super-Arrhenius behavior. This behaviorcan be phenomenologically fitted either with the Vogel−Fulcher−Tamman (VFT) relation269
τ τ= −eBT T T0
/( )0 0 (5)
or with the MCT power law268
τ ≈ − γ−T T( )C (6)
and this behavior is termed “fragile”. Below TC, according to theidealized version of MCT, the system is frozen, but since in realstructural glasses hopping processes restore ergodicity, aroundTC the liquid turns its behavior to that of a strong liquid.268,270
The relaxation time of strong liquids increases upon decreasingtemperature with an Arrhenius behavior271
τ τ= eE k T0
/( )A B (7)
The crossover from non-Arrhenius to Arrhenius behavior isreferred to as a fragile-to-strong (FTS) crossover, and it is afeature of many glass formers, see for example refs 272 and 273.MCT provides therefore an explanation to the fragile−strongcrossover without requiring the existence of a LLPT.In the case of water however the MCT crossover temperature,
which always falls close to the FTS transition temperature, is veryclose to the singular temperature TS,
266,267 which is thetemperature where thermodynamic and dynamic quantitiesshow power law divergences.1,12 This finding points to aconnection between the glassy dynamics and the thermody-namics in water.Experimental observations have demonstrated that bulk water
behaves as a fragile liquid.4,274,275 The translational region ofRaman spectra of water has been interpreted in terms of scalingbehavior predicted by MCT with a TC close to TS.
276 Relaxationtimes from time-resolved spectroscopy follow MCT predic-tions277 and show a TC close to TS in agreement withsimulations.266,267 On the basis of two-dimensional infraredspectroscopy of water from 293 K down to supercooled (260 K),Perakis and Hamm278 used a power-law fit to deduce an
exponent γ = 2.2 and a singularity temperature TS = 221 K. Wenote that very recently Dehaoui et al.275 found that viscosity anddiffusivity are not coupled in water while viscosity remainscoupled to rotations. MCT predicts that diffusivity is coupledonly to translational viscosity as it does not take into accountcontributions to viscosity coming from rotations. The finding byDehaoui et al.275 is due to the fact that when a molecular glass-former liquid is supercooled the translational diffusion coefficientgets fractionally decoupled from viscosity, while rotationaldiffusion remains coupled to viscosity.279 This result for waterfurther supports the idea that water behaves as a true glassformer.It is important to stress that in water, a network-forming liquid,
the caging phenomenon is due to the breaking and reforming ofthe hydrogen-bond local network.280
The change in behavior from fragile to strong in water wasexperimentally discussed,281 also pointing out that the FTScrossover in water is connected to the presence of athermodynamic event. An FTS crossover in water was alsoobserved in computer simulations for SPC/E water.282
Though simulation studies and experimental results approach-ing the no-man’s land region of bulk water have shown evidencesupporting the existence of LLPT, advanced experimentaltechniques are still needed to reach this no-man’s landregion178,283 in order to establish whether an LLPT exists indeeply supercooled water. Experiments on water in confinementhave shown that a fragile-to-strong (FTS) transition line as afunction of pressure was pointing to where the LLCP issupposedly located.283 On the basis of a simulation study on thetwo-scale Jagla model with an accessible LLCP, Xu et al.proposed an alternative way to detect the LLCP from the one-phase region above the LLCP at higher temperature and lowerpressure.42,122,137,284 Generally speaking, in a fluid, when movingaway from a critical point into the single-phase region, thecorrelation length keeps a maximum reminiscent of the criticaldivergence. On approaching the critical point from this region,thermodynamic quantities such as the specific heat and theisothermal compressibility show maxima that are expected tomerge on a pseudocritical single line terminating at the criticalpoint. The maxima of those response functions collapse on thesame line on approaching the critical point because they becomeproportional to power laws of the correlation length. This line,called the Widom line,42,137 is defined as the loci of maximaextending from the critical point into the single-phase region.Moving away from the critical point into the single-phase region,the maxima are progressively smeared out and their valuesdecrease.285 If a second critical point exists in water, the systemundergoes a continuous transition from HDL-like to LDL-likeliquid upon cooling at constant pressure in the one-phaseregion.42,122,137,284 Thermodynamic response functions, such asthe isobaric heat capacity, CP, isothermal compressibility, κT, andthermal expansion coefficient, αP, show extrema in this region,the loci of which asymptotically approach one another andconverge to the Widom line in the vicinity of the LLCP. Thisphenomenon has been clearly detected in numerous watersimulation studies: the Widom line pointing to the LLCP hasbeen found for the ST2 and Jagla potentials,42,122,137,284 for theTIP4P potential,133,286 and for the TIP4P/2005 potential.27 Ithas also been found in simulations of aqueous solutions133,286,287
as will be discussed in section 9. In experiments on supercooledwater, the Widom line is of particular interest since it can be usedto trace the hypothesized LLCP from the one-phase region, thusavoiding the two-phase region where crystallization occurs easily.
Chemical Reviews Review
DOI: 10.1021/acs.chemrev.5b00750Chem. Rev. 2016, 116, 7463−7500
7480
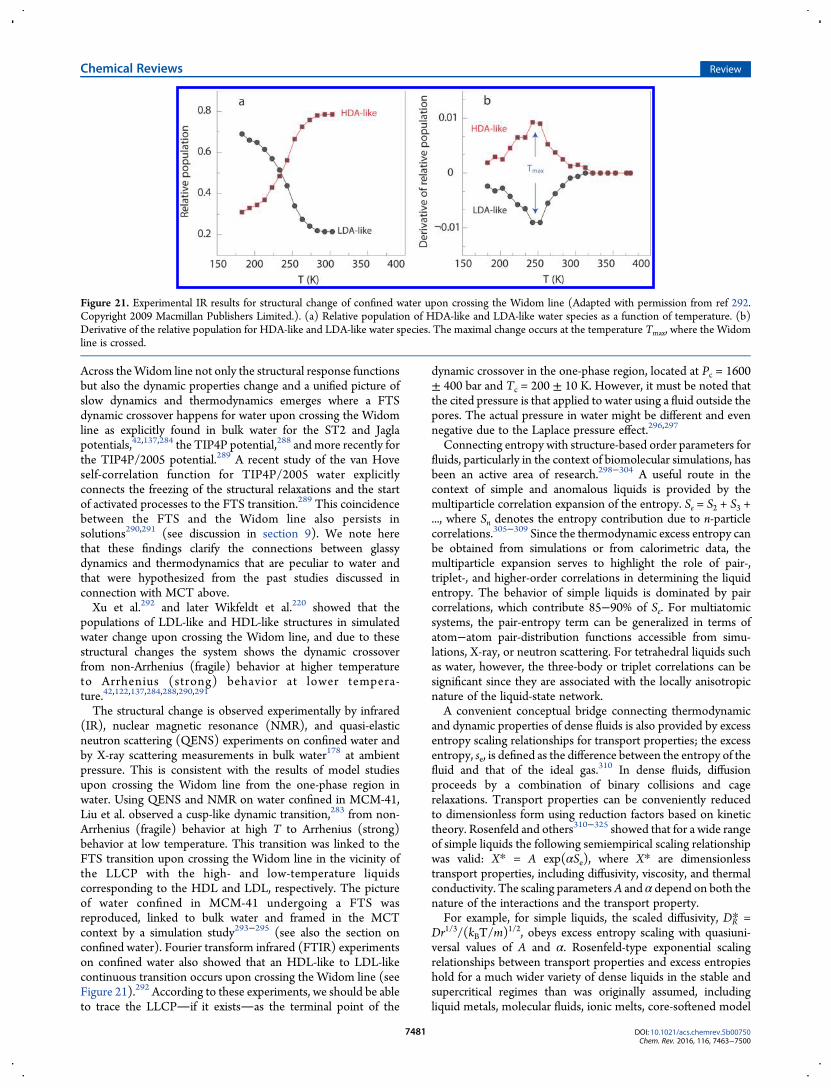
Across theWidom line not only the structural response functionsbut also the dynamic properties change and a unified picture ofslow dynamics and thermodynamics emerges where a FTSdynamic crossover happens for water upon crossing the Widomline as explicitly found in bulk water for the ST2 and Jaglapotentials,42,137,284 the TIP4P potential,288 and more recently forthe TIP4P/2005 potential.289 A recent study of the van Hoveself-correlation function for TIP4P/2005 water explicitlyconnects the freezing of the structural relaxations and the startof activated processes to the FTS transition.289 This coincidencebetween the FTS and the Widom line also persists insolutions290,291 (see discussion in section 9). We note herethat these findings clarify the connections between glassydynamics and thermodynamics that are peculiar to water andthat were hypothesized from the past studies discussed inconnection with MCT above.Xu et al.292 and later Wikfeldt et al.220 showed that the
populations of LDL-like and HDL-like structures in simulatedwater change upon crossing the Widom line, and due to thesestructural changes the system shows the dynamic crossoverfrom non-Arrhenius (fragile) behavior at higher temperatureto Arrhenius (strong) behavior at lower tempera-ture.42,122,137,284,288,290,291
The structural change is observed experimentally by infrared(IR), nuclear magnetic resonance (NMR), and quasi-elasticneutron scattering (QENS) experiments on confined water andby X-ray scattering measurements in bulk water178 at ambientpressure. This is consistent with the results of model studiesupon crossing the Widom line from the one-phase region inwater. Using QENS and NMR on water confined in MCM-41,Liu et al. observed a cusp-like dynamic transition,283 from non-Arrhenius (fragile) behavior at high T to Arrhenius (strong)behavior at low temperature. This transition was linked to theFTS transition upon crossing the Widom line in the vicinity ofthe LLCP with the high- and low-temperature liquidscorresponding to the HDL and LDL, respectively. The pictureof water confined in MCM-41 undergoing a FTS wasreproduced, linked to bulk water and framed in the MCTcontext by a simulation study293−295 (see also the section onconfined water). Fourier transform infrared (FTIR) experimentson confined water also showed that an HDL-like to LDL-likecontinuous transition occurs upon crossing the Widom line (seeFigure 21).292 According to these experiments, we should be ableto trace the LLCPif it existsas the terminal point of the
dynamic crossover in the one-phase region, located at Pc = 1600± 400 bar and Tc = 200 ± 10 K. However, it must be noted thatthe cited pressure is that applied to water using a fluid outside thepores. The actual pressure in water might be different and evennegative due to the Laplace pressure effect.296,297
Connecting entropy with structure-based order parameters forfluids, particularly in the context of biomolecular simulations, hasbeen an active area of research.298−304 A useful route in thecontext of simple and anomalous liquids is provided by themultiparticle correlation expansion of the entropy. Se = S2 + S3 +..., where Sn denotes the entropy contribution due to n-particlecorrelations.305−309 Since the thermodynamic excess entropy canbe obtained from simulations or from calorimetric data, themultiparticle expansion serves to highlight the role of pair-,triplet-, and higher-order correlations in determining the liquidentropy. The behavior of simple liquids is dominated by paircorrelations, which contribute 85−90% of Se. For multiatomicsystems, the pair-entropy term can be generalized in terms ofatom−atom pair-distribution functions accessible from simu-lations, X-ray, or neutron scattering. For tetrahedral liquids suchas water, however, the three-body or triplet correlations can besignificant since they are associated with the locally anisotropicnature of the liquid-state network.A convenient conceptual bridge connecting thermodynamic
and dynamic properties of dense fluids is also provided by excessentropy scaling relationships for transport properties; the excessentropy, se, is defined as the difference between the entropy of thefluid and that of the ideal gas.310 In dense fluids, diffusionproceeds by a combination of binary collisions and cagerelaxations. Transport properties can be conveniently reducedto dimensionless form using reduction factors based on kinetictheory. Rosenfeld and others310−325 showed that for a wide rangeof simple liquids the following semiempirical scaling relationshipwas valid: X* = A exp(αSe), where X* are dimensionlesstransport properties, including diffusivity, viscosity, and thermalconductivity. The scaling parametersA and α depend on both thenature of the interactions and the transport property.For example, for simple liquids, the scaled diffusivity, DR* =
Dr1/3/(kBT/m)1/2, obeys excess entropy scaling with quasiuni-
versal values of A and α. Rosenfeld-type exponential scalingrelationships between transport properties and excess entropieshold for a much wider variety of dense liquids in the stable andsupercritical regimes than was originally assumed, includingliquid metals, molecular fluids, ionic melts, core-softened model
Figure 21. Experimental IR results for structural change of confined water upon crossing the Widom line (Adapted with permission from ref 292.Copyright 2009 Macmillan Publishers Limited.). (a) Relative population of HDA-like and LDA-like water species as a function of temperature. (b)Derivative of the relative population for HDA-like and LDA-like water species. The maximal change occurs at the temperature Tmax, where the Widomline is crossed.
Chemical Reviews Review
DOI: 10.1021/acs.chemrev.5b00750Chem. Rev. 2016, 116, 7463−7500
7481

fluids, chain fluids, room-temperature ionic liquids, and colloidalfluids, even though the exact scaling parameters may varysubstantially. Deviations from Rosenfeld-scaling behavior arise asa consequence of cooperative effects, but for a large number offluids, transport properties from a wide range of state points scalewith the excess entropy.Stanley and co-workers326 used the TIP5P water model to
investigate the relationship between the excess entropy andanomalies of water. They report that the two-body excessentropy reliably predicts the regions of structural, dynamic, andthermodynamic anomalies of the model as well as the location ofthe Widom line. Given the idea behind Rosenfeld scaling, Galloand co-workers327,328 have shown in a recent study on TIP4Pwater that if se is approximated with s2, i.e., the two-body term ofthe excess entropy, the same FTS transition of the diffusioncoefficient is found for s2. The two-body approximation for semight not be valid in all contexts of interest but theaforementioned simulation studies indicate that the two-bodyterm shows the FTS crossover and therefore captures thefeatures of water behavior also in the high-density side. It wouldbe very important to test this result from experimentallymeasured radial distribution functions of water upon super-cooling. The relation between s2 and the radial distributionfunction is in fact straightforward, and for a one-component fluidit is
∫πρ≈ = − − −s s k g r g r g r r r2 { ( )ln[ ( )] [ ( ) 1]} de 2 B2
(8)
where g(r) for water is the oxygen−oxygen g(r).Stillinger−Weber liquids with a variable tetrahedrality
parameter can be used to model molten phases of Group 14elements (C, Si, Ge, Sn, Pb) as well as provide a coarse-grained,monatomic (mW) model for water.135,147,329−332 As a functionof increasing tetrahedrality, the triplet contribution to the excessentropy is significantly higher than the pair-entropy contribu-tion.333 Transformation to a triplet-dominated fluid stronglyfavors the formation of a tetrahedral crystal as well as theexistence of a heat capacity anomaly, and the local order withinthe first neighbor shell is a critical factor in determining thebehavior upon supercooling. The characteristic rise in heatcapacity on the isobaric cooling of tetrahedral liquids is closelytracked by the pair and triplet contributions to the entropy (seeFigure 22) and thus provides a direct connection betweenstructural correlations and thermodynamics. Preliminary resultsfor triplet O−O−O correlations in pair-additive, rigid-body,atomistic models of water strongly resemble the mW watermodel.334
We note that the phenomenon of theWidom line is of interestalso in the supercritical state, i.e., in the one-phase region abovethe well-known liquid−gas critical point both in water335 and inother liquids.144,336,337 In supercritical water the Widom line isclearly found both in experiments and in simulations.335,338 Adynamic crossover passing through theWidom line has also beenshown to exist in the supercritical state of water where changes intrends in diffusion coefficient and viscosity have been observedupon crossing this line on isobaric paths.335,338 Similarly,Simeoni and co-workers336 studied supercritical argon andfound a dynamical crossover associated with the Widom linewhich divided the single-phase region beyond the critical pointinto liquid-like and gas-like in terms of the dynamical properties.Finally, we note that there is yet another approach to make a
link between structure and dynamics on the basis of a two-order-
parameter model.36,339 In this approach, it is assumed that locallyfavored structures have a higher activation energy than thenormal liquid structures. Then the total activation energy is givenby their average. In this way, the dynamic anomaly can bedescribed by the same order parameter used for explaining thethermodynamic anomaly.We will discuss further the fragile to strong transition in water
and the connection between dynamics and thermodynamics insections 8 and 9.
7. STRETCHED WATERBecause ice nucleation prevents conventional techniques fromreaching the low-temperature region where a liquid−liquidtransition or its signature might be observed, researchers haveattempted to follow other routes. These attempts will bediscussed in the following sections: bulk water at negativepressure (this section), confined water (section 8), and aqueoussolutions (section 9).Water, like any liquid, can resist mechanical traction and
become metastable with respect to its vapor.2 We will not be ableto claim that we understand the “most anomalous liquid”properly until we have learned to measure and understand theproperties of water and its solutions accurately also in thenegative-pressure domain. In particular, the behavior of the lineof density maxima (LDM) at negative pressure can helpdiscriminate between the proposed theoretical scenarios,depending on whether when the pressure decreases the LDMreaches a maximum temperature or its temperature keepsincreasing (see Figure 3). Moreover, a region exists, at negativepressure and temperatures below the melting point of ice, wherewater is doubly metastable with respect to both ice and vapor. Isit possible to observe the Widom line (or one of the lines ofmaxima in a thermodynamic response function) in the doublymetastable region? A comparison between the experimental lineof homogeneous nucleation of ice and simulations with theTIP4P/2005 potential (Figure 23) suggests that it might bepossible.47,297
Before describing experiments on water at negative pressure,we discuss the pressure of the LLCP found in simulations: couldit actually be located at negative pressure? This possibility wasfirst suggested by Hideki Tanaka. Simulating the TIP4P modelalong the 0.1 MPa isobar, he found a large change in density andpotential energy around 213 K,341 which he interpreted as the
Figure 22. Multiparticle correlation. Contributions to the entropy andthe heat capacity anomaly. The total (CP), pair (C2), and triplet (C3)contributions as a function of temperature (T) for the monatomic water(mW) model at 1 atm pressure. Reproduced with permission from ref333. Copyright 2014 American Institute of Physics.
Chemical Reviews Review
DOI: 10.1021/acs.chemrev.5b00750Chem. Rev. 2016, 116, 7463−7500
7482

signature of a first-order transition between two liquid phases.The large changes were confirmed by simulations at +200 MPa,whereas they disappeared at −200 MPa,342 from which it wasconcluded that the LLCP pressure should be between −200 and0.1 MPa. However, Sciortino et al.30 later found thisinterpretation to be incorrect. They noted that a first-ordertransition should manifest itself as a van der Waals loop in asimulated P−V isotherm, which is not seen down to 200 K withthe TIP4P model. The large changes mentioned above are ratherdue to aWidom line. Locating the line of compressibility maximaalong isobars for TIP4P, Sciortino et al. concluded that if a LLCPexists for TIP4P, it should be at T < 200 K and P > 70 MPa. Thelocation of the LLCP was later refined to 190 K and 150 MPa.133
Other reports of LLCP at negative pressure were made byBrovchenko et al., who performed restricted ensemble MonteCarlo simulations of the isotherms of homogenized systems andphase equilibria simulations in the Gibbs ensemble. Using simpletruncation of electrostatic interactions, they found three liquid−liquid transitions in ST283 and two transitions in the TIP4P,TIP5P, and SPCEmodels.84 Among these transitions, one was atnegative pressure for ST2, TIP4P, and SPCE. When the long-range Coulombic forces were treated with reaction field, twotransitions at positive pressure were found in ST2.84 Thesestudies were however seriously questioned by Liu et al.87 All thetechnical details mentioned here have their importance, as onlyone liquid−liquid transition was found by Liu et al.87 for ST2using histogram-reweighting Monte Carlo simulations in the
grand-canonical ensemble with Ewald summation treatment oflong-range electrostatic interactions. Table 1 also shows how thelocation of the LLCP depends on the technical details of thesimulations. Still there is now consensus that for all realisticmodels of water there is no more than one LLCP at positivepressure. What about real water? At present there is no directexperimental evidence for a LLCP. However, under theassumption that it exists, it is interesting to investigate wherethe available data for real water would locate the LLCP. This isthe logic followed by Holten and Anisimov.39 In their two-statemodel (see section 4) they treated the LLCP coordinates as afitting parameter to be optimized to reduce the deviationbetween model and experiment. They found that this deviationchanges only slightly in a narrow band in the P−T plane, whichcrosses zero pressure (see Figure 10). This prevents reaching afirm conclusion about the sign of the critical pressure and calls formore measurements on metastable water, including at negativepressure.Whereas negative pressures are routinely accessible in
simulations, experiments are notoriously difficult because asmall perturbation can trigger the rupture of the liquid bynucleation of a bubble (cavitation). The most documentedquantity is the largest negative pressure that could be reached.For water, all experimental techniques but one are limited to−30MPa.297,343,344 Negative-pressure studies seem to come intofocus about every 20 years. In 1950 Briggs345 reached −25 MPafor water (compared with−50MPa for mercury), while Winnickand Cho346 developed a clever centrifugal force method in 1971but were still unable to get beyond Briggs’ limit. Henderson andSpeedy’s outstanding works of 1987 were slightly ahead of thepattern. They reported the line of density maxima to −20.3MPa347 and the melting temperature of ice to−24 MPa.348 Theyboth lie on a natural extension of the positive-pressure data, butcavitation prevented following these properties to larger negativepressure.The 20 year cycle for negative pressure studies was restored in
1991 by Green et al.349 and Zheng et al.,350,351 who broke newground. They showed that with a microscopic version of theoriginal (1850) Berthelot tube approach unprecedentedtensions, in the vicinity of −150 MPa, could be reached beforetheir water-filled ≃5 by 15 μm dimension vesicles in quartzcrystals, cavitated. Since these tensions are close to the valuespredicted for the same temperature 40−47 °C by classicalnucleation theory nearly 70 years ago352 and quantitativelysupported by more recent theory,131,353 it appeared that a majorbarrier had been crossed.What was of high significance in these studies was the finding
of a tension maximum, identified by the erratic behavior at 40−47 °C of the vesicles in a preparation of density 0.91 g/cm3, andthe failure to cavitate at any temperature for inclusions of higherdensities. Different vesicles in the same sample which, at otherdensities would all behave in the same manner, would sometimescavitate during cooling but at different temperatures in the range40−47 °C and sometimes not at all. Any inclusion that survivedcavitation to 40 °C would never cavitate, making it clear that atension maximum, very close to the limiting tension for thatsample, had been traversed. This suggested the existence of adensity maximum at this low density. However, since thecavitation probability depends on a combination of negativepressure and surface tension, a more refined analysis is needed,see below. In the measurements of the 1990s era were also thefirst direct measurements of a physical property in the new high-tension range made available by the micro-Berthelot tube.
Figure 23. Pressure−temperature phase diagram of water. Reproducedwith permission from ref 297. Copyright 2015 Elsevier. Colored areasare used to identify the different possible states for liquid water. Themelting line of ice Ih is shown at positive pressure by a solid blue curveand its extrapolation to negative pressure by a dashed blue curve. Blackcrossed white squares show the experimental supercooling limit.340
They define the homogeneous nucleation line based on conventionalexperimental techniques (solid black curve), which is extrapolated hereto negative pressure (dashed black curve). Recent experiments using fastcooling techniques can shift the nucleation line to lower temperatures(new border, purple curves); they are displayed as white triangles256 andcircle.178 Isochores of TIP4P/2005 water for the two densities used in arecent experiment47 are shown by the thick red and black curves.Simulations of TIP4P/2005 water are performed to find the maximumof κT along several isobars (brown diamonds), defining the line ofmaxima in κT (brown curve), that might emanate from an LLCP (whiteplus symbol). Because the predictions of TIP4P/2005 are in satisfactoryagreement with the reported experimental results in the supercooledregion,261 this figure seems to indicate that the line of maxima in κT (andother extrema in the response functions) is not accessible toconventional experiments at positive pressure but might becomeaccessible to fast cooling techniques at positive pressure or toconventional techniques but in the doubly metastable region at negativepressure.
Chemical Reviews Review
DOI: 10.1021/acs.chemrev.5b00750Chem. Rev. 2016, 116, 7463−7500
7483

Alvarenga et al.354 showed it was possible, using micro-Brillouinscattering methods, to obtain the isochoric velocity of sound andhence the adiabatic compressibility along the isochore.After a further two decade lapse, a new set of experiments has
emerged since 2010 from the Caupin laboratory. Using anacoustic wave to stretch water, an experimental equation of statewas measured at ambient temperature to −26 MPa.355 It agreeswith the extrapolation of the recommended formulation of theequation of state measured at positive pressure.356,357 Later,using the same autoclaving method established by geo-chemists358 and used by Zheng et al.350 and Schmulovich etal.,359 El Mekki et al.360 obtained a perfectly formed vesicle withwhich they were able to study the statistics of cavitation in asingle vesicle as a function of temperature and thereby toestimate the temperature of the minimum energy barrier forcavitation, around 320 K. This must, however, be corrected forthe variation of surface tension with temperature in order tolocate the temperature of the tension maximum for the isochoreof the studied density, 0.922 g/cm3. The correction depends onthe model chosen to express the energy barrier for cavitation.Using classical nucleation theory with a Tolman lengthcorrection to the surface tension, the results are not inconsistentwith the extrapolation of the positive pressure equation ofstate,356,357 which is a temperature of density maximum near 296K at 0.922 g/cm3. Obviously more direct measurements wouldbe useful.Another line of research uses the fact that some of the water
inclusions are able to survive cooling without any bubblenucleation,47,350 which gives access to the doubly metastable
region. Revisiting the work of Alvarenga et al.,354 Pallares et al.recently measured the sound velocity in two doubly metastablesamples.47 An estimate of the path followed in the phase diagramis given in Figure 23. This study suggests that (i) theexperimental equation of state deviates from the extrapolationof positive pressure data at low temperature, (ii) the adiabaticcompressibility passes through a maximum when the temper-ature varies at constant density, and (iii) the sound velocity vsdensity at constant temperature becomes nonmonotonic at lowtemperature.These features are consistent both with the liquid−liquid
critical-point scenario23 and with the singularity-free interpreta-tion.31 It has also been suggested that the experiments might havefound the liquid−liquid transition;361 although not impossible,this does not seem likely.47 The sound velocity measurementswere recently analyzed362 to provide an experimental equation ofstate at large negative pressure. In particular, as the pressurebecomes more negative, the temperature of line of densitymaxima is found to increase monotonically to 17.8 C at −116MPa. Although the slope becomes more vertical in the pressure−temperature plane, the sample studied did not allow one todecide whether the LDM reaches a turning point as in the secondcritical point scenario (Figure 3B) or singularity-free scenarios(Figure 3D) or remains monotonic as in the stability limit(Figure 3A) or critical-point-free (Figure 3C) scenarios. Moremeasurements on water in the doubly metastable region wouldcertainly help to shed light on the origin of its anomalies.
Figure 24.Molecular dynamics simulations of water in MCM-41. In the picture we can see the difference between bound and free water which showdistinct dynamical behavior and the behavior of the relaxation time of free water that shows the FTS transition that coincides with the Widom line (notshown). Reproduced with permission from ref 293. Copyright 2010 American Chemical Society.
Chemical Reviews Review
DOI: 10.1021/acs.chemrev.5b00750Chem. Rev. 2016, 116, 7463−7500
7484
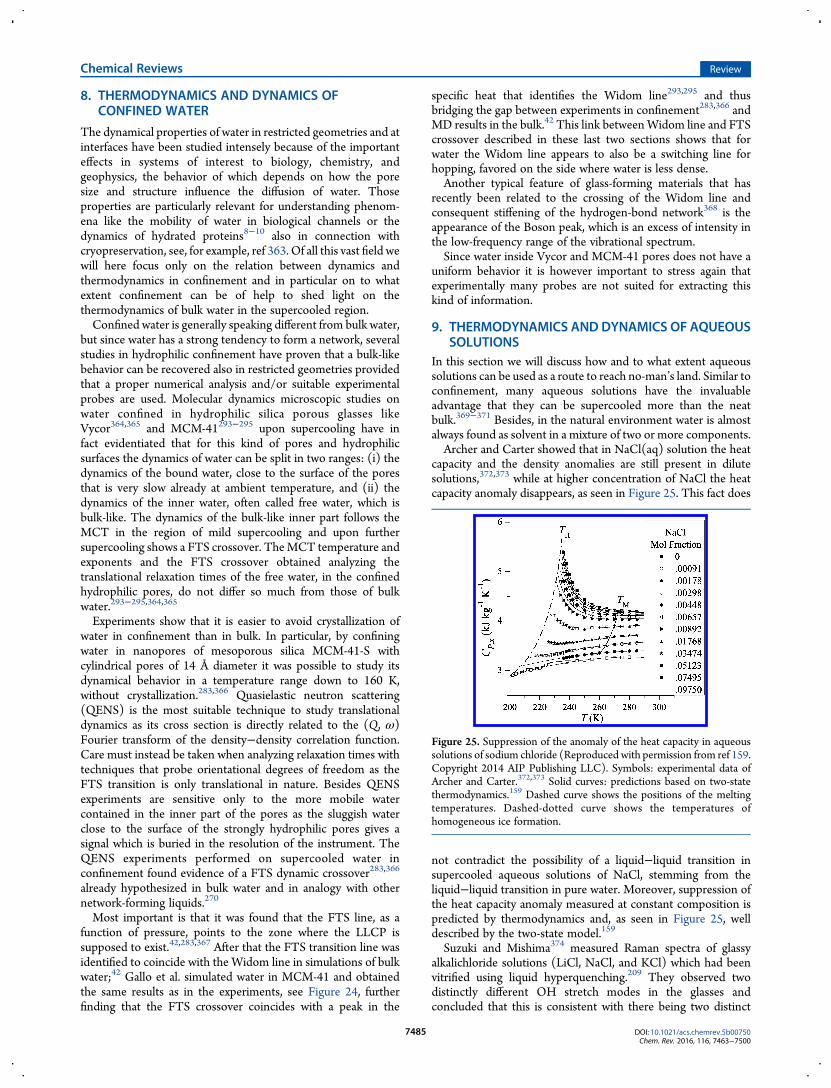
8. THERMODYNAMICS AND DYNAMICS OFCONFINED WATER
The dynamical properties of water in restricted geometries and atinterfaces have been studied intensely because of the importanteffects in systems of interest to biology, chemistry, andgeophysics, the behavior of which depends on how the poresize and structure influence the diffusion of water. Thoseproperties are particularly relevant for understanding phenom-ena like the mobility of water in biological channels or thedynamics of hydrated proteins8−10 also in connection withcryopreservation, see, for example, ref 363. Of all this vast field wewill here focus only on the relation between dynamics andthermodynamics in confinement and in particular on to whatextent confinement can be of help to shed light on thethermodynamics of bulk water in the supercooled region.Confined water is generally speaking different from bulk water,
but since water has a strong tendency to form a network, severalstudies in hydrophilic confinement have proven that a bulk-likebehavior can be recovered also in restricted geometries providedthat a proper numerical analysis and/or suitable experimentalprobes are used. Molecular dynamics microscopic studies onwater confined in hydrophilic silica porous glasses likeVycor364,365 and MCM-41293−295 upon supercooling have infact evidentiated that for this kind of pores and hydrophilicsurfaces the dynamics of water can be split in two ranges: (i) thedynamics of the bound water, close to the surface of the poresthat is very slow already at ambient temperature, and (ii) thedynamics of the inner water, often called free water, which isbulk-like. The dynamics of the bulk-like inner part follows theMCT in the region of mild supercooling and upon furthersupercooling shows a FTS crossover. TheMCT temperature andexponents and the FTS crossover obtained analyzing thetranslational relaxation times of the free water, in the confinedhydrophilic pores, do not differ so much from those of bulkwater.293−295,364,365
Experiments show that it is easier to avoid crystallization ofwater in confinement than in bulk. In particular, by confiningwater in nanopores of mesoporous silica MCM-41-S withcylindrical pores of 14 Å diameter it was possible to study itsdynamical behavior in a temperature range down to 160 K,without crystallization.283,366 Quasielastic neutron scattering(QENS) is the most suitable technique to study translationaldynamics as its cross section is directly related to the (Q, ω)Fourier transform of the density−density correlation function.Care must instead be taken when analyzing relaxation times withtechniques that probe orientational degrees of freedom as theFTS transition is only translational in nature. Besides QENSexperiments are sensitive only to the more mobile watercontained in the inner part of the pores as the sluggish waterclose to the surface of the strongly hydrophilic pores gives asignal which is buried in the resolution of the instrument. TheQENS experiments performed on supercooled water inconfinement found evidence of a FTS dynamic crossover283,366
already hypothesized in bulk water and in analogy with othernetwork-forming liquids.270
Most important is that it was found that the FTS line, as afunction of pressure, points to the zone where the LLCP issupposed to exist.42,283,367 After that the FTS transition line wasidentified to coincide with the Widom line in simulations of bulkwater;42 Gallo et al. simulated water in MCM-41 and obtainedthe same results as in the experiments, see Figure 24, furtherfinding that the FTS crossover coincides with a peak in the
specific heat that identifies the Widom line293,295 and thusbridging the gap between experiments in confinement283,366 andMD results in the bulk.42 This link betweenWidom line and FTScrossover described in these last two sections shows that forwater the Widom line appears to also be a switching line forhopping, favored on the side where water is less dense.Another typical feature of glass-forming materials that has
recently been related to the crossing of the Widom line andconsequent stiffening of the hydrogen-bond network368 is theappearance of the Boson peak, which is an excess of intensity inthe low-frequency range of the vibrational spectrum.Since water inside Vycor and MCM-41 pores does not have a
uniform behavior it is however important to stress again thatexperimentally many probes are not suited for extracting thiskind of information.
9. THERMODYNAMICS AND DYNAMICS OF AQUEOUSSOLUTIONS
In this section we will discuss how and to what extent aqueoussolutions can be used as a route to reach no-man’s land. Similar toconfinement, many aqueous solutions have the invaluableadvantage that they can be supercooled more than the neatbulk.369−371 Besides, in the natural environment water is almostalways found as solvent in a mixture of two or more components.Archer and Carter showed that in NaCl(aq) solution the heat
capacity and the density anomalies are still present in dilutesolutions,372,373 while at higher concentration of NaCl the heatcapacity anomaly disappears, as seen in Figure 25. This fact does
not contradict the possibility of a liquid−liquid transition insupercooled aqueous solutions of NaCl, stemming from theliquid−liquid transition in pure water. Moreover, suppression ofthe heat capacity anomaly measured at constant composition ispredicted by thermodynamics and, as seen in Figure 25, welldescribed by the two-state model.159
Suzuki and Mishima374 measured Raman spectra of glassyalkalichloride solutions (LiCl, NaCl, and KCl) which had beenvitrified using liquid hyperquenching.209 They observed twodistinctly different OH stretch modes in the glasses andconcluded that this is consistent with there being two distinct
Figure 25. Suppression of the anomaly of the heat capacity in aqueoussolutions of sodium chloride (Reproduced with permission from ref 159.Copyright 2014 AIP Publishing LLC). Symbols: experimental data ofArcher and Carter.372,373 Solid curves: predictions based on two-statethermodynamics.159 Dashed curve shows the positions of the meltingtemperatures. Dashed-dotted curve shows the temperatures ofhomogeneous ice formation.
Chemical Reviews Review
DOI: 10.1021/acs.chemrev.5b00750Chem. Rev. 2016, 116, 7463−7500
7485

glassy states in dilute solutions. Later Mishima performedexperiments on LiCl aqueous solutions where the observeddecompression-induced volumetric change of dilute LiClaqueous solution can be interpreted by the polyamorphicviewpoint about the solvent water and can be regarded as theexpected polyamorphic phase separation.375,376 This finding issupported by later experiments377 and by simulations.378,379
Kobayashi and Tanaka212,213 studied the glass-forming ability ofLiCl−water mixtures and found that it is maximized near theeutectic point. Furthermore, it was demonstrated that thedependence of the viscosity and the Raman spectra on saltconcentration can be explained by a simple two-state model.Chatterjee and Debenedetti studied the thermodynamics of
solvophobic aqueous-like solutions. In the presence of an LLCPfor the aqueous-like component, critical lines will stem from theLLCP of the pure substance upon increasing the solutecontent.380,381
Given this evidence, if an LLCP in water exists then it could befound with a properly tuned aqueous solution. Indeed, a LLCPwas claimed for the glycerol−water system by Suzuki andMishima at 0.12−0.15 mole fraction, 150 K, and 30−50 MPa.382
Murata and Tanaka also reported the observation of a liquid−liquid transition in supercooled aqueous solutions of glycerol383
and also in many other aqueous organic solutions.384 TheMurata/Tanaka interpretation has, however, been questioned forwater−glycerol mixtures and ice formation instead suggested asthe origin.382,385,386 However, in a very recent 2D-IR study twoliquid phases were reported as well as the ice phase and a liquid−liquid transition was suggested that was immediately followed byformation of small ice crystals.387
Corradini et al. studied withMD simulations NaCl dissolved inTIP4P water with concentrations ranging from c = 0.67 to 2.10mol/kg.133,286 The liquid−liquid critical point is present both inthe bulk and in solutions, and its position in the thermodynamicplane shifts to higher temperature and lower pressure uponadding salt. Comparison with available experimental data allowedproducing the phase diagrams of both bulk water and theaqueous solution as should be measurable in experiments asshown in Figure 26. Given the position of the liquid−liquidcritical point in solution as obtained in these simulations,experimental determination of the hypothesized liquid−liquidcritical point of water in aqueous solutions of salts appearspossible. For the experimental c = 0.67 mol/kg NaCl(aq) theLLCP is predicted to be at around Tc = 230 K and Pc = −120MPa. In NaCl(aq) with concentration c = 0.8 mol/kgexperiments have shown that rupture occurs at P = −140MPa.349 More recently, a series of aqueous solutions wasstudied359 and cavitation pressures beyond −100 MPa were alsoobserved. From refs 340 and 370 the homogeneous nucleationtemperature position can be estimated to be slightly below that ofthe LLCP of c = 0.67 mol/kg.Upon further adding salt (Figure 26) the LDL region shrinks
more and more as ions are more favorably solvated by the high-density liquid.379,388
To complete the picture of low-concentration solutions ofNaCl in water anMCT behavior and a FTS transition were foundupon supercooling and the FTS transition happens on crossingthe Widom line, see Figure 27, confirming also for theseelectrolyte solutions at low concentrations the link betweendynamics and thermodynamics found in the bulk.288,291 Theexcess entropy, approximated by the two-body terms extractedfrom MD simulations of NaCl(aq), shows the same FTStransition as the diffusion coefficient,327 and this means that from
a direct experimental measurement of the g(r) the FTS transitionshould be measurable also in solutions.Small angle X-ray scattering experiments of NaCl aqueous
solutions also demonstrate the persistence of the anomalousbehavior in solution since they show that the correlation lengthcan be fit with a power law, similar to the bulk, upon cooling.389
Biddle et al.159analyzed the thermodynamics of aqueoussolutions. If the liquid−liquid transition exists and if it isterminated by a critical point, the addition of a solute shouldgenerate a line of liquid−liquid critical points emanating from thecritical point of pure metastable water. Unlike liquid−liquidphase separation in binary solutions caused by nonideality ofmixing between two species the liquid−liquid transition in purewater is driven by the nonideality of mixing between twoalternative structures of water. Biddle et al.159 compared theirequation of state for solutions based on the ideas described in
Figure 26. Phase diagram of NaCl aqueous solutions of supercooledwater as obtained from molecular dynamics simulations properlymatched to the experimental data. Upon increasing salt content the LDLregion shrinks and the LLCP is shifted to lower pressures and highertemperatures. Reproduced from ref 286. Copyright 2011 AmericanChemical Society.
Figure 27. FTS transition points (circles) and Widom line (continuousline) in a NaCl aqueous solution as obtained from molecular dynamicssimulations. The nose-shaped line is the TMD, and the dashed line is theliquid−gas limit of mechanical stability. Reproduced with permissionfrom ref 291. Copyright 2013 American Institute of Physics.
Chemical Reviews Review
DOI: 10.1021/acs.chemrev.5b00750Chem. Rev. 2016, 116, 7463−7500
7486

section 4 with the MD results of NaCl(aq) of Corradini etal.133,286 and found agreement.Recent experiments on melting of precipitated ice IV in
supercooled LiCl−H2O solution by Mishima390,391 can beexplained presuming the existence of polymorphism in waterand by the simple assumption that LiCl is dissolved mainly inhigh-density liquid water as also found in simulation studies onNaCl(aq).388 The melting of ice IV was detected from thetemperature change of the emulsified sample during thedecompression. A sudden change in the slope of the ice IVmelting curve in the pressure−temperature diagram was found.At the high-pressure and high-temperature side of the change,the solute-induced freezing point depression was observed. Atthe low-pressure and low-temperature side, ice IV transformedinto ice Ih on the decompression and the transition was almostunrelated to the concentration of LiCl.A similar picture to that of electrolyte solutions was also found
for the phase diagram of the small amphiphilic methanolmolecule. The phase diagram is shifted down in pressure, but noshift in temperature is detected at variance with electrolytesolutions. The LLCP is still found to exist for lowconcentrations.392 A FTS dynamical crossover was alsomeasured in methanol solutions at low concentrations,393 withinthis framework the FTS dynamical crossover should mark thecrossing of the Widom line.Studies on a model potential, the Jagla potential, show upon
addition of a solvophobic solute the same phenomenologydescribed so far. In particular, solutions of Jagla water uponinsertion of hard spheres show a shift of the LLCP to higherpressures and lower temperatures that becomes more and moremarked upon increasing the hard spheres concentration. Also, inthis kind of solution it is possible to detect the Widom line as adynamic crossover in the diffusion coefficient which is foundexactly upon crossing the Widom line.287,290
Experiments, theory, and simulations on supercooled aqueoussolutions thus indicate that they provide a viable route to solvethe mysteries of supercooled water both allowing easier access tothe supercooled state of this anomalous liquid and possiblyshifting the LLCP, if it exists, to more accessible zones of thephase diagram.
10. FUTURE DIRECTIONSThe foregoing reviewmakes clear that despite many, often highlysophisticated, experimental and computational efforts to obtain afull understanding of the complex behavior of water, thereremain many gaps in our knowledge and understanding of thismost anomalous liquid. In this section we seek to identify themost serious of these gaps and to explore how theymight be dealtwith. The biggest problem faced is that of the “crystallizationcurtain” that has until recently blocked our knowledge ofbehavior below the homogeneous nucleation temperature. Howbest to capitalize on the success of Nilsson and co-workers178 inpenetrating this barrier by means of microdroplet streams andpulsed X-ray laser interrogation is obviously one line of study tobe explored, and this is the first issue that will be consideredbelow.However, there are other possibilities for circumventing the
crystallization problem to be considered. Each has its own set ofdifficulties and uncertainties but also promise. There is, forinstance, the approach outlined by Koop and co-workers394 toeffectively mimic the raising of pressure on water by introductionof second components. Although this usually results in thewiping out of the anomalies at the same time as it removes the
crystallization event (Figures 25 and 26), it now seems it ispossible to decouple the two effects by using the right kind ofsolute. This approach should be worthy of detailed study since itis basically simple.Then there is the prospect raised by recent studies of water
under high tension,47,297 which have suggested that theanomalous domain can be elevated above the fast crystallizationdomain, perhaps due to competition between ice Ih and variousempty clathrate structures that frustrate the generation of criticalnuclei of any one crystal form. The negative-pressure domain isthe only remaining unexplored region of metastable water’sexistence, and although the challenges in sample production andin exploring anything other than isochoric behavior are many, therewards might be great. It has been argued297,395 that it is in thisdomain that the observations needed to distinguish between thedifferent scenarios of section 2 will need to be made.Also, of course, there are developments and refinements in the
field of computer simulations that are much needed for theunderstanding of deeply supercooled water. The need isillustrated by a comparison of laboratory data for thefundamental thermodynamic properties, isothermal compressi-bility and constant pressure heat capacity, with those determinedby calculations with one of the best pair potential currentlyavailable. The comparison of ambient pressure compressibilityobtained with the pair potential given most attention in thisreview, viz. TIP4P/2005 is shown in Figure 28. The agreement is
quite good for the first 20 °C of supercooling but then becomesrapidly poorer at lower temperatures where the simulations gothrough a mild maximum and the experimental quantity shows astrong tendency to diverge at about the same temperature. Thepower law behavior is seen not only for the compressibility butalso for the heat capacity (Figure 1) and even more clearly forvarious transport properties such as viscosity, dielectricrelaxation, spin−lattice relaxation, and the related reorientationrelaxation time, all measured by different authors, so is probably areliable representation of the observable data. The divergencetemperature, which has not been confirmed because it lies in no-
Figure 28.Comparison of the compressibility vs temperature relation at0.1 MPa obtained with the TIP4P/2005 pair potential (heavy red curve)with the experimental findings and their extensions with decreasingtemperature as follows: (first red point) −20 °C (253 K), combinationof SAXS data (Huang et al.184) and direct p−V data (Speedy andAngell12) that are in close agreement; (second red point) −24 °C (249K), lowest temperature direct measurement of Speedy and Angell;12
(dark green point) 239 K, limit of Holten and Anisimov extrapolation39
of ambient pressure fitted data; (light green point) 235 K, based on low-T limit of heat capacity measurements that follow the power law withdivergence temperature of 226 K,15 essentially the same as for thecompressibility.
Chemical Reviews Review
DOI: 10.1021/acs.chemrev.5b00750Chem. Rev. 2016, 116, 7463−7500
7487
man’s land, falls in the range 223−228 K, depending on the rangeof data fitted and nature of background corrections. We nowconsider each of these routes in sequence.
10.1. Ultrafast Probing
As described in section 4 there has been a development in termsof a general method for studying liquid structures below TH
based on fast cooling and ultrafast probing using femtosecondshort X-ray pulses by exploiting the unique capabilities of the X-ray laser LCLS.178,248 This needs to be further developed to allowother types of measurements both at ambient pressure andeventually at elevated pressures. It will be essential tomeasure thethermodynamic response functions, such as CP and κT, on smallwater droplets into no-man’s land and also the correlation length(ξ). If direct temperature measurements on the droplets can bedeveloped and a heat source introduced to induce a temperaturerise then potentially CP could be determined.SAXS is the most direct probe of density variations or
fluctuations on different length scales in a liquid, and from suchmeasurements both κT and ξ could be determined using X-raylasers. There is a thermodynamic relationship that relates κT tothe structure factor at q = 0 as S(0) = nkBTκT, where kB is theBoltzmann constant, T is the absolute temperature, and n is themolecular number density.396 We can then test the hypothesisthat neither ξ, CP, nor κT will diverge to infinity but will reach amaximum at Ts, i.e., within the LLCP hypothesis, at the Widomline. Depending on how flat the temperature-dependent regionaround Ts is, this could provide further insight into the validity ofthe various scenarios and if there exists an LLCP. It will also beessential to follow ξ and κT to lower temperature below Ts.Furthermore, it would be valuable to conduct the experimentusing D2O in order to probe isotope effects as well as use NaClsolution, since the latter has an effect similar to pressure389,397 asdiscussed in section 9. It could also be possible to determine thedensity variation from wide-angle X-ray scattering (WAXS) atvery high q. The scattering intensity will have weak q dependenceand become proportional to the density of the liquid. From suchmeasurements it could also be possible to derive the thermalexpansivity αP. Here, it will be essential to observe if there is aminimum in αP close to the Widom line. Eventually all theseclasses of experiments should be developed to also involve higherpressures. This will become a major experimental challenge, butit is essential that an effort will be devoted to this since it couldprovide a final answer as to which of the various scenarios bestdescribes real water.Another essential question to address is the proposed scenario
that there is only a liquid to solid transition and that an LDLliquid crystallizes faster than the relaxation time of theliquid.43,135 Could we then observe at which temperature thetime scale of liquid equilibration becomes longer than the timescale for ice crystallization? By directly comparing these timescales we could establish if and at which temperature the liquidcould no longer equilibrate relative to fast ice nucleation. Wewould expect that the structural fluctuations significantly slowdown entering into the supercooled regime and maybe in the no-man’s land region could become on the order of 10 or 100 ps.This could also be related to the much discussed fragile to strongtransition in the temperature dependence of the viscosity ofwater both above and below no-man’s land.32,277,281,292,398 It hasbeen suggested that there is a dynamic transition at 228 K thatwould coincide with the temperature of the Ts or Widom line.281
10.2. Second-Component Studies
Koop et al.394 showed that ice nucleation commences at atemperature determined by the water activity irrespective ofwhether the water activity is reduced by an increase of pressure orby addition of a second component that dissolves in the water.The more hydrophilic the solute the less of it is required toreduce the nucleation temperature to a target value oralternatively to remove the possibility of crystallizationaltogether. Hydrophilic solutes like LiCl or MgCl2 lower thenucleation temperature rapidly, leading to noncrystallizingsolutions. On computational time scales, NaCl behaves thesame way.286 The general consequence of high hydrophilicity isthat the structures responsible for the interesting anomalies ofwater are quickly dismantled (or at least are pushed out of sightto negative pressures, see Figure 26 and ref 286). There are othersolutes, however, which do not lower the activity of water veryrapidly, that in fact lead to demonstrably ideal solution behavioraccording tomelting point depression criteria, and it is found thatin these cases the low-temperature behavior retains theanomalies of water, indeed in enhanced form.399 This behavioris only recently recognized and not yet much exploited. It mightprovide a convincing demonstration of how water would behaveduring cooling in the absence of crystallization. Its relation to thestudies of Murata and Tanaka384 needs to be clarified in futurework. However, because second-component incorporation is aproxy for increasing pressure, neither provides clear answers tothe burning question of pure water behavior at ambient pressurein the absence of crystallization. This may be more easilyapproached from the other end of the pressure scale, namely, athigh states of tension or negative pressure.
10.3. Studies at Negative Pressure
Studies of water at large negative pressures have been sparsebecause of the difficulty of preparing the microscopic samples ofwater in mineral matrices needed to evaluate the behavior ofwater in this exotic state and the difficulty of studying them oncesuccessfully formed. Regrettably the fluid inclusion strategyseems to offer the only feasible way of obtaining samples suitablefor evaluating the behavior of water in this interesting domain.The constraint to constant volume over the temperature range ofstudy is another problem. Nevertheless, the difficulties have beenmastered by different groups, and Caupin and co-workers,47,297
in particular, have given evidence that the anomalous behaviorcan emerge from and be studied outside of the fast crystallizationzone (no-man’s land), see section 7. Clearly this provides achallenge to future workers to perform measurements additionalto the velocity of sound studies that have so far been performedand to design sampling procedures that permit more variablepVT conditions.The arguments given by Speedy for an essentially continuous
line of compressibility infinities from a negative pressure extremeto strong positive pressures and the similarity to the engineeringequations of state coupled with the lack of any isochore crossingpoint for the available isochores from the IAPWS-95 equation ofstate in the positive pressure range (such as that seen so clearlyfor ST2 water122) leaves the situation with real water in somedoubt. While this can be rationalized by locating the critical pointvery close to ambient pressure, as fitted by Holten andAnisimov,39 the fact that the “most likely” second critical-pointpressure has moved steadily to lower pressures with passing timeover some two decades keeps the final location of the criticalpoint and liquid−liquid line or HDL spinodal vs Widom line atambient pressure, a matter for continuing debate and future
Chemical Reviews Review
DOI: 10.1021/acs.chemrev.5b00750Chem. Rev. 2016, 116, 7463−7500
7488

work. An important part of this debate concerns the behavior ofthe line of density maxima (LDM), which itself passes through amaximum at negative pressures according to all pair-potentialmodels but does the opposite in the case of the empiricalequations of state and the scenario C of section 2. A positiveidentification of the behavior of the LDM is badly needed as theTMD claimed in the original study of Zheng et al.350 is nowsubject to adjustment by a surface tension argument given earlierin section 7. Two possibilities are identified here for future work.First, the existence of a density maximum can be identified
directly from the Brillouin light scattering measurement by thevanishing of the central line intensity since the Landau−Placzekratio must go to zero at a density maximum. The Landau−Placzek ratio connects the intensities of the Brillouin peaks, IB,and of the elastic peak, IR, in light scattering with the specific heatat constant volume and that at constant pressure according to thefollowing equation
=−I
IC C
C2R
B
P V
V (9)
However, in the quartz inclusion milieu presently used, the straylight is far too intense for this observation to be a possibility.Further developments of stray light canceling strategies or waysof producing a single perfect vesicle in a perfect quartz crystalmay eventually permit this simple measurement to generate anunambiguous line of density maxima that will end the debate oneway or another.Second, and more immediately, introduction of small dye
molecules that are sensitive to pressure and thus can “report” thepressure in the experiment offer the possibility of directspectroscopic determination of a density maximum. For instance,there is the water-soluble dyestuff molecules of the type recentlyused for analyzing friction patterns on sliding surfaces.400 Thesestudies depended on the sensitivity of the fluorescence spectrumto pressure or viscosity or both.401
The fluorescence intensity of molecule 1 of Figure 29A isdepicted in Figure 29B. The sensitivity to pressure is seen to be
quite high, and although the isochoric nature of the projectedexperiment will possibly complicate the interpretation, thelikelihood of a null result at the tension maximum seems small. Inany case, this is not the only pressure-sensitive dyestuff that isavailable. If the pressure sensitivity is due to a pressure-dependent viscosity, so much the better since the diffusivity ofwater is known to decrease with great rapidity as pressuredecreases in the direction of the tensile domain.402
Of course, the molecule must first survive the autoclavingprocedure used to produce the samples, but there is precedencefor this in the successful introduction of a water-insolublepolyphenyl, orthoterphenyl, into the vesicles prepared by Zheng(and only reported in ref 403). We expect that a water-solubleversion of themolecule seen in Figure 29 will likewise survive as itneed only be present in very low concentrations.If the temperature of maximum density detected by such
fluorescence intensity studies confirms the reversal of the TMDtrajectory in pressure the existence of the second critical point atzero pressure or thereabouts will find strong support.However, what will it imply if such a study confirms the high
values of the TMD reported from the original inclusionmeasurements or their successor studies? First, it will confirmthe great sensitivity of the equation of state parameters to thechoice of L−L coexistence data which was pointed out by theauthors of ref 39, and second, it will support the qualitativevalidity of engineering equations of state for water, which to datehave been given little credence by the metastable watercommunity.The origin of the sensitivity can be found in the way the TMD
is approaching the liquid−gas spinodal limit. This can be seenfrom the work of Vashist et al.142 on liquid Si in the Stillinger−Weber (S−W) model where the point of reversal of the TMDwith increasing tension is extremely close to the spinodal limit forthe liquid state. Since the latter cannot be penetrated, the saidreversal must suddenly switch in the opposite direction if the λparameter of the S−W model is made any larger. Indeed, if it israised to the value 23 used by Molinero and Moore147 in theirsuccessful adaptation of the S−W form of potential to thedescription of water then the isochore minima, which determinethe TMD, no longer reverse their direction with increasingtemperature but rather behave in the manner given by, forinstance, the HGK, or IAPWS-95 equations of state for water.This is demonstrated by current assessments of the isochores ofthe tuned S−W model seen in Figure 30 (LH panel), which nolonger cross at a critical point as they do for values of λ of 21 andlower.404
More importantly, it might also require recognition that notonly have the critical-point-related anomalies emerged from no-man’s land (as suggested by the negative pressure studies ofCaupin and coauthors47,297) but also the critical point itself hasdisappeared into the liquid−gas spinodal and become a virtualphenomenon. It would mean that the Widom line does not existbut rather that the anomalies of water are provoked by closeapproach to a line of spinodal instabilities of the high-densityliquid that lies just a few Kelvin on the low-temperature side of aline of liquid−liquid transitions that itself lies close to but belowthe line of homogeneous nucleation temperatures. This is nowcalled the “critical-point-free” scenario32 (diagramC in Figure 3).Thus, in light of Figure 1 above and the latter challenges, thereseems to be a need for more work on water models that willprovide better agreement with experiment in these extremeconditions.Why have pair-potential models not yet acquired the ability to
show the above sequence of possibilities? According to the X-raylaser data shown in Figure 12, the TIP4P/2005 model is not“going tetrahedral” quickly enough with decreasing temperature.Perhaps, as in mW water,135 they need the additional drive totetrahedrality that is provided by potentials of the S−W form, inwhich a departure from tetrahedrality is penalized by a repulsiveenergy component that opposes the pairwise additive attractioncomponent of the total potential. In water this would act on the
Figure 29. (A) Fluorescent molecules whose intensities If have highsensitivity to pressure or viscosity. (B) Pressure dependence of thefluorescence intensity of molecule 1 in 1 M solution in acetone.Reproduced from ref 401 with permission. Copyright 2015 WILEY-VCH Verlag GmbH & Co.
Chemical Reviews Review
DOI: 10.1021/acs.chemrev.5b00750Chem. Rev. 2016, 116, 7463−7500
7489

O−O−O alignments which need to be tetrahedral in an LDA-like structure. While such possibilities as the above remainuninvestigated, water is likely to maintain its mystique as themost anomalous and least understood liquid.
AUTHOR INFORMATIONCorresponding Author
*E-mail: [email protected]
The authors declare no competing financial interest.
Biographies
Paola Gallo is Professor of Theoretical Condensed Matter Physics at theUniversity Roma Tre, Rome, Italy. She graduated in Physics at theUniversity of Rome “La Sapienza” in Italy and received her Ph.D. degreein Condensed Matter Physics from the University of L’Aquila, Italy.From 1994 to 1996 she worked in the United States at theMassachusetts Institute of Technology with Prof. Sow-Hsin Chen.Since then her research has been focused on simulations of supercooledliquids and metastable water. Over her career she has contributed tocharacterizing the glassy behavior of supercooled water and thedynamics of water in confinement and in solutions. Currently, herresearch group focuses on the structure, dynamics, and thermodynamicsof solutions for cryopreservation, of doped ice, and of water underextreme conditions: supercooled, superheated, in hydrophilic andhydrophobic confinement and in electrolyte and amphiphilic solutions.
Katrin Amann-Winkel studied physics at the Technical UniversityDarmstadt. She completed her Ph.D. degree under the supervision ofErwin Mayer and Thomas Loerting on amorphous ices in 2009 at theUniversity of Innsbruck. She continued her studies on the glasstransition of amorphous ices in Innsbruck until 2014 and then moved toStockholm University, working now in the group of Anders Nilsson.
Austen Angell is a Regents’ Professor in the recently formed School ofMolecular Sciences at Arizona State University (ASU). He has publishedsome 510 papers, more than 70 of which have been cited over 100 times(recently averaging 72 citations per paper). He has been the awardee(internationally contested) of four different technical societies (ACS2004, MRS (2006), ACERS-1991, ECS-2010), most notably theHildebrand Award of the ACS, 2004 (for liquids studies), and theDavid Turnbull Lecture Award of theMRS (2006) (for glasses), and hasbeen the elected chairman of three different Gordon ResearchConferences dealing with liquids (Molten Salts and Metals (1977),Water and Aqueous Solutions (1980), and Physics and Chemistry of
Liquids (1997). He has always been fascinated by the behavior oflaboratory water in the supercooled and stretched states and by its roleas a Rosetta stone in the study of glass-forming liquids in general and haswritten a number of papers and reviews on these aspects of the wateranomalies.
Mikhail A. Anisimov is a Russian and American interdisciplinaryscientist. He received his Ph.D. degree (Physical Chemistry, 1969) fromMoscow State University and a Doctor of Science degree (Molecularand Thermal Physics, 1976) from the Kurchatov Institute of AtomicEnergy inMoscow. Since 1994 he has been working in the United States.Currently, he is a professor in the Department of Chemical andBiomolecular Engineering and in the Institute for Physical Science andTechnology at the University of Maryland, College Park. His field ofresearch has been thermodynamics of fluids and fluid mixtures, liquidcrystals, polymers, and other soft-matter materials. His research group atthe University of Maryland is one of the leading authorities, nationallyand internationally, in the field of critical phenomena and phasetransitions.
Frederic Caupin was born on October 20, 1976, in Douai, France. Hereceived his Ph.D. degree from the Universite Pierre et Marie Curie inParis under the direction of Sebastien Balibar in 2001. He spent 9 yearsas an assistant professor at Ecole Normale Superieure, Paris. Afterstudying the condensed phases of helium 3 and 4, his research interestsevolved toward the properties of water. In 2010 he became Professor atthe University Claude Bernard Lyon 1 to lead the European ResearchCouncil Starting Grant project “Water anomalies in the stretched andsupercooled regions”.
Charusita Chakravarty (1964−2016) received her B.Sc. degree inChemistry from the University of Delhi and then went on to graduatewith her B.A. degree (Natural Sciences Tripos) from the University ofCambridge. Her doctoral work was with Prof. David C. Clary FRS onquantum scattering and spectroscopy of van der Waals dimers. Duringher postdoctoral work with Prof. Horia Metiu at the University ofCalifornia, Santa Barbara, her research interests shifted to quantum andclassical simulations of molecular systems. After a year as a JuniorResearch Fellow in Churchill College, Cambridge, she joined theDepartment of Chemistry, Indian Institute of Technology Delhi, in1994 where she became Professor. Her research interests were in thestructure and dynamics of simple and anomalous liquids, biomolecularhydration, phase transitions, and nanoscale self-assembly.
Erik Lascaris was born on July 16, 1981, in Amsterdam, TheNetherlands. After receiving his engineering degree in Applied Physicsfrom the University of Twente in 2006, he continued his studies at
Figure 30. (Left) Behavior of the isochores and the TMD with isochore density in the tuned S−Wmodel with λ parameter = 23. The TMD does notreverse as it does for the silicon potential λ = 21. Flattened segments at lower temperatures correspond to broken ergodicity states (glasses on thesimulation time scale). (Right) Isochores and density maxima behavior of the HGK equation of state for water.
Chemical Reviews Review
DOI: 10.1021/acs.chemrev.5b00750Chem. Rev. 2016, 116, 7463−7500
7490

Boston University, where he was awarded the Chair’s Book Award forExcellence in Teaching. In 2014 he received his Ph.D. degree in Physicsfor work on liquid−liquid phase transitions. He is currently aPostdoctoral Associate at Boston University, studying the effects ofradiation and high temperatures on Fe−Cr alloys using moleculardynamics and phase field methods.
Thomas Loerting was born in 1973, studied chemistry at the Universityof Innsbruck in Austria, and obtained his Ph.D. degree in TheoreticalChemistry under the supervision of Prof. Klaus R. Liedl in 2000. As apostdoctoral fellow he changed from theory to experiments and workedwith Prof. Erwin Mayer in Innsbruck and Nobel Laureate Prof. Mario J.Molina at the Massachussetts Institute of Technology. After hisHabilitation in Physical Chemistry in 2008 he became AssociateProfessor and speaker of the Research Platform “Material- andNanosciences” at the University of Innsbruck and member of theAustrian Academy of Sciences (“Junge Kurie”). His group’s research oncryochemistry, supercooled water, amorphous and crystalline ices, andclathrate hydrates was honored with a dozen awards, including theStarting Grant of the European Research Council (ERC), the START-Preis of the Austrian Federal Ministry of Research and Sciences, theBodenstein award of the German Bunsen Society, and the Bessel awardof the Alexander von Humboldt foundation. Recently, he was VisitingScientist at TU Dortmund University, collaborating with Prof. RolandBohmer.
Athanassios Z. Panagiotopoulos received his undergraduate degree fromthe National Technical University of Athens and Ph.D. degree fromMIT, both in Chemical Engineering. After a postdoctoral stay inPhysical Chemistry at the University of Oxford, he has held facultypositions at Cornell and the University of Maryland; he is currently theSusan Dod Brown Professor of Chemical and Biological Engineering atPrinceton University. He is a member of the U.S. National Academy ofEngineering and the American Academy of Arts and Sciences. Hisresearch focuses on development and application of theoretical andcomputer simulation techniques for the study of properties of fluids andmaterials.
John Russo received his Ph.D. degree in Physics in 2010 from theUniversity of Rome La Sapienza. He then joined the University of Tokyoto work at the Institute of Industrial Science. He is presently a RoyalSociety University Research Fellow and Lecturer in AppliedMathematics at the School of Maths, the University of Bristol. Hisresearch interests include both equilibrium and nonequilibriumproperties of colloidal systems, patchy particles, and complex fluidssuch as water.
Jonas A. Sellberg was born on July 30, 1985, in Stockholm, Sweden.After completing his M.Sc. studies in Chemistry and ChemicalEngineering at the KTH Royal Institute of Technology in 2009, withinternships at Princeton University andUniversity of Tokyo, he receivedhis Ph.D. degree in Physics from Stockholm University in 2014, withhonors. Jonas continued his scientific career as Postdoctoral Fellow atUppsala University (2014−2015) and returned recently to KTH RoyalInstitute of Technology, where he is currently an Assistant Professor inApplied Physics. His expertise lies within X-ray scattering andspectroscopy of water and ice, ultrafast pump−probe X-ray spectros-copy of surface adsorbates, and coherent diffractive imaging of liveviruses and cells.
Eugene H. Stanley works in collaboration with students and colleaguesattempting to understand puzzles of interdisciplinary science. He hasbeen elected to the U.S. National Academy of Sciences (NAS) andreceived the 2004 IUPAP Boltzmann Medal. His main current focus isunderstanding the anomalous behavior of liquid water in bulk,nanoconfined, and biological environments. He has also worked on a
range of other topics in complex systems, such as quantifyingcorrelations among the constituents of the Alzheimer brain andquantifying fluctuations in noncoding and coding DNA sequences, andinterbeat intervals of the healthy and diseased heart. His publicationsall available online at http://polymer.bu.edu/hes/have receivedmorethan 80 000 ISI Web of Science citations and more than 120 000citations in Google Scholar. His ISI Hirsch index is currently h = 128.
Hajime Tanaka received his Ph.D. degree in Applied Physics (1982)from the University of Tokyo. He is currently Professor at the Instituteof Industrial Science, the University of Tokyo. He has worked on a widerange of problems related to soft matter physics and liquid matterphysics both experimentally and theoretically. He has been intrigued bythe general behavior of a system having spatiotemporally hierarchicalstructures and the commonality between soft matter and liquid matter inthat respect. More specifically, he has been interested in patternformation and nonlinear rheology of soft matter, physics of water,liquid−liquid transition, glass transition, and crystallization. He haspublished some 260 papers in refereed journals. Awards for researchhave included the Award of the Society of Polymer Science, Japan(1997), Humboldt Research Award (Alexander von HumboldtFoundation, Germany) (2006), and The Liquid Crystal Society, TopPaper Award (2010). He became a Fellow of the Institute of Physics in2007.
Carlos Vega was born in 1964 in Madrid. In 1991 he finished his Ph.D.degree at Complutense University under the direction of Prof. SantiagoLago. For 18months he was a postdoctoral Fulbright Fellow in Amherst,Massachusetts, supervised by Prof. Peter Monson. Since 2005 he hasbeen Full Professor of Physical Chemistry at Universidad Complutensede Madrid. His research interest is focused on computer simulations ofwater, with special emphasis on the evaluation of the phase diagram forsimple potential models. In 2005, along with Prof. Abascal, he proposedthe TIP4P/2005 model of water.
Limei Xu received her Ph.D. degree from the Department of Physics,Boston University in 2007. After that she was a postdoctoral fellow in theChemistry Department, University of Utah. In 2008 she joined theAdvanced Institute of Materials Research (WPI-AIMR) at TohokuUniversity as an assistant professor. In 2011 she took the tenure-trackassociate professor position in the International Center for QuantumMaterials (ICQM) at Peking University and was promoted to a tenuredprofessor in 2015. She was selected as the Junior 1000 Talents by theRecruitment Program of Global Experts of China in 2011 and wasawarded the National Science Fund for Distinguished Young Scholars in2015. Her current research interests include critical and supercriticalphenomena, properties of water in confinement and on surfaces, andnonequilibrium statistical physics.
Lars G. M. Pettersson was born in Norrkoping, Sweden, in 1951 andreceived his B.Sc. degree in Physics (1976) and Ph.D. degree inTheoretical Physics (1984) from Stockholm University, Sweden, wherehe focused on highly accurate quantum chemical calculations as well asdeveloping approximate modeling techniques. He did postdoctoralstudies (1984−1986) in California at IBM, San Jose, and NASA AmesResearch Center. He returned to Stockholm University, where he iscurrently Professor in theoretical chemical physics. His research focuslies on quantum chemical modeling of processes at surfaces andtheoretical treatment and application of inner-shell spectroscopies, butthe main effort is currently devoted to understanding the structure anddynamics of water and aqueous solutions.
ACKNOWLEDGMENTS
This review was initiated during theNordita (Nordic Institute forTheoretical Physics) scientific program “Water-the Most
Chemical Reviews Review
DOI: 10.1021/acs.chemrev.5b00750Chem. Rev. 2016, 116, 7463−7500
7491

Anomalous Liquid”. Additional financial support for thisprogram was provided by the Royal Swedish Academy ofSciences through its Nobel Institutes for Physics and Chemistry,by the Swedish Research Council, and by the Department ofPhysics at Stockholm University. We would like to acknowledgehelpful suggestions by Prof. Pablo Debenedetti. We are gratefulto Stephan Fuhrmann for providing Figure 4. C.A.A. wishes toacknowledge support from theNSF under collaborative grant no.CHE 12-13265. F.C. acknowledges funding by the EuropeanResearch Council under the European Community’s FP7 GrantAgreement 240113 and by the Agence Nationale de la RechercheGrant 09-BLAN-0404-01. C.C. would like to thank theDepartment of Science and Technology, NewDelhi, for financialsupport. T.L. is grateful for funding from the European ResearchCouncil (ERC Starting Grant SULIWA), the Austrian ScienceFund FWF (bilateral project I1392), the Austrian researchpromotion agency FFG (Bridge-project EarlySnow), and theAlexander von Humboldt Foundation (Bessel award). A.Z.P.would like to acknowledge support for this work by theDepartment of Energy, Office of Basic Energy Sciences, underAward No. DE-SC0002128. H.T. acknowledges supports fromGrants-in-Aid for Scientific Research (S) (grant no. 21224011)and Specially Promoted Research (grant no. 25000002) from theJapan Society for the Promotion of Science. C.V. acknowledgesproject FIS2013-43209-P for funding. L.X. acknowledgessupport from the National Science Foundation of China (grantnos. 11174006, 11290162, 11525520) and MOST (grant nos.2012CB921404 and 2015CB856801).
DEDICATIONDuring the final preparation of this review, we became saddenedby the news that Prof. Charusita Chakravarty had succumbed tocancer. She was a deeply warm individual, who touched the livesof many of us. Among her many scientific achievements, she hasgreatly contributed to our understanding of the properties ofwater. Her death leaves a big emptiness in our hearts and in ourresearch field.
REFERENCES(1) Angell, C. A. In Water: A Comprehensive Treatise; Franks, F., Ed.;Plenum: New York, 1982; Vol. 7.(2) Debenedetti, P. G. Metastable Liquids: Concepts and Principles;Princeton University Press: Princeton, 1996.(3) Franks, F. Water: A Matrix of Life; Royal Society of Chemistry:Cambridge, 2000.(4) Debenedetti, P. G. Supercooled and Glassy Water. J. Phys.:Condens. Matter 2003, 15, R1669−R1726.(5) Debenedetti, P. G.; Stanley, H. E. Supercooled and Glassy Water.Phys. Today 2003, 56, 40−46.(6) Angell, C. A. Amorphous Water. Annu. Rev. Phys. Chem. 2004, 55,559−583.(7) Ball, P. Water as an Active Constituent in Cell Biology. Chem. Rev.2008, 108, 74−108.(8) Bellissent-Funel, M.-C. Hydration Processes in Biology: Theoreticaland Experimental Approaches; ISO Press: Amsterdam, 1999.(9) Robinson, G. W.; Zhu, S. B.; Singh, S.; Evans, M. W. Water inBiology, Chemistry, and Physics: Experimental Overviews and Computa-tional Methodologies; World Scientific: Singapore, 1996.(10) Workshop on “Water”: Structure and Dynamics of Water andAqueous SolutionsAnomalies and their Possible Implications in Biology;Proceedings of the Institute of Laue-Langevin: Grenoble, 1984.(11) Angell, C. A.; Shuppert, J.; Tucker, J. C. Anomalous Properties ofSupercooledWater. Heat Capacity, Expansivity, and Proton MagneticResonance Chemical Shift from 0 to −38°C. J. Phys. Chem. 1973, 77,3092−3099.
(12) Speedy, R. J.; Angell, C. A. Isothermal Compressibility ofSupercooled Water and Evidence for a Thermodynamic Singularity at−45°C. J. Chem. Phys. 1976, 65, 851−858.(13) Stanley, H. E. Introduction to Phase Transitions and CriticalPhenomena; Oxford University Press: New York, 1971.(14) Kumar, P.; Stanley, H. E. Thermal Conductivity Minimum: ANew Water Anomaly. J. Phys. Chem. B 2011, 115, 14269−14273.(15) Angell, C. A.; Oguni, M.; Sichina, W. J. Heat Capacity of Water atExtremes of Supercooling and Superheating. J. Phys. Chem. 1982, 86,998−1002.(16) Sato, H.; Watanabe, K.; Levelt-Sengers, J. M. H.; Gallagher, J. S.;Hill, P. G.; Straub, J.; Wagner, W. Sixteen Thousand EvaluatedExperimental Thermodynamic Property Data for Water and Steam. J.Phys. Chem. Ref. Data 1991, 20, 1023−1044.(17) Conde, O.; Teixeira, J.; Papon, P. Analysis of Sound Velocity inSupercooled H2O, D2O, and Water-Ethanol mixtures. J. Chem. Phys.1982, 76, 3747−3753.(18) Kanno, H.; Angell, C. A. Water: Anomalous Compressibilities to1.9 kbar and Correlation with Supercooling Limits. J. Chem. Phys. 1979,70, 4008−4016.(19) Vega, C.; Abascal, J. L. F. Relation Between the MeltingTemperature and the Temperature of Maximum Density for the MostCommon Models ofWater. J. Chem. Phys. 2005, 123, 144504.(20) Shell, M. S.; Debenedetti, P. G.; Panagiotopoulos, A. Z. MolecularStructural Order and Anomalies in Liquid Silica. Phys. Rev. E: Stat. Phys.,Plasmas, Fluids, Relat. Interdiscip. Top. 2002, 66, 011202.(21) Nayar, D.; Chakravarty, C. Water and Water-Like Liquids:Relationships Between Structure, Entropy and Mobility. Phys. Chem.Chem. Phys. 2013, 15, 14162−14177.(22) Barros de Oliveira, A.; Salcedo, E.; Chakravarty, C.; Barbosa, M.C. Entropy, Diffusivity and the Energy Landscape of aWaterlike Fluid. J.Chem. Phys. 2010, 132, 234509.(23) Poole, P. H.; Sciortino, F.; Essmann, U.; Stanley, H. PhaseBehavior of Metastable Water. Nature 1992, 360, 324−328.(24) Vega, C.; Abascal, J. L. F.; Conde, M. M.; Aragones, J. L. What IceCan Teach Us about Water Interactions: a Critical Comparison of thePerformance of Different Water Models. Faraday Discuss. 2009, 141,251−276.(25) Agarwal, M.; Alam, M. P.; Chakravarty, C. Thermodynamic,Diffusional, and Structural Anomalies in Rigid-Body Water Models. J.Phys. Chem. B 2011, 115, 6935−6945.(26) Fine, R. A.; Millero, F. J. The High Pressure P V T Properties ofDeuterium Oxide. J. Chem. Phys. 1975, 63, 89−95.(27) Abascal, J. L. F.; Vega, C. Widom Line and the Liquid-LiquidCritical Point for the TIP4P/2005 Water Model. J. Chem. Phys. 2010,133, 234502.(28) Poole, P. H.; Sciortino, F.; Essmann, U.; Stanley, H. E. TheSpinodal of Liquid Water. Phys. Rev. E: Stat. Phys., Plasmas, Fluids, Relat.Interdiscip. Top. 1993, 48, 3799−3817.(29) Poole, P. H.; Essmann, U.; Sciortino, F.; Stanley, H. E. PhaseDiagram for Amorphous Solid Water. Phys. Rev. E: Stat. Phys., Plasmas,Fluids, Relat. Interdiscip. Top. 1993, 48, 4605−4610.(30) Sciortino, F.; Poole, P. H.; Essmann, U.; Stanley, H. E. Line ofCompressibility Maxima in the Phase Diagram of Supercooled Water.Phys. Rev. E: Stat. Phys., Plasmas, Fluids, Relat. Interdiscip. Top. 1997, 55,727−737.(31) Sastry, S.; Debenedetti, P. G.; Sciortino, F.; Stanley, H. E.Singularity-Free Interpretation of the Thermodynamics of SupercooledWater. Phys. Rev. E: Stat. Phys., Plasmas, Fluids, Relat. Interdiscip. Top.1996, 53, 6144−6154.(32) Angell, C. A. Insights into Liquid Water Phases from Study of itsUnusual Glass- Forming Properties. Science 2008, 319, 582−587.(33) Speedy, R. J. Stability-Limit Conjecture. J. Phys. Chem. 1982, 86,982−989.(34) Tanaka, H. Simple Physical Model of Liquid Water. J. Chem. Phys.2000, 112, 799−809.(35) Tanaka, H. Simple View of Waterlike Anomalies of AtomicLiquids with Directional Bonding. Phys. Rev. B: Condens. Matter Mater.Phys. 2002, 66, 064202.
Chemical Reviews Review
DOI: 10.1021/acs.chemrev.5b00750Chem. Rev. 2016, 116, 7463−7500
7492

(36) Tanaka, H. Bond Orientational Order in Liquids: Towards aUnified Description of Water-Like Anomalies, Liquid-Liquid transition,Glass Transition, and Crystallization. Eur. Phys. J. E: Soft Matter Biol.Phys. 2012, 35, 113.(37) Fuentevilla, D. A.; Anisimov, M. A. Scaled Equation of State forSupercooled Water Near the Liquid-Liquid Critical Point. Phys. Rev.Lett. 2006, 97, 195702.(38) Bertrand, C. E.; Anisimov, M. A. Peculiar Thermodynamics of theSecond Critical Point in Supercooled Water. J. Phys. Chem. B 2011, 115,14099−14111.(39) Holten, V.; Anisimov, M. A. Entropy-Driven Liquid-LiquidSeparation in Supercooled Water. Sci. Rep. 2012, 2, 713.(40) Mishima, O.; Stanley, H. E. The Relationship Between Liquid,Supercooled and Glassy Water. Nature 1998, 396, 329−335.(41) Stanley, H. E.; Kumar, P.; Franzese, G.; Xu, L.; Yan, Z.; Mazza, M.G.; Buldyrev, S. V.; Chen, S.-H.; Mallamace, F. Liquid Polyamorphism:Possible Relation to the Anomalous Behavior of Water. Eur. Phys. J.:Spec. Top. 2008, 161, 1−17.(42) Xu, L.; Kumar, P.; Buldyrev, S. V.; Chen, S.-H.; Poole, P. H.;Sciortino, F.; Stanley, H. E. Relation Between the Widom Line and theDynamic Crossover in Systems with a Liquid-Liquid Phase Transition.Proc. Natl. Acad. Sci. U. S. A. 2005, 102, 16558−16562.(43) Limmer, D.; Chandler, D. The Putative Liquid-Liquid Transitionis a Liquid-Solid Transition in Atomistic Models of Water. J. Chem. Phys.2011, 135, 134503.(44) Limmer, D. T.; Chandler, D. The Putative Liquid-LiquidTransition is a Liquid-Solid Transition in Atomistic Models of Water.II. J. Chem. Phys. 2013, 138, 214504.(45) Nilsson, A.; Pettersson, L. G. M. The Structural Origin ofAnomalous Properties of Liquid Water. Nat. Commun. 2015, 6, 8998.(46) Poole, P. H.; Sciortino, F.; Grande, T.; Stanley, H. E.; Angell, C. A.Effect of Hydrogen Bonds on the Thermodynamic Behavior of LiquidWater. Phys. Rev. Lett. 1994, 73, 1632−1635.(47) Pallares, G.; ElMekki Azouzi, M.; Gonzalez,M. A.; Aragones, J. L.;Abascal, J. L. F.; Valeriani, C.; Caupin, F. Anomalies ofWater at NegativePressure. Proc. Natl. Acad. Sci. U. S. A. 2014, 111, 7936−7941.(48) Mishima, O.; Stanley, H. E. Decompression-Induced Melting ofIce IV and the Liquid- Liquid Transition in Water. Nature 1998, 392,164−168.(49) Sciortino, F.; La Nave, E.; Tartaglia, P. Physics of the Liquid-Liquid Critical Point. Phys. Rev. Lett. 2003, 91, 155701.(50) Sivakumar, T. C.; Rice, S. A.; Sceats, M. G. Raman SpectroscopicStudies of the OH Stretching Region of Low Density Amorphous SolidWater and of Polycrystalline Ice Ih. J. Chem. Phys. 1978, 69, 3468−3476.(51) Maruyama, S.; Wakabayashi, K.; Oguni, M. Thermal Properties ofSupercooledWater ConfinedWithin Silica Gel Pores. American Instituteof Physics Conference Proceedings 2003, 708, 675−676.(52) Mishima, O.; Calvert, L. D.; Whalley, E. Melting Ice I at 77 K and10 kbar: a New Method of Making Amorphous Solids. Nature 1984,310, 393−395.(53) Binder, K. Simulations Clarify When Supercooled Water Freezesinto Glassy Structures. Proc. Natl. Acad. Sci. U. S. A. 2014, 111, 9374−9375.(54) Mishima, O.; Calvert, L. D.; Whalley, E. An Apparently First-Order Transition Between Two Amorphous Phases of Ice Induced byPressure. Nature 1985, 314, 76−78.(55) Finney, J. L.; Bowron, D. T.; Soper, A. K.; Loerting, T.; Mayer, E.;Hallbrucker, A. Structure of a New Dense Amorphous Ice. Phys. Rev.Lett. 2002, 89, 205503.(56) Bellissent-Funel, M.-C.; Bove, L.; Nilsson, A.; Paciaroni, A.;Schlesinger, D.; Skinner, L.; Amann-Winkel, K. X-ray and NeutronScattering of Water. Chem. Rev. 2016, 106, 10.1021/acs.chem-rev.5b00663.(57) Whiting, H. A New Theory of Cohesion Applied to theThermodynamics of Liquids and Solids. Proc. Am. Acad. Arts Sci. 1883,19, 353−431.(58) Rontgen, W. K. Ueber die Constitution des Flussigen Wassers.Ann. Phys. 1892, 281, 91−97.
(59) Davis, J.; C, M.; Litovitz, T. A. Two-State Theory of the StructureofWater. J. Chem. Phys. 1965, 42, 2563−2576.(60) Angell, C. A. Two-State Thermodynamics and TransportProperties for Water from “Bond Lattice” Model. J. Phys. Chem. 1971,75, 3698−3705.(61) Vedamuthu, M.; Singh, S.; Robinson, G. W. Properties of LiquidWater: Origin of the Density Anomalies. J. Phys. Chem. 1994, 98, 2222−2230.(62) Mishima, O.; Takemura, K.; Aoki, K. Visual Observations of theAmorphous- Amorphous Transition in H2O Under Pressure. Science1991, 254, 406−408.(63) Mishima, O. Reversible First-Order Transition Between TwoH2O Amorphs at 0.2 GPa and 135K. J. Chem. Phys. 1994, 100, 5910−5912.(64) Bellissent-Funel, M.-C.; Bosio, L.; Hallbrucker, A.; Mayer, E.;Sridi-Dorbez, R. X-ray and Neutron Scattering Studies of the Structureof Hyperquenched Glassy Water. J. Chem. Phys. 1992, 97, 1282−1286.(65) Bellissent-Funel, M.-C.; Bosio, L. A Neutron Scattering Study ofLiquid D2O under Pressure and at Various Temperatures. J. Chem. Phys.1995, 102, 3727−3735.(66) Andersson, O. Glass-Liquid Transition ofWater at High Pressure.Proc. Natl. Acad. Sci. U. S. A. 2011, 108, 11013−11016.(67) Soper, A. K.; Ricci, M. A. Structures of High-Density and Low-Density Water. Phys. Rev. Lett. 2000, 84, 2881−2884.(68) Bellissent-Funel, M. C. Is there a Liquid-Liquid Phase Transitionin Supercooled Water? Europhys. Lett. 1998, 42, 161−166.(69) Loerting, T.; Giovambattista, N. Amorphous Ices: Experimentsand Numerical Simulations. J. Phys.: Condens. Matter 2006, 18, R919−R977.(70) Mishima, O. Liquid-Liquid Critical Point in Heavy Water. Phys.Rev. Lett. 2000, 85, 334−336.(71) Mishima, O. Volume of Supercooled Water under Pressure andthe Liquid-Liquid Critical Point. J. Chem. Phys. 2010, 133, 144503.(72) Mishima, O. Polyamorphism in Water. Proc. Jpn. Acad., Ser. B2010, 86, 165−175.(73) Mishima, O. Polyamorphism in Water. Adv. Chem. Phys. 2013,152, 355−372.(74) Head-Gordon, T.; Stillinger, F. H. An Orientational PerturbationTheory for Pure Liquid Water. J. Chem. Phys. 1993, 98, 3313−3327.(75) Stanley, H. E. In Hydration Processes in Biology: Theoretical andExperimental Approaches. Proceedings of the NATO Advanced StudyInstitutes; Bellissent-Funel, M.-C., Ed.; IOS Press: Amsterdam, 1999;Vol. 305; Chapter 1, Opening Course, 1998 Les Houches School, pp3313−3327.(76) Giovambattista, N.; Loerting, T.; Lukanov, B. R.; Starr, F. W.Interplay of the Glass Transition and the Liquid-Liquid PhaseTransition in Water. Sci. Rep. 2012, 2, 1−8.(77) Loerting, T.; Fuentes-Landete, V.; Handle, P. H.; Seidl, M.;Amann-Winkel, K.; Gainaru, C.; Bohmer, R. The Glass Transition inHigh-Density Amorphous Ice. J. Non-Cryst. Solids 2015, 407, 423−430.(78) Amann-Winkel, K.; Gainaru, C.; Handle, P. H.; Seidl, M.; Nelson,H.; Bohmer, R. Water’s Second Glass Transition. Proc. Natl. Acad. Sci. U.S. A. 2013, 110, 17720−17725.(79) Sperl, M.; Zaccarelli, E.; Sciortino, F.; Kumar, P.; Stanley, H. E.Disconnected Glass- Glass Transitions and Diffusion Anomalies in aModel with Two Repulsive Length Scales. Phys. Rev. Lett. 2010, 104,145701.(80) Amann-Winkel, K.; Bohmer, R.; Fujara, F.; Gainaru, C.; Geil, B.;Loerting, T. Colloquium: Water’s Controversial Glass Transitions. Rev.Mod. Phys. 2016, 88, 011002.(81) Salzmann, C. G.; Loerting, T.; Klotz, S.; Mirwald, P. W.;Hallbrucker, A.; Mayer, E. Isobaric Annealing of High-DensityAmorphous Ice between 0.3 and 1.9 GPa: in situ Density Values andStructural Changes. Phys. Chem. Chem. Phys. 2006, 8, 386−397.(82) Handle, P. H.; Loerting, T. Dynamics Anomaly in High-DensityAmorphous Ice between 0.7 and 1.1 GPa. Phys. Rev. B: Condens. MatterMater. Phys. 2016, 93, 064204.
Chemical Reviews Review
DOI: 10.1021/acs.chemrev.5b00750Chem. Rev. 2016, 116, 7463−7500
7493

(83) Brovchenko, I.; Geiger, A.; Oleinikova, A. Multiple Liquid-LiquidTransitions in Supercooled Water. J. Chem. Phys. 2003, 118, 9473−9476.(84) Brovchenko, I.; Geiger, A.; Oleinikova, A. Liquid-Liquid PhaseTransitions in Supercooled Water Studied by Computer Simulations ofVarious Water Models. J. Chem. Phys. 2005, 123, 044515.(85) Jedlovszky, P.; Vallauri, R. Liquid-Vapor and Liquid-Liquid PhaseEquilibria of the Brodholt-Sampol-Vallauri Polarizable Water Model. J.Chem. Phys. 2005, 122, 081101.(86) Buldyrev, S. V.; Stanley, H. E. A System with Multiple Liquid-Liquid Critical Points. Phys. A 2003, 330, 124−129.(87) Liu, Y.; Panagiotopoulos, A. Z.; Debenedetti, P. G. Low-Temperature Fluid-Phase Behavior of ST2 Water. J. Chem. Phys. 2009,131, 104508.(88) Loerting, T.; Salzmann, C. G.; Winkel, K.; Mayer, E. The Relationbetween High-Density and Very-High-Density Amorphous Ice. Phys.Chem. Chem. Phys. 2006, 8, 2810−2818.(89) Loerting, T.; Winkel, K.; Seidl, M.; Bauer, M.; Mitterdorfer, C.;Handle, P. H.; Salzmann, C. G.; Mayer, E.; Finney, J. L.; Bowron, D. T.How Many Amorphous Ices are there? Phys. Chem. Chem. Phys. 2011,13, 8783−8794.(90) Mishima, O.; Suzuki, Y. Propagation of the PolyamorphicTransition of Ice and the Liquid-Liquid Critical Point.Nature 2002, 419,599−603.(91) Klotz, S.; Strassle, T.; Nelmes, R. J.; Loveday, J. S.; Hamel, G.;Rousse, G.; Canny, B.; Chervin, J. C.; Saitta, A. M. Nature of thePolyamorphic Transition in Ice under Pressure. Phys. Rev. Lett. 2005, 94,025506.(92) Yoshimura, Y.; Mao, H. K.; Hemley, R. J. An in situ RamanSpectroscopic Study on the Reversible Transition Between Low-Density and High-Density Amorphous Ices at 135 K. J. Phys.: Condens.Matter 2007, 19, 425214.(93) Winkel, K.; Elsaesser, M. S.; Mayer, E.; Loerting, T. WaterPolyamorphism: Reversibility and (Dis)Continuity. J. Chem. Phys. 2008,128, 044510.(94) Winkel, K.; Mayer, E.; Loerting, T. Equilibrated High-DensityAmorphous Ice and Its First-Order Transition to the Low-DensityForm. J. Phys. Chem. B 2011, 115, 14141−14148.(95) Andersson, O. Glass-Liquid Transition ofWater at High Pressure.Proc. Natl. Acad. Sci. U. S. A. 2011, 108, 11013−11016.(96) Johari, G. P.; Hallbrucker, A.; Mayer, E. The Glass-LiquidTransition of Hyperquenched Water. Nature 1987, 330, 552−553.(97) Hallbrucker, A.; Mayer, E.; Johari, G. P. Glass-Liquid Transitionand the Enthalpy of Devitrification of Annealed Vapor-DepositedAmorphous Solid Water - A Comparison with Hyperquenched GlassyWater. J. Phys. Chem. 1989, 93, 4986−4990.(98) Elsaesser, M. S.; Winkel, K.; Mayer, E.; Loerting, T. Reversibilityand Isotope Effect of the Calorimetric Glass-Liquid Transition of Low-Density Amorphous Ice. Phys. Chem. Chem. Phys. 2010, 12, 708−712.(99) Kohl, I.; Bachmann, L.; Hallbrucker, A.; Mayer, E.; Loerting, T.Liquid-Like Relaxation in Hyperquenched Water at ⩽140 K. Phys.Chem. Chem. Phys. 2005, 7, 3210−3220.(100) Angell, C. A.; Moynihan, C. T.; Hemmati, M. ’Strong’ and’Superstrong’ Liquids, and an Approach to the Perfect Glass State viaPhase Transition. J. Non-Cryst. Solids 2000, 274, 319−331.(101) Shephard, J. J.; Evans, J. S. O.; Salzmann, C. G. StructuralRelaxation of Low-Density Amorphous Ice upon Thermal Annealing. J.Phys. Chem. Lett. 2013, 4, 3672−3676.(102) Smith, R. S.; Kay, B. D. The Existence of Supercooled LiquidWater at 150 K. Nature 1999, 398, 788−791.(103) Fisher, M.; Devlin, J. P. Defect Activity in Amorphous Ice fromIsotopic Exchange Data - Insight into the Glass-Transition. J. Phys.Chem. 1995, 99, 11584−11590.(104) Angell, C. A. Glass Transition Dynamics in Water and OtherTetrahedral Liquids: ’Order-Disorder’ Transitions Versus ’Normal’Glass Transitions. J. Phys.: Condens. Matter 2007, 19, 205112.(105) Capaccioli, S.; Ngai, K. L. Resolving the Controversy on theGlass Transition Temperature of Water? J. Chem. Phys. 2011, 135,104504.
(106) Sepulveda, A.; Leon-Gutierrez, E.; Gonzalez-Silveira, M.;Rodriguez-Tinoco, C.; Clavaguera-Mora, M. T.; Rodriguez-Viejo, J.Glass Transition in Ultrathin Films of Amorphous Solid Water. J. Chem.Phys. 2012, 137, 244506.(107)Gainaru, C.; Agapov, A. L.; Fuentes-Landete, V.; Amann-Winkel,K.; Nelson, H.; Koster, K. W.; Kolesnikov, A. I.; Novikov, V. N.; Richert,R.; Bohmer, R.; Loerting, T.; Sokolov, A. P. Anomalously Large IsotopeEffect in the Glass Transition of Water. Proc. Natl. Acad. Sci. U. S. A.2014, 111, 17402−17407.(108) Mishima, O.; Suzuki, Y. Vitrification of Emulsified Liquid Waterunder Pressure. J. Chem. Phys. 2001, 115, 4199−4202.(109) Mishima, O. The Glass-to-Liquid Transition of the EmulsifiedHigh-Density Amorphous Ice made by Pressure-Induced Amorphiza-tion. J. Chem. Phys. 2004, 121, 3161−3164.(110) Andersson, O. Relaxation Time of Water’s High-DensityAmorphous Ice Phase. Phys. Rev. Lett. 2005, 95, 205503.(111) Andersson, O.; Inaba, A. Dielectric Properties of High-DensityAmorphous Ice under Pressure. Phys. Rev. B: Condens. Matter Mater.Phys. 2006, 74, 184201.(112) Seidl, M.; Elsaesser, M. S.; Winkel, K.; Zifferer, G.; Mayer, E.;Loerting, T. Volumetric Study Consistent with a Glass-to-LiquidTransition in Amorphous Ices under Pressure. Phys. Rev. B: Condens.Matter Mater. Phys. 2011, 83, 100201.(113) Handle, P. H.; Seidl, M.; Loerting, T. Relaxation Time of High-Density Amorphous Ice. Phys. Rev. Lett. 2012, 108, 225901.(114) Floriano, M. A.; Handa, Y. P.; Klug, D. D.; Whalley, E. Nature ofthe Transformations of Ice-I and Low-Density Amorphous Ice to High-Density Amorphous Ice. J. Chem. Phys. 1989, 91, 7187−7192.(115) Xu, L.; Buldyrev, S. V.; Giovambattista, N.; Angell, C. A.; Stanley,H. E. AMonatomic System with a Liquid-Liquid Critical Point and TwoDistinct Glassy States. J. Chem. Phys. 2009, 130, 054505.(116) Xu, L.; Giovambattista, N.; Buldyrev, S. V.; Debenedetti, P. G.;Stanley, H. E. Waterlike Glass Polyamorphism in a MonoatomicIsotropic Jagla Model. J. Chem. Phys. 2011, 134, 064507.(117) Liu, Y.; Palmer, J. C.; Panagiotopoulos, A. Z.; Debenedetti, P. G.Liquid-Liquid Transition in ST2 Water. J. Chem. Phys. 2012, 137,214505.(118) Liu, Y.; Panagiotopoulos, A. Z.; Debenedetti, P. G. Low-Temperature Fluid-Phase Behavior of ST2 Water. J. Chem. Phys. 2009,131, 104508.(119) Palmer, J. C.; Martelli, F.; Liu, Y.; Car, R.; Panagiotopoulos, A.Z.; Debenedetti, P. G. Metastable Liquid-Liquid Transition in aMolecular Model of Water. Nature 2014, 510, 385−388.(120) Harrington, S.; Poole, P. H.; Sciortino, F.; Stanley, H. E.Equation of State of Supercooled Water Simulated using the ExtendedSimple Point Charge Intermolecular Potential. J. Chem. Phys. 1997, 107,7443−7450.(121) Yamada, M.; Mossa, S.; Stanley, H. E.; Sciortino, F. Interplaybetween Time- Temperature-Transformation and the Liquid-LiquidPhase Transition in Water. Phys. Rev. Lett. 2002, 88, 195701.(122) Poole, P. H.; Saika-Voivod, I.; Sciortino, F. Density Minimumand Liquid-Liquid Phase Transition. J. Phys.: Condens. Matter 2005, 17,L431−L437.(123) Paschek, D. How the Liquid-Liquid Transition AffectsHydrophobic Hydration in Deeply Supercooled Water. Phys. Rev. Lett.2005, 94, 217802.(124) Paschek, D.; Ruppert, A.; Geiger, A. Thermodynamic andStructural Characterization of the Transformation from a MetastableLow-Density to a Very High-Density Form of Supercooled TIP4P-EwModel Water. ChemPhysChem 2008, 9, 2737−2741.(125) Meyer, M.; Stanley, H. E. Liquid-Liquid Phase Transition inConfined Water: A Monte-Carlo Study. J. Phys. Chem. B 1999, 103,9728−9730.(126) Stokely, K.; Mazza, M. G.; Stanley, H. E.; Franzese, G. Effect ofHydrogen Bond Cooperativity on the Behavior of Water. Proc. Natl.Acad. Sci. U. S. A. 2010, 107, 1301−1306.(127) Li, Y.; Li, J.; Wang, F. Liquid-Liquid Transition in SupercooledWater Suggested byMicrosecond Simulations. Proc. Natl. Acad. Sci. U. S.A. 2013, 110, 12209−12212.
Chemical Reviews Review
DOI: 10.1021/acs.chemrev.5b00750Chem. Rev. 2016, 116, 7463−7500
7494

(128) Corsetti, F.; Artacho, E.; Soler, J. M.; Alexandre, S. S.;Fernandez-Serra, M.-V. Room Temperature Compressibility and theDiffusivity Anomaly of LiquidWater from First Principles. J. Chem. Phys.2013, 139, 194502.(129) Jeffery, C. A.; Austin, P. H. A New Analytic Equation of State forLiquid Water. J. Chem. Phys. 1999, 110, 484−496.(130) Kiselev, S. B. Physical Limit of Stability in Supercooled Liquids.Int. J. Thermophys. 2001, 22, 1421−1433.(131) Kiselev, S. B.; Ely, J. F. Parametric Crossover Model and PhysicalLimit of Stability in SupercooledWater. J. Chem. Phys. 2002, 116, 5657−5665.(132) Kalova, J.; Mares, R. Crossover Equation and the Vapor Pressureof Supercooled Water. Int. J. Thermophys. 2010, 31, 756−765.(133) Corradini, D.; Rovere, M.; Gallo, P. A Route to ExplainWaterAnomalies from Results on an Aqueous Solution of Salt. J. Chem. Phys.2010, 132, 134508.(134) Cuthbertson, M. J.; Poole, P. H. Mixturelike Behavior Near aLiquid-Liquid Phase Transition in Simulations of Supercooled Water.Phys. Rev. Lett. 2011, 106, 115706.(135) Moore, E. B.; Molinero, V. Structural Transformation inSupercooled Water Controls the Crystallization Rate of Ice. Nature2011, 479, 506−508.(136)Holten, V.; Limmer, D. T.;Molinero, V.; Anisimov,M. A. Natureof the Anomalies in Supercooled Liquid State of the mW Model ofWater. J. Chem. Phys. 2013, 138, 174501.(137) Xu, L.; Buldyrev, S. V.; Angell, C. A.; Stanley, H. E.Thermodynamics and Dynamics of the Two-Scale SphericallySymmetric Jagla Ramp Model of Anomalous Liquids. Phys. Rev. E2006, 74, 031108.(138) Gallo, P.; Sciortino, F. Ising Universality Class for the Liquid-Liquid Critical Point of a One Component Fluid: A Finite-Size ScalingTest. Phys. Rev. Lett. 2012, 109, 177801.(139) Franzese, G.; Malescio, G.; Skibinsky, A.; Buldyrev, S. V.;Stanley, H. E. Generic Mechanism for Generating a Liquid-Liquid PhaseTransition. Nature 2001, 409, 692−695.(140) Smallenburg, F.; Filion, L.; Sciortino, F. Erasing No-Man’s Landby Thermodynamically Stabilizing the Liquid-Liquid Transition inTetrahedral Particles. Nat. Phys. 2014, 10, 653−657.(141) Saika-Voivod, I.; Sciortino, F.; Poole, P. H. ComputerSimulations of Liquid Silica: Equation of State and Liquid-LiquidPhase Transition. Phys. Rev. E: Stat. Phys., Plasmas, Fluids, Relat.Interdiscip. Top. 2000, 63, 011202.(142) Vasisht, V. V.; Saw, S.; Sastry, S. Liquid-Liquid Critical Point inSupercooled Silicon. Nat. Phys. 2011, 7, 549−553.(143) Glosli, J. N.; Ree, F. H. Liquid-Liquid Phase Transformation inCarbon. Phys. Rev. Lett. 1999, 82, 4659−4662.(144) Li, R. Z.; Chen, J.; Li, X. Z.; Wang, E. G.; Xu, L. SupercriticalPhenomenon of Hydrogen Beyond the Liquid-Liquid Phase Transition.New J. Phys. 2015, 17, 063023.(145) Stillinger, F. H.; Rahman, A. Improved Simulation of LiquidWater by Molecular Dynamics. J. Chem. Phys. 1974, 60, 1545−1557.(146) Poole, P. H.; Bowles, R. K.; Saika-Voivod, I.; Sciortino, F. FreeEnergy Surface of ST2 Water Near the Liquid-Liquid Phase Transition.J. Chem. Phys. 2013, 138, 034505.(147) Molinero, V.; Moore, E. B. Water Modeled As an IntermediateElement Between Carbon and Silicon. J. Phys. Chem. B 2009, 113,4008−4016.(148) Yagasaki, T.; Matsumoto, M.; Tanaka, H. Spontaneous Liquid-Liquid Phase Separation of Water. Phys. Rev. E 2014, 89, 020301.(149) Overduin, S. D.; Patey, G. N. Fluctuations and Local IceStructure in Model Supercooled Water. J. Chem. Phys. 2015, 143,094504.(150) Kesselring, T. A.; Franzese, G.; Buldyrev, S. V.; Herrmann, H. J.;Stanley, H. E. Nanoscale Dynamics of Phase Flipping in Water near itsHypothesized Liquid-Liquid Critical Point. Sci. Rep. 2012, 2, 474.(151) Kesselring, T. A.; Lascaris, E.; Franzese, G.; Buldyrev, S. V.;Herrmann, H. J.; Stanley, H. E. Finite-Size Scaling Investigation of theLiquid-Liquid Critical Point in ST2 Water and its Stability with Respectto Crystallization. J. Chem. Phys. 2013, 138, 244506.
(152) Ghiringhelli, L. M.; Valeriani, C.; Los, J.; Meijer, E.; Fasolino, A.;Frenkel, D. State-of-the-Art Models for the Phase Diagram of Carbonand Diamond Nucleation. Mol. Phys. 2008, 106, 2011−2038.(153) Smallenburg, F.; Sciortino, F. Tuning the Liquid-LiquidTransition by Modulating the Hydrogen-Bond Angular Flexibility in aModel for Water. Phys. Rev. Lett. 2015, 115, 015701.(154) Singh, R. S.; Biddle, J. W.; Debenedetti, P.; Anisimov, M. A.Two-State Thermodynamics and the Possibility of a Liquid-LiquidPhase Transition in Supercooled TIP4P/2005 Water. J. Chem. Phys.2016, 144, 144504.(155) Palmer, J. C.; Martelli, F.; Liu, Y.; Car, R.; Panagiotopoulos, A.Z.; Debenedetti, P. G. Response to “Comment [arXiv:1407.6854] onPalmer et al. Nature 2014, 510, 385. arXiv:1407.7884 [cond-mat.stat-mech], 2014(156) Tanaka, H. Thermodynamic Anomaly and Polyamorphism ofWater. Europhys. Lett. 2000, 50, 340−346.(157) Tanaka, H. Importance of Many-Body Orientational Correla-tions in the Physical Description of Liquids. Faraday Discuss. 2014, 167,9−76.(158) Jagla, E. A. Core-Softened Potentials and the AnomalousProperties of Water. J. Chem. Phys. 1999, 111, 8980−8986.(159) Biddle, J. W.; Holten, V.; Anisimov, M. A. Behavior ofSupercooled Aqueous Solutions Stemming from Hidden Liquid-LiquidTransition in Water. J. Chem. Phys. 2014, 141, 074504.(160) Woodcock, L. V.; Angell, C. A.; Cheeseman, P. MolecularDynamics Studies of the Vitreous State: Simple Ionic Systems and Silica.J. Chem. Phys. 1976, 65, 1565−1577.(161) Lascaris, E. Tunable Liquid-Liquid Critical Point in an IonicModel of Silica. Phys. Rev. Lett. 2016, 116, 125701.(162) Lascaris, E.; Hemmati, M.; Buldyrev, S. V.; Stanley, H. E.; Angell,C. A. A. Search for a Liquid-Liquid Critical Point in Models of Silica. J.Chem. Phys. 2014, 140, 224502.(163) Holten, V.; Palmer, J. C.; Poole, P. H.; Debenedetti, P. G.;Anisimov, M. A. Two-State Thermodynamics of the ST2 model forSupercooled Water. J. Chem. Phys. 2014, 140, 104502.(164) Tu, Y.; Buldyrev, S. V.; Liu, Z.; Fang, H.; Stanley, H. E. DifferentWater Scenarios for a Primitive Model with Two Types of HydrogenBonds. Europhys. Lett. 2012, 97, 56005.(165) Ponyatovsky, E. G.; Sinitsyn, V. V.; Pozdnyakova, T. A. TheMetastable T-P Phase Diagram and Anomalous ThermodynamicProperties of Supercooled Water. J. Chem. Phys. 1998, 109, 2413−2422.(166) Moynihan, C. T. Two Species/Nonideal Solution Model forAmorphous/Amorphous Phase Transitions. MRS Online Proc. Libr.1996, 455, 411.(167) Holten, V.; Sengers, J. V.; Anisimov, M. A. Equation of State forSupercooled Water at Pressures up to 400 MPa. J. Phys. Chem. Ref. Data2014, 43, 043101.(168) Hare, D. E.; Sorensen, C. M. The Density of SupercooledWater.II. Bulk Samples Cooled to the Homogeneous Nucleation Limit. J.Chem. Phys. 1987, 87, 4840−4845.(169) Sotani, T.; Arabas, J.; Kubota, H. Volumetric Behaviour ofWaterunder High Pressure at Subzero Temperature. High Temp. - HighPressures 2000, 32, 433.(170) Abascal, J. L. F.; Vega, C. A General Purpose Model for theCondensed Phases of Water. J. Chem. Phys. 2005, 123, 234505.(171) Overduin, S. D.; Patey, G. N. An Analysis of Fluctuations inSupercooled TIP4P/2005 Water. J. Chem. Phys. 2013, 138, 184502.(172) McMillan, P. F. Polyamorphic Transformations in Liquids andGlasses. J. Mater. Chem. 2004, 14, 1506−1512.(173) Wilding, M. C.; Wilson, M.; McMillan, P. F. Structural Studiesand Polymorphism in Amorphous Solids and Liquids at High Pressure.Chem. Soc. Rev. 2006, 35, 964−986.(174) Tanaka, H. General View of a Liquid-Liquid Phase Transition.Phys. Rev. E: Stat. Phys., Plasmas, Fluids, Relat. Interdiscip. Top. 2000, 62,6968−6976.(175) In Advances in Chemical Physics; Stanley, H. E., Ed.; Wiley: NewYork, 2013; Vol. 152.(176) Nilsson, A.; Huang, C.; Pettersson, L. G. M. Fluctuations inAmbient Water. J. Mol. Liq. 2012, 176, 2−16.
Chemical Reviews Review
DOI: 10.1021/acs.chemrev.5b00750Chem. Rev. 2016, 116, 7463−7500
7495

(177) Taschin, A.; Bartolini, P.; Eramo, R.; Righini, R.; Torre, R.Evidence of Two Distinct Local Structures of Water from Ambient toSupercooled Conditions. Nat. Commun. 2013, 4, 2401.(178) Sellberg, J. A.; et al. Ultrafast X-ray Probing of Water StructureBelow the Homogeneous Ice Nucleation Temperature. Nature 2014,510, 381−384.(179) Wernet, P.; Nordlund, D.; Bergmann, U.; Ogasawara, H.;Cavalleri, M.; Naslund, L.-Å.; Hirsch, T. K.; Ojamae, L.; Glatzel, P.;Odelius, M.; Pettersson, L. G. M.; Nilsson, A. The Structure of the FirstCoordination Shell in Liquid Water. Science 2004, 304, 995−999.(180) Tokushima, T.; Harada, Y.; Takahashi, O.; Senba, Y.; Ohashi, H.;Pettersson, L. G. M.; Nilsson, A.; Shin, S. High Resolution X-rayEmission Spectroscopy of Liquid Water: The Observation of TwoStructural Motifs. Chem. Phys. Lett. 2008, 460, 387−400.(181) Tokushima, T.; Harada, Y.; Horikawa, Y.; Takahashi, O.; Senba,Y.; Ohashi, H.; Pettersson, L. G. M.; Nilsson, A.; Shin, S. HighResolution X-ray Emission Spectroscopy of Water and Its AssignmentBased on Two Structural Motifs. J. Electron Spectrosc. Relat. Phenom.2010, 177, 192−205.(182) Harada, Y.; Tokushima, T.; Horikawa, Y.; Takahashi, O.; Niwa,H.; Kobayashi, M.; Oshima, M.; Senba, Y.; Ohashi, H.; Wikfeldt, K. T.;Nilsson, A.; Pettersson, L. G. M.; Shin, S. Selective Probing of OH/ODStretch Vibrations in Liquid Water Using Resonant Inelastic Soft X-rayScattering. Phys. Rev. Lett. 2013, 111, 193001.(183) Huang, C.; et al. The Inhomogeneous Structure of Water atAmbient Conditions. Proc. Natl. Acad. Sci. U. S. A. 2009, 106, 15214−15218.(184) Huang, C.; Weiss, T. M.; Nordlund, D.; Wikfeldt, K. T.;Pettersson, L. G. M.; Nilsson, A. Increasing Correlation Length in BulkSupercooled H2O, D2O and NaCl Solution Determined from SmallAngle X-ray Scattering. J. Chem. Phys. 2010, 133, 134504.(185) Huang, C.; et al. Reply to Soper “Fluctuations in Water around aBimodal Distribution of Local Hydrogen Bonded Structural Motifs.Proc. Natl. Acad. Sci. U. S. A. 2010, 107, E45.(186) Soper, A. K.; Teixeira, J.; Head-Gordon, T. Is Ambient WaterInhomogeneous on the Nanometer-Length Scale? Proc. Natl. Acad. Sci.U. S. A. 2010, 107, E44.(187) Clark, G. N. I.; Hura, G. L.; Teixeira, J.; Soper, A. K.; Head-Gordon, T. Small-Angle Scattering and the Structure of Ambient LiquidWater. Proc. Natl. Acad. Sci. U. S. A. 2010, 107, 14003−14007.(188) Overduin, S. D.; Patey, G. N. Understanding the StructureFactor and Isothermal Compressibility of Ambient Water in Terms ofLocal Structural Environments. J. Phys. Chem. B 2012, 116, 12014−12020.(189) Myneni, S.; Luo, Y.; Naslund, L.-Å.; Cavalleri, M.; Ojamae, L.;Ogasawara, H.; Pelmenschikov, A.; Wernet, P.; Vaterlein, P.; Heske, C.;Hussain, Z.; Pettersson, L. G. M.; Nilsson, A. Spectroscopic Probing ofLocal Hydrogen Bonding Structures in Liquid Water. J. Phys.: Condens.Matter 2002, 14, L213−L219.(190) Nilsson, A.; Nordlund, D.; Waluyo, I.; Huang, N.; Ogasawara,H.; Kaya, S. H.; Bergmann, U.; Naslund, L.-Å.; Ostrom, H.; Wernet, P.;Andersson, K.; Schiros, T.; Pettersson, L. G. M. X-ray AbsorptionSpectroscopy and X-ray Raman Scattering of Water: An ExperimentalView. J. Electron Spectrosc. Relat. Phenom. 2010, 177, 99−129.(191) Chen, W.; Wu, X.; Car, R. X-ray Absorption Signatures of theMolecular Environment in Water and Ice. Phys. Rev. Lett. 2010, 105,017802.(192) Nordlund, D.; Ogasawara, H.; Andersson, K. J.; Tatarkhanov,M.; Salmeron, M.; Pettersson, L. G. M.; Nilsson, A. Sensitivity of X-rayAbsorption Spectroscopy to Hydrogen Bond Topology. Phys. Rev. B:Condens. Matter Mater. Phys. 2009, 80, 233404.(193) Kuhne, T. D.; Khaliullin, R. Z. Electronic Signature of theInstantaneous Asymmetry in the First Coordination Shell in LiquidWater. Nat. Commun. 2013, 4, 1450.(194) Clark, G. N. I.; Cappa, C. D.; Smith, J. D.; Saykally, R. J.; Head-Gordon, T. The Structure of Ambient Water. Mol. Phys. 2010, 108,1415−1433.(195) Fernandez-Serra, M.-V.; Artacho, E. Electrons and Hydrogen-Bond Connectivity in Liquid Water. Phys. Rev. Lett. 2006, 96, 016404.
(196) Soper, A. K. Recent Water Myths. Pure Appl. Chem. 2010, 82,1855−1867.(197) Pettersson, L. G. M.; Nilsson, A. The Structure of Water fromAmbient to Deeply Supercooled. J. Non-Cryst. Solids 2015, 407, 399−417.(198) Fuchs, O.; Zharnikov, M.; Weinhardt, L.; Blum, M.; Weigand,M.; Zubavichus, Y.; Bar, M.; Maier, F.; Denlinger, J. D.; Heske, C.;Grunze, M.; Umbach, E. Isotope and Temperature Effects in LiquidWater Probed by X-ray Absorption and Resonant X-ray EmissionSpectroscopy. Phys. Rev. Lett. 2008, 100, 027801.(199) Weinhardt, L.; Benkert, A.; Meyer, F.; Blum, M.; Wilks, R. G.;Yang, W.; Bar, M.; Reinert, F.; Heske, C. Nuclear Dynamics andSpectator Effects in Resonant Inelastic Soft X-ray Scattering of Gas-Phase Water Molecules. J. Chem. Phys. 2012, 136, 144311.(200) Lange, K. M.; Konnecke, R.; Ghadimi, S.; Golnak, R.; Soldatov,M. A.; Hodeck, K. F.; Soldatov, A.; Aziz, E. F. High Resolution X-rayEmission Spectroscopy of Water and Aqueous Ions Using the Micro-JetTechnique. Chem. Phys. 2010, 377, 1−5.(201) Lange, K. M.; Soldatov, M.; Golnak, R.; Gotz, M.; Engel, N.;Konnecke, R.; Rubensson, J.-E.; Aziz, E. F. X-ray Emission from Pureand Dilute H2O and D2O in a Liquid Microjet: Hydrogen Bonds andNuclear Dynamics. Phys. Rev. B: Condens. Matter Mater. Phys. 2012, 85,155104.(202) Pettersson, L. G. M.; Tokushima, T.; Harada, Y.; Takahashi, O.;Shin, S.; Nilsson, A. Comment on “Isotope and Temperature Effects inLiquidWater Probed by X-ray Absorption and Resonant X-ray EmissionSpectroscopy. Phys. Rev. Lett. 2008, 100, 249801.(203) Fuchs, O.; Zharnikov, M.; Weinhardt, L.; Blum, M.; Weigand,M.; Zubavichus, Y.; Bar, M.; Maier, F.; Denlinger, J. D.; Heske, C.;Grunze, M.; Umbach, E. Reply to Comment on “Isotope andTemperature Effects in Liquid Water Probed by X-Ray Absorptionand Resonant X-Ray Emission Spectroscopy. Phys. Rev. Lett. 2008, 100,249802.(204) Nilsson, A.; Tokushima, T.; Horikawa, Y.; Harada, Y.;Ljungberg, M. P.; Shin, S.; Pettersson, L. G. M. Resonant Inelastic X-ray Scattering of Water. J. Electron Spectrosc. Relat. Phenom. 2013, 188,84−100.(205) Gilberg, E.; Hanus, M. J.; Foltz, B. Investigation of the ElectronicStructure of Ice by High Resolution X-ray Spectroscopy. J. Chem. Phys.1982, 76, 5093−5097.(206) Mayer, E. Hyperquenching of Water and Dilute AqueousSolutions into Their Glassy States: An Approach to Cryofixation. Cryo-Lett. 1988, 9, 66−77.(207) Mayer, E. New Method for Vitrifying Water and Other Liquidsby Rapid Cooling of Their Aerosols. J. Appl. Phys. 1985, 58, 663−667.(208) Mayer, E.; Bruggeller, P. Vitrification of Pure Liquid Water byHigh Pressure Jet Freezing. Nature 1982, 298, 715−718.(209) Bruggeller, P.; Mayer, E. Complete Vitrification in Pure LiquidWater and Dilute Aqueous Solutions. Nature 1980, 288, 569−571.(210) Bowron, D. T.; Finney, J. L.; Hallbrucker, A.; Kohl, I.; Loerting,T.; Mayer, E.; Soper, A. K. The Local and Intermediate Range Structuresof the Five Amorphous Ices at 80K and Ambient Pressure: A Faber-Ziman and Bhatia-Thornton Analysis. J. Chem. Phys. 2006, 125, 194502.(211) Limmer, D. T.; Chandler, D. Time Scales of Supercooled Waterand Implications for Reversible Polyamorphism. Mol. Phys. 2015, 113,2799−2804.(212) Kobayashi, M.; Tanaka, H. Relationship Between the PhaseDiagram, the Glass-Forming Ability, and the Fragility of a Water/SaltMixture. J. Phys. Chem. B 2011, 115, 14077−14090.(213) Kobayashi, M.; Tanaka, H. Possible Link of the V-Shaped PhaseDiagram to the Glass- Forming Ability and Fragility in a Water-SaltMixture. Phys. Rev. Lett. 2011, 106, 125703.(214) Torquato, S.; Truskett, T. M.; Debenedetti, P. G. Is RandomClose Packing of SpheresWell Defined? Phys. Rev. Lett. 2000, 84, 2064−2067.(215) Errington, J. R.; Debenedetti, P. G. Relationship BetweenStructural Order and the Anomalies of Liquid Water. Nature 2001, 409,318−321.
Chemical Reviews Review
DOI: 10.1021/acs.chemrev.5b00750Chem. Rev. 2016, 116, 7463−7500
7496

(216) Russo, J.; Tanaka, H. Understanding Water’s Anomalies withLocally Favoured Structures. Nat. Commun. 2014, 5, 3556.(217) Shiratani, E.; Sasai, M. Growth and Collapse of StructuralPatterns in the Hydrogen Bond Network in LiquidWater. J. Chem. Phys.1996, 104, 7671−7680.(218) Shiratani, E.; Sasai, M. Molecular Scale Precursor of the Liquid-Liquid Phase Transition ofWater. J. Chem. Phys. 1998, 108, 3264−3276.(219) Appignanesi, G. A.; Rodriguez Fris, J. A.; Sciortino, F. Evidenceof a Two-State Picture for Supercooled Water and its Connections withGlassy Dynamics. Eur. Phys. J. E: Soft Matter Biol. Phys. 2009, 29, 305−310.(220) Wikfeldt, K. T.; Nilsson, A.; Pettersson, L. G. M. SpatiallyInhomogeneous Bimodal Inherent Structure in Simulated LiquidWater.Phys. Chem. Chem. Phys. 2011, 13, 19918−19924.(221) Accordino, S. R.; Rodriguez Fris, J. A.; Sciortino, F.; Appignanesi,G. A. Quantitative Investigation of the Two-State Picture for Water inthe Normal Liquid and the Supercooled Regime. Eur. Phys. J. E: SoftMatter Biol. Phys. 2011, 34, 48.(222) Russo, J.; Tanaka, H. The Microscopic Pathway toCrystallization in Supercooled Liquids. Sci. Rep. 2012, 2, 505.(223) Debenedetti, P. G.; Stillinger, F. H. Supercooled Liquids and theGlass Transition. Nature 2001, 410, 259−267.(224) Fraux, G.; Doye, J. P. K. Note: Heterogeneous Ice Nucleation onSilver-Iodide-Like Surfaces. J. Chem. Phys. 2014, 141, 216101.(225) Atkinson, J. D.; Murray, B. J.; Woodhouse, M. T.; Whale, T. F.;Baustian, K. J.; Carslaw, K. S.; Dobbie, S.; O’Sullivan, D.; Malkin, T. L.The Importance of Feldspar for Ice Nucleation by Mineral Dust inMixed-Phase Clouds. Nature 2013, 498, 355−358.(226) Cwilong, B. M. Sublimation in a Wilson Chamber. Proc. R. Soc.London, Ser. A 1947, 190, 137−143.(227) Mossop, S. C. The Freezing of Supercooled Water. Proc. Phys.Soc., London, Sect. B 1955, 68, 193−208.(228) Mason, B. J. The Supercooling and Nucleation of Water. Adv.Phys. 1958, 7, 221−234.(229) Kelton, K. F. Crystal Nucleation in Liquids and Glasses. SolidState Phys. 1991, 45, 75−177.(230) Auer, S.; Frenkel, D. Numerical Prediction of AbsoluteCrystallization Rates in Hard- Sphere Colloids. J. Chem. Phys. 2004,120, 3015−3029.(231) Valeriani, C.; Sanz, E.; Frenkel, D. Rate of Homogeneous CrystalNucleation in Molten NaCl. J. Chem. Phys. 2005, 122, 194501.(232) Hardy, S. C. A Grain Boundary Groove Measurement of theSurface Tension Between Ice and Water. Philos. Mag. 1977, 35, 471−484.(233) Granasy, L.; Pusztai, T.; James, P. F. Interfacial PropertiesDeduced from Nucleation Experiments: A Cahn-Hilliard analysis. J.Chem. Phys. 2002, 117, 6157−6168.(234) Sanz, E.; Vega, C.; Espinosa, J. R.; Caballero-Bernal, R.; Abascal,J. L. F.; Valeriani, C. Homogeneous Ice Nucleation at ModerateSupercooling from Molecular Simulation. J. Am. Chem. Soc. 2013, 135,15008.(235) Espinosa, J. R.; Sanz, E.; Valeriani, C.; Vega, C. HomogeneousIce Nucleation Evaluated for Several Water Models. J. Chem. Phys. 2014,141, 18C529.(236) Matsumoto, M.; Saito, S.; Ohmine, I. Molecular DynamicsSimulation of the Ice Nucleation and Growth Process Leading to WaterFreezing. Nature 2002, 416, 409−413.(237) Radhakrishnan, R.; Trout, B. L. Nucleation of Crystalline Phasesof Water in Homogeneous and Inhomogeneous Environments. Phys.Rev. Lett. 2003, 90, 158301.(238) Quigley, D.; Rodger, P. M. Metadynamics Simulations of IceNucleation and Growth. J. Chem. Phys. 2008, 128, 154518.(239) Brukhno, A. V.; Anwar, J.; Davidchack, R.; Handel, R. Challengesin Molecular Simulation of Homogeneous Ice Nucleation. J. Phys.:Condens. Matter 2008, 20, 494243.(240) Reinhardt, A.; Doye, J. P. K. Free Energy Landscapes forHomogeneous Nucleation of Ice for a Monatomic Water Model. J.Chem. Phys. 2012, 136, 054501.
(241) Li, T.; Donadio, D.; Russo, G.; Galli, G. Homogeneous IceNucleation from Supercooled Water. Phys. Chem. Chem. Phys. 2011, 13,19807−19813.(242) Russo, J.; Romano, F.; Tanaka, H. New Metastable Form of Iceand Its Role in the Homogeneous Crystallization of Water. Nat. Mater.2014, 13, 733−739.(243) Stan, C. A.; Schneider, G. F.; Shevkoplyas, S. S.; Hashimoto, M.;Ibanescu, M.;Wiley, B. J.; Whitesides, G.M. AMicro uidic Apparatus forthe Study of Ice Nucleation in Supercooled Water Drops. Lab Chip2009, 9, 2293−2305.(244) Riechers, B.; Wittbracht, F.; Hutten, A.; Koop, T. TheHomogeneous Ice Nucleation Rate ofWater Droplets Produced in aMicro uidic Device and the Role of Temperature Uncertainty. Phys.Chem. Chem. Phys. 2013, 15, 5873−5887.(245) Stockel, P.; Weidinger, I. M.; Baumgartel, H.; Leisner, T. Rates ofHomogeneous Ice Nucleation in Levitated H2O and D2O droplets. J.Phys. Chem. A 2005, 109, 2540−2546.(246) Murray, B. J.; Broadley, S. L.; Wilson, T. W.; Bull, S. J.; Wills, R.H.; Christenson, H. K.; Murray, E. J. Kinetics of the HomogeneousFreezing of Water. Phys. Chem. Chem. Phys. 2010, 12, 10380−10387.(247) Hagen, D. E.; Anderson, R. J.; Kassner, J. L. HomogeneousCondensation-Freezing Nucleation Rate Measurements for SmallWater Droplets in an Expansion Cloud Chamber. J. Atmos. Sci. 1981,38, 1236−1243.(248) Laksmono, H.; et al. Anomalous Behavior of the HomogeneousIce Nucleation Rate in “No-Man’s Land. J. Phys. Chem. Lett. 2015, 6,2826−2832.(249) Huang, J. F.; Bartell, L. S. Kinetics of Homogeneous Nucleationin the Freezing of Large Water Clusters. J. Phys. Chem. 1995, 99, 3924−3931.(250) Bhabhe, A.; Pathak, H.;Wyslouzil, B. E. Freezing of HeavyWater(D2O) Nanodroplets. J. Phys. Chem. A 2013, 117, 5472−5482.(251) Jenniskens, P.; Blake, D. F. Crystallization of Amorphous WaterIce in the Solar System. Astrophys. J. 1996, 473, 1104−1113.(252) Safarik, D. J.; Mullins, C. B. The Nucleation Rate of CrystallineIce in Amorphous Solid Water. J. Chem. Phys. 2004, 121, 6003−6010.(253)Hage,W.; Hallbrucker, A.;Mayer, E.; Johari, G. P. CrystallizationKinetics of Water Below 150 K. J. Chem. Phys. 1994, 100, 2743−2747.(254) Hage, W.; Hallbrucker, A.; Mayer, E.; Johari, G. P. Kinetics ofCrystallizing D2O Water near 150 K by Fourier Transform InfraredSpectroscopy and a Comparison with the Corresponding CalorimetricStudies on H2O Water. J. Chem. Phys. 1995, 103, 545−550.(255) Pruppacher, H. R. A New Look at Homogeneous Ice Nucleationin Supercooled Water Drops. J. Atmos. Sci. 1995, 52, 1924−1933.(256) Manka, A.; Pathak, H.; Tanimura, S.; Wolk, J.; Strey, R.;Wyslouzil, B. E. Freezing Water in No-Man’s Land. Phys. Chem. Chem.Phys. 2012, 14, 4505−4516.(257) Bresme, F.; Biddle, J. W.; Sengers, J. V.; Anisimov, M. A.Communication: Minimum in the Thermal Conductivity of Super-cooled Water: A Computer Simulation Study. J. Chem. Phys. 2014, 140,161104.(258) McMillan, J. A.; Los, S. C. Vitreous Ice: IrreversibleTransformations During Warm-Up. Nature 1965, 206, 806−807.(259) Rozmanov, D.; Kusalik, P. G. Temperature Dependence ofCrystal Growth of Hexagonal Ice (Ih). Phys. Chem. Chem. Phys. 2011, 13,15501−15511.(260) Avrami, M. Kinetics of Phase Change. I General Theory. J. Chem.Phys. 1939, 7, 1103−1112.(261) Abascal, J. L. F.; Vega, C. Note: Equation of State andCompressibility of Supercooled Water: Simulations and Experiment. J.Chem. Phys. 2011, 134, 186101.(262) Wikfeldt, K. T.; Huang, C.; Nilsson, A.; Pettersson, L. G. M.Enhanced Small-Angle Scattering Connected to the Widom Line inSimulations of Supercooled Water. J. Chem. Phys. 2011, 134, 214506.(263) Berg, B. A.; Dubey, S. Finite Volume Kolmogorov-Johnson-Mehl-Avrami Theory. Phys. Rev. Lett. 2008, 100, 165702.(264) Ostwald, W. Studienuber die Bildung und Umwandlung festerKorper. Z. Phys. Chem. 1897, 22, 289−330.
Chemical Reviews Review
DOI: 10.1021/acs.chemrev.5b00750Chem. Rev. 2016, 116, 7463−7500
7497

(265) van Santen, R. A. The Ostwald Step Rule. J. Phys. Chem. 1984,88, 5768−5769.(266) Gallo, P.; Sciortino, F.; Tartaglia, P.; Chen, S.-H. Slow Dynamicsof Water Molecules in Supercooled States. Phys. Rev. Lett. 1996, 76,2730−2733.(267) Sciortino, F.; Gallo, P.; Tartaglia, P.; Chen, S.-H. SupercooledWater and the Kinetic Glass Transition. Phys. Rev. E: Stat. Phys., Plasmas,Fluids, Relat. Interdiscip. Top. 1996, 54, 6331−6343.(268) Gotze, W. Complex Dynamics of Glass-Forming Liquids: A Mode-Coupling Theory; Oxford University Press: Oxford, 2008.(269) Angell, C. A. Formation of Glasses from Liquids andBiopolymers. Science 1995, 267, 1924−1935.(270) Saika-Voivod, I.; Poole, P. H.; Sciortino, F. Fragile-to-StrongTransition and Polyamorphism in the Energy Landscape of LiquidSilica. Nature 2001, 412, 514−517.(271) Martinez, L. M.; Angell, C. A. A Thermodynamic Connection tothe Fragility of Glass-Forming Liquids. Nature 2001, 410, 663−667.(272) Sun, Q.; Zhou, C.; Yue, Y.; Hu, L. A Direct Link Between theFragile-to-Strong Transition and Relaxation in Supercooled Liquids. J.Phys. Chem. Lett. 2014, 5, 1170−1174.(273) Mallamace, F.; Branca, C.; Corsaro, C.; Leone, N.; Spooren, J.;Chen, S.-H.; Stanley, H. E. Transport Properties of Glass-FormingLiquids Suggest that Dynamic Crossover Temperature is as Importantas the Glass Transition Temperature. Proc. Natl. Acad. Sci. U. S. A. 2010,107, 22457−22462.(274) Prielmeier, F. X.; Lang, E. W.; Speedy, R. J.; Ludemann, H.-D.Diffusion in Supercooled Water to 300 MPa. Phys. Rev. Lett. 1987, 59,1128−1131.(275) Dehaoui, A.; Issenmann, B.; Caupin, F. Viscosity of DeeplySupercooled Water and Its Coupling to Molecular Diffusion. Proc. Natl.Acad. Sci. U. S. A. 2015, 112, 12020−12025.(276) Sokolov, A. P.; Hurst, J.; Quitmann, D. Dynamics ofSupercooled Water: Mode- Coupling Theory Approach. Phys. Rev. B:Condens. Matter Mater. Phys. 1995, 51, 12865−12868.(277) Torre, R.; Bartolini, P.; Righini, R. Structural Relaxation inSupercooled Water by Time-Resolved Spectroscopy. Nature 2004, 428,296−299.(278) Perakis, F.; Hamm, P. Two-Dimensional Infrared Spectroscopyof Supercooled Water. J. Phys. Chem. B 2011, 115, 5289−5293.(279) Bagchi, B. In Structural Glasses and Supercooled Liquids: Theory,Experiment, and Applications; Peter, G., Wolynes, P., Lubchenko, V.,Eds.; John Wiley and Sons: New Jersey, 2012.(280) Starr, F.W.; Nielsen, J.; Stanley, H. E. Fast and SlowDynamics ofHydrogen Bonds in Liquid Water. Phys. Rev. Lett. 1999, 82, 2294−2297.(281) Ito, K.; Moynihan, C. T.; Angell, C. A. ThermodynamicDetermination of Fragility in Liquids and a Fragile-to-Strong LiquidTransition in Water. Nature 1999, 398, 492−495.(282) Starr, F. W.; Sciortino, F.; Stanley, H. E. Dynamics of SimulatedWater under Pressure. Phys. Rev. E: Stat. Phys., Plasmas, Fluids, Relat.Interdiscip. Top. 1999, 60, 6757−6768.(283) Liu, L.; Chen, S. H.; Faraone, A.; Yen, C.-W.; Mou, C.-Y.Pressure Dependence of Fragile-to-Strong Transition and a PossibleSecond Critical Point in Supercooled Confined Water. Phys. Rev. Lett.2005, 95, 117802.(284) Xu, L.; Ehrenberg, I.; Buldyrev, S. V.; Stanley, H. E. RelationshipBetween the Liquid- Liquid Phase Transition and Dynamic Behavior inthe Jagla Model. J. Phys.: Condens. Matter 2006, 18, S2239−S2246.(285) Franzese, G.; Stanley, H. E. The Widom Line of SupercooledWater. J. Phys.: Condens. Matter 2007, 19, 205126.(286) Corradini, D.; Gallo, P. Liquid-Liquid Critical Point in NaClAqueous Solutions: Concentration Effects. J. Phys. Chem. B 2011, 115,14161−14166.(287) Corradini, D.; Buldyrev, S. V.; Gallo, P.; Stanley, H. E. Effects ofHydrophobic Solutes on the Liquid-Liquid Critical Point. Phys. Rev. E2010, 81, 061504.(288) Gallo, P.; Rovere, M. Mode Coupling and Fragile to StrongTransition in Supercooled TIP4P Water. J. Chem. Phys. 2012, 137,164503.
(289) De Marzio, M.; Camisasca, G.; Rovere, M.; Gallo, P. ModeCoupling Theory and Fragile to Strong Transition in SupercooledTIP4P/2005 Water. J. Chem. Phys. 2016, 144, 074503.(290) Corradini, D.; Gallo, P.; Buldyrev, S. V.; Stanley, H. E. Fragile toStrong Crossover Coupled to Liquid-Liquid Transition in HydrophobicSolutions. Phys. Rev. E 2012, 85, 051503.(291) Gallo, P.; Corradini, D.; Rovere, M. Fragile to Strong Crossoverat the Widom Line in Supercooled Aqueous Solutions of NaCl. J. Chem.Phys. 2013, 139, 204503.(292) Xu, L.; Mallamace, M.; Yan, Z.; Starr, F. W.; Buldyrev, S. V.;Stanley, H. E. Appearance of a Fractional Stokes-Einstein Relation inWater and a Structural Interpretation of Its Onset. Nat. Phys. 2009, 5,565−569.(293) Gallo, P.; Rovere, M.; Chen, S.-H. Dynamic Crossover inSupercooled Confined Water: Understanding Bulk Properties throughConfinement. J. Phys. Chem. Lett. 2010, 1, 729−733.(294) Gallo, P.; Rovere, M.; Chen, S.-H. Anomalous Dynamics ofWater Confined in MCM- 41 at Different Hydrations. J. Phys.: Condens.Matter 2010, 22, 284102.(295) Gallo, P.; Rovere, M.; Chen, S.-H. Water Confined in MCM-41:a Mode Coupling Theory Analysis. J. Phys.: Condens. Matter 2012, 24,064109.(296) Soper, A. K. Radical Re-Appraisal of Water Structure inHydrophilic Confinement. Chem. Phys. Lett. 2013, 590, 1−15.(297) Caupin, F. Escaping the NoMan’s land: Recent Experiments onMetastable Liquid Water. J. Non-Cryst. Solids 2015, 407, 441−448.(298) Green, H. S. The Molecular Theory of Fluids; North-Holland:Amsterdam, 1952.(299) Schlitter, J. Estimation of Absolute and Relative Entropies ofMacromolecules Using the Covariance Matrix. Chem. Phys. Lett. 1993,215, 617−621.(300) Andricioaei, I.; Karplus, M. On the Calculation of Entropy fromCovariance Matrices of the Atomic Fluctuations. J. Chem. Phys. 2001,115, 6289−6292.(301) Lin, S. T.; Blanco, M.; Goddard, W. A., III The Two-PhaseModel for Calculating Thermodynamic Properties of Liquids fromMolecular Dynamics: Validation for the Phase Diagram of Lennard-Jones Fluids. J. Chem. Phys. 2003, 119, 11792−11805.(302) Henchman, R. H.; Cockram, S. Water’s Non-Tetrahedral Side.Faraday Discuss. 2014, 167, 529−550.(303) Hensen, U.; Grater, F.; Henchman, R. H. MacromolecularEntropy can be Accurately Computed from Force. J. Chem. TheoryComput. 2014, 10, 4777−4781.(304) Henchman, R. H.; Irudayam, S. J. Hydrogen-Bond Definition toCharacterize the Structure and Dynamics of LiquidWater. J. Phys. Chem.B 2010, 114, 16792−16810.(305) Raveche, H. J. Entropy and Molecular Correlation Functions inOpen Systems. I. Derivation. J. Chem. Phys. 1971, 55, 2242−2250.(306) Mountain, R. D.; Raveche, H. J. Entropy and MolecularCorrelation Functions in Open Systems. II. Two- and Three-BodyCorrelations. J. Chem. Phys. 1971, 55, 2250−2255.(307) Wallace, D. C. On the Role of Density Fluctuations in theEntropy of a Fluid. J. Chem. Phys. 1987, 87, 2282−2285.(308) Baranyai, A.; Evans, D. Direct Entropy Calculation fromComputer Simulation of Liquids. Phys. Rev. A: At., Mol., Opt. Phys. 1989,40, 3817−3822.(309) Arisawa, T.; Arai, T.; Yokoyama, I. Pair and Triplet CorrelationEntropies Based on the Hard Sphere Solution of the Percus-YevickEquation. Phys. B 1999, 262, 190−198.(310) Errington, J. R.; Truskett, T. M.; Mittal, J. Excess-Entropy-BasedAnomalies for a Waterlike Fluid. J. Chem. Phys. 2006, 125, 244502.(311) Rosenfeld, Y. Relation Between the Transport Coeffcients andthe Internal Entropy of Simple Systems. Phys. Rev. A: At., Mol., Opt. Phys.1977, 15, 2545−2549.(312) Rosenfeld, Y. A Quasi-Universal Scaling Law for AtomicTransport in Simple Fluids. J. Phys.: Condens. Matter 1999, 11, 5415−5427.(313) Dzugutov, M. A Universal Scaling Law for Atomic Diffusion inCondensed Matter. Nature 1996, 381, 137−139.
Chemical Reviews Review
DOI: 10.1021/acs.chemrev.5b00750Chem. Rev. 2016, 116, 7463−7500
7498

(314) Hoyt, J. J.; Asta, M.; Sadigh, B. Test of the Universal Scaling Lawfor the Diffusion Coeffcient in Liquid Metals. Phys. Rev. Lett. 2000, 85,594−597.(315) Sharma, R.; Chakraborty, S. N.; Chakravarty, C. Entropy,Diffusivity, and Structural Order in Liquids with Waterlike Anomalies. J.Chem. Phys. 2006, 125, 204501.(316) Agarwal, M.; Singh, M.; Sharma, R.; Alam,M. P.; Chakravarty, C.Relationship between Structure, Entropy, and Diffusivity inWaterandWater-Like Liquids. J. Phys. Chem. B 2010, 114, 6995−7001.(317) Abramson, E. H. Viscosity ofWater Measured to Pressures of 6GPa and Temperatures of 300 °C. Phys. Rev. E 2007, 76, 051203.(318) Agarwal, M.; Chakravarty, C. Relationship between Structure,Entropy, and Mobility in Network-Forming Ionic Melts. Phys. Rev. E2009, 79, 030202.(319) de Oliveira, A. B.; Franzese, G.; Netz, P. A.; Barbosa, M. C.Waterlike Hierarchy of Anomalies in a Continuous SphericalShouldered Potential. J. Chem. Phys. 2008, 128, 064901.(320) Mittal, J.; Errington, J. R.; Truskett, T. M. Relationship betweenThermodynamics and Dynamics of Supercooled Liquids. J. Chem. Phys.2006, 125, 076102.(321) Krekelberg, W. P.; Kumar, T.; Mittal, J.; Errington, J. R.;Truskett, T. M. Anomalous Structure and Dynamics of the Gaussian-Core Fluid. Phys. Rev. E 2009, 79, 031203.(322) Goel, T.; Patra, C. N.; Mukherjee, T.; Chakravarty, C. ExcessEntropy Scaling of Transport Properties of Lennard-Jones Chains. J.Chem. Phys. 2008, 129, 164904.(323) Malvaldi, M.; Chiappe, C. Excess Entropy Scaling of Diffusion inRoom-Temperature Ionic Liquids. J. Chem. Phys. 2010, 132, 244502.(324) Chopra, R.; Truskett, T. M.; Errington, J. R. On the Use ofExcess Entropy Scaling to Describe the Dynamic Properties of Water. J.Phys. Chem. B 2010, 114, 10558−10566.(325) Chopra, R.; Truskett, T. M.; Errington, J. R. Excess EntropyScaling of Dynamic Quantities for Fluids of Dumbbell-Shaped Particles.J. Chem. Phys. 2010, 133, 104506.(326) Yan, Z.; Buldyrev, S. V.; Stanley, H. E. Relation of WaterAnomalies to the Excess Entropy. Phys. Rev. E 2008, 78, 051201.(327) Gallo, P.; Corradini, D.; Rovere, M. Excess Entropy ofWater in aSupercooled Solution of Salt. Mol. Phys. 2011, 109, 2969−2979.(328) Gallo, P.; Rovere, M. Relation Between the Two-Body Entropyand the Relaxation Time in Supercooled Water. Phys. Rev. E 2015, 91,012107.(329) Sastry, S.; Angell, C. A. Liquid-Liquid Phase Transition inSupercooled Silicon. Nat. Mater. 2003, 2, 739−743.(330)Molinero, V.; Sastry, S.; Angell, C. A. Tuning of Tetrahedrality ina Silicon Potential Yields a Series of Monatomic (Metal-like) GlassFormers of Very High Fragility. Phys. Rev. Lett. 2006, 97, 075701.(331) Bhat, M. H.; Molinero, V.; Soignard, E.; Solomon, V. C.; Sastry,S.; Yarger, J. L.; Angell, C. A. Vitrification of a Monatomic MetallicLiquid. Nature 2007, 448, 787−790.(332) Hujo, W.; Jabes, B. S.; Rana, V. K.; Chakravarty, C.; Molinero, V.The Rise and Fall of Anomalies in Tetrahedral Liquids. J. Stat. Phys.2011, 145, 293−312.(333) Singh, M.; Dhabal, D.; Nguyen, A. H.; Molinero, V.;Chakravarty, C. Triplet Correlations Dominate the Transition fromSimple to Tetrahedral Liquids. Phys. Rev. Lett. 2014, 112, 147801.(334) Dhabal, D.; Singh, M.; Wikfeldt, K. T.; Chakravarty, C. TripletCorrelation Functions in Liquid Water. J. Chem. Phys. 2014, 141,174504.(335) Gallo, P.; Corradini, D.; Rovere, M. Widom Line and DynamicalCrossovers: Routes to Understand Supercritical Water. Nat. Commun.2014, 5, 5806.(336) Simeoni, G. G.; Bryk, T.; Gorelli, F. A.; Krisch, M.; Ruocco, G.;Santoro, M.; Scopigno, T. The Widom Line as the Crossover betweenLiquid-like and Gas-like Behavior in Supercritical Fluids. Nat. Phys.2010, 6, 503−507.(337) Brazhkin, V. V.; Fomin, Y. D.; Lyapin, A. G.; Ryzhov, V. N.;Tsiok, E. N. Widom Line for the Liquid-Gas Transition in Lennard-Jones System. J. Phys. Chem. B 2011, 115, 14112−14115.
(338) Corradini, D.; Rovere, M.; Gallo, P. The Widom Line andDynamical Crossover in SupercriticalWater: PopularWater Modelsversus Experiments. J. Chem. Phys. 2015, 143, 114502.(339) Tanaka, H. A New Scenario of the Apparent Fragile-to-StrongTransition in Tetrahedral Liquids: Water as an Example. J. Phys.:Condens. Matter 2003, 15, L703−L711.(340) Kanno, H.; Speedy, R. J.; Angell, C. A. Supercooling of Water to−92 °C under Pressure. Science 1975, 189, 880−881.(341) Tanaka, H. A Self-Consistent Phase Diagram for SupercooledWater. Nature 1996, 380, 328−330.(342) Tanaka, H. Phase Behaviors of Supercooled Water: Reconcilinga Critical Point of Amorphous Ices with Spinodal Instability. J. Chem.Phys. 1996, 105, 5099−5111.(343) Caupin, F.; Herbert, E. Cavitation inWater: a Review. C. R. Phys.2006, 7, 1000−1017.(344) Caupin, F., Stroock, A. D. In Liquid Polymorphism; Stanley, H. E.,Rice, S., Eds.; Advances in Chemical Physics; Wiley: New York, 2013;Vol. 152.(345) Briggs, L. J. Limiting Negative Pressure of Water. J. Appl. Phys.1950, 21, 721−722.(346) Winnick, J.; Cho, S. J. PVT Behavior of Water at NegativePressures. J. Chem. Phys. 1971, 55, 2092−2097.(347) Henderson, S. J.; Speedy, R. J. Temperature of MaximumDensity inWater at Negative Pressure. J. Phys. Chem. 1987, 91, 3062−3068.(348) Henderson, S. J.; Speedy, R. J. Melting Temperature of Ice atPositive and Negative Pressures. J. Phys. Chem. 1987, 91, 3069−3072.(349) Green, J. L.; Durben, D. J.; Wolf, G. H.; Angell, C. A. Water andSolutions at Negative Pressure: Raman Spectroscopic Study to −80Megapascals. Science 1990, 249, 649−652.(350) Zheng, Q.; Durben, D. J.; Wolf, G. H.; Angell, C. A. Liquids atLarge Negative Pressures: Water at the Homogeneous NucleationLimit. Science 1991, 254, 829−832.(351) Zheng, Q. Liquids Under Tension and Glasses under Stress.Ph.D. Thesis, Purdue University, 1991.(352) Fisher, J. C. The Fracture of Liquids. J. Appl. Phys. 1948, 19,1062−1067.(353) Caupin, F. Liquid-Vapor Interface, Cavitation, and the PhaseDiagram ofWater. Phys. Rev. E 2005, 71, 051605.(354) Alvarenga, A. D.; Grimsditch, M.; Bodnar, R. J. Elastic Propertiesof Water under Negative Pressures. J. Chem. Phys. 1993, 98, 8392−8396.(355) Davitt, K.; Rolley, E.; Caupin, F.; Arvengas, A.; Balibar, S.Equation of State of Water Under Negative Pressure. J. Chem. Phys.2010, 133, 174507.(356) Wagner, W.; Pruß, A. The IAPWS Formulation 1995 for theThermodynamic Properties of Ordinary Water Substance for Generaland Scientific Use. J. Phys. Chem. Ref. Data 1999, 31, 387−535.(357) The International Association for the Properties of Water andSteam, Revised Release on the IAPWS Formulation 1995 for theThermodynamic Properties of Ordinary Water Substance for Generaland Scientific Use, 2009.(358) Bodnar, R. J.; Sterner, S. M. Synthetic Fluid Inclusions in NaturalQuartz I. Compositional Types Synthesized and Applications toExperimental Geochemistry. Geochim. Cosmochim. Acta 1984, 48,2659−2668.(359) Shmulovich, K. I.; Mercury, L.; Thiery, R.; Ramboz, C.; ElMekki, M. Experimental Superheating of Water and Aqueous Solutions.Geochim. Cosmochim. Acta 2009, 73, 2457−2470.(360) El Mekki Azouzi, M.; Ramboz, C.; Lenain, J.-F.; Caupin, F. ACoherent Picture of Water at Extreme Negative Pressure. Nat. Phys.2012, 9, 38−41.(361) Angell, C. A. SupercooledWater: Two Phases?Nat. Mater. 2014,13, 673−675.(362) Pallares, G.; Gonzalez, M. A.; Abascal, J. L. F.; Valeriani, C.;Caupin, F. Equation of State for Water and its Line of Density Maximadown to 120 MPa. Phys. Chem. Chem. Phys. 2016, 18, 5896−5900.(363) Corradini, D.; Strekalova, E.; Stanley, H. E.; Gallo, P.Microscopic Mechanism of Protein Cryopreservation in an AqueousSolution with Trehalose. Sci. Rep. 2013, 3, 1218.
Chemical Reviews Review
DOI: 10.1021/acs.chemrev.5b00750Chem. Rev. 2016, 116, 7463−7500
7499

(364) Gallo, P.; Rovere, M.; Spohr, E. Supercooled Confined Waterand the Mode Coupling Crossover Temperature. Phys. Rev. Lett. 2000,85, 4317.(365) Gallo, P.; Rovere, M.; Spohr, E. Glass Transition and LayeringEffect in Confined Water: a Computer Simulation study. J. Chem. Phys.2000, 113, 11324−11335.(366) Faraone, A.; Liu, L.; Mou, C.-Y.; Yen, C.-W.; Chen, S.-H. Fragile-to-Strong Liquid Transition in Deeply Supercooled Confined Water. J.Chem. Phys. 2004, 121, 10843−10846.(367) Luo, J.; Xu, L.; Lascaris, E.; Stanley, H. E.; Buldyrev, S. V.Behavior of the Widom Line in Critical Phenomena. Phys. Rev. Lett.2014, 112, 135701.(368) Kumar, P.; Wikfeldt, K. T.; Schlesinger, D.; Pettersson, L. G. M.;Stanley, H. E. The Boson Peak in Supercooled Water. Sci. Rep. 2013, 3,1980.(369) Kanno, H.; Angell, C. A. Homogeneous Nucleation and GlassFormation in Aqueous Alkali Halide Solutions at High Pressures. J. Phys.Chem. 1977, 81, 2639−2643.(370) Miyata, K.; Kanno, H.; Niino, T.; Tomizawa, K. Cationic andAnionic Effects on the Homogeneous Nucleation of Ice in AqueousAlkali Halide Solutions. Chem. Phys. Lett. 2002, 354, 51−55.(371) Miyata, K.; Kanno, H. Supercooling Behavior of AqueousSolutions of Alcohols and Saccharides. J. Mol. Liq. 2005, 119, 189−193.(372) Archer, D. G.; Carter, R. W. Thermodynamic Properties of theNaCl + H2O System. 4. Heat Capacities of H2O and NaCl(aq) in Cold-Stable and Supercooled States. J. Phys. Chem. B 2000, 104, 8563−8584.(373) Carter, R. W.; Archer, D. G. Heat Capacity of NaNO3(aq) inStable and Supercooled States. Ion Association in the SupercooledSolution. Phys. Chem. Chem. Phys. 2000, 2, 5138−5145.(374) Suzuki, Y.; Mishima, O. Two Distinct Raman Profiles of GlassyDilute LiCl Solution. Phys. Rev. Lett. 2000, 85, 1322−1325.(375) Mishima, O. Application of Polyamorphism in Water toSpontaneous Crystallization of Emulsified LiCl-H2O Solution. J. Chem.Phys. 2005, 123, 154506.(376) Mishima, O. Phase Separation in Dilute LiCl-H2O SolutionRelated to the Polyamorphism of Liquid Water. J. Chem. Phys. 2007,126, 244507.(377) Ruiz, G. N.; Bove, L. E.; Corti, H. R.; Loerting, T. Pressure-Induced Transformations in LiCl-H2O at 77 K. Phys. Chem. Chem. Phys.2014, 16, 18553−18562.(378) Paschek, D. How the Liquid-Liquid Transition AffectsHydrophobic Hydration in Deeply Supercooled Water. Phys. Rev. Lett.2005, 94, 217802.(379) Le, L.; Molinero, V. Nanophase Segregation in SupercooledAqueous Solutions and Their Glasses Driven by the Polyamorphism ofWater. J. Phys. Chem. A 2011, 115, 5900−5907.(380) Chatterjee, S.; Debenedetti, P. G. Fluid-Phase Behavior of BinaryMixtures in which One Component can have Two Critical Points. J.Chem. Phys. 2006, 124, 154503.(381) Anisimov, M. A. Cold and Supercooled Water: a NovelSupercritical-Fluid Solvent. Russ. J. Phys. Chem. B 2012, 6, 861−867.(382) Suzuki, Y.; Mishima, O. Experimentally Proven Liquid-LiquidCritical Point of Dilute Glycerol-Water Solutions at 150 K. J. Chem. Phys.2014, 141, 094505.(383) Murata, K.; Tanaka, H. Liquid-Liquid Transition WithoutMacroscopic Phase Separation in a Water-Glycerol Mixture.Nat. Mater.2012, 11, 436−443.(384) Murata, K.-I.; Tanaka, H. General Nature of Liquid-LiquidTransition in Aqueous Organic Solutions. Nat. Commun. 2013, 4, 2844.(385) Popov, I.; Greenbaum, A.; Sokolov, A. P.; Feldman, Y. ThePuzzling First-Order Phase Transition inWater-GlycerolMixtures. Phys.Chem. Chem. Phys. 2015, 17, 18063−18071.(386) Zhao, L.-S.; Cao, Z.-X.; Wang, Q. Glass Transition of AqueousSolutions Involving Annealing-Induced Ice Recrystallization ResolvesLiquid-Liquid Transition Puzzle of Water. Sci. Rep. 2015, 5, 15714.(387) Bruijn, J. R.; van der Loop, T. H.; Woutersen, S. ChangingHydrogen-Bond Structure during an Aqueous Liquid-Liquid TransitionInvestigated with Time-Resolved and Two-Dimensional VibrationalSpectroscopy. J. Phys. Chem. Lett. 2016, 7, 795−799.
(388) Corradini, D.; Rovere,M.; Gallo, P. Structural Properties of HighDensity and Low Density Water in Supercooled Aqueous Solutions ofSalt. J. Phys. Chem. B 2011, 115, 1461−1468.(389) Huang, C.; Weiss, T. M.; Nordlund, D.; Wikfeldt, K. T.;Pettersson, L. G. M.; Nilsson, A. Increasing Correlation Length in BulkSupercooled H2O, D2O, and NaCl Solution Determined from SmallAngle X-Ray Scattering. J. Chem. Phys. 2010, 133, 134504.(390) Mishima, O. Melting of the Precipitated Ice IV in LiCl AqueousSolution and Polyamorphism of Water. J. Phys. Chem. B 2011, 115,14064−14067.(391) Suzuki, Y.; Mishima, O. Sudden Switchover Between thePolyamorphic Phase Separation and the Glass-to-Liquid Transition inGlassy LiCl Aqueous Solutions. J. Chem. Phys. 2013, 138, 084507.(392) Corradini, D.; Su, Z.; Stanley, H. E.; Gallo, P. A MolecularDynamics Study of the Equation of State and Structure of SupercooledAqueous Solutions of Methanol. J. Chem. Phys. 2012, 137, 184503.(393) Mallamace, F.; Branca, C.; Corsaro, C.; Leone, N.; Spooren, J.;Stanley, H. E.; Chen, S.-H. Dynamical Crossover and Breakdown of theStokes-Einstein Relation in Confined Water and in Methanol-DilutedBulk Water. J. Phys. Chem. B 2010, 114, 1870−1878.(394) Koop, T.; Luo, B.-P.; Tsias, A.; Peter, T. Water Activity as theDeterminant for Homogeneous Ice Nucleation in Aqueous Solutions.Nature 2000, 406, 611−614.(395) Meadley, S. L., Angell, C. A. In Proceedings of the InternationalSchool of Physics Enrico Fermi: Water: Fundamentals as the Basis forUnderstanding the Environment and Promoting Technology; Debenedetti,P. G., Ricci, M. A., Bruni, F., Eds.; IOS Press: Amsterdam; SIF, Bologna,2015; Vol. 187; pp 19−44.(396) Hendricks, R. W.; Mardon, P. G.; Shaffer, L. B. X-Ray Zero-Angle Scattering Cross-Section of Water. J. Chem. Phys. 1974, 61, 319−322.(397) Leberman, R.; Soper, A. K. Effect of High-Salt Concentrationson Water-Structure. Nature 1995, 378, 364−366.(398) Mallamace, F.; Corsaro, C.; Baglioni, P.; Fratini, E.; Chen, S.-H.TheDynamical Crossover Phenomenon in BulkWater, ConfinedWaterand Protein Hydration Water. J. Phys.: Condens. Matter 2012, 24,064103.(399) Zhao, Z.-F.; Angell, C. A. Apparent First Order Liquid-LiquidTransition, with Pre- Transition Density Anomaly, in Water-Rich IdealSolutions. Angew. Chem., Int. Ed. 2016, 55, 2474−2477.(400) Suhina, T.; Weber, B.; Carpentier, C. E.; Lorincz, K.; Schall, P.;Bonn, D.; Brouwer, A. M. Fluorescence Microscopy Visualization ofContacts Between Objects. Angew. Chem., Int. Ed. 2015, 54, 3688−3691.(401) Suhina, T.; Weber, B.; Carpentier, C. E.; Lorincz, K.; Schall, P.;Bonn, D. Fluorescence Microscopy Visualization of Contacts BetweenObjects. Angew. Chem. 2015, 127, 3759−3762.(402) Poole, P. H.; Becker, S. R.; Sciortino, F.; Starr, F. W. DynamicalBehavior Near a Liquid-Liquid Phase Transition in Simulations ofSupercooled Water. J. Phys. Chem. B 2011, 115, 14176−14183.(403) Zheng, Q.; Green, J.; Kieffer, J.; Poole, P. H.; Shao, J.; Wolf, G.H.; Angell, C. A. Liquids under Negative pressure. NATO-ASI Series;Kluwer Academic Publishers: New York, 2002; pp 1−46.(404) Angell, C. A.; Kapko, V. Potential tuning in the S-W system. (i)Bringing Tc,2 to ambient pressure, and (ii) colliding Tc,2 with theliquid-vapor spinodal. arXiv.org, e-Print Arch., Condens. Matter 2016,https://arxiv.org/abs/1605.00685.
Chemical Reviews Review
DOI: 10.1021/acs.chemrev.5b00750Chem. Rev. 2016, 116, 7463−7500
7500