CAPE COD Regional Wastewater Management Plan Watershed-Based

Chapter IX.15
WASTEWATER MANAGEMENT PLAN FOR
SALEM COUNTY, NEW JERSEY LOWER DELAWARE WATER QUALITY
MANAGEMENT PLANNING AREA
WOODSTOWN BOROUGH CHAPTER
PREPARED BY:
SICKELS & ASSOCIATES, INC. SHERWOOD MEWS
833 KINGS HIGHWAY WOODBURY, NEW JERSEY 08096

Sickels & Associates, Inc.
Wastewater Management Plan for Salem County, New Jersey
Woodstown Borough Chapter
Page-IX.15-ii
TABLE OF CONTENTS I. INTRODUCTION............................................................................................................. 1
A. Status of Previous Approved WMPs ...................................................................... 2
B. Current Wastewater Services .................................................................................. 2
C. Current Water Services ........................................................................................... 3
D. Overview of Environmental, and Local Considerations to Wastewater Services .. 4
E. Overview of Major Water Resource Management Issues ...................................... 4
F. Overview of Future Wastewater Services ............................................................... 5
G. Summary of Significant Actions ............................................................................. 5
II. EXISTING INFRASTRUCTURE AND TREATMENT FACILITIES ...................... 6
A. Wastewater Treatment Plant ................................................................................... 6
B. Major Transmission Piping and Pumping Stations ................................................. 6
III. ENVIRONMENTAL AND OTHER LAND FEATURES .......................................... 11
IV. DELINATION OF SEWER SERVICE AREAS AND PLANNING INTEGRATION
........................................................................................................................................... 12
A. Environmentally Sensitive Areas Map ................................................................. 12
B. Sewer Service Areas in Environmentally Sensitive Areas ................................... 13
C. Exceptions to the Use of Geographic or Political Boundaries .............................. 14
D. Environmentally Sensitive Areas – Data Sources ................................................ 14
V. FUTURE WASTEWATER DEMAND AND FACILITIES ....................................... 14
A. Conformance and Nonconformance with Zoning and Prior Land Use Approvals15
B. Municipal Zoning and Composite Zoning ............................................................ 15
C. Calculating Future Wastewater and Water Supply Needs and Capacity .............. 16
D. Municipal Demand Projections in Urban Municipalities ..................................... 16
E. Municipal Demand Projections in Non-urban Municipalities .............................. 17
F. Future Wastewater Outside of Sewer Service Areas ............................................ 19
VI. ANALYSIS OF CAPACITY TO MEET FUTURE WASTEWATER NEEDS ..... 20
A. Adequacy of Sewage Treatment Plant Capacity ................................................... 20
B. Analysis and Selection of Treatment Alternatives................................................ 20
C. Antidegradation Analysis for New and Expanded Domestic Treatment Works. 20
D. Discharges to Ground Water ................................................................................. 21
E. Adequacy of dilution to meet future non-sewer service area demand .................. 21
VII. FUTURE WATER SUPPLY AVAILABILITY ........................................................... 21
A. Sufficiency of Water Supply ................................................................................. 21

Sickels & Associates, Inc.
Wastewater Management Plan for Salem County, New Jersey
Woodstown Borough Chapter
Page-IX.15-iii
VIII. MAPPING REQUIREMENTS ..................................................................................... 26
A. Basis for Service Area Delineations ..................................................................... 26
B. Mapping Classification ......................................................................................... 26
LIST OF TABLES
SECTION 1: INTRODUCTION
Table 1.1: Historic Population
Table 1.2: Projected Population
SECTION 2: EXISTING INFRASTRUCTURE AND TREATMENT FACILITIES
Table 2.C.1: Non-Industrial NJPDES Wastewater Facilities
Table 2.F.1: Wastewater Treatment Plant Capacity and Flows 2010
Table 2.F.2: Existing Wastewater Flows
Table 2.H.1: Existing Water Supply Wells
Table 2.I.1: Water Allocation and Demand 2010
Table 2.I.2: Annual Water Demand Summary
SECTION 4: DELINEATION OF SEWER SERVICE AREAS AND PLANNING INTEGRATION
Table 4.D.1: Information Sources for Environmentally Constrained Areas
SECTION 5: FUTURE WASTEWATER DEMAND AND FACILITIES
Table 5.B.1: Summary of Municipal Zones
Table 5.E.2.1: FWSA Overall Sewer Service Area Build-Out Projections
SECTION 6: ANALYSIS OF CAPACITY TO MEET FUTURE WASTEWATER NEEDS
Table 6.A.1: Wastewater Treatment Plant Capacity
SECTION 7: FUTURE WATER SUPPLY AVAILABILITY
Table 7.A.1.1: Existing SSA Water Supply Build-Out Projections
Table 7.A.3.1: Water Supply Capacity
SECTION 8: MAPPING REQUIREMENTS
Table 8.B.4.1: Zoning Regulations

Page IX.15-1
I. INTRODUCTION
This chapter represents the Borough of Woodstown portion of the Salem County WMP.
The Salem County WMP has been submitted to the New Jersey Department of Environmental
Protection for approval so that it may be incorporated into the Lower Delaware Water Quality
Management Plan via the Plan Amendment Procedure (N.J.A.C 7:15).
The sewer service area for the Borough of Woodstown includes the entire Borough of
Woodstown, and small portions from the adjacent municipalities of Pilesgrove and Mannington
Townships. The planning area encompasses 1,434 acres (1,034 acres of which make-up the
entire Woodstown Borough).
The Borough of Woodstown is located in the Delaware River Drainage Basin and lies
within the Lower Delaware Water Quality Management Planning Area. The Planning Area is not
located within the jurisdiction of the Pinelands Commission nor is it located within the Coastal
Area Facility Review Act (CAFRA) area.
The Borough of Woodstown is an enclave of the Township of Pilesgrove. The Borough
has a total area of 1,036 acres (1.62 square miles), including approximately 156.4 acres of which
is surface water (ponds, lakes, reservoirs) and 3 miles of streams (shown in Map #1) flowing in
the municipality.
The Borough of Woodstown has been developed extensively, with little land area
available for future development and has one of the highest population densities in Salem County
(2,244.3 people/sq mi). according to (2000) U.S. Census data. The remaining land area for future
growth consists of infill development.
Woodstown has a population of 3,505 persons, which can be seen as an 11.8% growth in
population over a ten-year period, according to the most recent (2010) U.S. Census data. Table
1.1 is a summary of the historic population and trends for the Borough of Woodstown according
to June 2011 projections prepared by the South Jersey Transportation Planning Organization
(SJTPO). In terms of population change over the next two decades, Woodstown is expected to
grow slowly between 0.7-0.85% each year according to the most recent study by the New Jersey
Department of Labor, prepared in June, 2006. A summary of the NJDOL projected population
can be found below in Table 1.2:
Table 1.1: Woodstown Borough- Historic
Population
Table 1.2: Woodstown Borough- Projected
Population
Year Population
Population Change
Year Population
Population Change
# avg yearly %
# avg yearly %
1980 3,250
2010 3,505
1990 3,154 -96 -0.30%
2020 3,797 292 0.83%
2000 3,136 -18 -0.06%
2030 4,061 264 0.71%
2010* 3,505 369 1.18%
2040 4,333 272 0.71%
~Source: Historical U.S. Census data, *2010 U.S. Census
~Source: SJTPO, 2011

Page IX.15-2
A. STATUS OF PREVIOUS APPROVED WMPS
The Woodstown Sewerage Authority (WSA) has submitted several Wastewater
Management Plans (WMP’s) / Amendments since 1991. These amendments have
included proposed upgrades or expansions to the original WSA Sewage Treatment Plant
adopted on April 4, 1991. Amendments also specified the inclusion of sites within
Pilesgrove Township and Mannington Township, as well as a re-rating of the WSA
WWTP capacity from 0.5 million gallons per day (MGD) to 0.53 MGD.
The current WMP in effect for the Woodstown Sewerage Authority (WSA) is an
amendment to the Lower Delaware WQMP, which was adopted on March 30, 1999. The
enclosed plan reflects current zoning with proposed sewer service areas consistent with
the Municipality’s Master Plan. The Woodstown Sewerage Authority WMP has been
incorporated within the overall Salem County Wastewater Management Plan. The
proposed plan, upon adoption, will remain in force and in effect until the expiration date
noted in the Chapter 1, Salem County Summary.
A 2007 WMP amendment WMP prepared by the WSA Engineer, Remington,
Vernick and Walberg (RV&W), was proposed October 27, 2007. The WSA performed an
analysis of the existing plant capacity and identified upgrades to the WWTP’s clarifiers
necessary to expand the SSA to service expected future developments in Pilesgrove
Township.
B. CURRENT WASTEWATER SERVICES
The Borough of Woodstown sanitary sewer system serves approximately 3,505
persons within their municipal boundary according to current municipal data and DEP
online sources. This equates to 5.3 percent of the total Salem County population (66,083
persons, 2010 U.S. Census) being served by the waster treatment plant.
Sewer service areas may include industrial businesses that discharge process
wastewater to the collection system for treatment by a facility not owned by that
business. The existing sewer service limits, delineated on Map No.2, are serviced by the
Woodstown Wastewater Treatment Plant and were derived from existing sanitary sewer
infrastructure currently constructed and/or approved.
Areas served by the Woodstown WWTP include the Borough of Woodstown, and
small portions of the Township of Pilesgrove and the Township of Mannington located in
Salem County, New Jersey. The sewer service area includes all of the Borough of
Woodstown excluding Memorial Lake, East Lake, Preserved Lands and the Salem River.
These areas were not included within the Sewer Service Area as they are environmentally
sensitive areas. The remainder of the Borough of Woodstown is completely serviced by
the WSA.

Page IX.15-3
The SSA also includes the buildings presently served by the Salem County Vo-
Tech School Treatment Plant in Mannington Township, the Salem County Roads
Department and garage and office in Pilesgrove Township, and the proposed Salem
County Correctional Facilities in Mannington Township. Further information with regard
to Pilesgrove Township is provided within Section 2.2.1 of the Pilesgrove municipality
chapter. The facilities served by the WSA WWTP within Pilesgrove Township and
Mannington Township municipalities are further defined within their respective
municipal chapters.
The Woodstown WWTP is located on West Avenue and operates under NJPDES
Permit Number-NJ0022250 effective on April 2007. The WSA-WWTP currently
receives contributing flow from residential living and commercial units. Wastewater
generated within the WMP existing sewer service area is conveyed to the WWTP, which
is permitted to operate at 0.53 MGD. The plant is designed to withstand an instantaneous
peak flow rate of 1.4 MGD according to the flow study prepared by RV&W, dated April
2005. The monthly flow generated by these contributors for the 2010 calendar year was
0.346 MGD.
C. CURRENT WATER SERVICES
The Borough of Woodstown community water supply system serves
approximately 3,505 persons within their sewer service area according to current NJDEP
data. This equates to 5.3 percent of the total Salem County population (66,083 persons,
2010 U.S. Census) being served by the waster treatment plant.
The water service area includes the Borough of Woodstown, and designated areas
within Pilesgrove and Mannington located in Salem County, New Jersey. The facilities
served by the Woodstown water supply system within adjacent municipalities are further
defined within those municipal chapters respectively and clearly identified on the
mapping provided.
The Borough of Woodstown owns and operates its own potable water supply
system. The public is presently serviced from five (5) ground water wells located
throughout the Borough. Three of these wells (#2, #3, and #5) withdraw water from the
Potomac Raritan Magothy Aquifer (PRM). The other two wells (#4, #6) withdraw from
the Mount Laurel-Wenonah Aquifer (MLW). In addition, the Borough of Woodstown
constructed a Water Treatment Plant adjacent to Well #4 on West Millbrooke Avenue to
treat for iron. Generally, sanitary sewer service is available where potable water service is
currently in place. Map No.1 depicts the areas actively served by existing public water
supply facilities. As with sewer service, “actively served” means that the distribution
lines exist and that the property either is connected or has all regulatory approvals
necessary to be connected with no further review.

Page IX.15-4
D. OVERVIEW OF ENVIRONMENTAL, AND LOCAL CONSIDERATIONS TO
WASTEWATER SERVICES
Wastewater Management Planning is part of the continuing planning process
required by the New Jersey Water Quality Planning Act (N.J.S.A. 58:11A-1 et seq.) and
Section 208 of the federal Clean Water Act. The intent of the continuing planning
process is to align federal, State, regional and local land use planning to ensure that these
land use plans do not conflict with each other.
The provision of environmental infrastructure, in particular centralized sewer
service, has a profound influence on development patterns and intensity. The wastewater
management planning process is intended to assign an appropriate wastewater
management treatment alternative to geographic areas based on environmental sensitivity
and other land use planning objectives such as regional center-based development or
farmland preservation. The extension of public sewers into areas designated for
protection by federal, State, regional or local land use plans would be inconsistent with
those protection objectives.
The adopted Water Quality Management Planning Rules (N.J.A.C. 7:15)
generally exclude the extension of sewer service into large contiguous areas, defined as
25 acres or more, of wetlands, category one water buffers, Natural Heritage Priority Sites
and/or endangered and threatened species habitat. The extension of sewer service into
these areas would encourage their development and thus conflict with the Department of
Environmental Protection’s statutory mandate to protect these resources.
It should be noted that under limited circumstances environmentally sensitive
areas that meet the 25 acre threshold may be included in the sewer service area as
necessary to preserve the investment in projects having already received certain local and
State approvals, to relate sewer service areas to recognizable geographic features, or to
accomplish center based development proposed by the local land use planning authority
and approved by the Department of Environmental Protection through the plan
endorsement process. Additional local land use planning objectives used in delineating
appropriate areas for public sewer service are discussed in this municipal chapter.
E. OVERVIEW OF MAJOR WATER RESOURCE MANAGEMENT ISSUES
A majority of the Borough of Woodstown is served by potable water and sanitary
sewer service. The water system utilizes five (5) ground water wells located throughout
the Borough. Three (3) wells are located within the Potomac-Raritan-Mogathy (PRM)
Aquifer, which have exhibited elevated sodium levels. The secondary drinking water
standard for sodium is 50 ppm and levels exceeding 100ppm have been recorded for
these wells. The other two (2) wells withdraw from the Mount Laurel-Wenonah (MLW)
Aquifer (MLW). The NJDEP has concerns regarding the productivity/sustainability of
wells in this aquifer. The municipality has not identified any other issues regarding water
quality, water supply or concerns with non-sewered areas.

Page IX.15-5
F. OVERVIEW OF FUTURE WASTEWATER SERVICES
The Woodstown Sewerage Authority has identified the future sewer service area
necessary to implement a portion of the goals and objectives of the Borough’s Master
Plan. Those areas have been reduced to account for the environmental constraints
pertaining to wetlands, the habitats of Threatened and Endangered Species, Riparian
Corridors, and C-1 Waters. The proposed Sewer Service Area is identified on Map No.3.
The proposed future sewer service areas delineated on Map No.3 consist of
proposed future areas outside the existing sewer service area. The remaining areas, not
designated as a sewer service area will continue to be serviced by Individual Subsurface
Sewerage Disposal Systems (ISSDS’s) with wastewater flows less than or equal to 2,000
gpd.
Based on the environmental and local land use planning objectives discussed
above, Map No.2 and Map No.3 identify areas presently served by public sewers and the
appropriate areas to be served by public sewers in the future. These maps also identify
sites that are served by an on-site treatment works, if applicable, that are regulated under
a New Jersey Pollutant Discharge Elimination System permit. Each sewerage treatment
plant authorized under this plan to accept and treat wastewater from its corresponding
sewer service area has an accompanying facility table that provides information
concerning that facility’s owner, operator, permitted flow, existing flow, remaining
permitted flow, and projected build-out flow summarized by municipality.
Based on the buildout analysis of each sewer service area and the existing
permitted capacity of the sewage treatment plants identified in this plan, sufficient
wastewater treatment capacity exists to accommodate the currently proposed Sewer
Service Area. Future expansion of the identified treatment works is not required to meet
the future wastewater generation needs of the municipality.
G. SUMMARY OF SIGNIFICANT ACTIONS
Amendments to the Water Quality Management Planning Rules adopted on July
7, 2008, 40 N.J.R. 4000(a), necessitated a modification to certain sewer service areas
based on environmental sensitivity and local planning objectives as described in this
document. In accordance with the regulatory requirements, undeveloped lands within the
existing sewer service area have been removed based on the limits of environmental
constrained areas. In addition, areas have been added based on local planning objectives
and an environmental sensitivity assessment. Maps No.2 and No.3 reflect the changes in
sewer service area as a result of this wastewater management plan.
1. All areas not proposed to be included in the WSA sewer service areas in this
WMP will be served by ISSDS’s with 2,000 gpd or less flows.

Page IX.15-6
II. EXISTING INFRASTRUCTURE AND TREATMENT FACILITIES
A. WASTEWATER TREATMENT PLANT
Map No. 2 depicts the areas actively served by existing wastewater facilities, and
the facilities tables in Chapter 7 (VII) provide detailed information on each facility. As
with sewer service, the term “actively served” means that the collection lines exist and
that the property either is connected or has all regulatory approvals necessary to be
connected.
The WSA WWTP is a localized system for the conveyance, treatment, and
disposal of the municipalities' wastewater within its service area. The WWTP treats
domestic waste as well as industrial waste. Treated wastewater is discharged to the Salem
River under NJPDES Permit No. NJ0022250.
B. MAJOR TRANSMISSION PIPING AND PUMPING STATIONS
The Woodstown Sewerage Authority (WSA) owns and operates one wastewater
treatment facility, a series of pump stations, and force mains used to convey wastewater
flow to the WWTP. The sanitary sewer collection system in Woodstown is owned and
maintained by the Authority. There is approximately 18.1 miles of sanitary sewer main
with pipes ranging in size from 6 inches to 12 inches in diameter within the sewer service
area. The Authority currently owns and operates seven (7) pump stations. All flows are
conveyed to the WSA WWTP for treatment. Map No.2 depicts the areas actively served
by existing wastewater facilities, and the tables in Chapter 7 (VII) provide detailed
information on each facility. “Map No.2 shows the major interceptors, trunk lines and
pumping stations within the various sewer service areas for public wastewater treatment
facilities.
C. EXISTING ON-SITE, NON-INDUSTRIAL WASTEWATER FACILITIES
These facilities serve single developments, sites or other properties under single
ownership, but do not treat industrial flows. These facilities typically provide wastewater
treatment for apartment complexes, commercial properties and businesses where regional
sewerage is not available. Table 2.C.1 lists all existing on-site, non-industrial treatment
facilities that discharge 2,000 gallons per day or more of domestic wastewater and are
regulated under a NJPDES permit. The Wastewater Facilities Tables provided in Chapter
7 (VII) list all existing on-site, non-industrial treatment facilities that discharge 2,000
gallons per day or more of domestic wastewater and are regulated under a NJPDES
permit.

Page IX.15-7
TABLE 2.C.1: Non-Industrial NJPDES Wastewater Facilities
Municipal
Map
Designation
Facility Name NJPDES # &
Discharge Type
Discharge Type
(Groundwater or
Surface Water)
Facility Table
Number
51 Woodstown WWTP NJ0022250
Municipal
Multi-Municipality
DSW-A 51
D. EXISTING INDUSTRIAL WASTEWATER FACILITIES
Some industrial land uses have independent wastewater treatment facilities that
treat and discharge manufacturing process waste or sanitary sewage, rather than other
types of effluent such as non-contact cooling water. They may be discharged to ground
water or to surface water. The Wastewater Facilities Tables provided in Chapter 7 (VII)
list all existing industrial treatment facilities that discharge 2,000 gallons per day or more
of domestic wastewater and are regulated under a NJPDES permit. However, the
Borough of Woodstown does not contain any industrial wastewater treatment facilities.
E. GENERAL WASTEWATER MANAGEMENT AREAS FOR
SEPTIC SYSTEMS
Generally the remaining areas of the Municipality, not otherwise designated as
service areas for treatment facilities requiring a NJPDES permit, are included within a
general wastewater management area for septic systems and other small treatment works
that treat less than 2,000 gallons per day of wastewater and discharge to ground water.
However, the proposed SSA for the Borough of Woodstown includes the entire
municipality minus environmentally constrained areas. Consequently, general wastewater
management areas for septic systems have not been designated and do not apply to this
municipality.
F. EXISTING WASTEWATER FLOWS
The existing wastewater flows conveyed to the WSA WWTP were calculated
based on flows metered by WSA. The present average annual wastewater discharged for
2010 is 0.346MGD. The present average flow includes residential, commercial and
industrial flows. The following table 2.F.1 summarizes the permitted wastewater
treatment plant capacity and associated average daily flows for 2010.
TABLE 2.F.1: Wastewater Treatment Plant Capacity and Flows 2010
TREATMENT
FACILITY
NJPDES
Permit #
Permitted
Capacity
(MGD)
Average
Daily Flow
2010 (MGD)
Build-Out
Projection
(MGD)
Woodstown WWTP NJ0022250 0.53 0.346 0.152

Page IX.15-8
Included within the above existing wastewater flows are connections located
within the Townships of Pilesgrove and Mannington. The flows from these connections
are identified within the specific municipal chapter or facilities tables provided within the
appendix of this report. Monthly wastewater flow data for 2010 is identified in Table
2.F.2 below.
The monthly flows indicated above are inclusive of contributory flows from
connections located within Pilesgrove Township and Mannington Township. The specific
flows from these adjacent municipalities are provided within those individual municipal
chapters respectively.
G. EXISTING WASTEWATER TREATMENT
The WSA WWTP currently operates under NJPDES permit NJ0022250. The
plant was designed for an average flow of 0.53 MGD, which is the present permitted
capacity. A maximum plant capacity analysis was performed by the WSA Engineer
Remington, Vernick & Walberg (RV&W) in April of 2005. This study identified the
existing and maximum capacities of facility components.
Table 2.F.2: Existing Wastewater Flows 2010
Month Monthly Avg. (mgd)
Estimated Monthly Avg. (mgd)
Woodstown Borough Contributing
Municipalities
January 0.359 0.359 0.000
February 0.439 0.439 0.000
March 0.506 0.506 0.000
April 0.396 0.396 0.000
May 0.321 0.321 0.000
June 0.310 0.310 0.000
July 0.298 0.298 0.000
August 0.292 0.292 0.000
September 0.303 0.303 0.000
October 0.319 0.319 0.000
November 0.310 0.310 0.000
December 0.307 0.307 0.000
Annual Average
(mgd) 0.346 0.346 0.000
(mgm) 10.539 10.539 0.000
(mgy) 126.469 126.469 0.000

Page IX.15-9
H. EXISTING PUBLIC WATER SUPPLY INFRASTRUCTURE
The Borough of Woodstown is presently serviced from five (5) ground water
wells located throughout the Borough. Three of these wells (#2, #3, #5) withdraw water
from the Potomac Raritan Magothy Aquifer (PRM). The other two wells (#4, #6)
withdraw from the Mount Laurel-Wenonah Aquifer (MLW). In addition, the Borough of
Woodstown constructed a Water Treatment Plant adjacent to Well #4 on West
Millbrooke Avenue to treat for iron.
Generally, sanitary sewer service is available where potable water service is
currently in place. Map No.1 depicts the areas actively served by existing public water
supply facilities. As with sewer service, “actively served” means that the distribution
lines exist and that the property either is connected or has all regulatory approvals
necessary to be connected with no further review.
The Borough of Woodstown water supply system serves the Borough of
Woodstown, and designated areas within Pilesgrove and Mannington located in Salem
County, New Jersey.
The following Table 2.H.1 summarizes each public community water supply
facility currently serving the municipality. The franchise areas are depicted on Map No.1.
Table # 2.H.1: Existing Water Supply Wells
Well Permit
Number
Well
Designation
Pump Capacity
(gpm)
Aquifer
5000000038 2 425 PRM
3000001441 3 600 PRM
3000009510 4 200 MLW
3000013120 5 550 PRM
3000019108 6 200 MLW
Information presented within this municipal chapter was obtained from the most
current water allocation permit, previous WMP documents provided by the County,
online DEP sources and the Borough of Woodstown.
The three (3) wells located within the Potomac-Raritan-Mogathy Aquifer range in
depth from 675 feet to 712 feet below the ground surface. As a result of the this depth,
the wells located within the Potomac-Raritan-Mogothy Aquifers are below sea level and
the sodium levels are considered high (175-315 mg/L). The chlorides (135-240 mg/L)
and total dissolved solids (565-860 mg/L) are also considered to be at high levels.
Page IX.15-10
In an effort to reduce the total withdrawal from the Potomac-Raritan-Mogothy
Aquifer, the Borough of Woodstown has drilled Well #4 within the Mount Laurel-
Wenonah Aquifer. Well #4 is located along East Millbrooke Avenue near the Mary
Shoemaker School. Well #4 was drilled to a depth of 160 feet with a rated capacity of
400 gallons per minute. The potable water obtained from Well#4 is low in sodium (2-3
mg/L), chlorides (5 mg/L) and total dissolved solids (300 mg/L).
The Borough of Woodstown constructed a Water Treatment Plant adjacent to
Well #4 on West Millbrooke Avenue to treat the effluent for iron. The Water Treatment
Plant removes iron by means of continuous regeneration potassium permanganate. The
effluent is not treated for hardness at the Water Treatment Plant.
The Borough of Woodstown drilled Well #5 adjacent to Well #4. Well #5 was
drilled within the Potomac-Raritan-Mogothy Aquifer to a depth of 675 feet and a rated
pumping capacity of 500 gpm. Well #5 has the same effluent characteristics as Well #2
and Well #3, all drilled within the Potomac-Raritan-Mogothy Aquifer. The effluent is
high in sodium, chlorides, and total dissolved solids while having low hardness, iron and
manganese levels. The effluent from Well #5 is mixed with the effluent from Well #4 at a
ratio of 2.3:l in the Water Treatment Plant to bring the total hardness within acceptable
levels.
The Borough of Woodstown drilled Well #6 within the Mount Laurel-Wenonah
Aquifer. Well #6 is approximately 650 feet from Well #4 and Well #5 and is piped to the
existing Water Treatment Plant located on East Millbrooke Avenue.
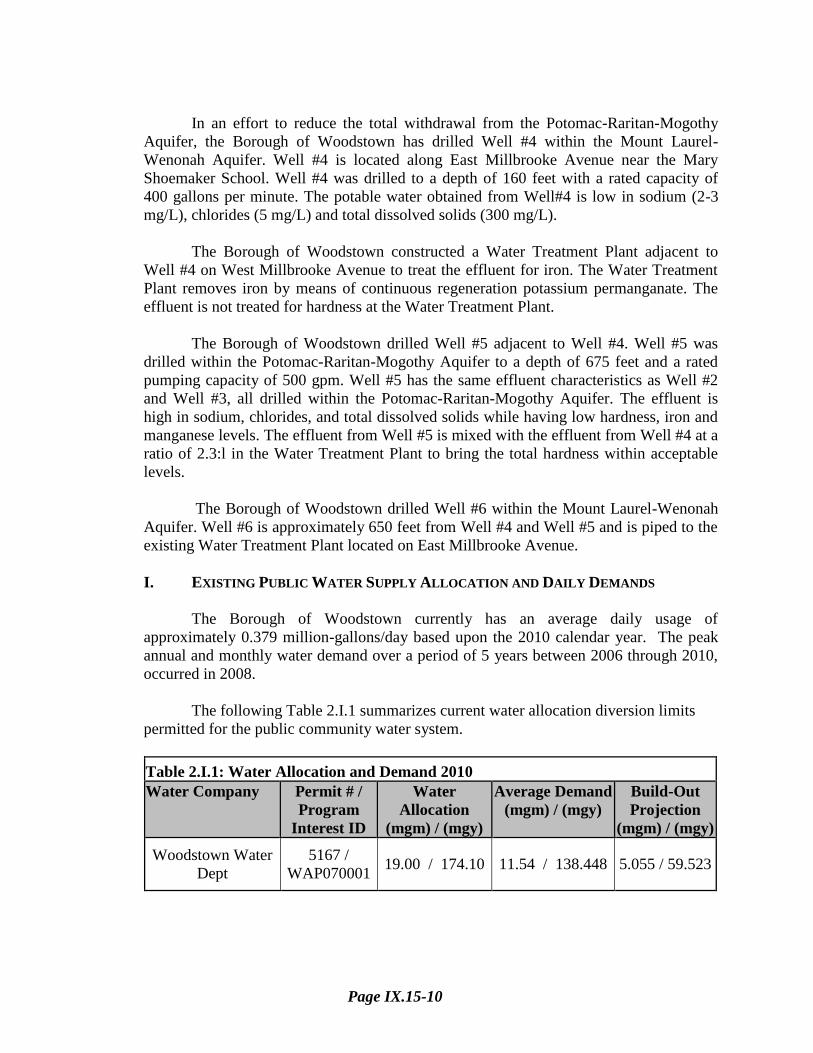
I. EXISTING PUBLIC WATER SUPPLY ALLOCATION AND DAILY DEMANDS
The Borough of Woodstown currently has an average daily usage of
approximately 0.379 million-gallons/day based upon the 2010 calendar year. The peak
annual and monthly water demand over a period of 5 years between 2006 through 2010,
occurred in 2008.
The following Table 2.I.1 summarizes current water allocation diversion limits
permitted for the public community water system.
Table 2.I.1: Water Allocation and Demand 2010
Water Company Permit # /
Program
Interest ID
Water
Allocation
(mgm) / (mgy)
Average Demand
(mgm) / (mgy)
Build-Out
Projection
(mgm) / (mgy)
Woodstown Water
Dept
5167 /
WAP070001 19.00 / 174.10 11.54 / 138.448 5.055 / 59.523

Page IX.15-11
The following Table 2.I.2 summarizes historical daily, monthly and annual water
demands currently supplied by the public community water system. The districts and
franchise areas are depicted on Map No.1.
Table 2.I.2: Annual Water System Demand Summary
Year
Annual Demand
Total (mgy)
Average Daily
Demand (mgd)
Average
Monthly
Demand (mgm)
Peak Monthly Demand
(mgm) / (Month)
2006 132.374 0.363 11.031 14.257 August
2007 141.088 0.387 11.757 15.076 July
2008 141.631 0.388 11.803 15.432 July
2009 130.790 0.358 10.899 13.775 July
2010 138.448 0.379 11.537 14.054 August
III. ENVIRONMENTAL AND OTHER LAND FEATURES
A full description of the mapping of environmental features for the County can be found
in Chapter I of this report. This section includes a summary of the environmental features and
public open space for the municipality that were taken into account when preparing the mapping.
These features are significant to wastewater management planning for three reasons: they may
influence the delineation of sewer service areas, they may reduce the potential future wastewater
generation due to existing regulatory programs, or they may be subject to federal grant
limitations that prohibit the extension of sewer service into these areas. Some of this mapping
has been used in the development of a map of environmentally sensitive areas where the
extension of sewer service areas is restricted (see Delineation of Sewer Service Areas, below).
Development in areas mapped as wetlands, flood prone areas, designated river areas, or
other environmentally sensitive areas may be subject to special regulation under Federal or State
statutes or rules. Interested persons should check with the Department of Environmental
Protection for the latest information. Depiction of environmental features is for general
information purposes only, and shall not be construed to define the legal geographic jurisdiction
of such statutes or rules.
The following environmental features have been identified within the County map set:
A. Surface Waters and Classifications—Refer to Map No.5A of County map set
B. Riparian Zones -- Refer to Map No.5C of County map set
C. Flood Prone Areas – Refer to Map No.5A of County map set
D. Freshwater Wetlands -- Refer to Map No.5B of County map set
E. Coastal Wetlands –Refer to Maps 5A and 5B of County map set
F. Public Open Space and Recreation Areas –Refer to Map No.5B of County map set
G. Preserved Agricultural Areas and Other Conservation Easements on Private Lands –
Refer to Map No.5C of County map set
H. Suitable Habitat for Threatened and Endangered Species – Refer to Maps 5B and 5C
I. Natural Heritage Priority Sites –Refer to Map No.5C of County map set

Page IX.15-12
IV. DELINATION OF SEWER SERVICE AREAS AND PLANNING
INTEGRATION
The results of the environmental analyses, summarized in Section III above, provide
justification for the established service area delineations by demonstrating consistency with all
applicable NJDEP requirements and criteria. This WMP chapter provides the most current
planning efforts within the municipalities WMP planning area.
The WQMP rules NJAC 7:15-5.22 require coordination with and solicitation of
comments or consent from certain agencies, entities and plans, and consistency with other plans.
These requirements are addressed in the Chapter 1, Salem County Summary within this
document.
This chapter provides the method used to delineate future sewer service areas based on
the mapping of significant environmentally sensitive areas, and consistency with other regional
plans.
A. ENVIRONMENTALLY SENSITIVE AREAS MAP
Under the Water Quality Management Planning Rules, large contiguous
environmentally sensitive areas, generally defined as 25 acres or greater in size should be
excluded from sewer service areas except under certain circumstances such as providing
service to development that has already secured prior approvals or center based
development approved by the Department of Environmental Protection through the Plan
Endorsement process. Maps 5A, 5B and 5C, of the County map set, reflect the final
results for the mapping of environmentally sensitive areas, based on the information
described above and the WQMP rules. These maps were created using the following
process:
1. Identify areas (to the extent that GIS interpretations are available) where
pre-existing grant conditions and requirements (from Federal and State
grants or loans for sewerage facilities) provide for restriction of sewer
service to environmentally sensitive areas, and then delete areas (if any)
where a map revision or grant waiver has been approved by USEPA.
Note: pre-existing grant conditions and requirements (from Federal and
State grants or loans for sewerage facilities) which provide for restriction
of sewer service to environmentally sensitive areas are unaffected by
adoption of this WMP and compliance is required.
2. Merge the GIS layers for wetlands, Category One riparian zones, Natural
Heritage Priority Sites, and Threatened and Endangered Species habitats,
and any others used by the County areas into a single composite GIS
coverage.
3. Correct the composite areas by eliminating areas designated as urban in
the most recent land use land cover layer (2002) to address land use/land
cover modifications that have occurred since the environmental feature
layers were prepared.

Page IX.15-13
4. Identify and delete any composite areas less than 25 acres in size from the
map of environmentally constrained areas. The resulting map shows the
final environmentally sensitive areas, which is used to eliminate the
potential for sewer service areas except where sewer service already
exists, or exceptions are allowed for infill development or approved
endorsed plans. It is noted for public information purposes that the
excluded areas will be protected through other NJDEP regulatory
programs such as the Flood Hazard Area Control Act and Freshwater
Wetlands Act rules, and may be protected by municipal ordinances as
well.
B. SEWER SERVICE AREAS IN ENVIRONMENTALLY SENSITIVE AREAS
The WQMP rules allow for inclusion of environmentally sensitive areas under
limited conditions. The following modifications were considered for the WMP:
1. Where a development has secured approval under the Municipal Land Use
Law and possesses a valid wastewater approval, the site may be included in
the sewer service area if consistent with that valid wastewater approval. This
information was gathered in consultation with municipalities.
2. Where a project has an approved site-specific water quality management plan
and wastewater management plan amendment from the Department the
project may be included in the wastewater management plan consistent with
that approved site specific amendment for a period of six years from the date
the amendment was adopted. The general locations of these developments are
indicated on Map No.3, if applicable, and are keyed to a list of qualifying
developments in each municipal chapter.
3. Where environmentally sensitive areas are bordered on either side by areas
with existing sewer service, and where the infill development would generate
2,000 gpd or less of sewage based on existing zoning and where the area to be
included does not include habitat critical to the recovery potential or the
survival of a local population of an endangered or threatened species.
4. Where sewer service is necessary to support for center based development
under an “endorsed plan” (through the State Planning Commission relative to
the State Development and Redevelopment Plan) and would not remove
habitat critical to endangered or threatened species. Where such modifications
have been made, they are noted in the individual municipal chapters.
5. Where necessary to create a linear boundary that related to recognizable
geographic features and would not remove habitat critical to the recovery
potential or the survival of a local population of an endangered or threatened
species. Where necessary to create a linear boundary that related to
recognizable geographic features and would not remove habitat critical to the
recovery potential or the survival of a local population of an endangered or
threatened species.

Page IX.15-14
C. EXCEPTIONS TO THE USE OF GEOGRAPHIC OR POLITICAL BOUNDARIES
The existing Sewer Service Area boundary was derived from existing sanitary sewer
infrastructure currently constructed or approved. These boundaries hold tightly to
geographical features and political boundaries within the municipality. No exceptions were
made for the delineations used in this WMP.
D. ENVIRONMENTALLY SENSITIVE AREAS – DATA SOURCES
The information described above with regard to the mapping of proposed sewer
service areas and Environmentally Sensitive Areas was obtained from various sources.
Table 4.D.1 below highlights the information and sources used to delineate
environmentally constrained areas.
Table 4.D.1 Information Sources for Environmentally Constrained Areas
Category Source Source Location
Wetlands NJDEP www.state.nj.us/dep/gis
Floodplains FEMA www.msc.fema.gov/webmap/wcs
Stream Corridors NJDEP www.state.nj.us/dep/gis
Threatened &
Endangered Species
NJDEP www.njfishandwildlife.com
Parks, Preserves, &
Open Space
Green Acres Recreation
Program & NJDEP
www.state.nj.us/dep/gis
Surface Water Quality
Standards
NJDEP www.state.nj.us/dep/gis
National Heritage
Priority Sites
NJDEP www.state.nj.us/dep/gis
Zoning Municipality Current Ordinance
V. FUTURE WASTEWATER DEMAND AND FACILITIES
Proposed future sanitary sewer flows conveyed to the Salem City WWTP projected under
build-out conditions were evaluated based on two sets of data; sanitary flows projected within
the existing sewer service area and proposed flows for the future sewer service area. Future flows
within the existing sewer service area utilize a “parcel based” method for calculating the flows of
infill development. Whereas, future sanitary flows within the expanded sewer service area utilize
a “zoning based” method for calculating the build-out. The build-out data is then converted to a
projected future wastewater flow by applying the planning flow criteria from N.J.A.C. 7:14A
based on the type of development projected.

Page IX.15-15
All projected flows were separated into residential, commercial, and industrial
components. Total projected build-out flow for residential, commercial and industrial
development was determined based on the available developable land and current zoning
ordinances for the municipality within areas proposed as the future sewer service area.
Environmental constraints with required buffers were also considered and indicated within the
Mapping section of this report.
For example, single-family residential development is assumed to consist of houses
having three or more bedrooms per house, and each projected new house is multiplied by 300
gallons per day to predict the future wastewater generated. For non-residential land uses the
anticipated floor area is multiplied by 0.1 gallon per day to predict future wastewater generation.
A more detailed explanation of build-out flow calculations and criteria used is provided in the
tables below.
The build out in the non-sewer service area was calculated by applying the zoning over
all undeveloped land except polygons too small to support additional development. The number
of residential units and non-residential floor area were then multiplied by the wastewater
planning flow estimates in either N.J.A.C. 7:14A or 7:9A as appropriate.
The build out method used for the wastewater demand was also used to predict future
water supply demand, except that the flow multiplier used to predict future water supply demand
is slightly higher than that used for wastewater demand. The results of the analysis are presented
within this chapter and in the facilities tables found in the appendices at the end of this
document.
A. CONFORMANCE AND NONCONFORMANCE WITH ZONING AND PRIOR LAND USE
APPROVALS
Where the WMP build out deviates from either current zoning or prior land use
approvals, such deviation and the reasons for the deviation are explained in this chapter
B. MUNICIPAL ZONING AND COMPOSITE ZONING
The municipal zoning information provided below is specific to this chapter.
Because municipal zoning ordinances are not uniform in their nomenclature or
definitions, a composite zoning map has not been developed. Table 5.B.1 below
identifies the zoning specific to this chapter and was been utilized for the associated
build-out analyses.
“SSA Developable Area” includes both undeveloped and underdeveloped parcels
within the proposed sewer service area. “Undeveloped” parcels are those where no
development exists and the land has not been restricted from development through
dedicated open space or agricultural preservation programs. “Underdeveloped” parcels
are those where some level of development exists, but at a density less than allowed by
zoning and where deed restrictions do not prevent further development.

Page IX.15-16
Table 5.B.1: Summary of Woodstown Municipal Zones
Zone Name Zone Description Municipal Area
(ac)
SSA
Developable
Area (ac)
C1 COMMERCIAL 14.6 0.71
C2 COMMERCIAL 2.8 0.50
C3 COMMERCIAL (PRINCIPAL USE,
SHOPPING CENTER) 31.8 9.65
CONS CONSERVATION 133.3 0.34
CR COMMERCIAL 112.5 0.35
IR INDUSTRIAL 14.4 12.39
LC LIGHT COMMERCIAL 21.4 0.64
LI LIGHT INDUSTRIAL 67.2 11.13
R1 RESIDENTIAL 15.5 0.00
R2 RESIDENTIAL 57.1 2.86
R3 RESIDENTIAL (SINGLE FAMILY,
DUPLEX / TWIN) 88.8 3.05
R4 RESIDENTIAL 196.9 0.00
R5 RESIDENTIAL 100.6 21.60
R6 RESIDENTIAL (SINGLE FAMILY,
MULTI-FAMILY, CLUSTER) 176.7 25.65
R7 RESIDENTIAL 98.0 0.00
SI SUPPLY INDUSTRIAL 13.5 0.00
C. CALCULATING FUTURE WASTEWATER AND WATER SUPPLY NEEDS AND
CAPACITY
Using the municipal information provided above regarding existing wastewater
and water supply facilities, sewer service area delineation, environmentally sensitive
areas, and municipal zoning to project build-out or 20 year growth projections for the
listed urban municipalities, an analysis of wastewater and water supply demands was
performed to determine whether existing infrastructure capacity or zoning is a
constraining factor.
There are two methods used for projecting future wastewater management needs:
a 20-year projection for urban municipalities or a build out based on existing zoning for
non-urban municipalities. An urban municipality is defines as those municipalities where
less than 10 percent of the total land area of the municipality is “available land for
development” after subtracting out permanently preserved open space.
D. MUNICIPAL DEMAND PROJECTIONS IN URBAN MUNICIPALITIES
The Borough of Woodstown does not meet the definition of an urban municipality
as defined above. Consequently, future wastewater build out projections are based on
existing zoning identified below.

Page IX.15-17
E. MUNICIPAL DEMAND PROJECTIONS IN NON-URBAN MUNICIPALITIES
Development of vacant land will be the predominant factor in determining future
wastewater treatment needs. Further, because external market and economic forces, such
as interest rates, are a dominant factor in determining the rate of construction, this
analysis assesses the ability to provide wastewater treatment while protecting surface and
ground water quality for the entire projected build out allowable by zoning. There are
two separate methods employed for calculating future wastewater generation at build out,
based on the wastewater service area designation.
1. Future Wastewater from Non-Urban Municipalities’ Sewer Service
Areas
In designated sewer service areas the following features have been
removed prior to the application of zoning to the undeveloped land area because
they are unlikely to generate wastewater in the future: wetlands, riparian zones,
permanently preserved farmland, permanently preserved open space, steep slopes,
floodplains, and cemeteries. The existing zoning is then applied to the remaining
developable land area within the sewer service area(s) to project a build out
condition for use in estimating the future wastewater management needs of each
sewer service area. Build out data for each municipality has been provided on a
compact disk (cd) for reference.
The Borough of Woodstown’s existing sewer service area extends to the
municipal boundary and serves portions of Pilesgrove Township and Mannington
Township as defined on Map No.3. Consequently, infill development has been
identified by utilizing a parcel based build-out approach as defined below. The
zoning based analysis was not required for this municipality.
2. Existing Sewer Service Area Build-Out Analysis
The build-out of the existing sewer service area consisted of evaluating
residential, commercial and industrial flow projections to the extent of
development that could occur according to applicable zoning in developable
areas. The projections are based on the potential for development of existing infill
lots within areas zoned for each use and the most current land use regulations for
the municipality. Generally, infill development of the existing sewer service area
was prepared utilizing a “parcel based” build out approach.
The total number of potential units within each residential, commercial
and industrial district was then multiplied by the maximum percent building
coverage specified in the zoning ordinances to reach a maximum building area at
build-out. Residential flows were projected assuming 300gpd / dwelling unit.
Commercial and industrial flows were projected assuming 0.1 GPD/ sq.ft. of
building area.

Page IX.15-18
Table 5.E.2.1 summarizes the build-out flow projections for the existing
sewer service area. In addition, the table reflects a breakdown of the acreage of
land available for development (i.e., either undeveloped or underdeveloped, and
not constrained due to environmentally sensitive areas) within each general zone
of the municipality, based on the build-out analysis.
Table 5.E.2.1: FWSA Overall Sewer Service Area Build-Out Projections
Zone Developable
Acres
Potential
Units
Average Daily
Flow (GPD)
Total ADF
(GPD)
See Note (a) See Note (b) See Note (c) See Note (d)
C1 0.71 15,385 0 1,538
C2 0.50 1 850 850
C3 9.65 16 850 12,800
CONS 0.34 0 300 0
CR 0.35 1 800 300
IR 12.39 111 800 33,300
LC 0.64 4 800 3,200
LI 11.13 3 2,614 7,842
R1 0.00 0 300 0
R2 2.86 17 225 3,825
R3 3.05 24 225 5,400
R4 0.00 0 300 0
R5 21.60 79 300 23,700
R6 25.65 92 300 27,600
R7 0.00 0.00 300 0
S1 0.00 0.00 300 0
Pilesgrove School 5,000
Mannington Previously Allocated Flow 27,000
TOTAL
(gpd) 152,355
(mgd) 0.152
The notes referenced below are indicated in the above table.

Page IX.15-19
Notes: a. The Developable Acres represents the identified acreage per zone within the FWSA.
b. The POTENTIAL UNITS represent the number of remaining units that may be constructed
within each zone within the sewer service area.
c. Average Daily Flow has been calculated based on current NJDEP regulations.
d. The TOTAL ADF represents the remaining potential build-out within the existing sewer
service area.
e. Conservation Zone CONS, Average Daily Flow Based on 300 GPD established for 3 or more
bedroom dwellings.
f. Residential Zones, R1, R4, R5, R6 & R7, Average Daily Flow Based on 300 GPD established
for 3 or more bedroom dwellings.
g. Residential Zones, R2 & R3, Average Daily Flow Based on 225 GPD established for 1-2
bedroom dwellings.
h. Commercial Zone LC, ADF Based on 0.1 gal/SF established for a Floor Area of 8,000sf.
i. Commercial Zone C1, Average Daily Flow Based on 0.1 gal/SF established for a 2:1 Floor
Area Ratio Applied to Lot Acreage.
j. Commercial Zone C2, ADF Based on 0.1 gal/SF established for a Floor Area of 8,500sf
k. Commercial Zone C3, ADF Based on 0.1 gal/SF established for a Floor Area of 8,500sf for
parcels less than 5 acres; 7500sf for greater than 5 acres
l. Industrial Zones LI, Average Daily Flow Based on 0.1 gal/SF established for Offices and
Industry (20% coverage of 3 Acres or 26,136 SF respectively)
m. Table Information has been adjusted to reflect previously approved developments.
Information provided by Woodstown.
n. A reduction of available lot area has been indicated to account for Right-of-Way, Open Space
and Basin requirements of potential development.
o. Individual parcels with less than the minimum lot size for each zone have not been assessed
an average daily flow value.
3. Future Sewer Service Area Buildout Analysis
Generally, the future sewer service area build out is prepared utilizing a “zoning
based” build out approach. The build-out of future sewer service areas typically consists
of evaluating residential, commercial and industrial flow projections to the extent of
development that could occur according to applicable zoning in developable areas, which
are outside of the existing SSA.
All proposed flows for the Borough of Woodstown, included as part of this WMP
submission, are identified within section 5.E.2 above.
F. FUTURE WASTEWATER OUTSIDE OF SEWER SERVICE AREAS
Generally, the default wastewater management alternative to support development
in areas that are not designated as sewer service area is discharge to groundwater less
than 2,000 gallons per day. A nitrate dilution analysis for septic systems is typically
performed, in similar fashion to that conducted for sewer service areas, except that
environmentally sensitive areas are not removed prior to performing the build out
analysis. The intent of this analysis is to assess the available dilution on a HUC 11 basis
used to establish the maximum number of units that can be built in a watershed and
continue to meet the regulatory nitrate target.

Page IX.15-20
The Borough of Woodstown’s existing sewer service area extends to the
municipal boundary. Consequently, the nitrate dilution analysis necessary for assessing
the future wastewater outside of a sewer service area is not applicable.
VI. ANALYSIS OF CAPACITY TO MEET FUTURE WASTEWATER NEEDS
This section of the wastewater management plan analyzes whether there is sufficient
wastewater treatment capacity to meet the needs of the Municipality based on the projections
described above. For sewer service areas this requires a comparison of the projected future
demand to the existing capacity of the sewage treatment plant.
A. ADEQUACY OF SEWAGE TREATMENT PLANT CAPACITY
Table 6.A.1 provides a comparison of existing wastewater treatment capacity with
existing and future flow demands within the municipality. Current treatment capacity was
taken from the most current NJPDES permit, and average daily flows for the WWTP
were taken from the NJDEP website database for NJPDES facilities. The final column
determines whether existing capacity is sufficient to accommodate the projected flows.
Details of the projections are included within the appendices and municipal chapters,
which also address any needs for new or expanded treatment facility discharges.
Table 6.A.1: Wastewater Treatment Plant Capacity
Treatment Works Permit # Current
Treatment
Capacity
Average
Daily Flows
2010
FWSA Build-
Out
Projection
Remaining
Treatment
Capacity
(mgd) (mgd) (mgd) (mgd)
Woodstown WWTP NJ0022250 0.53 0.346 0.152 0.032
The total treatment capacity for the sanitary sewer system that serves the
municipality (0.53 MGD) is greater than the projected flows necessary to support existing
demands and proposed development within the sewer service area (0.498 MGD). The
calculations were based on the proposed build-out projections and average daily flow
values utilized within the regulations for each type of development. Based on the analysis
presented above, sufficient wastewater treatment capacity exists to accommodate the
currently proposed FWSA.
B. ANALYSIS AND SELECTION OF TREATMENT ALTERNATIVES
This section is not applicable to this municipality, as sufficient capacity currently
exists to address the future wastewater management needs projected by the plan.
C. ANTIDEGRADATION ANALYSIS FOR NEW AND EXPANDED DOMESTIC
TREATMENT WORKS
This section is not applicable to this municipality as new or expanded wastewater
facilities are not being proposed at this time.

Page IX.15-21
D. DISCHARGES TO GROUND WATER
This Section is not applicable as the Borough of Woodstown’s existing sewer
service area extends to the municipal boundary and a nitrate dilution analysis has not
been provided, as indicated above.
E. ADEQUACY OF DILUTION TO MEET FUTURE NON-SEWER SERVICE AREA DEMAND
Generally, a wastewater estimation tool, provided by the Department is used to
compare existing zoning to the available nitrate dilution within each HUC11 in an effort
to determine whether adequate dilution is available to meet future non-sewer service area
demands. However, as indicated above, the Borough of Woodstown’s existing sewer
service area extends to the municipal boundary and this analysis is not applicable for this
municipality.
VII. FUTURE WATER SUPPLY AVAILABILITY
The purpose of the Depletive/Consumptive Water Use Analysis is to determine if there is
sufficient water supply to serve the proposed development of the municipality. The analysis
should compare the build-out water supply need with the existing permitted water allocation. To
complete the objective of this analysis, water allocation and drinking water demand within the
existing sewer service area were compared. A build-out projection of the proposed sewer service
area was then prepared to determine the additional water demands that may result. These
demands were also compared to the water allocation to verify whether sufficient water supply
exists to serve the proposed development.
A. SUFFICIENCY OF WATER SUPPLY
The Borough of Woodstown’s current water allocation and existing average water
demands are identified in Section 2 of this municipal chapter. Development of vacant
land was the predominant factor in determining future water supply needs. Further,
because external market and economic forces, such as interest rates, are a dominant factor
in determining the rate of construction, this analysis assesses the ability to provide
potable water while protecting surface and ground water quality for the entire projected
build-out allowable by zoning.
Proposed daily demands required to support development within the future sewer
service area utilized the same method of analysis as was performed for the sanitary sewer
analysis. Future demands are generally evaluated and projected based on two sets of data;
water demands projected within the existing sewer service area and proposed water
demands for the expanded sewer service area. Future water demands within the existing
sewer service area utilize a “parcel based” method for calculating the demand of infill
development. Whereas, future water demands within the expanded sewer service area
utilize a “zoning based” method for calculating the demand.

Page IX.15-22
Water demands were evaluated based on current zoning of identified developable
land. All projected flows were separated into residential, commercial, and industrial
components. Total projected build-out flow for residential, commercial and industrial
development was determined based on current zoning ordinances for the municipality
within areas proposed as the future sewer service area. Environmental constraints with
required buffers were also considered and indicated within the Mapping section of this
report.
Proposed daily demands were evaluated and projected based on two sets of data.
This included identified developable land within the existing sewer service area or infill
development as well as proposed future development within the expanded sewer service
area. The summaries for each of these sets of data are provided below.
1. Existing Sewer Service Area: Water Build Out Analysis
The build-out of the sewer service area consisted of evaluating residential,
commercial and industrial flow projections to the extent of development that
could occur according to applicable zoning in developable areas. The projections
are based on the potential for development of existing infill lots within areas
zoned for each use and the most current land use regulations for the municipality.
Generally, infill development of the existing sewer service area was prepared
utilizing a “parcel based” build-out approach.
The total number of potential units within each residential, commercial
and industrial district was then multiplied by the maximum percent building
coverage specified in the zoning ordinances to reach a maximum building area at
build-out. Generally, residential flows were projected assuming 320gpd / dwelling
unit. Commercial flows were projected assuming 0.125 GPD/sq.ft. of building
area.
Table 7.A.1.1 summarizes the build-out water demand projections for the
existing sewer service area. In addition, the table reflects a breakdown of the
acreage of land available for development (i.e., either undeveloped or
underdeveloped, and not constrained due to environmentally sensitive areas)
within each general zone of the municipality, based on the build-out analysis.

Page IX.15-23
The notes referenced below are indicated in the above table.
Notes:
a. The Developable Acres represents the identified acreage per zone within the FWSA.
b. The POTENTIAL UNITS represent the number of remaining units that may be constructed
within each zone within the sewer service area.
c. Average Daily Flow has been calculated based on current NJDEP regulations.
d. The TOTAL ADF represents the remaining potential build-out within the existing sewer
service area.
e. Conservation Zone CONS, Average Daily Flow Based on 320 GPD established for 3
bedroom dwellings.
f. Residential Zones, R1, R4, R5, R6 & R7, Average Daily Flow Based on 320 GPD
established for 3 bedroom dwellings.
g. Residential Zones, R2 & R3, Average Daily Flow Based on 225 GPD established for 1-2
bedroom dwellings.
h. Commercial Zone LC, ADF Based on 0.1 gal/SF established for a Floor Area of 8,000sf.
i. Commercial Zone C1, Average Daily Flow Based on 0.125 gal/SF established for a 2:1
Floor Area Ratio Applied to Lot Acreage.
j. Commercial Zone C2, ADF Based on 0.125 gal/SF established for a Floor Area of 8,500sf
k. Commercial Zone C3, ADF Based on 0.125 gal/SF established for a Floor Area of 8,500sf
for parcels less than 5 acres; 7500sf for greater than 5 acres
l. Industrial Zones LI, Average Daily Flow Based on 0.125 gal/SF established for Offices and
Industry (20% coverage of 3 Acres or 26,136 SF respectively)
Table 7.A.1.1: FWSA Water Supply Build-Out Projections
Zone Developable Acres Potential Units Average Daily Flow
(GPD)
Total ADF
(GPD)
See Note (a) See Note (b) See Note (c) See Note (d)
C1 0.71 15,385 0 1,923
C2 0.50 1 1,063 1,063
C3 9.65 16 1,063 14,504
CONS 0.34 0 320 0
CR 0.35 1 1,000 320
IR 12.39 111 1,000 35,520
LC 0.64 4 1,000 4,000
LI 11.13 3 3,267 9,801
R1 0.00 0 320 0
R2 2.86 17 225 3,825
R3 3.05 24 225 5,400
R4 0.00 0 320 0
R5 21.60 79 320 25,280
R6 25.65 92 320 29,440
R7 0.00 0.00 320 0
S1 0.00 0.00 320 0
Pilesgrove School 5,000
Previously Allocated Demand 27,000
TOTAL
(gpd) 163,076
(mgd) 0.163
(mgm) 5.055
(mgy) 59,523

Page IX.15-24
2. Future Sewer Service Area: Water Buildout Analysis
Generally, the future sewer service area build-out is prepared utilizing a
“zoning based” build-out approach. The build-out of future sewer service areas
typically consists of evaluating residential, commercial and industrial flow
projections to the extent of development that could occur according to applicable
zoning in developable areas, which are outside of the existing SSA.
The Borough of Woodstown’s existing sewer service area extends to the
municipal boundary. All proposed water demands for the Borough, included as
part of this WMP submission, are identified within section 7.A.1 above.
3. Analysis of Water Capacity to Meet Supply Needs
This section of the wastewater management plan analyzes whether there is
sufficient potable water treatment capacity to meet the needs of the Municipality
based on the projections described above. This requires a comparison of the
projected future demand to the existing capacity of the water supply system.
Table 7.A.3.1 provides a comparison of existing water allocation with
existing and future water demands within the municipality. The final column
determines whether existing capacity is sufficient to support projected daily
demands.
Table 7.A.3.1: Water Supply Capacity
Water System Permit #
Current Water
Allocation
(mgm)/(mgy)
Average
Demand 2010
(mgm)/(mgy)
FWSA Build-
Out Projection
(mgm)/(mgy)
Remaining
Water
Allocation
(mgm)/(mgy)
Woodstown Water
Department WAP070001 19.00 / 174.10 11.54 / 138.448 5.055 / 59.523 2.405 / (-23.871)
The total monthly water allocation for the water system that serves the
municipality is greater than the water supply necessary to support existing demands and
proposed development within the sewer service area. However, annual allocation would
be insufficient to support complete development of the FWSA. The projected calculations
were based on the proposed build-out projections and average daily demand values
utilized within the regulations for each type of development.
Based on the analysis presented above, the Borough of Woodstown appears to
have sufficient monthly allocation to accommodate the FWSA water build out, but the
annual diversion may be exceeded if the complete FWSA build-out is realized.

Page IX.15-25
As population increases and development expands, the Borough will need to
obtain water supply to support the FWSA in its entirety. Water conservation measures
could be enforced during peak water use periods in an effort to reduce the projected
annual water demand. However, it should be noted that conservation measures alone
would likely not be sufficient as the Borough's probably already realized much of the
available reduction as evidenced by low peak per capita use and low unaccounted for
water.
In addition to water conservation measures, the Borough may also elect to obtain
an additional/alternative water supply source. The Borough will need to review available
options and determine the feasibility of each option. Water supply additions/alternatives
that could be evaluated consist of interconnection to NJAW, construction of new wells,
and desalination.
1. Interconnection with NJAW: The closest potential interconnection with
NJAW is approximately 6 miles from Woodstown. A pipeline of this length
would be cost prohibitive and could have significant obstacles which may
include extending water supply mains through Preserved Farmland, road
opening/railroad crossing permits, stream crossings/FW wetlands permits,
etc.
2. Construction of New Wells: As stated above, the Department has concerns
regarding the water quality and quantity associated with Woodstown’s current
groundwater diversion sources. Based on a cursory review of available
published data from USGS, the Upper PRM aquifer may be a potentially
viable supplemental source of supply.
a. Woodstown should consider testing the water quality (i.e. for Sodium and
Chloride) in the Upper PRM aquifer before committing any substantial
resources to installing well(s) in the Upper PRM.
b. If the water quality is found acceptable and quantity sufficient,
Woodstown could even pursue replacing some or all of the existing
Middle PRM wells with Upper PRM well(s).
c. It should be noted that additional discussions would have to be engaged
between Woodstown and the Bureau of Water Allocation and Well
Permitting and the New Jersey Geological and Water Survey before
pursuing the installation of any new wells in the area.
3. Desalination: Construction, operation and maintenance costs may be cost
prohibitive based on Woodstown’s population and demands.
Given the options indicated above and considering the small size and location of
the municipality, in order for the Borough to obtain adequate annual allocation to support
the water supply demands of the existing and future sewer service area, a significant
investment could be required on the part of Woodstown.

Page IX.15-26
VIII. MAPPING REQUIREMENTS
A. BASIS FOR SERVICE AREA DELINEATIONS
The results of the required environmental analyses, summarized in Section III and
the delineation of the sewer service areas identified in section IV above provide
justification for the established service area delineations by demonstrating consistency
with all applicable NJDEP requirements and criteria. The Salem WMP provides the most
current planning efforts within the Sewer Service Area.
The Woodstown proposed Sewer Service Area encompasses the future sewer
service area necessary to implement the goals and objectives of the municipality. Those
areas have been reduced to account for the buffer requirements regarding wetlands, the
habitats of Threatened and Endangered Species and Riparian Corridors.
The proposed Woodstown Sewer Service Area does not contain any areas located
within the Pinelands. Areas located within the watershed of a Fresh Water One (FWl)
stream, as classified in the Surface Water Quality Standards, and/or that have Class I-A
ground water (Ground Water of Special Ecological Significance), as classified in the
Ground Water Quality Standards, are identified as "Non-degradation water areas based
on the Surface Water Quality Standards at NJ.A.C. 7:9B, and/or the Ground Water
Quality Standards at NJ.A.C. 7:9-6." Areas so designated are included on Map No.3.
Non-degradation water areas shall be maintained in their natural state (set aside for
posterity) and are subject to restrictions.
B. MAPPING CLASSIFICATION
The mapping for this municipal chapter of the WMP was created by using
available data from NJDEP, online GIS data sets and has been prepared in accordance
with NJDEP WMP guidelines. The maps included within this submission reflect the
requirements for preparing a Water Quality Management Plan Amendment. Five (5)
maps with specific features have been provided. Supplemental maps have been included
to clarify information in an effort to clearly depict the required information. Each map
has been provided with a complete and readily understandable legend. All 30” x 42”
maps have been developed using New Jersey Department of Environmental Protection
Geographic Information System digital data at a scale of 1” = 1 mile’. Additional 11” x
17” maps have been provided within each report for convenience. The maps are classified
below:
1. Map #1: WMP Municipal Map/Water Infrastructure
The map depicts the municipal boundary as well as the potable water
infrastructure, if applicable. The map also includes Woodstown Borough’s
municipal boundary, HUC-11, and existing water service infrastructure. There are
no areas within the Hackensack Meadowlands District, Pinelands Areas,
Pinelands National Reserves, or franchise areas within the Borough of
Woodstown. The Woodstown Sewerage Authority regulates all public sewer and
water within the WMP planning area.

Page IX.15-27
2. Map #2: Existing Facilities & Service Areas
The map depicts the existing wastewater service area. This map also
identifies the present extent of actual sewer infrastructure within the municipal
boundary of Salem City, including all sewer department buildings, existing
NJPDES facility (WWTP) locations, pump stations, force mains, and gravity
sewers. All areas outside the existing sewer service area are served by ISSDS with
wastewater planning flows of less than or equal to 2,000 gpd.
3. Map #3: Proposed Facilities & Service Areas
The map illustrates the wastewater service areas, non-degradation areas,
pumping stations, major interceptors and trunk lines, which are proposed to exist
in the future. The boundaries of future service areas coincide with recognizable
geographic or political features (i.e., roads, lot lines, zoning area boundaries,
water bodies). The proposed future infrastructure and facilities are also depicted
on the map. The existing infrastructure and facilities from Map No.2 are also
included in this map.
4. Map #4: Woodstown Borough Zoning Map
The map depicts the current zoning of the Borough of Woodstown. The
zoned minimum lot acreage for Commercial, Industrial and Residential areas
within the WMP proposed Sewer Service Area indicated in Table 8.B.4.1 below
were utilized to determine calculated flows within the future sewer service area.
ZoneMinimum
Lot Area
Minimum
Lot Width
Minimum
Lot Depth
Minimum
Front Yard
Setback
Minimum
side yard
setback
Minimum
rear yard
setback
Maximum
Building
Height
Maximum
Building
Coverage
Maximum
Impervious
Coverage
CONS 5 ACRES 300' 400' 80' 30' 60' 35' 5% 5%
R1 5 ACRES 150' 200' 40' 30' 40' 35' 20% 10%
R2 6,000 SF 50' 100' 30' 10' 20' 35 20% 10%
SINGLE FAMILY
DETACHED6,000 SF 50' 100' 30' 10' 20' 35' 20% 10%
TWIN / DUPLEX 7,500 SF 60' 120' 30' 10' 20' 25'
R4 6,800 SF 65' 100' 30' 10' 20' 35' 20% 10%
R5 8,000 SF 70' 100' 35' 15' 25' 35' 20% 10%
SINGLE FAMILY
DETACHED12,000 SF 90' 125' 35' 15' 20' 35' 20% 10%
MULTIFAMILY 5 ACRES 300' 400' 40' 20' 40' 35' 40% 30%
CLUSTER 8,000 SF 70' 100' 35' 15' 25' 35'
R7 18,000 SF 120' 140' 35' 20' 35' 35' 20% 10%
LC 6,000 SF 50' 100' 30' 10' 20' 35' 20% 10%
C1
2.0
(FLOOR
AREA
RATIO)
30' 100' 40'
C2 25,000 SF 125' 175' 50' 15' 20' 35' 15% 15*
PRINCIPAL USE 25,000 SF 125' 175' 50' 15' 20' 35' 15% 65%
SHOPPING CENTER 5 ACRES 400' 400' 150' 15' 40' 35' 25% 55%
SI 1 ACRE 150' 200' 50' 25' 25' 40'
LI 3 ACRES 250' 300' 50' 30' 50' 40'
SUPPLY INDUSTRIAL
LIGHT INDUSTRIAL
LIGHT COMMERCIAL
COMMERCIAL
COMMERCIAL
C3 COMMERCIAL
RESIDENTIAL
R6 RESIDENTIAL
RESIDENTIAL
RESIDENTIAL
R3 RESIDENTIAL
RESIDENTIAL
Table 8.B.4.1: Zoning Regulations
Zone Title
CONSERVATION
RESIDENTIAL

Page IX.15-28
5. Map No.5A: Environmental Features (Refer to County Map Set)
The map depicts environmental features indicated in N.J.A.C. 7:15-5.17
including major drainage basin boundaries (U.S.G.S. Hydrologic Unit Code
(HUC) 11 Watersheds), CAFRA boundary and flood prone areas (FEMA). Map
No.5A shows any New Jersey and Federal Wild and Scenic Rivers, FW 1-Trout
Production or FW 2 Trout Production or farmlands preservation areas. Streams
with FW2-NTC1/SE1 and FW2-NT/SE1 ranking are also shown.
6. Map No.5B: Environmental Features (Refer to County Map Set)
The map depicts environmental features indicated in N.J.A.C. 7:15-5.17
including wetlands, required wetlands buffers, public open space and recreation
areas greater than or equal to (10) ten acres. Additional information including
major drainage basin boundaries (U.S.G.S. hydrologic unit code (HUC) 11
watersheds), landscape project areas for grasslands, emergent and forested areas
with rankings of 3, 4 and 5 are also shown. MapNo.5B shows any New Jersey and
Federal Wild and Scenic Rivers, FW 1 Trout Production or FW 2 Trout
Production or farmlands preservation areas.
7. Map No.5C: Environmental Features (Refer to County Map Set)
The map depicts environmental features indicated in N.J.A.C. 7:15-5.17
including the natural heritage priority sites for threatened and endangered species.
Landscape Project Areas for Forested Wetlands and Bald Eagle Foraging are
shown on this map. Map No.5C shows any New Jersey and Federal Wild and
Scenic Rivers, FW 1-Trout Production or FW 2 Trout Production or Farmlands
Preservation areas. C-1 water bodies are identified on the map as well. Sewer
service areas are excluded from the 300ft buffers of C-1 water bodies and on all
tributaries within the HUC 11 watershed.