
Wastewater Electrolysis Cell for Environmental … Cho_2015_thesis...Wastewater Electrolysis Cell...
200
Wastewater Electrolysis Cell for Environmental Pollutants Degradation and Molecular Hydrogen Generation Thesis by Kangwoo Cho In Partial Fulfillment of the Requirements for the degree of Doctor of Philosophy CALIFORNIA INSTITUTE OF TECHNOLOGY Pasadena, California 2015 (Defended August 28, 2014)
Transcript of Wastewater Electrolysis Cell for Environmental … Cho_2015_thesis...Wastewater Electrolysis Cell...

Wastewater Electrolysis Cell
for Environmental Pollutants Degradation
and Molecular Hydrogen Generation
Thesis by
Kangwoo Cho
In Partial Fulfillment of the Requirements
for the degree of
Doctor of Philosophy
CALIFORNIA INSTITUTE OF TECHNOLOGY
Pasadena, California
2015
(Defended August 28, 2014)

ii
2015
Kangwoo Cho
All Rights Reserved

iii
Dedicated to…
my lovely wife Soojeon

ivACKNOWLEDGEMENTS
When I took some coffee breaks with friendly squirrels on campus, I used to imagine the
moment I write this section, and that moment is now in front of me. Over the last four years
of my graduate study in Caltech, I feel myself getting solid both in theory and experiments
with respect to environmental chemistry and energy science. I was sincerely happy and
watched my enthusiasm soar as I plowed through these fields. My experience of Caltech
deeply encouraged me to devote my entire carrier to enhancing the science and technology
for environments. I would like to express my gratitude to a number of people who have
helped me to get through the Environmental Science and Engineering PhD program at
Caltech
First of all, my foremost gratitude should be given to my academic advisor, Professor
Michael R. Hoffmann. Without a doubt, he would be the world’s best advisor if the Times
Higher Education compiled a ranking for advisors. Professor Hoffmann has given me a lot
of freedom and inspiration to discover my own path of research. He has been always
supportive and encouraged me with excessive compliments which were often more than I
deserved. Among many other virtues as a mentor, I have to point out his valuable
comments stemming from his boundless knowledge on a variety of topics in environmental
science, as well as his friendship and kind consideration for my personal life in Pasadena.
Prof. Hoffmann allowed me numerous opportunities to teach graduate level classes and to
participate in conferences, which definitely cultivated my academic abilities. I also wish to
thank the committee members for my qualification exam, candidacy exam, and thesis
defense, which include Prof. William A. Goddard III, Prof. John H. Seinfeld, Prof. Mitchio
Okumura, Prof. Jess F. Adkins, Prof. Paul O. Wennberg, and Prof. Jared Renton Leadbetter.
vIt was my great honor to make team efforts with the former, current, and future
Hoffmann Group members. I enjoyed collaborating with the ‘Gates Team’, specifically
Daejung Kwon, Dr. Yan Qu, Dr. Pei Xiong, Dr. Su Young Ryu, Clement Cid, Cody Finke,
Asghar Aryanfar, Dr. Penvipha Satsanarukkit, and many others. The field experience in
India will be especially unforgettable. I believe they will continue to devote their efforts to
enhance livability in developing worlds. I was lucky to get helpful advice from visiting
professors Prof. Wonyong Choi, Dr. Kyung-Guen Song, Prof. Kwhang-Ho Choo, Prof.
Hyunwoong Park, and Prof. Jungwon Kim. It was my pleasure to work with visiting
students Jieun Shin, Joycie Jiao, Hanspeter Zöllig, and many others. Novel and penetrating
comments by Dr. A. J. Colussi were always impressive during the group meeting. Many
thanks are due to Dr. Nathan Dalleska for technical support at the Environmental Analysis
Center and Dr. Tae-Kyu Lee in Nano-Pac for the collaboration in preparation of electrodes
and reactor systems. My thanks to office mates Rifka Kameel, Francesca Riboni, Dr.
Himanshu Mishra, and colleagues Dr. Yi Zhang, Dr. Dr. Yubao Zhao, and many others.
I also want to acknowledge the Bill and Melinda Gates Foundation for the financial
support for this study and DOW Chemicals for recognizing my work with the 2012 SISCA
award. I owed my graduate study to many people in the Korea Institute of Science and
Technology, including Dr. Kyu-Hong Ahn, Dr. Seockheon Lee, Dr. Kyung-Guen Song,
and Dr. Seok Won Hong.
Finally, I would like to thank my wife Soojeon Yoo for always being next to me. My
parents and parents-in-law gave us constant support and bore the long-distance trip to visit
us. None of my academic progress and happy life in Pasadena would have been possible
without my family.

viABSTRACT
This study proposes a wastewater electrolysis cell (WEC) for on-site treatment of human
waste coupled with decentralized molecular H2 production. The core of the WEC includes
mixed metal oxides anodes functionalized with bismuth doped TiO2 (BiOx/TiO2). The
BiOx/TiO2 anode shows reliable electro-catalytic activity to oxidize Cl- to reactive chlorine
species (RCS), which degrades environmental pollutants including chemical oxygen
demand (COD), protein, NH4+, urea, and total coliforms. The WEC experiments for
treatment of various kinds of synthetic and real wastewater demonstrate sufficient water
quality of effluent for reuse for toilet flushing and environmental purposes. Cathodic
reduction of water and proton on stainless steel cathodes produced molecular H2 with
moderate levels of current and energy efficiency. This thesis presents a comprehensive
environmental analysis together with kinetic models to provide an in-depth understanding
of reaction pathways mediated by the RCS and the effects of key operating parameters. The
latter part of this thesis is dedicated to bilayer hetero-junction anodes which show enhanced
generation efficiency of RCS and long-term stability.
Chapter 2 describes the reaction pathway and kinetics of urea degradation mediated by
electrochemically generated RCS. The urea oxidation involves chloramines and chlorinated
urea as reaction intermediates, for which the mass/charge balance analysis reveals that N2
and CO2 are the primary products. Chapter 3 investigates direct-current and photovoltaic
powered WEC for domestic wastewater treatment, while Chapter 4 demonstrates the
feasibility of the WEC to treat model septic tank effluents. The results in Chapter 2 and 3
corroborate the active roles of chlorine radicals (Cl·/Cl2-·) based on iR-compensated anodic

viipotential (thermodynamic basis) and enhanced pseudo-first-order rate constants (kinetic
basis). The effects of operating parameters (anodic potential and [Cl-] in Chapter 3; influent
dilution and anaerobic pretreatment in Chapter 4) on the rate and current/energy efficiency
of pollutants degradation and H2 production are thoroughly discussed based on robust
kinetic models. Chapter 5 reports the generation of RCS on Ir0.7Ta0.3Oy/BixTi1-xOz hetero-
junction anodes with enhanced rate, current efficiency, and long-term stability compared to
the Ir0.7Ta0.3Oy anode. The effects of surficial Bi concentration are interrogated, focusing on
relative distributions between surface-bound hydroxyl radical and higher oxide.

viiiTABLE OF CONTENTS
Dedication .............................................................................................................................. iii Acknowledgements ................................................................................................................ iv Abstract ................................................................................................................................... vi Table of Contents ................................................................................................................. viii List of Figures ......................................................................................................................... xi List of Tables ......................................................................................................................... xv Chapter 1: Introduction ............................................................................................................ 1
1.1. Human Needs ............................................................................................................. 2 1.2. Technological Background ........................................................................................ 3
1.2.1. Wastewater Electrolysis Cell ............................................................................ 3 1.2.2. Electrochemical Degradation of Environmental Pollutants ............................. 4 1.2.3. Molecular H2 Production from (PV-Powered) Electrolysis of Wastewater .... 6 1.2.4. Mixed Metal Oxides Anodes ............................................................................ 7 1.2.5. Hetero-junction Anodes with BiOx/TiO2 Functionalities ................................ 9
1.3. Objectives and Potential Contribution of the Thesis ............................................... 12 1.4. Thesis Overview ....................................................................................................... 13 1.5. References ................................................................................................................ 14
Chapter 2: Urea Degradation by Electrochemically Generated Reactive Chlorine Species: Products and Reaction Pathways ........................................................................................... 17
2.1. Introduction .............................................................................................................. 19 2.2. Experimental Section ............................................................................................... 21
2.2.1. Preparation of BiOx/TiO2 Anode and Electrolysis Cell ................................. 21 2.2.2. Potentiostatic Electrolysis of NaCl Solutions with or without Urea ............. 22 2.2.3. Analytical Methods ......................................................................................... 24
2.3. Results and Discussion ............................................................................................. 25 2.3.1. RCS Generation on BiOx/TiO2 Anode ........................................................... 25 2.3.2. Aqueous and Gaseous Products Formed During Urea Degradation ............. 26 2.3.3. Urea Degradation Kinetics in a Divided Cell ................................................. 31 2.3.4. Urea Transformation Characteristics in Single Compartment Cell ............... 35 2.3.5. Byproducts Formation ..................................................................................... 39 2.3.6. Urea Degradation Pathways ............................................................................ 42
2.4. Supporting Information ............................................................................................ 43 2.4.1. Quantification of Molar Flow Rates of Gas Products .................................... 43 2.4.2. Measurement of Urea Concentration .............................................................. 44
2.5. References ................................................................................................................ 45 Chapter 3: Effects of Anodic Potential and Chloride Ion On Overall Reactivity In Electrochemical Reactors Designed for Solar-Powered Wastewater Treatment ................ 49

ix3.1. Introduction .............................................................................................................. 51 3.2. Experimental Section ............................................................................................... 52
3.2.1. Electrode Module ............................................................................................ 52 3.2.2. Characterization of the BiOx/TiO2 Anode ...................................................... 53 3.2.3. DC Powered Wastewater Electrolysis ............................................................ 53 3.2.4. Prototype PV Powered Wastewater Electrolysis ........................................... 54 3.2.5. Analysis ........................................................................................................... 55
3.3. Results and Discussion ............................................................................................. 55 3.3.1. Characteristics of the BiOx/TiO2 Anodes ....................................................... 55 3.3.2. Impact of Ea and [Cl–]ext. on COD Removal .................................................. 58 3.3.3. Impact of Cl· and Cl2
–· on COD Removal ..................................................... 61 3.3.4. Nitrogen Species ............................................................................................. 65 3.3.5. CE and Energy Consumption for Anodic Reactions ..................................... 67 3.3.6. Hydrogen Production ...................................................................................... 70 3.3.7. Prototype (20 L) PV Powered Wastewater Electrolysis ................................ 71
3.4. Supporting Information ............................................................................................ 74 3.4.1. Electrochemical Methods ................................................................................ 74 3.4.2. Prototype PV-powered Wastewater Electrolysis ........................................... 74 3.4.3. Analysis of Total and Fecal Coliform Concentration .................................... 76
3.5. References ................................................................................................................ 76 Chapter 4: Electrochemical Treatment of Human Waste Coupled with Molecular Hydrogen Production .............................................................................................................................. 81
4.1. Introduction .............................................................................................................. 83 4.2. Experimental Section ............................................................................................... 86
4.2.1. BiOx/TiO2 Electrode Preparation .................................................................... 86 4.2.2. Electrochemical Setup ..................................................................................... 86 4.2.3. Electrode Characterization .............................................................................. 87 4.2.4. Wastewater Sample Preparation ..................................................................... 88 4.2.5. WEC Experiments ........................................................................................... 89 4.2.6. Chemical Analyses .......................................................................................... 89
4.3. Results and Discussion ............................................................................................. 90 4.3.1. Voltammetric Characteristics of the WEC ..................................................... 90 4.3.2. Electrochemistry of the BiOx/TiO2 Anode in Dilute Chloride Solutions ...... 92 4.3.3. Electrochemical Kinetics in Dilute Chloride Solutions ................................. 97 4.3.4. Electrochemical Treatment of Fresh Urine .................................................. 101 4.3.5. Chlorine Transformation in the WEC with Model STEs ............................ 104 4.3.6. COD Removal Characteristics in WEC with Model STEs ......................... 109 4.3.7. Nitrogen Removal Characteristics in the WEC with Model STEs .............. 113 4.3.8. Current Efficiency and Energy Consumption of the WEC .......................... 115 4.3.9. Hydrogen Production in WEC with Model STEs ........................................ 120
4.4. Outlook for the Future ............................................................................................ 123 4.5. Supporting Information .......................................................................................... 125
4.5.1. Materials ........................................................................................................ 125 4.5.2. BiOx/TiO2 Electrode Preparation .................................................................. 126

x4.5.3. Electrochemical Methods .............................................................................. 127 4.5.4. Model Septic Tank Effluent Preparation ...................................................... 127 4.5.5. Analyses ........................................................................................................ 127 4.5.6. Kinetic Equations in the Absence of Oxidizable Pollutants ........................ 129 4.5.7. Instantaneous Current Efficiency (ICE) for Free Chlorine (FC) and Chlorate without the Presence of Pollutants .......................................................................... 130 4.5.8. Kinetic Equations in the Presence of Pollutants ........................................... 130 4.5.9. Instantaneous Current Efficiency (ICE) for COD degradation ................... 131
4.6. References .............................................................................................................. 132
Chapter 5: BixTi1-xOz Functionalized Hetero-junction Anode with an Enhanced Reactive Chlorine Generation Efficiency in Dilute Aqueous Solutions ........................................... 139
5.1. Introduction ............................................................................................................ 141 5.2. Experimental Section ............................................................................................. 144
5.2.1. Ir0.7Ti0.3Oy/BixTi1-xOz Hetero-junction Anode Preparation .......................... 144 5.2.2. Electroanalysis............................................................................................... 145 5.2.3. Potentiostatic RCS Generation and Formate Ion Degradation .................... 146 5.2.4. Surface Characterization ............................................................................... 147 5.2.5. Accelerated Life Test .................................................................................... 147
5.3. Results ..................................................................................................................... 147 5.3.1. Physico-chemical Properties ......................................................................... 147 5.3.2. Voltammetric Characteristics ....................................................................... 154 5.3.3. Reactive Chlorine Species Generation ......................................................... 158 5.3.4. Formate Ion Degradation .............................................................................. 161 5.3.5. Stability .......................................................................................................... 165
5.4. Discussion ............................................................................................................... 167 5.5. References .............................................................................................................. 173
Chapter 6: Outlook for the Future ....................................................................................... 178
6.1. Reaction Network in Wastewater Electrolysis Cell .............................................. 179 6.2. Application Scenarios of the WEC ........................................................................ 181
6.2.1. Toilet Wastewater Treatment ........................................................................ 181 6.2.2. Treatment of Other High Salinity Wastewater ............................................. 182
6.3. References .............................................................................................................. 185

xiLIST OF FIGURES
Number Page
Figure 1.1. Schematic diagram of photovoltaic-powered wastewater electrolysis cell for on-site waste treatment for reuse with simultaneous solar energy storage by hydrogen production ............................................................................................ 4
Figure 1.2. A schematic diagram of direct oxidation of organics (R) and indirect oxidation mediated by reactive chlorine species (RCS) on metal oxide (MOx) electrodes .................................................................................................. 8
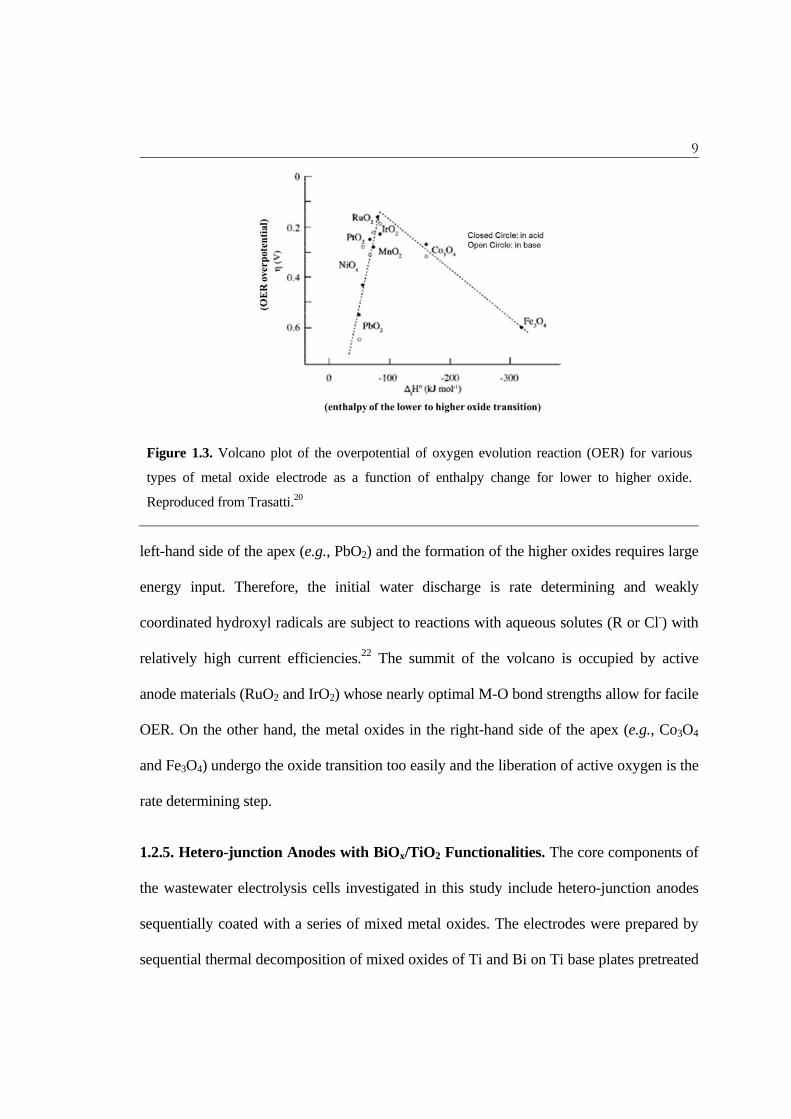
Figure 1.3. Volcano plot of the overpotential of oxygen evolution reaction (OER) for various types of metal oxide electrode as a function of enthalpy change for lower to higher oxide ........................................................................................... 9
Figure 1.4. Detailed fabrication procedure for slurry coat and overcoat described in Table 1.1 ............................................................................................................... 11
Figure 1.5. Overall composition of this thesis ....................................................................... 13 Figure 2.1. Schematic diagram of electrolysis cells (working volume: 60 mL) used in
this study ............................................................................................................... 22 Figure 2.2. Current efficiency (circle) and rate (square) of reactive chlorine generation
together with current density (triangle) on average as functions of applied anodic potential during potentiostatic electrolysis of 50 mM NaCl solutions in single compartment cell ................................................................................... 26
Figure 2.3. Time profiles of (a) total nitrogen, (b) total chlorine (ClDPD), (c) NH4+, and
(d) NO3- concentration during potentiostatic electrolysis of 41.6 mM urea
solutions with 50 mM Cl- (60 mL) in divided cell .............................................. 27 Figure 2.4. Time profiles of urea concentration during control electrolysis of 41.6 mM
urea solutions in a divided cell ............................................................................. 28 Figure 2.5. Relative intensities of ion fragments in quadrupole mass spectrometer
analysis of gaseous products during potentiostatic electrolysis of 41.6 mM urea solutions with 50 mM Cl- (60 mL) in single compartment cell .................. 30
Figure 2.6. Time profiles of relative intensities for ion fragments m/z 2 and 28 in quadrupole mass spectrometer analysis during potentiostatic electrolysis of 41.6 mM urea solutions with 50 mM Cl- (60 mL) in divided cell ..................... 32
Figure 2.7. Time profiles of total nitrogen (circle), total chlorine (triangle), ammonium (square), and nitrate (diamond) concentration together with molar flow rate of N2 (solid line) and CO2 (dotted line) during potentiostatic electrolysis of 41.6 mM urea with 50 mM Cl- (60 mL) in single compartment cell .................. 36
Figure 2.8. Total Nitrogen (TN) concentrations as functions of specific passed charges during potentiostatic electrolysis of 41.6 mM urea solutions with 50 mM Cl- (60 mL) in a divided (triangle) and single compartment (square) cell ......... 39
Figure 2.9. Evolutions of ClO3- concentration as functions of electrolysis times and
(inset) specific passed charges during potentiostatic electrolysis of 41.6 mM urea solutions with 50 mM Cl- (60 mL) in a divided (triangle) and single compartment (square) cell .................................................................................... 40
Figure 2.10. Proposed reaction pathways of urea degradation by electrochemically generated reactive chlorine species (RCS) ......................................................... 42

xiiFigure 2.11. Time profiles of urea concentration during potentiostatic electrolysis of 41.6
mM urea solutions with 50 mM Cl- (60 mL) as control ..................................... 45
Figure 3.1. Cyclic voltammetry of the BiOx/TiO2 anode in 30 mM NaCl solution with three repetitive scans at a scan rate of 5 mV sec–1 ............................................... 56
Figure 3.2. Evolution of current densities along with variations in Cl– concentration under variable applied anodic potential (L: 2.2 V, H: 3.0 V NHE) and added Cl– concentration (0, 10, 30, 50 mM) in electrolysis experiments using domestic wastewater samples .............................................................................. 59
Figure 3.3. Time profiles of COD concentration under variable applied anodic potential (L: 2.2 V, H: 3.0 V NHE) and added Cl– concentration (0, 10, 30, 50 mM) in electrolysis experiments using domestic wastewater samples ........................ 60
Figure 3.4. Evolutions of (a) total chlorine (ClDPD) and (b) Cl– concentration as functions of variations in COD concentration under variable applied anodic potential (L: 2.2 V, H: 3.0 V NHE) and added Cl– concentration (10, 30, 50 mM) in electrolysis experiments using domestic wastewater samples ............. 63
Figure 3.5. Time profiles of ClO3– concentration in electrolysis experiments using
domestic wastewater samples under variable applied anodic potential (L: 2.2 V, H: 3.0 V NHE) and added Cl– concentration (0, 10, 30, 50 mM) .......... 65
Figure 3.6. Time profiles of (a) NH4+ and (b) NO3
– concentration under variable applied anodic potential (L: 2.2 V, H: 3.0 V NHE) and added Cl– concentration (0, 10, 30, 50 mM) in electrolysis experiments using domestic wastewater samples ................................................................................................................. 66
Figure 3.7. General current efficiencies for anodic reactions including COD oxidation, formation of N2, NO3
–, ClO3–, and free chlorine under variable applied
anodic potential (L: 2.2 V, H: 3.0 V NHE) and added Cl– concentration (10, 30, 50 mM) in electrolysis experiments using domestic wastewater samples ... 67
Figure 3.8. Time profiles for normalized concentration of total and fecal coliform during the photovoltaic-powered wastewater electrolysis cell (PWEC, 20 L) experiment using domestic wastewater (cell voltage: 4.9 V, added Cl– concentration: 50 mM) ........................................................................................ 73
Figure 3.9. Ohmic resistance between anode and reference electrode (R) and electric conductivity of bulk electrolyte as functions of added Cl– concentration ([Cl–]ext.) in bench-top electrolysis experiments using domestic wastewater samples ................................................................................................................ 75
Figure 4.1. Dependence of (a) iR compensated anodic potential (Ea – iR) on applied anodic potential (Ea), (b) cell potential (Ea – Ec) on Ea, and (c) logarithmic current density (J) on the Ea – iR during chronoamperometric experiment in a single compartment electrolysis cell with 10 mM (square, R: 21.9 Ω), 30 mM (triangle, R: 6.8 Ω), and 50 mM (circle, R: 4.8 Ω) NaCl solution (275 mL) ....................................................................................................................... 91
Figure 4.2. Cyclic voltammetry (CV) of a single compartment electrolysis cell with 50 mM NaCl (σ: 5.5 mS cm–1, R: 4.5 Ω, pH: 6.6) or 50 mM NaClO4 (inset, σ: 5.1 mS cm–1, R: 4.6 Ω, pH: 6.6) solution (275 mL) ............................................ 93
Figure 4.3. (a) Evolution of the formate concentration and (b) current variation under sequential substitution (2 mL, arrows) with 10 mM NaCOOH (σ: 0.92 mS/cm) in a potentiostatic (Ea : 3 V), single compartment electrolysis cell ....... 95

xiiiFigure 4.4. The variation of chloride (circle), free chlorine (triangle), and chlorate
(square) concentration as a function of (a) electrolysis time and (b) specific charge passed during potentiostatic (Ea : 3 V) electrolysis in 30 mM (filled, R: 7.0 Ω) and 50 mM (empty, R: 5.0 Ω) NaCl solution (55 mL) ..................... 99
Figure 4.5. Evolution of (a) chlorine species, (b) organic species, (c) nitrogen species, and (b inlet) cations (Ca2+, Mg2+) concentration in a potentiostatic (Ea: 3 V) WEC experiment (J: 247 ± 6 A m–2, Ea – iR: 2.15 ± 0.02 V, Ea – Ec: 5.41 ± 0.04 V) with diluted human urine (pH: 6.6, σ: 6.05 mS cm–1, 55 mL) ............ 103
Figure 4.6. Evolution of (a) current density (J), (b) iR-compensated anodic potential (Ea – iR), and (c) cell voltage (Ea – Ec) in potentiostatic (Ea: 3 V) WEC experiment with model septic tank effluents ..................................................... 105
Figure 4.7. Time profiles of (a) chloride, (b) chlorate, and (c) ClDPD concentration together with (b, inset) scatter plots of increase of chlorate versus decrease of chloride concentration, (d) COD versus chloride concentration, and (e) ammonium ion versus chloride concentration in potentiostatic (Ea: 3 V) WEC experiments with model septic tank effluents ......................................... 107
Figure 4.8. Time profiles of COD concentration in potentiostatic (Ea: 3 V) WEC experiments with model septic tank effluents ................................................... 110
Figure 4.9. Scatter plot for (a) protein, (b) carbohydrate, and (c) carboxylates concentration versus COD concentration together with (a, inlet) pseudo-first-order rate constants for protein degradation in potentiostatic (Ea: 3 V) WEC experiments with model septic tank effluents ......................................... 112
Figure 4.10. Time profiles of (a) TN, (b) NH4+, and (c) NO3
– concentration together with scatter plots for (a, inlet) TN versus NH4
+ concentration and (c, inlet) NO3
– versus removed NH4+ concentration in potentiostatic (Ea: 3 V) WEC
experiments with model septic tank effluents ................................................... 114 Figure 4.11. Variations in (a) COD concentration, (b) TN concentration, (c) nitrate
concentration, and (d) chlorate concentration as a function of specific passed charge in potentiostatic (Ea: 3 V) WEC experiments with model septic tank effluents ............................................................................................ 117
Figure 4.12. Average current efficiency for COD, nitrogen, and chlorine conversion, and (b) specific energy consumption for COD and total nitrogen on average in potentiostatic (Ea: 3 V) WEC experiments with model septic tank effluents ...................................................................................................... 118
Figure 4.13. Dependency of (a) generation rate of total gaseous products (Q, solid circle), (b) volumetric fraction of hydrogen (XH2, void circle), (c) molar generation rate of hydrogen (FH2, square), (d) current and energy efficiency (CE in triangle and EE in diamond) for hydrogen generation on average current density (J) during gas collection (80 – 110 min and 300 – 330 min) in potentiostatic (Ea: 3 V) WEC experiments with model septic tank effluents .............................................................................................................. 121
Figure 4.14. (a) Variation in absorbance spectra (270 – 500 nm) along with the electrolysis time and (b) absorbance at 425 nm as a function of electrolysis time in potentiostatic (Ea: 3 V) WEC experiments with STE4 ......................... 124
Figure 5.1. Scanning Electron Microscopy (SEM) images of horizontal view for Ir0.7Ta0.3Oy/BixTi1-xOz hetero-junction anode with variable molar fraction of Bi with magnification of ×5000 (a – e) or ×1000 (f) ........................................ 148

xivFigure 5.2. Scanning Electron Microscopy (SEM) image (a) of cross-section view for
Ir0.7Ta0.3Oy /Bi0.3Ti0.7Oz hetero-junction anode with Energy Dispersive Spectroscopy (EDS) mapping of Ti (b), Bi (c), Ir (d), and Ta (e) ................. 149
Figure 5.3. X-ray diffraction patterns of hetero-junction anodes Ir0.7Ta0.3Oy / BixTi1-
xOz with variable molar fraction (x) of Bi (a) referenced with a library for metal oxides of interests (b) ............................................................................ 151
Figure 5.4. Fourier transform infrared spectroscopy with attenuated total reflectance (FTIR-ATR) analysis of Ir0.73Ta0.27Oy/BixTi1-xOz hetero-junction anodes with variable molar fraction (x) ...................................................................... 153
Figure 5.5. (a) Current generation during linear sweep voltammetry (scan rate: 5 mV sec-1) together with (a, inset) ohmic resistance measured by current interruption and (b) integrated charge (Q*) during cyclic voltammetry (scan range: 0.2 ~ 1.0 V NHE, scan rate: 20 mV sec-1) with Ir0.73Ta0.27Oy
/BixTi1-xOz hetero-junction anodes with variable molar fraction (x) ............. 156 Figure 5.6. Cyclic voltammogram of Ir0.7Ta0.3Oy/BixTi1-xOz hetero-junction anode
with variable molar fraction of Bi (x) referenced with Ir0.7Ta0.3Oy anode ...... 158 Figure 5.7. (a) Mean current density together with (b) specific rate and (c) current
efficiency of reactive chlorine species generation during the course of potentiostatic electrolysis with Ir0.7Ta0.3Oy/BixTi1-xOz hetero-junction anodes with variable molar fraction (x) ......................................................... 160
Figure 5.8. Time profiles of formate ion oxidation during the course of potentiostatic electrolysis with Ir0.7Ta0.3Oy/BixTi1-xOz hetero-junction anodes with variable molar fraction (x) .............................................................................. 163
Figure 5.9. Observed pseudo-first-order rate constant of formate ion oxidation with corresponding surface hydroxyl radical concentration during the course of potentiostatic electrolysis with Ir0.7Ta0.3Oy/BixTi1-xOz hetero-junction anodes with variable molar fraction (x) ......................................................... 164
Figure 5.10. Variations of cell voltage (a) together with cumulative molar amounts of dissociated Ti (b) and Bi (c) during the course of galvanostatic electrolysis with Ir0.7Ta0.3Oy/BixTi1-xOz hetero-junction anodes with variable molar fraction (x) .............................................................................. 166
Figure 5.11. Relationship between Q* as a parameter of electrochemically active surface area and crystalline dimension estimated from XRD intensity by Scherer equation ............................................................................................... 168
Figure 5.12. Estimated rate constant for transition from surface bound hydroxyl radical to higher oxide in 50 mM NaCOOH solutions ................................... 171
Figure 6.1. Reaction network in wastewater electrolysis cell ........................................... 179 Figure 6.2. Application scenario of wastewater electrolysis cell for treatment of
wastewater from a 30 capita public toilet ........................................................ 181

xvLIST OF TABLES
Number Page
Table 1.1. Fabrication procedure of BiOx/TiO2 hetero-junction electrodes used in this study (Chapter 2 – 4) ............................................................................................ 10
Table 2.1. The ohmic drop compensated anodic potential (Ea – iR) and current density (J) on average during the electrolysis of 41.6 mM urea solutions with 50 mM chloride (60 mM) under variable cell types and applied potentials (Ea) .... 34
Table 3.1. Composition of residential-strength wastewater used in this study .................... 54 Table 3.2. Reduction potential (E) at pH 7 and standard reduction potential (E0) at pH
0 for several redox couples involved in the electrochemical reactions .............. 56 Table 3.3. The iR-compensated anodic potential (Ea – IR), cell voltage (Ea – Ec),
current density (J), and power consumption (P) on average under variable applied anodic potential (Ea; L: 2.2 V, H: 3.0 V NHE) and added Cl– concentration ([Cl–]ext.; 0, 10, 30, 50 mM) in electrolysis experiments using domestic wastewater samples .............................................................................. 58
Table 3.4. Sampling time when COD below 30 mg L–1 was observed (tCOD30), concentration of COD, NO3
–, ClO3– and total chlorine at tCOD30, and specific
energy consumption (SEC) for unit COD removal at tCOD30 under variable applied anodic potential (L: 2.2 V, H: 3.0 V NHE) and added Cl– concentration (10, 30, 50 mM) in electrolysis experiments using domestic wastewater samples .............................................................................................. 69
Table 3.5. Hydrogen evolution for a given duration (200 – 230 min) under variable applied anodic potential (L: 2.2 V, H: 3.0 V NHE) and added Cl– concentration (10, 30, 50 mM) in electrolysis experiments using domestic wastewater samples .............................................................................................. 70
Table 4.1. Composition of the as-received domestic wastewater (DWW), urine, and model septic tank effluent .................................................................................... 88

1 C h a p t e r 1
INTRODUCTION

2 1.1. HUMAN NEEDS
Current world water crisis manifests that more than 2.5 billion people worldwide lack
access to improved sanitation and waste disposal facilities, most often in developing areas
such as South Asia, Indonesia and Africa.1 In these emerging countries, human waste and
open defecation are major sources of waterborne diseases. The biochemical oxygen
demand (BOD) from human waste discharge into receiving waters is becoming a threat to
biodiversity.2 Consequently, there have been growing demands for research and
development to find breakthroughs in on-site wastewater treatment and water reuse
technologies. When considering the deficiency of underground infrastructures, water
treatment and reuse practices suitable to use in the developing world should be self-
contained with reduced consumptions of water, energy, and capital costs.3,4 Even in the
developed world, a growing need for sustainability and water treatment capacity along with
an increase in population density has forced water treatment criteria more stringent in order
to enhance livability and water use efficiency.5 Corresponding demands for reduction in the
total maximum daily loads of pollutants also drive towards on-site wastewater treatment
practices due to difficulties in building or retrofitting a centralized wastewater treatment
plant.4
On the other hand, extensive efforts are underway to develop renewable energy
sources with negligible carbon footprints. Electrochemical water splitting is often used for
the production of molecular hydrogen via alkaline and solid oxide electrolysis that have
current efficiencies for a hydrogen production up to 67%.6 The dominant fraction of the
hydrogen production cost is coming from the electricity consumption and partially the
3 operational costs for chemicals including potassium hydroxide or other solid electrolytes.
The US department of energy7 established a goal to reduce the total hydrogen production
cost by virtually 50% in within the next 10 years. Therefore, a different strategy to finding
an alternative electrolyte is required to reduce the electricity and chemical reagents
consumption for molecular hydrogen production.
1.2. TECHNOLOGYCAL BACKGROUND
1.2.1. Wastewater Electrolysis Cell. A well-designed wastewater electrolysis cell (WEC,
Figure 1.1) can provide a feasible approach for self-sustainable on-site wastewater
treatment with simultaneous decentralized H2 production. Chloride ion is a ubiquitous,
naturally occurring anion providing electric conductivity and, when employing saline
wastewater as a background electrolyte for electrochemical water splitting, the chloride ion
is oxidized to reactive chlorine species (RCS, Cl·, Cl2, and conjugate species) to remove
environmental pollutants including organics, ammonium ion, and coliform bacteria.8 This
green chemistry that acts without external chemicals can be totally driven by photovoltaic
(PV) panels,9 which makes the PV-powered WEC (PWEC) a traditional infrastructure-free
approach.10 Simultaneously with the wastewater treatment, solar energy storage is possible
by cathodic production of H2, which can be utilized as a secondary energy source for the
PWEC or for other domestic living purposes.11 By this dual-functioning approach, one can
reduce the cost of electrolytic H2 production, particularly the cost for electrolyte and
electricity, by saving energy for water treatment. Recent statistics suggest that handling
water and wastewater occupied up to 4% of total electricity consumption in

4
Figure 1.1. Schematic diagram of photovoltaic-powered wastewater electrolysis cell for on-site
waste treatment for reuse with simultaneous solar energy storage by hydrogen production.
the US and the collection and treatment of wastewater consume up to 5 Wh of electricity
per gallon of wastewater in California.12
1.2.2. Electrochemical Degradation of Environmental Pollutants. The electrochemical
system has often been used for treatment of high-salinity wastewater such as dye (textile)
wastewater, landfill leachate, olive mill wastewater, tannery wastewater, livestock industry
wastewater, and reverse osmosis concentrates, among many other usages. In addition,
degradations (mostly oxidative) of non-biodegradable or recalcitrant environmental
pollutants (pesticides, pharmaceuticals and personal care products, polycyclic aromatic
hydrocarbons, and other aliphatic/phenolic compounds) have been widely investigated in
electrochemical cells, usually employing laboratory-generated electrolyte (substrates of
interest in background electrolyte). More thorough reviews on the electrochemical
wastewater treatment can be found in recent reports by Panizza and Cerisola,13 Martinez-
Huitle and Ferro,14 and Chaplin.15
5 Electrochemical wastewater treatment systems with a wide array of electrodes have
conventionally categorized the electro-catalytic anodes into the following two groups:
active electrodes and non-active anodes. Since the non-active anodes actually do catalyze
heterogeneous oxidation of environmental pollutants, these terminologies should be
interpreted in terms of electro-catalytic activity for oxygen evolution reaction (OER). In
other words, the most common non-active anodes include SnO2, PbO2, and boron-doped
diamond (BDD), which show relatively high over-potential for OER. In contrast, mixed
metal oxides electrodes based on IrO2 or RuO2 have the lowest OER over-potential and are
referred to as active anodes in the field of electrochemical wastewater treatment.
Based on the mechanistic point of view, on the other hand, electrochemical pollutants
oxidation is referred to either as direct oxidation or indirect oxidation. Despite some
discrepancy among researchers, direct oxidation generally corresponds to heterogeneous
oxidation of target pollutants on the anode surface, while indirect oxidation accounts for
homogeneous oxidation of pollutants often mediated by reactive oxygen species (ROS) and
the RCS. In spite of a possibility of direct electron transfer from the target pollutants to the
anode, the heterogeneous direct oxidation has been almost exclusively ascribed to the
surface bound ROS, particularly hydroxyl radical (·OH). When the anode surface under a
potential bias is able to liberate free ROS, as reaction intermediates or byproducts of OER,
the indirect oxidation can take place via mediation of homogeneous ·OH, H2O2, and O3.
However, it is difficult to distinguish the direct oxidation by surface-bound ROS from the
indirect oxidation by free ROS, due to the short life and low yield of free ROS. Therefore,
the RCS generated in the presence of a chloride ion (usually in 10 mM to 100 mM range)
in the electrolyte has been appreciated as the primary mediator of indirect oxidation.

6 1.2.3. Molecular H2 Production from (PV-Powered) Electrolysis of Wastewater. A
wastewater electrolysis cell may prove to be a promising approach for decentralized H2
production with simultaneous on-site wastewater treatment. Hoffmann and co-workers8,9,16-
18 have investigated the electrolytic H2 production from model organics containing
solutions or real wastewater (domestic or industrial wastewater) in circum-neutral pH. In
these reports, inexpensive stainless steel was employed as a cathode. The cathodic current
efficiency and energy efficiency of H2 production have been reported to vary widely
depending on the electrolyte composition (NaCl or Na2SO4 background, electrical
conductivity, concentration of electron donating substrates other than water), cell
configuration (distance between anode and cathode, geometric area), and operating
condition (applied cell voltage). The reported values ranged from 40 to 80% for current
efficiency and from 15 to 60% for energy efficiency. The major scavenging reactions for
H2 production include reduction of RCS (to chloride ion) in NaCl background and
reduction of oxygen (to superoxide radical and its dissociation products). The current
efficiency for H2 production was usually higher in the NaSO4 background than in the NaCl
background. In the NaCl background solution, a presence of electron donating substrates
enhances the current and energy efficiency of H2 production. For example, batch injections
of small amounts of organics including urea, phenol, and other oxidizable organics sharply
enhanced the production of H2. The RCS competing with water and proton to accept
electrons can be readily quenched by the organics to enhance the H2 production. The
energy efficiency of H2 production decreased as the electrical conductivity decreased or
applied cell voltage (or current) increased, primarily owing to the increase in ohmic energy
loss. Park et al.9,17 would be the first to attempt electrolytic H2 production from dilute

7 aqueous solutions, which was solely powered by photovoltaic panels. In these reports, the
sequential energy losses in the PV panel and the electrolysis cell resulted in net energy
conversion efficiency about 1% (2.5% energy efficiency for solar light to direct current and
30~60% energy efficiency for the direct current to H2).
1.2.4. Mixed Metal Oxides Anodes. Electrochemical water oxidation on metal oxides
(MOx) anodes has long been believed to initiate from a formation of surface bound
hydroxyl radical (MOx(·OH)).19 The oxygen evolution activity is largely coming from the
transition of the surface bound hydroxyl radicals to the chemisorbed active oxygen
(MOx+1).19 The MOx(·OH) is a strong oxidant (standard redox potential of free ·OH is 2.8
V versus Normal Hydrogen Electrode) and, as a rule of thumb, prefers oxidation of
pollutants or chloride ion to the OER. Boron doped diamond, SnO2, and PbO2 are well
known anode materials which can provide both the direct pollutants oxidation and indirect
oxidation with a presence of chloride ions. Owing to the high OER overpotential for these
non-active anodes, the resulting current efficiency of pollutants oxidation sometimes
approached unity, which could be mitigated by mass transport limitation. However, a
concomitant large kinetic barrier for the initial water discharge (MOx(·OH) formation)
requires relative large energy consumption and limits their application for H2 production
and energy storage purposes. On the contrary, the higher oxides favor liberation of the
lattice active oxygen to molecular O2 and a direct oxidation of pollutants is relatively
sluggish. Therefore, indirect oxidation mediated by RCS plays more important roles for the
anode materials undergoing facile redox oxide transition. RuO2 or IrO2 based metal oxides
anodes have been widely employed as active anodes with relatively low OER
overpotentials. Compared to the non-active anodes, the current efficiencies for the

8 pollutants oxidation are mostly lower on the active anodes, but more pronounced energy
efficiency can be achieved owing to the low kinetic barrier to the formations of MOx+1.
However, the high material cost for these precious metals is a major barrier for
commercialization. A pictorial illustration of the direct and indirect oxidation of pollutants
on metal oxide anodes is given in Figure 1.2.
Current discussion can be more elaborated on the volcano plot suggested by Trasatti20
which describes a relation between the OER overpotential and the enthalpy change in redox
transition from lower to higher oxides (Figure 1.3). It has been reported that the enthalpy
change in the oxides transition is well correlated with the bond strength between the oxide
ion and the central metal ion.21 The electrodes for direct oxidation would be located in the
Figure 1.2. A schematic diagram of direct oxidation of organics (R) and indirect oxidation
mediated by reactive chlorine species (RCS) on metal oxide (MOx) electrodes.19 MOx(·OH) and
MOx+1 stand for surface-bound hydroxyl radical and higher oxide, respectively.
9
Figure 1.3. Volcano plot of the overpotential of oxygen evolution reaction (OER) for various
types of metal oxide electrode as a function of enthalpy change for lower to higher oxide.
Reproduced from Trasatti.20
left-hand side of the apex (e.g., PbO2) and the formation of the higher oxides requires large
energy input. Therefore, the initial water discharge is rate determining and weakly
coordinated hydroxyl radicals are subject to reactions with aqueous solutes (R or Cl-) with
relatively high current efficiencies.22 The summit of the volcano is occupied by active
anode materials (RuO2 and IrO2) whose nearly optimal M-O bond strengths allow for facile
OER. On the other hand, the metal oxides in the right-hand side of the apex (e.g., Co3O4
and Fe3O4) undergo the oxide transition too easily and the liberation of active oxygen is the
rate determining step.
1.2.5. Hetero-junction Anodes with BiOx/TiO2 Functionalities. The core components of
the wastewater electrolysis cells investigated in this study include hetero-junction anodes
sequentially coated with a series of mixed metal oxides. The electrodes were prepared by
sequential thermal decomposition of mixed oxides of Ti and Bi on Ti base plates pretreated

10 with IrO2, Ta2O5, SnO2, and Bi2O3, as shown in Table 1.1.23 Based on an electron probe
microanalysis, the outer surface of the electrode is dominantly composed of bismuth,
titanium, and oxygen, to be designated as BiOx/TiO2 electrode.24 The hetero-junction
electrode fabrication is expected to bring about a shift in heterogeneous kinetics. In
particular, the surface BiOx/TiO2 functionality can provide active sites for hydroxyl radical
formation while the underlying precoat layer based on IrO2 would reduce the kinetic barrier
for water discharge. Also, the hetero-junction design should minimize losses of precious
IrO2, while the seal-coat layer based on SnO2 is believed to enhance the conductivity of the
electrode.23
Table 1.1. Fabrication procedure of BiOx/TiO2 hetero-junction electrodes used in this study
(Chapter 2 – 4).23
Layer Nominal
Composition Precursor Annealinga Repeat
Overcoat
(O)
TiO2/Bi2O3
(Ti:Bi = 70:30 mol%)
175 mM Ti-Glycolate Complex
+ 75 mM bismuth citrate in 225
mM NH4OH
500 ºC 4
250 ºC 2
250 ºCc 2
Slurrycoat
(Sl)
Bi-doped TiO2
(Ti:Bi = 96:4 mol%)
300 mM Bi-doped TiO2
(Bi:Ti = 4:96) in water (pH 11)250 ºCb 7
Sealcoat
(S)
SnO2/Bi2O3
(Sn:Bi = 90:10 mol%)
225 M SnCl4·5H2O
+ 12.5 mM Bi2O3 in 0.5 M HCl425 ºC 4
Precoat
(P)
IrO2/Ta2O5
(Ir:Ta = 67:33 mol%)
73 mM H2IrCl6·nH2O
+ 27 mM TaCl5 in 4 M HCl 525 ºC 6
a Annealing time is 10 min except for the final annealing (1 h).b Brush of Sl precursor and 4 V% O precursor before annealing.
c Brush 50 V& O precursor before annealing.

11 A series of investigations on the BiOx/TiO2 anodes noted reliable indirect oxidation of
various types of environmental pollutants (model phenol compounds,8,9,17,18 urea,25
arsenite,26 industrial wastewater,18 and domestic wastewater16) and stability during a long-
term electrolysis in circum-neutral pH. Nevertheless, the preparation procedure is actually
the outcome of technical trial-and-error, and somewhat complicated, as shown in Figure 1.4.
Therefore, it needs further modification to be a simplified preparation method. In addition,
the core nature of each layer relevant to the activity and stability is not fully understood.
Figure 1.4. Detailed fabrication procedure for slurry coat and overcoat described in Table 1.1.23

12 1.3. OBJECTIVES AND POTENTIAL CONTRIBUTIONS OF THE THESIS
The objectives of this study are to develop a wastewater electrolysis cell which includes
hetero-junction anodes as core components for potential application to toilet wastewater
treatment, and to provide an underlying scientific background particularly for the redox
transformation of environmental pollutants and molecular hydrogen production.
This study can be distinguished from the previous works by using bismuth doped
titanium dioxide (BiOx/TiO2) anode, which shows reliable electrocatalytic activity and
stability in long-term operation. In addition, simultaneous molecular hydrogen production
along with waste treatment is another unique feature of this study, and the multi-functional
approach of the electrochemical system can be denoted as wastewater electrolysis cell. In
the electrochemical wastewater treatment system, the complex reaction networks involve
heterogeneous and homogeneous ROS and RCS depending on the operating condition.
Therefore, there has been a controversy on the primary oxidants which account for the
mineralization of environmental pollutants. While the previous reports generally infer the
existence of various reactive oxidants based on the cell voltage, this study employs
potentiostatic electrolysis with precise monitoring of anodic potential and ohmic loss. The
experimental approach of this study allows more plausible explanations for the role of
various oxidants in comparison with their thermodynamic redox potentials. Comprehensive
environmental analyses coupled together with kinetic models are expected to provide in-
depth knowledge related with various redox reactions mediated by the chloride ion present
in human waste.

13 1.4. THESIS OVERVIEW
This thesis consists of the following six chapters. The overall composition of the thesis is
illustrated in Figure 1.5.
Chapter 1 – Introduction
Chapter 2 – Urea degradation by electrochemically generated reactive chlorine species:
Products and reaction pathways
Chapter 3 – Effects of anodic potential and chloride ion on overall reactivity in
electrochemical reactors designed for solar-powered wastewater treatment
Chapter 4 – Electrochemical treatment of human waste coupled with molecular
hydrogen production
Chapter 5 – BixTi1-xOz functionalized hetero-junction anode with an enhanced reactive
chlorine generation efficiency in dilute aqueous solutions
Chapter 6 – Outlook for the future
Figure 1.5. Overall composition of this thesis

14 1.5. REFERENCES (1) UN-water global annual assessment of sanitation and drinking-water (GLAAS) 2012
report: the challenge of extending and sustaining services; World Health Organization:
Switzerland, 2012.; http://www.un.org/waterforlifedecade/pdf/glaas_report_2012_eng.
pdf.
(2) Grant, S. B.; Saphores, J. D.; Feldman, D. L.; Hamilton, A. J.; Fletcher, T. D.; Cook, P.
L. M.; Stewardson, M.; Sanders, B. F.; Levin, L. A.; Ambrose, R. F.; Deletic, A.;
Brown, R.; Jiang, S. C.; Rosso, D.; Cooper, W. J.; Marusic, I. Taking the "Waste" out
of "Wastewater" for human water security and ecosystem sustainability. Science 2012,
337 (6095), 681-686.
(3) Onsite wastewater treatment systems manual; EPA/625/R-00/008; United States
Environmental Protection Agency: Washington, D.C., 2002.;
nepis.epa.gov/Adobe/PDF/P100FS7K.pdf.
(4) Guidelines for water reuse; EPA/600/R-12/618; United States Environmental Protection
Agency: Washington, D.C., 2012.; nepis.epa.gov/Adobe/PDF/P100FS7K.pdf.
(5) Clean Watersheds Needs Survey: Report to Congress; EPA-832-R-10-002; United
States Environmental Protection Agency: Washington, DC., 2008.;
water.epa.gov/scitech/datait/databases/cwns/upload/cwns2008rtc.pdf.
(6) The Fuel Cell Technologies Program Multi-Year Research, Development, and
Demonstration Plan; United States Department of Energy: Washington, D.C., 2012.;
http://energy.gov/eere/fuelcells/fuel-cell-technologies-office-multi-year-research-
development-and-demonstration-plan.
(7) 2013 Annual Progress Report: DOE Hydrogen and Fuel Cells Program; DOE/CO-
102013-4260; United States Department of Energy: Washington, D.C., 2013.;
http://www.hydrogen.energy.gov/annual_progress13.html.
(8) Park, H.; Vecitis, C. D.; Hoffmann, M. R. Electrochemical water splitting coupled with
organic compound oxidation: The role of active chlorine species. J Phys Chem C 2009,
113 (18), 7935-7945.

15 (9) Park, H.; Vecitis, C. D.; Hoffmann, M. R. Solar-powered electrochemical oxidation of
organic compounds coupled with the cathodic production of molecular hydrogen. J
Phys Chem A 2008, 112 (33), 7616-7626.
(10) Cho, K.; Qu, Y.; Kwon, D.; Zhang, H.; Cid, C. A.; Aryanfar, A.; Hoffmann, M. R.
Effects of anodic potential and chloride ion on overall reactivity in electrochemical
reactors designed for solar-powered wastewater treatment. Environ Sci Technol 2014,
48 (4), 2377-2384.
(11) Cho, K.; Kwon, D.; Hoffmann, M. R. Electrochemical treatment of human waste
coupled with molecular hydrogen production. Rsc Adv 2014, 4 (9), 4596-4608.
(12) Energy Demands on Water Resources: Report to Congress on the Interdependency of
Energy and Water; United States Department of Energy: Washington D.C., 2006.
(13) Panizza, M.; Cerisola, G. Direct and mediated anodic oxidation of organic pollutants.
Chem Rev 2009, 109 (12), 6541-6569.
(14) Martinez-Huitle, C. A.; Ferro, S. Electrochemical oxidation of organic pollutants for
the wastewater treatment: direct and indirect processes. Chem Soc Rev 2006, 35 (12),
1324-1340.
(15) Chaplin, B. P. Critical review of electrochemical advanced oxidation processes for
water treatment applications. Environ Sci-Proc Imp 2014, 16 (6), 1182-1203.
(16) Park, H.; Choo, K.; Park, H.; Choi, J.; Hoffmann, M. R. Electrochemical oxidation and
microfiltration of municipal wastewater with simultaneous hydrogen production:
Influence of organic and particulate matter. Chemical Engineering Journal 2013, 215-
216 (15), 802-810.
(17) Park, H.; Vecitis, C. D.; Choi, W.; Weres, O.; Hoffmann, M. R. Solar-powered
production of molecular hydrogen from water. J Phys Chem C 2008, 112 (4), 885-889.
(18) Choi, J.; Qu, Y.; Hoffmann, M. R. SnO2, IrO2, Ta2O5, Bi2O3, and TiO2 nanoparticle
anodes: electrochemical oxidation coupled with the cathodic reduction of water to
yield molecular H2. J Nanopart Res 2012, 14 (8).
(19) Comninellis, C. Electrocatalysis in the electrochemical conversion/combustion of
organic pollutants for waste-water treatment. Electrochim Acta 1994, 39 (11-12),
1857-1862.

16 (20) Trasatti, S. Electrocatalysis in the anodic evolution of oxygen and chlorine.
Electrochim Acta 1984, 29 (11), 1503-1512.
(21) Rossmeisl, J.; Qu, Z. W.; Zhu, H.; Kroes, G. J.; Norskov, J. K. Electrolysis of water on
oxide surfaces. J Electroanal Chem 2007, 607 (1-2), 83-89.
(22) Walter, M. G.; Warren, E. L.; McKone, J. R.; Boettcher, S. W.; Mi, Q. X.; Santori, E.
A.; Lewis, N. S. Solar water splitting cells. Chem Rev 2010, 110 (11), 6446-6473.
(23) Weres, O. Electrode with surface comprising oxides of titanium and bismuth and water
purification process using this electrode. U.S. Patent 7,494,583 B2, Feb. 24, 2009.
(24) Park, H.; Bak, A.; Ahn, Y. Y.; Choi, J.; Hoffmannn, M. R. Photoelectrochemical
performance of multi-layered BiOx-TiO2/Ti electrodes for degradation of phenol and
production of molecular hydrogen in water. J Hazard Mater 2012, 211, 47-54.
(25) Kim, J.; Choi, W. J. K.; Choi, J.; Hoffmann, M. R.; Park, H. Electrolysis of urea and
urine for solar hydrogen. Catal Today 2013, 199, 2-7.
(26) Kim, J.; Kwon, D.; Kim, K.; Hoffmann, M. R. Electrochemical production of
hydrogen coupled with the oxidation of arsenite. Environ Sci Technol 2014, 48 (3),
2059-2066.

ELECTTROCHEMI
PR
URE
ICALLY G
RODUCTS
C h a p t
EA DEGRA
GENERATE
AND REA
t e r 2
ADATION B
ED REACTI
ACTION PA
BY
IVE CHLO
ATHWAYS
ORINE SPEC
S
17
CIES:

18 ABSTRACT
This study investigated the transformation of urea by electrochemically-generated
reactive chlorine species (RCS). Solutions of urea with chloride ions were electrolyzed
using a bismuth doped TiO2 (BiOx/TiO2) anode coupled with a stainless steel cathode at
applied anodic potentials (Ea) of either +2.2 V or +3.0 V versus the normal hydrogen
electrode. In NaCl solutions, the current efficiency of RCS generation was near 30% at
both potentials. In divided cell experiments, the pseudo-first-order rate of total nitrogen
decay was an order of magnitude higher at Ea of +3.0 V than at +2.2 V due to the
generation of dichlorine radical (Cl2-·) ions. Quadrupole mass spectrometer analysis of
the reactor head-space revealed that N2 and CO2 are the primary gaseous products of the
oxidation of urea, whose urea-N was completely transformed into N2 (91%) and NO3-
(9%). The higher reaction selectivity with respect to N2 production can be ascribed to a
low operational ratio of RCS to N. The mass-balance analysis recovered urea-C as CO2 at
77%, while CO generation most likely accounts for the residual carbon. In light of these
results, we propose a reaction mechanism involving chloramines and chloramides as
reaction intermediates, where the initial chlorination is the rate-determining step in the
overall sequence of reactions.

19 2.1. INTRODUCTION
Urea is the most abundant nitrogen (N) carrier in human excreta,1-3 and therefore is the
dominant source of N in domestic wastewater. In spite of the relatively low toxicity of
urea, there is a growing concern that excessive N loading from toilet wastewater is
leading to the eutrophication of surface waters. Major cities located in sensitive coastal
areas are experiencing algal blooms in estuary waters that appear to be correlated to
nutrient loading from household septic systems.4 During transport through sanitary sewer
systems, urea-N is readily converted to NH4+-N via enzymatic hydrolysis by urease. In
septic systems, the pH can rise to 9 due to the protonation of ammonia released during
the enzymatic hydrolysis.5 Due to the heavy loading of N in human waste, various groups
are exploring source separation in order to harvest the urine at a reduced volume before
discharge into a large volume disposal system.2 In this respect, one can envision an on-
site method for removing the N loading due to urea and thus avoiding problems resulting
from the extended storage of toilet wastewater. Current demands on total maximum daily
load reductions may require decentralized wastewater treatment methods, due to limited
options for expanding the capacity of centralized wastewater treatment plants. The
Bosch-Meiser process used to produce urea also discharges wastewater loaded with
residual urea (< 30% of products1) and thus requires a direct urea treatment technology
other than the methods of adsorption or biological treatment that are currently employed.6
When compared to biological nitrogen removal processes (nitrification or Anammox)
for urine treatment whose hydraulic retention times range up to a few days,2
electrochemical treatment can be an efficient way to accomplish urea degradation at

20 relatively fast reaction rates (retention time within a few hours6,7). Operational flexibility
and energy sustainability can also be achieved when using a renewable energy source
(e.g., photovoltaic-panel8). Botte and co-workers9-11 investigated nickel (II) hydroxide
based electro-catalysts to facilitate a direct electron transfer from urea-N to anodes
operating in a strong alkaline solution (e.g., 1 to 5 M of KOH). Other electrochemical
systems have explored mixed metal oxide anodes based on RuO2, IrO2, and PtO2, to treat
urea (< 0.2 M) with near equi-molar amount of chloride ion.6,7,12,13 In these systems, free
reactive chlorine (HOCl or OCl-) appeared to be the primary oxidant leading to urea
degradation, while chloramines were often observed as reaction intermediates.12
There appears to be a reasonable consensus that N2 and CO2 are the eventual
products during chlorination of urea,7,13 although there are reports of N2O (nitrous oxide)
as a final N-containing product.14 However, little data can be found on the exact
speciation of the potential array of gaseous products. On the other hand, we recently
demonstrated that electrochemically generated chlorine radicals can rapidly reduce the
chemical oxygen demand in domestic wastewater.15 In this case, the reactive chlorine
species (RCS) is used as a collective term for the sum of free chlorines and chlorine
radicals such as the chlorine atom (Cl·) and chlorine radical anion (Cl2-·).
With these considerations in mind, we now report on the details of N transformation
during urea degradations via RCS generated on hetero-junction anodes functionalized
with bismuth-doped titanium dioxide (BiOx/TiO2). Parallel analyses of products
generated in the aqueous phase and gas phase allowed for mass and charge balance
determinations of the nitrogenous and carbonaceous species. The effects of applied

21 anodic potential (Ea) on the rates of total nitrogen (TN) decay and products formation
were also explored in order to assess the detailed roles of chlorine radicals during urea
oxidation. The degradation of urea by electrochemically generated RCS seems to
resemble the ‘chemical (most often using NaOCl)’ chlorination mechanisms14 (the
process used to investigate the formation of chlorinated byproducts in swimming pools).
However, we note that the differences in operational molar ratios of RCS to N as well as
the chlorine radical generation rates change the kinetic parameters and the selectivity
towards the final products in the electrolytic urea degradation.
2.2. EXPERIMENTAL SECTION
2.2.1. Preparation of BiOx/TiO2 Anode and Electrolysis Cell. In a typical
preparation,15,16 Ti metal sheets (0.5 mm thick, pretreated by sand-blasting, degreasing,
and etching) were doubly coated sequentially with mixed metal oxide layers by repetitive
thermal decomposition of Ir/Ta solution (73 mM H2IrCl6 and 27 mM TaCl5 in 4 M HCl;
anneal at 525 °C), Sn/Bi solution (225 mM SnCl4 and 12.5 mM Bi2O3 in 0.5 M HCl; at
425 °C), Ti/Bi slurry (ca. 300 mM Bi-doped TiO2; at 250 °C), and Ti/Bi solution (225
mM Ti-Glycolate complex and 25 mM bismuth citrate in 75 mM NH4OH; at 425°C).
Single compartment electrolysis cells (working volume of 60 mL) were prepared
using a BiOx/TiO2 anode and stainless steel cathode pair (3 × 2 cm2, 5 mm gap) with a
Ag/AgCl/Sat. KCl reference electrode (BaSi Inc., USA) whose Vycor® glass tip was 2
mm apart from the anode center. For divided cell configuration, a Pt wire encapsulated in
a tube with Vycor® glass frit separator was used as a cathode. A schematic diagram of

22
Figure 2.1. Schematic diagram of electrolysis cells (working volume: 60 mL) used in this
study.
each electrolysis cell is shown in Figure 2.1. The frit separator reduces interferences of
cathodic reactions to estimate more reliable kinetic parameters, while an increased
electrical resistance of the divided cell decreases the response current density (J) at a
given Ea. All electrochemical experiments were performed under potentiostatic
conditions driven by a SP-50 potentiostat (Bio-Logics, USA).
2.2.2. Potentiostatic Electrolysis of NaCl Solutions with or without Urea. The rate and
current efficiency of RCS generation were estimated in the single compartment cell with
50 mM NaCl solutions. The RCS evolution rates were measured in terms of total chlorine
(ClDPD) concentrations at a fixed time interval (2 min) three times. The relatively short
reaction duration (6 min) was intended to minimize the oxidation or reduction of RCS,
which would cause a non-linear increase of [RCS] with time.16,17 These experiments were
repeated with Ea varying from 1.5 to 3.0 V versus the normal hydrogen electrode (NHE).

23 The current efficiency for the RCS generation (ηRCS) was estimated by the following
equation:
dtI
CldVF DPD][2RCS (2.1)
where, V is electrolyte volume (0.06 L), F is Faraday constant (96485.3 C mol-1), [ClDPD]
is the concentration of RCS (M), I is current (A), and t is electrolysis time (sec).
The electrochemical urea degradation experiments were performed in a divided cell
(Ea: 2.2 V or 3.0 V NHE, 3 h) or in a single compartment cell (Ea: 3.0 V NHE, 6 h). The
reaction solution contained 41.6 mM (2.5 g L-1) of urea in the presence of 50 mM NaCl
(electrical conductivity: 5.6 ± 0.1 mS cm-1). The initial [urea] was in accordance with a
recipe for synthetic urine18 assuming 10-fold dilution by flushing. The molar ratio of
urea-N to Cl- (close to 1.7) was compatible with operational ranges in analogous
literature,6,12 while it was less than half of the observed ratios for fresh urine.2 We
rationalize the low urea-N/Cl- ratio by the scenario either of moderate storage before
treatment (decreasing [urea]) or reuse of treated effluent as flushing water (increasing [Cl-
]). Urea solutions with 50 mM Na2HPO4 (7.4 ± 0.1 mS cm-1) were also tested in the
divided cell as control experiments, to evaluate urea oxidation by a direct electron
transfer from urea to the semiconductor anode. Small aliquots of electrolyte were
sampled periodically to monitor the speciation of aqueous-phase N. Gaseous products in
the reactor headspace were analyzed by HPR-20 gas analysis system (Hiden Analytical,
USA) with a heated quartz inert capillary inlet under continuous purging of Ar gas (ca. 7
mL min-1).

24 2.2.3. Analytical Methods. The pH, conductivity and electrical resistance of solutions
before and after the electrolysis were determined using a pH meter (Mettler Toledo,
USA), a conductivity meter (VWR International, USA), and the current interruption
function of the potentiostat with a current bias of 200 mA, respectively. The [urea] was
determined using a hydrolysis method employing Jack Bean Urease as described
previously.16 However, the measured values of [urea] were reliable only for the control
experiments due to interferences of RCS with urease activity.20 The principal ions of
interest (Cl–, ClO3–, NO2
–, NO3–, NH4
+) were quantified by DX-500 ion chromatography
system (Dionex, USA), equipped with the anion-exchange column Ionpac AS 19 and the
cation-exchange column Ionpac CS 16. [TN] were determined using low range (0.5 to 25
mg N L–1) TN reagent kits (Hach, USA) according to absorbance at 420 nm in the UV-
VIS spectrophotometer (Agilent, USA) after digestion. The [ClDPD] was measured with
DPD (N,N-diethyl-p-phenylenediamine)/KI reagents (Hach, USA) based on the
absorbance at 530 nm. It has been reported that, in urea chlorination, the ClDPD accounts
for chlorinated urea species as well as inorganic chloramines.21 Analogous measurements
with DPD reagents (Hach, USA) were performed to quantify the fraction of free chlorine
in the ClDPD. The gaseous products underwent 70 eV electron impact ionization, and
fragments (m/z 1 to 300) were analyzed using a quadrupole mass spectrometer (QMS) in
a vacuum (< 5.0 × 10⁻⁶ Torr) generated by a turbo pump. The volume percent in the
headspace gas was assumed to be directly proportional to the ion current measured by the
QMS. Quantification of the gases of interest was based on the relative ion current
intensities of characteristic m/z (14 for N2, 44 for CO2) and the volumetric flow rate of
total gaseous products measured with a mass flow-meter (Bronkhorst, USA). The limit of

25 detection, defined as three times the standard deviation of the relative ion intensities
under injection of blank gas (Ar), was estimated to be ca. 100 ppm for m/z 1 to 46
(except fragments from Ar) and 1 ppm for m/z 47 to 300. Additional details are given in
Supporting Information.
2.3. RESULTS AND DISCUSSION
2.3.1. RCS Generation on BiOx/TiO2 Anode. Figure 2.2 shows the RCS generation
profiles obtained with the BiOx/TiO2 anode in 50 mM NaCl solutions with circum-neutral
pH. The ClDPD in absence of N compounds accounts for RCS, although it should exist
predominantly as free chlorine due to the short life of the chlorine radicals. Cl- oxidation
in terms of the specific RCS generation rate monotonically increased along with J as the
Ea increased from 1.5 to 3.0 V NHE (corresponding to cell voltages ranging from 2.5 to
6.0 V). The dependency of J on Ea was nominally linear in dilute chloride solutions due
to resistances between anode and the reference electrode; i.e., iR-drop attenuates the
exponential response of J described by the Butler-Volmer formulation.15 The ηRCS was
below 10% at Ea of 1.5 V NHE (slightly higher than the redox potential of the Cl2/Cl-
couple), and increased to 24 – 30% at higher potentials. The losses in current efficiency
(> 70%) can be dominantly ascribed to the oxygen evolution reaction. In the case of the
mixed metal oxide (BiOx/TiO2) anode, the surface titanol (i.e., >TiOH) groups provide
the active sites for surface hydroxyl radical formation, while the redox transitions of BiOx
(III/V) or underlying IrOx (IV/VI) serve as electron sinks.15

26
Figure 2.2. Current efficiency (circle) and rate (square) of reactive chlorine generation together
with current density (triangle) on average as functions of applied anodic potential during
potentiostatic electrolysis of 50 mM NaCl solutions in single compartment cell; anode:
BiOx/TiO2 (6 cm2), cathode: stainless steel (6 cm2). Error bars represent the standard deviations
for three samples collected with 2 min intervals.
In this study, the current efficiencies were quasi-constant at potentials higher than
1.8 V NHE. These observations have the following implications; i) the power efficiency
for RCS generation should decrease along with Ea, and ii) one can expect a linear
dependence of the RCS generation rate on J under the experimental conditions of this
study.
2.3.2. Aqueous and Gaseous Products Formed During Urea Degradation. Figure 2.3
shows the transformation of nitrogen during electrolysis of urea solutions with Cl- in the
divided cell. Urea degradation was negligible in a phosphate electrolyte or under Ea of

27
Figure 2.3. Time profiles of (a) total nitrogen, (b) total chlorine (ClDPD), (c) NH4+, and (d) NO3
-
concentration during potentiostatic electrolysis of 41.6 mM urea solutions with 50 mM Cl- (60
mL) in divided cell; anode: BiOx/TiO2 (6 cm2), cathode: Pt wire in frit separator, applied anodic
potential: 2.2 V NHE (empty circle), 3.0 V NHE (filled circle).

28
Figure 2.4. Time profiles of urea concentration during control electrolysis of 41.6 mM urea
solutions in a divided cell; Ea: (circle) 2.2 V NHE with 50 mM Na2HPO4, (triangle) 3.0 V NHE
with 50 mM Na2HPO4, (square) 1.3 V NHE with 50 mM NaCl, anode: BiOx/TiO2 (6 cm2),
cathode: Pt wire in frit separator.
1.3 V NHE in a chloride background (Figure 2.4). These results indicate that a direct
electron transfer from urea-N to surface sites on the anode is negligible. The [ClDPD] was
consistently below the detection limit in these control experiments so that a potential
interference of reactive oxygen species could be ruled out in subsequent electrolysis
experiments. We recently reported15,16 that, on the BiOx/TiO2 anode, the surface bound
hydroxyl radicals are readily quenched by redox transitions of Bi(III/IV) to form higher
oxides which prefer oxygen evolution to reactive oxygen species generation.16
The aqueous products from the electrolytic degradation of urea included NH4+, NO3
-,
chloramines (i.e., NH2Cl, NHCl2, NCl3), and chlorinated urea. Concentrations of free
chlorine were below the detection limit, indicating that the chloramines and chloramides
primarily account for the measured ClDPD. The time profiles of the aqueous products were
compatible with the previous reports on chemical urea oxidation by NaOCl.14 These

29 suggested that urea is sequentially chlorinated to tetrachlorourea which is oxidized
further to produce CO2 and inorganic chloramines.3,14 The reversible hydrolysis of
chloramines will yield NH4+ depending on the pH and the [RCS].22,23 In addition, the
inorganic chloramines are believed to undergo base catalyzed disproportionation to
produce gaseous N as in breakpoint chlorination24, while NHCl2 is further oxidized to
NO3-.22 The overall chemical reaction is known to be limited by the first chlorination step
of urea, whereas subsequent reactions proceed at much faster rates.3,14
At circum-neutral pH, the nominal second-order rate constant for the reaction of
urea with free chlorine was determined to be 0.63 M-1 s-1.25 In contrast, the bimolecular
reaction between NHCl2 and NCl3 has a rate constant of 5.6 × 10³ M-1 s-1,22 while the
reaction between NH2Cl and NCl3 has a bimolecular rate constant of 1.4 × 10² M-1 s-1. In
this study, the rate-limiting step in the reaction sequence was found to be the initial
reaction between urea and RCS as well. The evolution of gaseous nitrogen appeared to
correspond directly to the ‘urea + RCS ⟶ reaction intermediates’, since the rate of urea
degradation was correlated with the rate of TN decay. The sums of ClDPD, NH4+, and
NO3- concentrations were much smaller than the reduced TN concentrations, which in
turn should account for the production of gaseous N species.
Figure 2.5 shows the relative intensities of the ion fragments for the gas products in
the single compartment cell experiments. Based on the NIST/EPA/NIH Mass Spectral
Library (NIST11), the major peaks in the mass spectrum (m/z 1 to 46) consisted of H2
(m/z 1 and 2), O2 (m/z 34, 32 and 16), H2O (m/z 16 to 19), CO2 (m/z 44 to 46, 28, 22, 16,

30
Figure 2.5. Relative intensities of ion fragments in quadrupole mass spectrometer
analysis of gaseous products during potentiostatic electrolysis of 41.6 mM urea
solutions with 50 mM Cl- (60 mL) in single compartment cell; anode: BiOx/TiO2 (6
cm2), cathode: stainless steel (6 cm2), applied anodic potential: 3.0 V NHE. Error bars
represent the standard deviations of periodic measurement (detection interval: 1 min).

31 and 12), N2 (m/z 29, 28 and 14), and Ar (m/z 40, 38, 36 and 20). From the mass spectral
analysis, N2 appears to be the principal gaseous N product in urea degradation. A
negligible signal at m/z 30 (i.e., N2O) indicates that nitrous oxide is a trace-level product.
On the other hand, the ratios of mean signal intensities from H2 to those from O2 were
much higher than the stoichiometric ratio in water splitting (2:1). This implies that non-
stoichiometric water splitting was taking place. Heterogeneous Cl- oxidation appears to
be the main scavenging reaction of oxygen generation at the electrode surface.26 This
process in turn increases the bulk solution pH during electrolysis. Considering that the
intensity of m/z 15 was below the detection limit, a stripping of dissolved NH3 is not
apparent due to the low [NH4+] in solution (vide infra).
2.3.3. Urea Degradation Kinetics in a Divided Cell. As an extension of our recent
work,15 we argue that the electrochemical transformation of urea is accelerated by
generation of chlorine radical species. The mean current density at applied potential, Ea,
at 3.0 V NHE (83 A m–2) was 3.6 times higher than at 2.2 V NHE (23 A m–2). If the
heterogeneous RCS generation is rate limiting, then the formation rates of NO3- or N2
should be proportional to J, given the comparable values of ηRCS as shown in Figure 2.2.
However, the apparent pseudo first-order decay rate of TN (kTN) in Figure 2.3a was
estimated to be 4.4 × 10⁻⁶ s-1 and 4.0 × 10⁻⁵ s-1. The increase of kTN with Ea (9 times)
exceeds the proportionality as predicted by the values of J (3.6 times). In addition, the
initial rates of ClDPD evolution in Figure 2.3b increased by more than an order of
magnitude under the higher potential bias (5.5 × 10⁻⁸ M s-1 and 7.8 × 10⁻⁷ M s-1,
respectively, by linear regression to the initial three data points).

32
Figure 2.6. Time profiles of relative intensities for ion fragments m/z 2 and 28 in quadrupole
mass spectrometer analysis during potentiostatic electrolysis of 41.6 mM urea solutions with 50
mM Cl- (60 mL) in divided cell; Ea: 2.2 V NHE (dashed line), 3.0 V NHE (solid line), anode:
BiOx/TiO2 (6 cm2), cathode: Pt wire in frit separator. Inset figure shows the relative intensities
on average for ion fragments m/z 2, 28, 32, 44 for the initial 1 h.
The measurement of gaseous products in a divided cell (Figure 2.6) further supports
the enhanced N2 generation with increasing applied potential. When the Ea was set at 3.0
V NHE, mass fragments appeared immediately at m/z 2 (H2), 32 (O2), and m/z 28 (N2
and CO2). When the potential was set at 2.2 V NHE, in contrast, the generation of N2 and
CO2 were minimized, while the oxygen/hydrogen signals were found to be in good
agreement with the current density. These combined observations demonstrate that the
urea degradation is limited by the homogeneous reaction between urea and RCS.
The chemical reaction network for the electrochemical oxidation of urea mediated
by RCS can be summarized in terms of three kinetically significant steps. They are i)

33 heterogeneous RCS generation, ii) the initial reactions of RCS with urea, and iii)
subsequent oxidation reactions involving the initial reaction intermediate (expressed as
ClDPD) to produce N2. Given this simplification, the governing equations can be written as
eq 2.2 and 2.3:
[TN]]Urea[]RCS[2[TN]
i1 TNi
i kkdt
d
, kTN =
ii Rk ]CS[ i1 (2.2)
]Cl[]Urea[]Cl[
DPD*
2DPD kk
dt
dTN , k2
* = i
i Rk ]CS[ i2 (2.3)
where k1i and k2i represent the second order rate constants for the reaction of reactive
chlorine species i (RCSi) with urea and reaction intermediates (ClDPD), respectively. The
presence of the most abundant reaction intermediates should justify the usage of ClDPD as
an effective summation term. The pseudo-steady-state concentrations of RCSi allow for
the introduction of collective constants, kTN and k2*. Eq 2.3 corresponds to the situation in
which the initial oxidation of urea is the slow rate-determining step compared with the
following steps. In this case, monochlorourea was presumed to be the primary ClDPD,
since sequential chlorination would provide more acidic amido-N moieties which
undergo more facile hydrogen abstraction.14 Use of the divided cell reactor should
minimize other RCS-quenching reactions, such as cathodic RCS reduction and anodic
chlorate formation. For example, the final chlorate concentrations in the divided cell
experiments were less than 1% of the initial chloride concentration, primarily owing to
the relatively low current density (vide infra). The above set of simplified equations
describes the [TN] versus time in terms of a simple pseudo first-order decay profile

34 (when 2[Urea] ~ [TN]). Non-linear regressions to the observed [ClDPD] predicted k2
* of 5
× 10-4 sec-1 at 2.2 V NHE and 7 × 10⁻⁴ sec-1 at 3.0 V NHE.
The bulk solution pH increased up to 9.5 after the divided cell experiments, due to
the non-stoichiometric water splitting. The pKa of HOCl (7.5) and the solution pH
suggest that OCl- would be the dominant oxidant at the Ea of 2.2 V NHE. However, an
acidic environment in anode vicinity would allow for contributions of Cl2, which was
reported to have higher reactivity to urea than HOCl and OCl-.14 Although our simplified
kinetic approach could not provide rate constants of individual RCS, the collective
kinetic parameters (kTN, k2*) qualitatively indicate a shift in RCS speciation. The iR-
compensated anodic potential at Ea of 3.0 V NHE (Table 2.1) was greater than the
equilibrium potential needed to liberate ‘free’ chlorine radical species (Cl·/Cl2-·).15,26 In
this case, the urea degradation would be initiated by hydrogen abstraction or electrophilic
addition of chlorine atom by radicals, whose bimolecular rate coefficients are expected to
be much higher than those by free chlorine. Considering the [Cl2-·]/[Cl·] ratio with [Cl-]
Table 2.1. The ohmic drop compensated anodic potential (Ea – iR) and current density (J) on
average during the electrolysis of 41.6 mM urea solutions with 50 mM chloride (60 mM) under
variable cell types and applied potentials (Ea).
Cell Type Ea (V, NHE) Ea – iR (V, NHE) J (A m– 2)
Divided 2.2 1.73 (3.1) 23.8 (20)
3.0 2.24 (4.7) 83.3 (14)
Single Compartment 3.0 2.05 (3.5) 458 (7.5)

35 of 50 mM (7 × 10³ using Keq of 1.4 × 10³ M-1), the dichlorine radical anion is expected to
be the major radical species under our operating conditions.26 The reactivity between urea
and Cl2-· has not been reported in literature. As a reference, apparent rate constants of
free chlorine reacting with primary amines are in the order of 104 M-1 s-1,25 while the
reactivity of dichlorine radical has been reported up to 107 M-1 s-1.27 Nevertheless, the
increases of kTN and k2* with Ea were within similar orders of magnitude, indicating that
the roles of free chlorine should not be ignored even under the radical generation. The
Cl2-· radicals in the aqueous phase are expected to be rapidly disproportionated to free
chlorine with diffusion-limited second-order rate constants (> 109 M-1 s-1).26
2.3.4. Urea Transformation Characteristics in Single Compartment Cell. Additional
experiments were performed in a single compartment cell with a paired electrode module
(Ea: 3.0 V NHE) to investigate the transformation efficiency in a practical setup. As
shown in Figure 2.7, the [ClDPD] followed a typical profile of the breakpoint chlorination;
i.e., an initial rise with chloramines/chloramides production, subsequent decrease by
chloramine disproportionation to N2 until the breakpoint is achieved after 4 h, followed
by subsequent further increase of free chlorines. Free chlorine concentration was
inappreciable until 4 h of electrolysis, while almost superimposable to [ClDPD] for the last
sample (after 6 h). [NH4+] showed a peak (0.7 mM) at 3 h of electrolysis and decayed to
be negligible along with the dismutation of chloramines. Consequently, the initial urea-N
was almost completely transformed into nitrate and N2 after 6 h, where the residual [TN]
(~ 8 mM) roughly coincided with the [NO3-]. Figure 2.7c shows molar flow rate of N2
and CO2 quantified by volumetric gas flow rate and the observed QMS output signals of

36
Figure 2.7. Time profiles of total nitrogen (circle), total chlorine (triangle), ammonium
(square), and nitrate (diamond) concentration together with molar flow rate of N2 (solid line)
and CO2 (dotted line) during potentiostatic electrolysis of 41.6 mM urea with 50 mM Cl- (60
mL) in single compartment cell; anode: BiOx/TiO2 (6 cm2), cathode: stainless steel (6 cm2),
applied anodic potential: 3.0 V.

37 characteristic m/z ratios. The generation rates of these major gas products followed
exponential relationships as predicted by the pseudo first-order kinetic analysis. A mass
balance analysis for N indicated that 5 mmol of urea N is transformed into 4.56 mmol N
as N2 (91%) and 0.45 mmol N as NO3- (9%). The total amount of CO2 in the gas products
was quantified to be 1.92 mmol, somewhat smaller than the carbon input (2.50 mmol).
Furthermore, the signal response at m/z 28 was greater than the expected sum by the
characteristic m/z signals of N2 and CO2. These observations indicate that CO is being
formed as a minor carbon-containing product.
Greater selectivity for gaseous N species than for NO3- has been reported previously
in the electrochemical oxidation of urea5,7,8 and NH4+23,28. A lower selectivity toward
NO3- is beneficial with respect to the chlorine demands exerted by urea which, in turn,
should be proportional to the energy consumption in electrochemical systems.
Stoichiometric chlorine demands range from 3 to 8 mol mol-1 of Cl2/urea depending on
the selectivity. On the contrary, chemical urea chlorinations3,14 under initial chlorine
dosage exceeding 1 mol mol-1 of Cl2/urea have reported much higher relative yields of
NO3- (up to 40%). The nitrate yields appeared to monotonically increase with the applied
chlorine dosage (3 ~ 10 mol mol-1 of Cl2/urea), with observed chlorine demands up to 5
mol mol-1 of Cl2/urea.3 The NO3- is believed to be produced from dichloramine oxidation
by RCS,12,22 which should be more sensitive to the RCS concentration than N2 generation
reactions among chloramines. Therefore, a low yield for NO3- in the electrolytic urea
degradation can be attributed to a presumable low RCS/urea ratio with pseudo steady-
state concentration of RCS. The present results have some practical implications for
control of selectivity towards N2 and NO3- in treatment of N-containing wastewater. The

38 electrochemical urea chlorination with greater selectivity to N2 can be broadly deployed
for remediation of N-rich wastewater (black water from toilet and livestock industry,
landfill leachate), aiming at N loading reduction. When focusing on N recovery for
fertilizer production, increasing J is expected to elevate the nitrate yield,29 which is
consistent with our observations in this study. In the divided cell experiments under lower
J (Figure 2.3), the nitrate yield was estimated to be 3.7% at Ea of 3.0 V NHE. An external
RCS generation in a multi-component reactor with flow regulation can be another
feasible approach to enhance the nitrate yield.
Despite the higher TN decay rate with respect to the electrolysis time, the magnitude
of the TN decrease per unit of passed charge was lower in the single compartment cell
than in the divided cell (Figure 2.8) at a given Ea. The lower current efficiency in the
absence of the fritted-glass separator can be attributed to quenching reactions of RCS
such as cathodic reversion to Cl- and further oxidation to ClO3-.15,16 When the total passed
charge (5936 C) in the single compartment cell experiment was compared with the
theoretically required charge for the observed products, the current efficiency was
estimated to be 22% for N2 (6 e- transfer per molecule), 5.9% for NO3- (8 e-), 7.0% for
ClO3- (6 e-), and 1.4% for residual ClDPD (2 e-), respectively. The sum of anodic current
efficiency (36%) slightly exceeds the ηRCS measured in NaCl solutions (30%, Figure 2.2),
supporting the hypothetic CO generation as an electron source. The nominal energy
consumption in the single compartment cell electrolysis (6 h) was 186 kJ L-1,
considerably greater than in biological nitrogen removal process (ca. 5 kJ L-1).2 The
relatively intensive energy requirement of electrochemical approaches can be mitigated

39
Figure 2.8. Total Nitrogen (TN) concentrations as functions of specific passed charges during
potentiostatic electrolysis of 41.6 mM urea solutions with 50 mM Cl- (60 mL) in a divided
(triangle) and single compartment (square) cell; Ea: 3.0 V NHE, anode: BiOx/TiO2 (6 cm2).
by their compatibility with renewable energy sources. For example, our recent report15
estimated that about 3.5 m2 of a photovoltaic panel can achieve break-even energy
balance in an electrochemical system designed to treat wastewater from a community
toilet for 30 users.
2.3.5. Byproducts Formation. The electrolytic urea degradation in the single
compartment cell showed that ClO3- is a dominant aqueous-phase byproduct, most likely
formed by the heterogeneous oxidation of free chlorine (HOCl and ClO-).15,16 The [ClO3-]
increased almost linearly with the electrolysis time (or specific amount of charge passed)
until the breakpoint, after which the generation was accelerated (Figure 2.9). The [ClO3-]
profiles versus specific passed charges did not show a noticeable deviation between the

40
Figure 2.9. Evolutions of ClO3- concentration as functions of electrolysis times and (inset)
specific passed charges during potentiostatic electrolysis of 41.6 mM urea solutions with 50 mM
Cl- (60 mL) in a divided (triangle) and single compartment (square) cell; Ea: 3.0 V NHE, anode:
BiOx/TiO2 (6 cm2).
single component and divided cell. Therefore, the current efficiency of chlorate
production is likely more sensitive to the relative amount of potential electron donors to
RCS, than it is to J. In this study, the ClO3- was a stable byproduct without an appreciable
concentration of perchlorate ion (ClO4-). The ClO4
- has often been observed by oxidation
of ClO3- on a boron doped diamond anode.29 In light of the standard redox potential of
the ClO4-/ClO3
- couple (1.19 at pH 0), the production of ClO4- is likely to be kinetically
limited in our operational condition.
This study could not clearly identify the volatile chlorinated compounds other than
NH2Cl from a time lapse QMS measurement (detection interval: 1 min) of the gas
products (Figure 2.5b). The molecular ion signals from m/z 72 to 300 were always lower
than the limit of detection (1 ppm). Weak peaks at m/z 51 and 53 could be assigned to

41 NH2
35Cl and NH237Cl. Their maximum ion intensities were always observed at the start-
up and then decayed to below the detection limit within 1 h. The peak cluster at m/z 48 to
52 and 64 corresponded to chloromethane (CH335Cl and CH3
37Cl), chloroethane
(C2H535Cl), and their fragments. The other detected signals could not be explained in
terms of the chlorinated compounds in the database, although they most likely followed
fragmentation characteristics of condensed alkanes and alkenes (C4H8, C4H10, C5H10, and
C5H12), methyl isocyanate (CH3NCO), oxalic acid (H2C2O4), and acetic acid
(CH3COOH). However, these compounds with reduced oxidation states of carbon are not
likely to evolve from urea chlorination. Despite a lack of mass spectral data in the library,
we suspect that these peak clusters with minor fractions might be ascribed to chlorinated
carbamic acids or chlorinated hydrazines as potential reaction intermediates (vide infra).
Volatile disinfection byproducts reported in chlorinated swimming pools30-32 include
inorganic chloramines, CNCl, CHCl3, nitriles, and halonitroalkanes, depending on
precursor composition and applied Cl2/N ratio.32 Owing to the simple molecular structure
of urea with fully oxidized carbon, volatile byproducts from chemical urea chlorination
were almost exclusively chloramines.30,33 Although the appreciable chlorinated
byproducts from RCS mediated urea oxidation were limited to ClO3- and NH2Cl in this
study, a wide array of organics present in human wastes pose a risk of toxicity from other
chlorinated byproducts. The harmful byproducts potentially formed during
electrochemical treatment of human wastes may limit the reusability of the effluent to
non-potable purposes and require post-treatment units. Further investigation is necessary
to identify the matrix of by-products and their toxicity in more realistic situations.

2
r
2
i
e
n
r
c
Figure 2.10
reactive chl
ClO3-, (b1)
chlorinated
N2 and NO
RCS while
2.3.6. Urea
reaction pat
2.10. The e
intermediate
electron-wit
neighboring
radicals via
carbonyl do
0. Proposed
lorine specie
chlorinated
hydrazine m
O3- generation
the final prod
a Degradat
thways betw
evolution o
es. The init
thdrawing
g amido hy
a hydrogen a
ouble bond
reaction path
es (RCS); (a
carbamic ac
mediated chlo
n. Bold arrow
ducts are spe
tion Pathw
ween urea an
f [ClDPD] s
tial chlorina
effects of
ydrogen. Th
atom abstra
or resonan
hways of ure
a) Cl- oxidati
cids mediated
oramines and
ws in (b) an
ecified in bol
ays. Based
nd electroch
upports chl
ation step ap
substituted
he overall r
action and r
nce stabilize
ea degradatio
ion on BiOx/
d chloramine
d CO2 genera
nd (c) repres
ld characters.
on the exp
hemically ge
loramines a
ppears to b
Cl would
rate appears
rapid additio
ed C-N bon
on by electro
/TiO2 anode
es and CO2
ation, and (c)
sent redox re
.
perimental f
enerated RC
and chloram
e the rate d
d reduce th
s to be acc
on. A radica
nd should b
ochemically
to produce
(CO) genera
) chloramine
eactions invo
findings, w
CS as shown
mides as the
determining
he bond st
celerated by
al driven cl
be minimiz
42
generated
RCS and
ation, (b2)
mediated
olving the
we propose
n in Figure
e reaction
g since the
trength of
y chlorine
leavage of
zed in the

43 initial step, since the dominant carbon end product was observed to be CO2. The
dichlorourea or even monochlorourea will undergo rapid hydrolysis rather than further
chlorine substitution,34 via a pattern similar to base catalyzed haloform reaction, to
produce mono-/di-chloramine and carbamic acid. Further chlorinations of the carboxylic
intermediates produce more chloramines, CO2 and presumably CO as a minor product. A
generation of hydrazine by a Hoffmann rearrangement of monochlorourea is also
feasible,6 where CO is unlikely to form. The inorganic chloramines undergo a breakpoint
chlorination pathway to produce dominantly N2 or further oxidation to NO3- with a lower
yield.
2.4. SUPPORTING INFORMATION
2.4.1. Quantification of Molar Flow Rates of Gas Products. The m/z values of 14 and
44 were chosen as characteristic m/z for N2 and CO2, respectively. Potential interferences
from CO2, CO and N2O prohibited the ion intensity of m/z 14 to be used for N2
quantification. Based on the negligible signal at m/z 30, an interference of N2O to the
signal at m/z 44 was assumed to be marginal. The signal fraction of each characteristic
m/z was calculated by the ratio to the sum of ion intensities (m/z 1 to 300). Based on the
fragmentation profiles of standard N2 and CO2 provided by the supplier, the volume
fractions were calculated by the following equations:
T
i
N FI
IF
300
1
14
72
10802
(m/z 28:14:29 = 1000:72:8) (2.4)

44
T
i
CO FI
IF
300
1
44
1000
11992
(m/z 44:28:16 = 1000:114:85) (2.5)
where, Ii is ion intensity of fragment m/z i, while FN2, FCO2, and FT represent the molar
flow rate of N2, CO2, and total gaseous products, respectively. FT was calculated by
converting the observed volumetric flow rate using ideal gas law, while considering
conversion factors of the major gas components (1.4 for Ar, ca. 1 for H2, O2, N2, H2O).
obsArAr
T QRT
PXXF
1
1
1
4.1
(2.6)
where, XAr is the volumetric fraction of Ar, Qobs is the observed volumetric flow rate of
total gaseous products, P is the operational pressure (1 atm), R is the gas constant, and T
is the operational temperature (293 K).
2.4.2. Measurement of Urea Concentration. Figure 2.11 shows the evolution of the
urea concentration under variable current density conditions, which was measured by
urease hydrolysis method.16 The measured urea concentration dropped off for the first
sample under potential bias, whose further decrease was marginal. The required charge
for the decrease in urea concentration for the initial 10 min exceeded the total passed
charge, even when assuming one electron transfer for the urea transformation. The
presence of reactive chlorine species (RCS), even with a trace concentration, would
inhibit the activity of the enzyme urease.20 In addition, the RCS was found to interfere in
the spectrometric urea analysis by diacetylmonoxime.35 The color generation by the
reagent addition appeared to increase with the electrolysis time.

45
Figure 2.11. Time profiles of urea concentration during potentiostatic electrolysis of 41.6 mM
urea solutions with 50 mM Cl- (60 mL) as control; Ea: (circle) 2.2 V NHE in divided cell,
(triangle) 3.0 V NHE in divided cell, (square) 3.0 V NHE in single compartment cell.
2.5. REFERENCES
(1) Rollinson, A. N.; Jones, J.; Dupont, V.; Twigg, M. V. Urea as a hydrogen carrier: a
perspective on its potential for safe, sustainable and long-term energy supply. Energy
& Environmental Science 2011, 4 (4), 1216-1224.
(2) Maurer, M.; Pronk, W.; Larsen, T. A. Treatment processes for source-separated urine.
Water Research 2006, 40 (17), 3151-3166.
(3) De Laat, J.; Feng, W. T.; Freyfer, D. A.; Dossier-Berne, F. Concentration levels of urea
in swimming pool water and reactivity of chlorine with urea. Water Research 2011,
45 (3), 1139-1146.
(4) Clean watersheds needs survey: report to congress; EPA-832-R-10-002; United States
Environmental Protection Agency: Washington, DC., 2008.;
water.epa.gov/scitech/datait/databases/cwns/upload/cwns2008rtc.pdf.
(5) Amstutz, V.; Katsaounis, A.; Kapalka, A.; Comninellis, C.; Udert, K. M. Effects of
carbonate on the electrolytic removal of ammonia and urea from urine with thermally
prepared IrO2 electrodes. Journal of Applied Electrochemistry 2012, 42 (9), 787-795.

46 (6) Simka, W.; Piotrowski, J.; Robak, A.; Nawrat, G. Electrochemical treatment of aqueous
solutions containing urea. Journal of Applied Electrochemistry 2009, 39 (7), 1137-
1143.
(7) Hernlem, B. J. Electrolytic destruction of urea in dilute chloride solution using DSA
electrodes in a recycled batch cell. Water Research 2005, 39 (11), 2245-2252.
(8) Kim, J.; Choi, W. J. K.; Choi, J.; Hoffmann, M. R.; Park, H. Electrolysis of urea and
urine for solar hydrogen. Catalysis Today 2013, 199, 2-7.
(9) Boggs, B. K.; King, R. L.; Botte, G. G. Urea electrolysis: direct hydrogen production
from urine. Chemical Communications 2009, (32), 4859-4861.
(10) Vedharathinam, V.; Botte, G. G. Understanding the electro-catalytic oxidation
mechanism of urea on nickel electrodes in alkaline medium. Electrochimica Acta
2012, 81, 292-300.
(11) Yan, W.; Wang, D.; Botte, G. G. Electrochemical decomposition of urea with Ni-
based catalysts. Applied Catalysis B-Environmental 2012, 127, 221-226.
(12) Jara, C. C.; Di Giulio, S.; Fino, D.; Spinelli, P. Combined direct and indirect
electroxidation of urea containing water. Journal of Applied Electrochemistry 2008,
38 (7), 915-922.
(13) Simka, W.; Piotrowski, J.; Nawrat, G. Influence of anode material on electrochemical
decomposition of urea. Electrochimica Acta 2007, 52 (18), 5696-5703.
(14) Blatchley, E. R.; Cheng, M. M. Reaction mechanism for chlorination of urea.
Environmental Science & Technology 2010, 44 (22), 8529-8534.
(15) Cho, K.; Qu, Y.; Kwon, D.; Zhang, H.; Cid, C. A.; Aryanfar, A.; Hoffmann, M. R.
Effects of anodic potential and chloride ion on overall reactivity in electrochemical
reactors designed for solar-powered wastewater treatment. Environmental Science &
Technology 2014, 48 (4), 2377-2384.
(16) Cho, K.; Kwon, D.; Hoffmann, M. R. Electrochemical treatment of human waste
coupled with molecular hydrogen production. Rsc Advances 2014, 4 (9), 4596-4608.
(17) Bergmann, M. E. H.; Koparal, A. S. Studies on electrochemical disinfectant
production using anodes containing RuO2. Journal of Applied Electrochemistry 2005,
35 (12), 1321-1329.

47 (18) Wilsenach, J. A.; Schuurbiers, C. A. H.; van Loosdrecht, M. C. M. Phosphate and
potassium recovery from source separated urine through struvite precipitation. Water
Research 2007, 41 (2), 458-466.
(19) Revilla, M.; Alexander, J.; Glibert, P. M. Urea analysis in coastal waters: comparison
of enzymatic and direct methods. Limnology and Oceanography-Methods 2005, 3,
290-299.
(20) Ikematsu, M.; Kaneda, K.; Iseki, M.; Yasuda, M. Electrochemical treatment of human
urine for its storage and reuse as flush water. Science of the Total Environment 2007,
382 (1), 159-164.
(21) Shang, C.; Gong, W. L.; Blatchley, E. R. Breakpoint chemistry and volatile byproduct
formation resulting from chlorination of model organic-N compounds. Environmental
Science & Technology 2000, 34 (9), 1721-1728.
(22) Jafvert, C. T.; Valentine, R. L. Reaction scheme for the chlorination of ammoniacal
water. Environmental Science & Technology 1992, 26 (3), 577-586.
(23) Kapalka, A.; Katsaounis, A.; Michels, N. L.; Leonidova, A.; Souentie, S.; Comninellis,
C.; Udert, K. M. Ammonia oxidation to nitrogen mediated by electrogenerated active
chlorine on Ti/PtOx-IrO2. Electrochemistry Communications 2010, 12 (9), 1203-1205.
(24) Bunce, N. J.; Bejan, D. Mechanism of electrochemical oxidation of ammonia.
Electrochimica Acta 2011, 56 (24), 8085-8093.
(25) Deborde, M.; von Gunten, U. Reactions of chlorine with inorganic and organic
compounds during water treatment - Kinetics and mechanisms: A critical review.
Water Research 2008, 42 (1-2), 13-51.
(26) Park, H.; Vecitis, C. D.; Hoffmann, M. R. Electrochemical water splitting coupled
with organic compound oxidation: The role of active chlorine species. Journal of
Physical Chemistry C 2009, 113 (18), 7935-7945.
(27) Neta, P.; Huie, R. E.; Ross, A. B. Rate constants for reactions of inorganic radicals in
aqueous-solution. Journal of Physical and Chemical Reference Data 1988, 17 (3),
1027-1284.
(28) Kim, K. W.; Kim, Y. J.; Kim, I. T.; Park, G. I.; Lee, E. H. Electrochemical conversion
characteristics of ammonia to nitrogen. Water Research 2006, 40 (7), 1431-1441.

48 (29) Peez, G.; Saiz, J.; Ibanez, R.; Urtiaga, A. M.; Ortiz, I. Assessment of the formation of
inorganic oxidation by-products during the electrocatalytic treatment of ammonium
from landfill leachates. Water Research 2012, 46 (8), 2579-2590.
(30) Li, J.; Blatchley, E. R. Volatile disinfection byproduct formation resulting from
chlorination of organic-nitrogen precursors in swimming pools. Environmental
Science & Technology 2007, 41 (19), 6732-6739.
(31) Judd, S. J.; Bullock, G. The fate of chlorine and organic materials in swimming pools.
Chemosphere 2003, 51 (9), 869-879.
(32) Weaver, W. A.; Li, J.; Wen, Y. L.; Johnston, J.; Blatchley, M. R.; Blatchley, E. R.
Volatile disinfection by-product analysis from chlorinated indoor swimming pools.
Water Research 2009, 43 (13), 3308-3318.
(33) Schmalz, C.; Frimmel, F. H.; Zwiener, C. Trichloramine in swimming pools -
Formation and mass transfer. Water Research 2011, 45 (8), 2681-2690.
(34) Chattaway, F. D. The action of chlorine upon urea whereby a dichloro urea is
produced. Proceedings of the Royal Society of London Series a-Containing Papers of
a Mathematical and Physical Character 1908, 81 (549), 381-388.
(35) Prescott, L. M.; Jones, M. E. Modified methods for determination of carbamyl
aspartate. Analytical Biochemistry 1969, 32 (3), 408-419.
S
Z
S
©
EFFEC
REACTIV
Sections rep
Zhang, Cle
Science and
© 2014 Am
CTS OF AN
VITY IN EL
P
printed with
ment A. C
d Technology
merican Chem
NODIC POT
LECTROCH
POWERED
h permission
Cid, Asghar
y 2014, 48 (
mical Societ
C h a p t
TENTIAL A
HEMICAL
WASTEWA
n from Kan
Aryanfar,
(4), 2377-23
ty
t e r 3
AND CHLO
REACTOR
ATER TRE
ngwoo Cho
and Micha
84.
ORIDE ION
RS DESIGN
EATMENT
o, Yan Qu,
ael R. Hoff
N ON OVER
NED FOR S
Daejung K
fmann Envi
49
RALL
SOLAR-
Kwon, Hao
ironmental

50 ABSTRACT
We have investigated the electrochemical treatment of real domestic wastewater coupled
with the simultaneous production of molecular H2 as a useful byproduct. The electrolysis
cells employ multilayer semiconductor anodes with electroactive bismuth-doped TiO2
functionalities and stainless steel cathodes. DC-powered laboratory-scale electrolysis
experiments were performed under static anodic potentials (+2.2 or +3.0 V NHE) using
domestic wastewater samples, with an added chloride ion in variable concentrations.
Greater than 95% reductions in chemical oxygen demand (COD) and ammonium ion were
achieved within 6 h. In addition, we experimentally determined a decreasing overall
reactivity of reactive chlorine species toward COD with an increasing chloride ion
concentration under chlorine radicals (Cl·, Cl2–·) generation at +3.0 V NHE. The current
efficiency for COD removal was 12%, with the lowest specific energy consumption of 96
kWh kgCOD–1 at the cell voltage near 4 V in 50 mM chloride. The current efficiency and
energy efficiency for the H2 generation were calculated to range from 34 to 84% and 14 to
26%, respectively. The hydrogen comprised 35 to 60% by volume of evolved gases. The
efficacy of our electrolysis cell was further demonstrated by a 20 L prototype reactor totally
powered by a photovoltaic (PV) panel, which was shown to eliminate COD and total
coliform bacteria in less than 4 h of treatment.

51 3.1. INTRODUCTION
Sanitation in developing or emerging countries has been considered woefully inadequate,
as illustrated by the fact that more than 1.8 million children under five years old die from
waterborne diseases every year.1 In developing countries, there is often a deficit of
critical infrastructure, including electricity distribution grids and subsurface sewers that
requires self-standing sanitation facilities for handling human waste. Given these
circumstances, we describe and test a photovoltaic (PV) powered wastewater electrolysis
cell (PWEC), which has been designed to couple the electrochemical treatment of
wastewater with the production of molecular H2 as a potentially useful byproduct.
Application of modified PWEC may eventually lead to improved human sanitation in
peri-urban regions, rural areas, or more remote locations that are currently lacking in
conventional urban infrastructure and proper sanitation facilities.
In wastewater electrolysis cells (WEC), environmental pollutants can be eliminated
either by the direct heterogeneous or indirect homogeneous oxidation pathway.2 Surface-
bound reactive oxygen species (ROS) are intermediates in O2 evolution during water
splitting, which may also result in the direct oxidation of chemical substrates.3 ROS also
reacts with chloride in wastewater to produce reactive chlorine species (RCS) such as
free chlorine (Cl2, HOCl, ClO–) and chlorine radical species (Cl·, Cl2–·).4,5 Organic
substrates can be converted via reactions with RCS to CO2 and an array of lower
molecular weight carboxylic acids.6 At the same time, with sufficient RCS generation,
disinfection of fecal coliform bacteria can be achieved. Inexpensive polycrystalline
photovoltaic (PV) panels can be used to convert incident solar irradiation into a direct

52 current (DC) potential across anode/cathode pairs to produce ROS.7 Water oxidation at
the anode is balanced in part by water/proton reduction at the cathode to produce H2.
Electrochemical systems have often been investigated for treatment of model
organic compounds or industrial wastewater using boron-doped diamond or mixed metal
oxides electrode based on IrO2 and RuO2, mostly focusing only on anodic pollutants
removal in DC-powered reactors.3,4 In line with our previous reports5-8 on the
multifunctional approach of WEC with bismuth-doped TiO2 anodes for wastewater
treatment and molecular H2 production, we first report the efficacy with real domestic
wastewater by benchtop WEC and prototype PWEC experiments. While an existence of
various reactive oxidants has been usually inferred based on the cell voltage,5 this study
employed potentiostatic electrolysis with monitoring of anodic/cathodic potential and
ohmic loss. The experimental approach of this study provides more plausible
explanations for the role of various oxidants in reference to their thermodynamic
potentials.
3.2. EXPERIMENTAL SECTION
3.2.1. Electrode Module. The semiconductor anodes employed in this study were
prepared according to a basic procedure described in our previous reports.6,9 The
procedure includes sequential thermal decomposition of mixed metal oxides including
Ir0.73Ta0.27Ox, Sn0.9Bi0.1Ox, Ti0.96Bi0.04Ox, and Ti0.66Bi0.33Ox on conductive Ti metal plates.
An electron probe microanalysis10 indicates that the outer surface of the synthesized
electrodes is composed mainly of bismuth, titanium, and oxygen (BiOx/TiO2). The
underlying layers involving the oxides of Ir, Ta, and Sn are reported to enhance the

53 stability and conductivity of the electrode.9 The electrode module used for laboratory
experiments consists of the BiOx/TiO2 anode (2.7 cm × 2 cm), stainless steel (SS)
cathode (Hastelloy C-22, 2.7 cm × 2 cm), and Ag/AgCl/Sat. KCl reference electrode
(BaSi Inc., USA). The distance between anode and cathode was 5 mm, while the frit tip
of the reference electrode was located 2 mm apart from the center of the anode.
3.2.2. Characterization of the BiOx/TiO2 Anode. Cyclic voltammetry (CV) profiles
were collected over a range of 0 to 2.0 V NHE by three repetitive scans (5 mV sec–1) in
quiescent 30 mM NaCl solution. In benchtop reactors, the electrode module was installed
in a single compartment cell with working volume of 60 mL. A potentiostat (Bio-Logic,
France) was used for controlling applied anodic potential (Ea) versus reference electrode,
monitoring the response current (I) and the cathodic potential (Ec) versus reference
electrode.
3.2.3. DC Powered Wastewater Electrolysis. Potentiostatic WEC experiments using
domestic wastewater were performed under variable Ea and added electrolyte (NaCl)
concentrations. The applied anodic potentials, Ea, were fixed either at 2.2 or 3.0 V NHE
versus the reference electrode. The ohmic resistance between anode and reference
electrode (R) was measured by current interruption method11 with current bias of 200 mA,
to estimate actual anodic potential (Ea – iR). Residential-strength wastewater samples
were collected from the effluent line of a primary settling tank at the San Jose Creek
Wastewater Treatment Plant (Whittier, CA, USA). The wastewater samples were stored
at 4 ºC, and the supernatant after settling was used. The composition of the intact
wastewater is given in Table 3.1. In rural areas, wastewater salinity and chloride

54
Table 3.1. Composition of residential-strength wastewater used in this study.
Constituent Mean COV (%)
pH 6.6 – 7.3 –
COD (mg L-1) 180 6.02
TN (mM N) 2.594 7.96
NH4+ (mM) 1.910 5.19
NO3– (mM) < 0.01 –
Cl– (mM) 3.880 –
ClO3– (mM) < 0.01 –
Mg2+ (mM) 0.6387 1.96
Ca2+ (mM) 1.287 1.38
COV: Coefficient of Variation.
concentrations are normally higher than in urban areas.12 Therefore, moderate amounts of
NaCl were added with the added chloride concentrations ([Cl–]ext.) ranging from 0 to 50
mM. During the wastewater electrolysis, the wastewater electrolyte was stirred at 600
rpm by a magnetic bar (0.8 cm diameter × 1.8 cm). Over reaction durations of 200 to 230
min, gaseous products were collected in a graduated buret to determine average
volumetric flow rates. The volumetric H2 fraction in the collected gas was determined by
a GC-TCD (Hewlett-Packard, USA), using a 5 V/V% H2 standard gas for calibration.
3.2.4. Prototype PV Powered Wastewater Electrolysis. A 20 L WEC powered by a PV
panel was tested in roof-top experiments in order to assess the feasibility of PV panels as
the sole source of energy for COD elimination and disinfection due to in situ RCS
generation. The PWEC system had an anode/cathode array module consisting of five
doubly coated BiOx/TiO2 anodes and six SS cathodes (40 × 20 cm2 each) with a distance
of separation between each anode and cathode pair of 0.2 cm. A commercially available,

55 low-cost polycrystalline PV panel (Silicon Solar Inc., USA) was employed. More details
are described in the Supporting Information. Twenty liters of wastewater with added
NaCl of 50 mM was mixed with a circulation pump connected to the bottom of the
reactor at the rate of 25 L min–1. The Ea – Ec, and the current were periodically monitored
using multimeters (Fluke, USA).
3.2.5. Analysis. COD and total nitrogen (TN) concentration of samples were measured
based on the absorbance at 420 nm in UV-vis spectrophotometer (Agilent, USA), after
digestion in a low-range dichromate digestion solution (3 – 150 mg L–1, Hach, USA) and
in a low-range TN reagent set (0.5 – 25 mgN L–1, Hach, USA), respectively. Anions (Cl–,
ClO3–, NO3
–,) and cations (NH4+, Ca2+, Mg2+) were simultaneously determined by ion
chromatography (Dionex, USA), using anion-exchange column (Ionpac AS 19) and
cation-exchange column (Ionpac CS 16). The total chlorine (ClDPD) was measured using
DPD (N,N-diethyl-p-phenylenediamine) reagent (Hach, USA) coupled with
quantification via absorbance measurements at 530 nm. A standard wastewater
membrane filtration method was used to count the number of total coliforms and fecal
coliforms during electrolysis (details in the Supporting Information).
3.3. RESULTS AND DISCUSSION
3.3.1. Characteristics of the BiOx/TiO2 Anodes. Figure 3.1 shows CV plots for the
BiOx/TiO2 anode in a 30 mM NaCl electrolyte solution. The onset potential, which
corresponds to 1 A m–2 of current density, initially appeared at near 1.2 V. In comparison
to the reduction potential of O2/H2O couple at pH 7 (Table 3.2), the observed onset
potential estimated oxygen evolution overpotential of 0.38 V. This value is quite
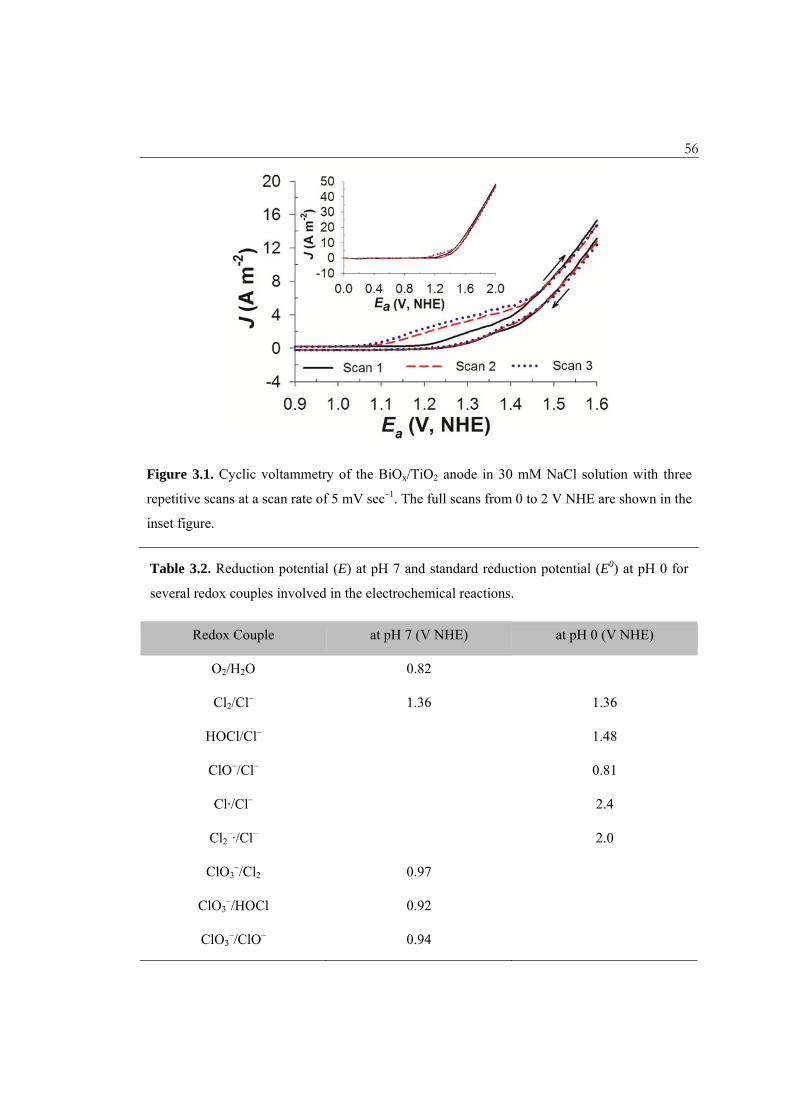
56
Figure 3.1. Cyclic voltammetry of the BiOx/TiO2 anode in 30 mM NaCl solution with three
repetitive scans at a scan rate of 5 mV sec–1. The full scans from 0 to 2 V NHE are shown in the
inset figure.
Table 3.2. Reduction potential (E) at pH 7 and standard reduction potential (E0) at pH 0 for
several redox couples involved in the electrochemical reactions.
Redox Couple at pH 7 (V NHE) at pH 0 (V NHE)
O2/H2O 0.82
Cl2/Cl– 1.36 1.36
HOCl/Cl– 1.48
ClO–/Cl– 0.81
Cl·/Cl– 2.4
Cl2–·/Cl– 2.0
ClO3–/Cl2 0.97
ClO3–/HOCl 0.92
ClO3–/ClO– 0.94

57 comparable to RuO2 and IrO2 based electrodes,13 demonstrating that the BiOx/TiO2
electrode can be regarded as an active electrode for oxygen evolution. The activity may
be attributed to intrinsic oxide vacancies of Bi2O3 in the lattice structure, which can
facilitate the transition of surface-bound hydroxyl radicals to higher oxides.14 Although a
chloride oxidation peak is hidden by the large anodic wave from the oxygen evolution,
chloride oxidation is generally accepted to produce Cl2.15,16 The Cl2 will be in equilibrium
with HOCl and ClO– in bulk aqueous phase depending on the specific pH.17 On the other
hand, the second and third scan showed a significant decrease of the onset potential to
1.05 V, which would result from a formation of chlorate.6 The ClO3– is known to be
produced electrochemically either by oxidation of chloride or free chlorine (HOCl or
ClO–).18,19 The decrease in onset potential in Figure 3.1 suggests that the chlorate is
produced by the oxidation of the RCS20 which requires four electrons for free chlorine
oxidation.
As shown in Table 3.3, the current and ohmic drop between electrodes increases
along with the chloride concentration and applied potential. As a result, actual anodic
potential (Ea – iR) with 50 mM of chloride (H50) was smaller than those with lower
added chloride (H10 and H30), while marginally higher than at lower Ea (L30 and L50).
Another important observation was that a substantial cathodic potential is required to
maintain the Ea; i.e., the Ea – Ec approaches about twice of the Ea. Consequently, the
power consumption grows as the Ea or [Cl–]ext. increases under the potentiostatic
conditions.

58
Table 3.3. The iR-compensated anodic potential (Ea – iR), cell voltage (Ea – Ec), current density
(J), and power consumption (P) on average under variable applied anodic potential (Ea; L: 2.2 V,
H: 3.0 V NHE) and added Cl– concentration ([Cl–]ext.; 0, 10, 30, 50 mM) in electrolysis
experiments using domestic wastewater samples.
ID [Cl–]ext. (mM) Ea (V NHE) Ea – iR (V NHE) Ea – Ec (V) J (A m– 2) P (W)
L30 30 2.2 1.92 (2.8) 4.03 (0.94) 74.2 (19) 0.161 (20)
L50 50 2.2 1.96 (2.0) 3.88 (0.94) 89.4 (17) 0.188 (18)
H0 0 3.0 2.08 (5.8) 6.27 (1.2) 80.9 (13) 0.274 (14)
H10 10 3.0 2.24 (4.9) 5.56 (0.72) 110 (14) 0.367 (15)
H30 30 3.0 2.25 (4.8) 5.88 (0.72) 206 (14) 0.655 (15)
H50 50 3.0 2.00 (4.5) 5.37 (0.17) 296 (9.1) 0.953 (9.2)
Values in parentheses show coefficient of variation (%).
Figure 3.2 illustrates the current density as a function of [Cl–] during the wastewater
electrolysis. At a given Ea and [Cl–]ext, the J was almost proportional to the [Cl–].
Provided that the generation of RCS and oxygen accounts for the anodic electron transfer,
it can be inferred that the rate of RCS generation is first-order in [Cl–], as reported
previously for chlorine generation on RuO2 anodes.15,16 The apparent first-order kinetic
on [Cl–] may also be a consequence of mass transport limitation. In addition, the rate of
oxygen evolution can be also influenced by [Cl–]. A decrease in [Cl–] should result in a
decrease in the electrolyte conductivity and exchange current density for oxygen
evolution.
3.3.2. Impact of Ea and [Cl–]ext. on COD Removal. Figure 3.3 illustrates the effects of
Ea on COD degradation under [Cl–]ext. fixed either at 30 mM or 50 mM. Wastewater

59
Figure 3.2. Evolution of current densities along with variations in Cl– concentration under
variable applied anodic potential (L: 2.2 V, H: 3.0 V NHE) and added Cl– concentration (0, 10,
30, 50 mM) in electrolysis experiments using domestic wastewater samples. The arrow
indicates an arbitrary varying direction as a function of time.
samples often contain refractory organics that are not detected as COD initially. The
recalcitrant substrates are over time transformed by reactions with RCS to yield
intermediate products that are more susceptible to the dichromate digestion, as indicated
by a slight initial increase of COD.21,22 When the COD concentration profiles were fit to
pseudo-first-order kinetics, the rate constant increased with an increase in Ea. These
results are consistent with COD removal in the low Ea that is limited by anodic electron
transfer (heterogeneous RCS generation). Under the electron-transfer-limited regime,
increasing cell voltage or the current density normally enhances the rate of pollutant
degradation, except for those interfacial reactions that are controlled by mass
transport.13,20,22,23

60
Figure 3.3. Time profiles of COD concentration under variable applied anodic potential (L: 2.2
V, H: 3.0 V NHE) and added Cl– concentration (0, 10, 30, 50 mM) in electrolysis experiments
using domestic wastewater samples. Time profile for each condition is regressed with a
pseudo-first-order kinetic equation.

61 The effects of [Cl–]ext. on COD removal at the high Ea (3.0 V NHE) are shown in
Figure 3.3b. In this case, COD removal was not observed without the Cl–, which indicates
that direct oxidation via surface-bound hydroxyl radicals is a minor pathway on the
BiOx/TiO2 electrode, as in the case of the RuOx/TiO2 electrode.23-25 In contrast,
elimination of measurable COD took less than 6 h with [Cl–]ext. exceeding 10 mM. The
pseudo-first-order rate constant for COD removal increased with increasing [Cl–]ext. in the
range of 10 mM to 30 mM, while a decrease in the rate of COD consumption was
observed in the range of [Cl–]ext. from 30 mM to 50 mM, even though there was an
increase in J (Table 3.3). As a consequence, the net current efficiency (CE) for COD
oxidation in H50 was smaller than in H10. This observation is contrary to some reports
that increasing [Cl–] always enhances the rate and CE of COD removal25-27 by increasing
the overall rate of oxidants generation.28 However, other studies report observed
negligible13,24,29 or adverse effects of [Cl–] in the range exceeding 30 mM, which were
ascribed to pH decrease in the vicinity of the anode with increasing current density. The
shift in the local pH may effectively shift the RCS speciation toward gaseous chlorine,17
which results in a net loss of RCS. In this study, however, the bulk pH slightly increased
from circum-neutral to ~9 in maximum along with the electrolysis. Therefore, we argue
that there is a change in the speciation of RCS versus [Cl–]ext. with corresponding shifts in
the relative reactivity toward COD oxidation, which was not explained by the pH effects.
3.3.3. Impact of Cl· and Cl2–· on COD Removal. The effects of [Cl–]ext. were
interpreted using a simple kinetic model applied to the data of experiments H10, H30,
and H50. The CV profiles (Figure 3.1) suggested that the oxidation of Cl– produces RCS
and chlorate in series. The oxidation of Cl– and RCS as well as the homogeneous reaction

62 between the RCS and COD were assumed to be first order in each reactant.19,24,27 The
linear dependence of J on the [Cl–] (Figure 3.2) is consistent with first-order kinetics for
RCS generation as follows:
0][][][][][
321 SSSS RCSkCODRCSkClk
dt
RCSd (3.1)
][][][][
2 CODkCODRCSkdt
CODdCODSS (3.2)
3][
][3
3
ClOSS kRCSkdt
ClOd (3.3)
3
32
ClO
COD
k
kkk (3.4)
where, k1, k2, and k3 are rate constant for heterogeneous Cl– oxidation to RCS,
homogeneous reaction between RCS and COD, and heterogeneous RCS oxidation to
chlorate. In addition, we assume a pseudo-steady-state condition for the rate of RCS
production. The total chlorine concentration was negligible when the COD concentration
was higher than 100 mg L–1 (Figure 3.4a). A linear relationship between [Cl–] and [COD],
indicated by eq 3.1 with quasi-constant [RCS], is supported by Figure 3.4b. Furthermore,
the steady-state assumption for [RCS] is self-consistent with the decrease in [COD]
versus time, which follows apparent pseudo-first-order kinetics (Figure 3.3). Therefore,
the pseudo-first-order rate constant for COD removal (kCOD) and the pseudo-zero-order
rate constant for chlorate production ( 3ClO
k ) can be expressed as the steady-state RCS
concentration ([RCS]SS) multiplied by the reactivity of the RCS toward the COD (k2)

63
Figure 3.4. Evolutions of (a) total chlorine (ClDPD) and (b) Cl– concentration as functions of
variations in COD concentration under variable applied anodic potential (L: 2.2 V, H: 3.0 V
NHE) and added Cl– concentration (10, 30, 50 mM) in electrolysis experiments using domestic
wastewater samples.

64 and heterogeneous rate constant (k3), respectively. It could be argued that the
heterogeneous rate constants, k1 and k3, should vary with the electrolysis time as given by
the Butler-Volmer formulation.11 However, relatively low variations in Ea – iR (Table 3.3)
are consistent with the assumption that k1 and k3 are essentially constant. Our recent
report6 demonstrated that the chloride oxidation kinetics are governed by consistent
parameters regardless of initial chloride concentration during potentiostatic (Ea: 3 V NHE)
electrolyses in NaCl solutions. The heterogeneous reactions on the metal oxide
semiconductors are often controlled by rate constants between surface ROS and
substrates that are independent of anodic potential.2
Figure 3.5 shows [ClO3–] increasing faster after depletion of [COD]. Nevertheless,
the rate of ClO3– formation appeared almost constant when the steady-state assumption
for [RCS] was valid, as shown in Figure 3.5 (inset). From the observed 3ClO
k and kCOD,
the k2 / k3 was calculated to be 1.1 mM–1 for H10, 0.60 mM–1 for H30, and 0.31 mM–1 for
H50. Assuming that the k3 is similar in each case, the reactivity between the RCS and
COD (k2) decreases as the [Cl–]ext. increases. As shown in Table 3.3, the Ea – iR values
for H10 and H30 are sufficient to produce Cl2–·, a stronger oxidant than free chlorine
(Table 3.2). The Ea – iR for H50 is close to the edge of the redox potential required for
radical generation and lower than for H10 and H30 due to a higher solution resistance.
Furthermore, Cl2–· is in equilibrium with Cl·, which has a redox potential higher than Cl2
–
·.5 Thus, under chlorine radicals generation, increasing [Cl–] favors the formation of Cl2–·
to Cl·, resulting in a net lower reactivity in terms of the rate of COD oxidation.

65
Figure 3.5. Time profiles of ClO3– concentration in electrolysis experiments using domestic
wastewater samples under variable applied anodic potential (L: 2.2 V, H: 3.0 V NHE) and
added Cl– concentration (0, 10, 30, 50 mM). For H10, H30, and H50, regression lines for
linearly increasing regions (initial 4 data points) are shown with corresponding zero-order rate
constants.
3.3.4. Nitrogen Species. In the wastewater samples, the sum of [NH4+] and [NO3
–]
constituted more than 95% of [TN]. As shown in Figure 3.6a, [NH4+] decreased to near
zero within 3 h of electrolysis, except in the absence of added Cl– (Figure 3.6a). The
pseudo-first-order rate constants for NH4+ loss were higher than those for COD removal.
A more facile oxidation of NH4+ than for various organic compounds (i.e., COD) has also
been reported for tannery wastewater30 and landfill leachates.28 The reaction rates of RCS
generated at anode surfaces toward NH4+ and COD are often affected by mass transport.31
Results show that NO3– increases with time but not in a normal stoichiometric
relationship (Figure 3.6b). This is due to a substantial fraction of NH4+ that is converted
to N2. The sequential chlorination of NH4+ is known to produce the N2 via breakpoint

66
Figure 3.6. Time profiles of (a) NH4+ and (b) NO3
– concentration under variable applied
anodic potential (L: 2.2 V, H: 3.0 V NHE) and added Cl– concentration (0, 10, 30, 50 mM) in
electrolysis experiments using domestic wastewater samples.

67 chlorination.17,28,32 For landfill leachates,33 N2 formation rate exceeded that of NO3
–,
especially as current densities or [Cl–] increased.
3.3.5. CE and Energy Consumption for Anodic Reactions. The efficiency of
electrochemical reactions is often expressed in terms of current efficiency, CE.3,4 Figure
3.7 shows the general CE (eq 3.5) for the anodic reactions in the various wastewater
electrolyses.
Current Efficiency (CE) for Anodic Reaction i (%) 100
0
0
t
tiii
Idt
VCCFn (3.5)
Figure 3.7. General current efficiencies for anodic reactions including COD oxidation
( ), formation of N2 ( ), NO3– ( ), ClO3
– ( ), and free chlorine ( )
under variable applied anodic potential (L: 2.2 V, H: 3.0 V NHE) and added Cl–
concentration (10, 30, 50 mM) in electrolysis experiments using domestic wastewater
samples. Estimates are based on the time when COD decreases to below 30 mg L–1.

68 where, Ci
0 and Cit are the concentration of species i (M) at the electrolysis time of zero
and t (s), V is the volume of the electrolyte (0.06 L), I is the current (A), F is Faraday
constant (96485.3 C mol–1), and ni is the number of electrons required to oxidize one
mole of species i; 4 for oxidation of COD expressed in molO2 L–1, 3 for NH4
+ to N2, 8 for
NH4+ to NO3
–, 6 for Cl– to ClO3–, and 2 for Cl– to Cl2. The estimates shown in Figure 3.7
are based on the time when COD first declined to below 30 mg L–1, a typical criteria for
water reuse.34
The CE for COD oxidation has been known to decrease with the electrolysis time in
case of direct oxidation limited by diffusion to the anode surface29 or galvanostatic
electrolysis due to a decrease in substrate concentration.24 In our case, the differential
concentrations of COD, NH4+, NO3
–, and ClO3– are correlated with the specific passed
charge (coulomb per unit volume); i.e., consistent CE’s with the electrolysis time. The
decrease of the COD removal rate along with the [COD] was compensated by the
decrease in J, which was proportional to [Cl–]. The linear relation between the [COD] and
[Cl–] also contributes to the apparent self-consistent current efficiencies.
At lower anodic potentials (L30 and L50), in which the heterogeneous RCS
generation is limiting, the increase in [Cl–]ext. significantly enhanced the CE. In contrast,
at higher potentials, where homogeneous reactions between RCS and COD become
important, the CE for COD removal was the highest in the wastewater sample H30.
Oxidation of NH4+ to NO3
– and N2 were minor fractions (~ 10%) of the anodic charge
transfer due to the small initial [NH4+]. The CE’s for the observed residual chlorine were
similar to those for ClO3– production and COD loss. The sum of the RCS mediated

69 reactions was below 40%. The loss in CE’s can be attributed to O2 evolution and RCS
reduction at the cathode.
Table 3.4 summarizes the times required to reduce COD to be below 30 mg L–1
(tCOD30), as well as [COD], [NO3–], [ClO3
–], [ClDPD], and corresponding specific energy
consumption (SEC) for COD removal at tCOD30. The SEC was calculated as follows:
Specific Energy Consumption (kWh kgCOD–1) 1000)][]([
)(0
0
VCODCOD
dtIEEt
t
Ca (3.6)
where, Ea – Ec and I are cell voltage (V) and current (A), [COD]0 and [COD]t are COD
concentration (mg L–1) at the electrolysis time of zero and t (h), and V is electrolyte
volume (0.06 L). For galvanostatic electrolyses, an increasing [Cl–] decreases the SEC by
decreasing the cell voltage.13,25,27 Under potentiostatic conditions, however, the SEC
Table 3.4. Sampling time when COD below 30 mg L–1 was observed (tCOD30), concentration of
COD, NO3–, ClO3
– and total chlorine at tCOD30, and specific energy consumption (SEC) for unit
COD removal at tCOD30 under variable applied anodic potential (L: 2.2 V, H: 3.0 V NHE) and
added Cl– concentration (10, 30, 50 mM) in electrolysis experiments using domestic
wastewater samples.
ID L30 L50 H10 H30 H50
tCOD30 (min) > 360 240 360 120 180
[ COD ] (mg L-1) 93 13 11 19 28
[ NO3– ] (mM) 0.16 0.22 0.20 0.18 0.38
[ ClO3– ] (mM) 1.0 3.1 1.9 3.4 7.1
[ ClDPD ] (mM) 2.8 9.1 3.7 8.8 14.5
SEC (kWh kgCOD-1) 232 96 209 176 320

70 value has been reported to increase with [Cl–] or conductivity via an increase in J.26
Under both electrolytic conditions, increasing the cell voltage or current density for a
given electrolyte composition normally increases the SEC.22 In this regard, H30 gave the
best space-time yield and SEC for COD removal at the high Ea. However, an increase in
cell voltage and J at Ea of 3.0 V NHE requires larger energy consumption compared to Ea
of 2.2 V NHE. Thus, the minimal energy usage was obtained with [Cl–]ext. of 50 mM at
Ea of 2.2 V NHE, which corresponds to a cell voltage of about 4 V.
3.3.6. Hydrogen Production. The generation rate of total gaseous products, the H2
volumetric fraction, and the H2 molar flow rate increased with increasing current density
(Table 3.5). The fraction of H2 was ~ 40% in L30 and L50, and ~ 60% in higher Ea. Other
gaseous products would include O2, H2O, N2, and CO2.7 The CE and energy efficiency of
H2 generation were calculated as follows.
Table 3.5. Hydrogen evolution for a given duration (200 – 230 min) under variable applied
anodic potential (L: 2.2 V, H: 3.0 V NHE) and added Cl– concentration (10, 30, 50 mM) in
electrolysis experiments using domestic wastewater samples; current density, flow rate of total
gas products, volumetric fraction of hydrogen, molar flow rate of hydrogen, current efficiency,
and energy efficiency for hydrogen generation.
ID L30 L50 H10 H30 H50
Current Density (A m–2) 66.7 82.6 103 179 289
Total Gas Flow (mL min–1) 0.320 0.253 0.453 0.907 1.720
H2 Fraction (%) 35.1 41.1 52.6 54.3 59.2
H2 Generation Rate (μmol min–1) 5.02 4.64 10.7 22.0 45.4
Current Efficiency (%) 44.8 33.5 55.4 73.2 84.1
Energy Efficiency (%) 18.0 14.0 16.9 18.5 26.0

71
Current Efficiency for H2 production (%) 1002
2
dtI
tQF H (3.7)
Energy Efficiency for H2 production (%) 100)(
)78(36002
1
dtIEE
tQmolWh
ca
H (3.8)
where, Ea – Ec and I are cell voltage (V) and current (A), is H2 molar production rate
(mol sec–1), t is time for gas collection (sec), and F is Faraday constant (96485.3 C mol–1).
The CE for H2 generation was below 50% at low Ea and then increased with increasing J
up to 84% at higher Ea. The remaining fraction of electron transfer at the cathode can be
attributed to the combined reduction of RCS and O2.5,8,35 In particular, a reduction of the
RCS would reduce the current efficiency both for desired anodic and cathodic reactions.
We previously estimated7,8,21 the CE for hydrogen generation to be from 50% to 90%
depending on cell voltage and, more importantly, the relative concentration of organic
electron doners to chloride. An augmented presence of electron donors significantly
increases the CE for H2 generation via quenching the RCS. The energy efficiency for H2
production was estimated to be from 14% to 26%. Higher energy efficiencies up to 46%
have been reported under lower cell voltages (~ 3 V)7 or under a photoelectrocatalytic
operation of the BiOx/TiO2 anode.10 H2 generated as a primary by-product in WEC or
PWEC can be used in either a proton exchange membrane (PEM) or solid-state fuel cell.
Therefore, a moderate reduction in the SEC is expected when utilizing the produced H2
as a back-up energy source for the PWEC.
3.3.7. Prototype (20 L) PV Powered Wastewater Electrolysis. If a PV panel DC output
is connected directly to an electrolysis reactor, then the cell voltage and current will be

72 affected by the electrolyte conductivity, temperature, and solar intensity. The Ea – Ec and
J values are determined by the characteristic I–V curve of a PV panel at a given incident
solar radiation, the panel temperature, and the resistance of the electrolysis cell.36 We had
previously reported8 a solar energy conversion efficiency below 2% when using a PV
panel that was directly connected to an electrolysis cell containing industrial wastewater.
In order to increase the solar energy conversion efficiency, we employed a rechargeable
lead acid battery regulated by a charge controller to generate an electrical energy output
of ~ 84 W (12 V × 7 A), while maintaining a constant cell voltage.
For the solar roof-top experiment, 50 mM of NaCl was added to a domestic
wastewater sample to maintain a cell voltage of 3.9 V on average, which was close to the
operating condition of the least energy consumption in the benchtop experiments (L50).
The current was 16.7 A, corresponding to a current density of 20.9 A m–2. The larger-
scale prototype reactor, with the PV panel as a power source, had a similar rate of COD
removal with L50; for the initial [COD] of 180 mg L–1 was reduced to 21 mg L–1 after 4 h
of reaction. We also confirmed that in-situ generation of free chlorine18,37 leads to the
disinfection of the total coliform and fecal coliform bacterial load (Figure 3.8). The initial
bacterial concentration was 7.8 × 10⁵ CFU 100 mL–1 for total coliforms and 8.0 × 10⁴
CFU 100 mL–1 for fecal coliforms. A majority of the coliforms (50 – 80 %) were
eliminated within 30 min. Complete disinfection was observed after 3 h of electrolysis
along with a significant decrease in [COD].
The effluents from the scaled-up PWEC would be of sufficient water quality to be
reclaimed for nonpotable purposes.34 On the other hand, further anodic oxidation of the

73
Figure 3.8. Time profiles for normalized concentration of total and fecal coliform during
photovoltaic-powered wastewater electrolysis cell (PWEC, 20 L) experiment using domestic
wastewater (cell voltage: 4.9 V, added Cl– concentration: 50 mM).
RCS leads to the production of ClO3–, which has potential environmental health risks.19
In the benchtop WEC (L50), the [ClO3–] after 4 h of electrolysis was 3.0 mM. At this
concentration, the reuse of the treated water would be restricted to a closed-loop recycled
water system to be used for toilet flushing and for wash water. A mass balance analysis
for chlorine species indicates that the sum of Cl–, ClDPD, and ClO3– concentration deviate
the initial chloride concentration by no more than 0.1 mM. Therefore, chlorinated
byproducts other than ClO3– would be in a trace-level concentration.
Well-designed PWEC could be utilized within self-contained toilet facilities to
provide suitable decentralized wastewater treatment systems. The energy consumption
per unit volume of wastewater was estimated to be 13 Wh L–1 for the 20 L PWEC with a
retention time of 4 h. We estimate that, for a community toilet with 30 users in a remote

74 rural area, the wastewater flow rate would be approximated at 120 L day–1, assuming a
low water usage (1.0 L d–1 capita–1 for urine with 3.0 L d–1 capita–1 for flushing).12,38
With an average energy output from solar irradiation of 56 W m–2 over 8 h per day, the
daily available solar energy is calculated to be 448 Wh day–1 m–2. At this energy level,
the total exposed surface area of polycrystalline PV panels that would be required for
continuous operation of the PWEC would be virtually 3.5 m2.
3.4. SUPPORTING INFORMATION
3.4.1. Electrochemical Methods. Before all electrochemical experiments, the electrodes
were rinsed with acetone and a large amount of Milli-Q water. The electrode module was
allowed to equilibrate with the electrolyte solution in an open circuit for 30 min while
monitoring the open circuit potential of anode and cathode. As a routine procedure, the
pH, conductivity and the ohmic resistance between anode and reference electrode (R)
were measured before and after the electrochemical experiments. The pH and
conductivity of the samples were monitored using a pH meter (Mettler Toledo, USA) and
a portable conductivity meter (VWR International, USA). As shown in Figure 3.9, the
conductivity increased while R decreased monotonically as the added chloride
concentration increased. The anodic potentials were converted into NHE scale using Ea
(NHE) = Ea (Ag/AgCl) + 0.197 V.
3.4.2. Prototype PV-powered Wastewater Electrolysis. The solar panel had a peak
power output of 180 W with an open circuit voltage of 25.9 V, a short circuit current of
6.95 A, and an active surface area of 1.50 m2 (0.95 m × 1.57 m), respectively. Incident
solar irradiation was measured using a pyranometer (Apogee, USA) which ranged from

75
Figure 3.9. Ohmic resistance between anode and reference electrode (R) and electric
conductivity of bulk electrolyte as functions of added Cl– concentration ([Cl–]ext.) in bench-top
electrolysis experiments using domestic wastewater samples.
1,000 W m–2 (noontime) to 600 W m–2 depending on the solar zenith angle. A 12 V
rechargeable battery that was regulated using a charge controller was used to store excess
solar energy. The voltage of the battery was controlled in order to adjust the cell voltage
to be 3.9 V. The main oxidants at this cell voltage should be free chlorine species (HOCl
considering the bulk pH ~ 6) since the actual anodic potential was not high enough to
generate chlorine radicals. In scaling-up the WEC, an inevitable increase of ohmic
voltage loss caused a reduction in current density when compared to the bench-top
experiment. In these circumstances, an adjustment of electrode configuration was
required to keep the free chlorine generation rate. In particular, the electrolyte volume-to-
electrode surface area ratio was adjusted to 2.5 cm (20,000 cm3 / 8,000 cm2) while the

76 distance among electrodes was reduced to 2 mm, to achieve a current per unit electrolyte
volume comparable with laboratory WEC (L50).
3.4.3. Analysis of Total and Fecal Coliform Concentration. In our sampling procedure,
a 0.45 μm membrane filter was used to collect a microbial sample. The filter membrane is
then placed on an ‘mEndo’ agar LES media for total coliform and an ‘mFC’ agar for
fecal coliform for selective growth. The media plates were incubated at 35 °C for total
coliform and 44.5 °C for fecal coliform for 24 h in order to promote discrete colonies.
The concentration of total and fecal coliform bacteria in the wastewater was estimated in
terms of CFU 100 mL–1 (Colony Forming Units per 100 mL).
3.5. REFERENCES
(1) Sick Water? The central role of wastewater management in sustainable development.
A rapid response assessment; United Nations Environment Programme, UN-
HABITAT, GRID-Arendal: Birkeland, 2010.; www.grida.no/publications/rr/
sickwater/.
(2) Comninellis, C. Electrocatalysis in the electrochemical conversion/combustion of
organic pollutants for waste-water treatment. Electrochimica Acta 1994, 39 (11-12),
1857-1862.
(3) Martinez-Huitle, C. A.; Ferro, S. Electrochemical oxidation of organic pollutants for
the wastewater treatment: direct and indirect processes. Chemical Society Reviews
2006, 35 (12), 1324-1340.
(4) Panizza, M.; Cerisola, G. Direct And mediated anodic oxidation of organic pollutants.
Chemical Reviews 2009, 109 (12), 6541-6569.
(5) Park, H.; Vecitis, C. D.; Hoffmann, M. R. Electrochemical water splitting coupled
with organic compound oxidation: The role of active chlorine species. Journal of
Physical Chemistry C 2009, 113 (18), 7935-7945.

77 (6) Cho, K.; Kwon, D.; Hoffmann, M. R. Electrochemical treatment of human waste
coupled with molecular hydrogen production. RSC Advances 2014, 4, 4596-4608.
(7) Park, H.; Vecitis, C. D.; Hoffmann, M. R. Solar-powered electrochemical oxidation of
organic compounds coupled with the cathodic production of molecular hydrogen.
Journal of Physical Chemistry A 2008, 112 (33), 7616-7626.
(8) Choi, J.; Qu, Y.; Hoffmann, M. R. SnO2, IrO2, Ta2O5, Bi2O3, and TiO2 nanoparticle
anodes: Electrochemical oxidation coupled with the cathodic reduction of water to
yield molecular H2. Journal of Nanoparticle Research 2012, 14 (8).
(9) Weres, O. Electrode with surface comprising oxides of titanium and bismuth and
water purification process using this electrode. U.S. Patent 7,494,583 B2, Feb. 24,
2009.
(10) Park, H.; Bak, A.; Ahn, Y. Y.; Choi, J.; Hoffmannn, M. R. Photoelectrochemical
performance of multi-layered BiOx-TiO2/Ti electrodes for degradation of phenol and
production of molecular hydrogen in water. Journal of Hazardous Materials 2012,
211, 47-54.
(11) Bard, A. J.; Faulkner, L. R., Electrochemical methods : fundamentals and
applications. 2nd ed.; Wiley: New York, 2001.
(12) Siegrist, R.; Witt, M.; Boyle, W. C. Characteristics of rural household wastewater.
Journal of the Environmental Engineering Division-Asce 1976, 102 (3), 533-548.
(13) Malpass, G. R. P.; Miwa, D. W.; Mortari, D. A.; Machado, S. A. S.; Motheo, A. J.
Decolorisation of real textile waste using electrochemical techniques: Effect of the
chloride concentration. Water Research 2007, 41 (13), 2969-2977.
(14) Shuk, P.; Wiemhofer, H. D.; Guth, U.; Gopel, W.; Greenblatt, M. Oxide ion
conducting solid electrolytes based on Bi2O3. Solid State Ionics 1996, 89 (3-4), 179-
196.
(15) Trasatti, S. Progress in the understanding of the mechanism of chlorine evolution at
oxide electrodes. Electrochimica Acta 1987, 32 (3), 369-382.
(16) Santana, M. H. P.; De Faria, L. A. Oxygen and chlorine evolution on
RuO2+TiO2+CeO2+Nb2O5 mixed oxide electrodes. Electrochimica Acta 2006, 51
(17), 3578-3585.

78 (17) Deborde, M.; von Gunten, U. Reactions of chlorine with inorganic and organic
compounds during water treatment - Kinetics and mechanisms: A critical review.
Water Research 2008, 42 (1-2), 13-51.
(18) Czarnetzki, L. R.; Janssen, L. J. J. Formation of hypochlorite, chlorate and oxygen
during NaCl electrolysis from alkaline-solutions at an RuO2/TiO2 anode. Journal of
Applied Electrochemistry 1992, 22 (4), 315-324.
(19) Jung, Y. J.; Baek, K. W.; Oh, B. S.; Kang, J. W. An investigation of the formation of
chlorate and perchlorate during electrolysis using Pt/Ti electrodes: The effects of pH
and reactive oxygen species and the results of kinetic studies. Water Research 2010,
44 (18), 5345-5355.
(20) Scialdone, O.; Randazzo, S.; Galia, A.; Silvestri, G. Electrochemical oxidation of
organics in water: Role of operative parameters in the absence and in the presence of
NaCl. Water Research 2009, 43 (8), 2260-2272.
(21) Park, H.; Choo, K.; Park, H.; Choi, J.; Hoffmann, M. R. Electrochemical oxidation
and microfiltration of municipal wastewater with simultaneous hydrogen production:
Influence of organic and particulate matter. Chemical Engineering Journal 2013,
215-216 (15), 802-810.
(22) Fernandes, A.; Pacheco, M. J.; Ciriaco, L.; Lopes, A. Anodic oxidation of a
biologically treated leachate on a boron-doped diamond anode. Journal of
Hazardous Materials 2012, 199, 82-87.
(23) Miwa, D. W.; Malpass, G. R. P.; Machado, S. A. S.; Motheo, A. J. Electrochemical
degradation of carbaryl on oxide electrodes. Water Research 2006, 40 (17), 3281-
3289.
(24) Panizza, M.; Cerisola, G. Olive mill wastewater treatment by anodic oxidation with
parallel plate electrodes. Water Research 2006, 40 (6), 1179-1184.
(25) Malpass, G. R. P.; Miwa, D. W.; Machado, S. A. S.; Olivi, P.; Motheo, A. J.
Oxidation of the pesticide atrazine at DSA (R) electrodes. Journal of Hazardous
Materials 2006, 137 (1), 565-572.

79 (26) Gotsi, M.; Kalogerakis, N.; Psillakis, E.; Samaras, P.; Mantzavinos, D.
Electrochemical oxidation of olive oil mill wastewaters. Water Research 2005, 39
(17), 4177-4187.
(27) Costa, C. R.; Olivi, P. Effect of chloride concentration on the electrochemical
treatment of a synthetic tannery wastewater. Electrochimica Acta 2009, 54 (7),
2046-2052.
(28) Chiang, L. C.; Chang, J. E.; Wen, T. C. Indirect oxidation effect in electrochemical
oxidation treatment of landfill leachate. Water Research 1995, 29 (2), 671-678.
(29) Panizza, M.; Delucchi, M.; Cerisola, G. Electrochemical degradation of anionic
surfactants. Journal of Applied Electrochemistry 2005, 35 (4), 357-361.
(30) Szpyrkowicz, L.; Kaul, S. N.; Neti, R. N.; Satyanarayan, S. Influence of anode
material on electrochemical oxidation for the treatment of tannery wastewater.
Water Research 2005, 39 (8), 1601-1613.
(31) Szpyrkowicz, L.; Kelsall, G. H.; Kaul, S. N.; De Favei, M. Performance of
electrochemical reactor for treatment of tannery wastewaters. Chemical Engineering
Science 2001, 56 (4), 1579-1586.
(32) Kapalka, A.; Katsaounis, A.; Michels, N. L.; Leonidova, A.; Souentie, S.;
Comninellis, C.; Udert, K. M. Ammonia oxidation to nitrogen mediated by
electrogenerated active chlorine on Ti/PtOx-IrO2. Electrochemistry Communications
2010, 12 (9), 1203-1205.
(33) Peez, G.; Saiz, J.; Ibanez, R.; Urtiaga, A. M.; Ortiz, I. Assessment of the formation
of inorganic oxidation by-products during the electrocatalytic treatment of
ammonium from landfill leachates. Water Research 2012, 46 (8), 2579-2590.
(34) Guidelines for water reuse; EPA/600/R-12/618; United States Environmental
Protection Agency: Washington, D.C., 2012.; nepis.epa.gov/Adobe/PDF/P100FS7K.
pdf.
(35) Kim, J.; Choi, W. J. K.; Choi, J.; Hoffmann, M. R.; Park, H. Electrolysis of urea and
urine for solar hydrogen. Catalysis Today 2013, 199, 2-7.
(36) Valero, D.; Ortiz, J. M.; Exposito, E.; Montiel, V.; Aldaz, A. Electrochemical
wastewater treatment directly powered by photovoltaic panels: Electrooxidation of a

80 dye-containing wastewater. Environmental Science & Technology 2010, 44 (13),
5182-5187.
(37) Bergmann, M. E. H.; Rollin, J.; Iourtchouk, T. The occurrence of perchlorate during
drinking water electrolysis using BDD anodes. Electrochim. Acta 2009, 54 (7),
2102-2107.
(38) Onsite wastewater treatment systems manual; EPA/625/R-00/008; United States
Environmental Protection Agency: Washington, D.C., 2002.; nepis.epa.gov/Adobe/
PDF/P100FS7K.pdf .

81 C h a p t e r 4
ELECTROCHEMICAL TREATMENT OF HUMAN WASTE COUPLED WITH
MOLECULAR HYDROGEN PRODUCTION
Sections reprinted with permission from Kangwoo Cho, Daejung Kwon, and Michael R.
Hoffmann RSC Advances 2014, 4, 4596-4608.
© The Royal Society of Chemistry 2014

82 ABSTRACT
We have developed a wastewater treatment system that incorporates an electrolysis cell for
on-site wastewater treatment coupled with molecular hydrogen production for use in a
hydrogen fuel cell. Herein, we report on the efficacy of a laboratory-scale wastewater
electrolysis cell (WEC) using real human waste for the first time with a semiconductor
electrode utilizing a mixed particle coating of bismuth oxide doped titanium dioxide
(BiOx/TiO2). A comprehensive environmental analysis has been coupled together with a
robust kinetic model under the chemical reaction limited regime to investigate the role of
various redox reactions mediated by chloride present in human waste. The oxidative
elimination of the chemical oxygen demand (COD) and ammonium ion can be modelled
using empirical, pseudo-first-order rate constants and current efficiencies (CE). In
combination with an anaerobic pre-treatment step, human waste containing high-levels of
COD, protein, and color are eliminated within 6 h of batch treatment in the WEC. The
reactor effluent has residual inorganic total nitrogen (TN) concentration of ~ 40 mM. The
CE and specific energy consumption were 8.5% and 200 kWh kgCOD–1 for the COD
removal, 11% and 260 for kWh kgTN–1 for the TN conversion. The CE and energy
efficiencies (EE) for hydrogen production were calculated to be 90% and 25%, respectively.

83 4.1. INTRODUCTION
There has been an increasing awareness of an emerging crisis with respect to water
resources due to global population growth and climate change. Close to 80% of the
world's population is threatened by water scarcity, due primarily to a deficit of safe
drinking water and water for personal sanitation.1 It is estimated that 2.7 billion people
lack access to sufficient water for human sanitation (i.e., for personal hygiene) and proper
waste disposal.2 The direct discharge of untreated human waste and open defecation are
major sources of waterborne diseases. Furthermore, the biochemical oxygen demand
(BOD) generated by the discharge of human waste into receiving waters is becoming a
threat to biodiversity. As a consequence, research has been focused on approaches to
enhance the water safety and productivity for non-consumptive uses by technological
improvement in wastewater treatment and reuse practices.2,3 However, a lack of
infrastructures in the developing world and highly interrelated water-energy nexus3
require the water treatment and reuse practices to be on-site, energy sustainable, and
economical with a minimal use of hydraulic retention time (HRT) and material costs.
In order to address some of these problems, we are exploring the use of
electrochemical reactors or wastewater electrolysis cells (WEC) that have been designed
to provide on-site wastewater treatment for water recycling and reuse coupled with
energy storage. Electrochemical water oxidation to oxygen on metal oxides anodes is
known to initiate by formation of surficial hydroxyl radicals and/or by direct electron
transfer to surface-bound holes,4-6 which can be used for the ‘direct’ oxidation of
environmental contaminants. Wastewater with a sufficient level of electrical conductivity

84 (σ), such as dye wastewater and landfill leachate, has been investigated extensively for
the electrochemical removal of pollutants.4,6 The near ubiquitous presence of chloride
(Cl–) in the high-salinity wastewater often leads to the homogeneous ‘indirect’ oxidation
via production of reactive chlorine species (RCS) including free chlorine (Cl2, HOCl,
ClO–)4,6 and chlorine radicals (Cl·, Cl2–·).7 The existence of chloride has been frequently
reported to reduce specific energy consumption (SEC) for electrochemical oxidation of
chemical pollutants by increasing σ and substrate degradation rates at a given current (or
potential).8-14
Energy conversion and storage are possible due to electron transfer to water or
proton to produce hydrogen at the cathodes. This can lead to a much lower carbon
footprint when compared to the steam reformation of methane to produce hydrogen.7,15,16
Under a sufficient solar irradiation, the WEC can be powered by an appropriate size of
photovoltaic (PV) panels,7,15,17-19 to allow for a sustainable and traditional-infrastructure-
free approach to human waste treatment coupled with the generation of an energy-rich
by-product (e.g., H2). Therefore, a PV-powered WEC (PWEC) has the potential to
address the global needs for energy, water, and human health by using green chemistry
without additional chemical reagents (e.g., O3, H2O2, S2O82–, etc.) to achieve a high-
degree of BOD reduction.
It is possible to achieve energy efficient hydrogen production20 coupled with
chemical contaminant oxidation21,22 when utilizing electrochemically active anodes with
high oxygen evolution reaction (OER) rates. Intrinsic cost-effectiveness and
mechanical/chemical inertness are also important considerations for the proper design of

85 electrodes.5,20 Electrodes with high OER overpotentials (η), based on SnO2, PbO2, and
BDD (Boron Doped Diamond), have been used exclusively for the direct electrochemical
oxidation.4,6,23 In spite of superior current efficiencies for organic compound oxidation,
these electrodes would not be suitable for energy conversion due to the lack of
electrocatalytic activity and large energy losses.21,22 Facile O2/Cl2 evolution at active
novel Pt group metal oxides (RuO2 and IrO2) and combined usage with inert metal oxides
(TiO2, Ta2O5, and SnO2) to increase corrosion resistance allowed their applications for
water splitting, chlor-alkali production, and wastewater electrooxidation.5,20,24,25 However,
the high material cost of low-abundance metals (i.e., Ru and Ir) is a major limitation for
their commercial application.20 The electrocatalytic OER activity has long been ascribed
to a reversible redox transition within the potential energy window of water splitting.5,20
In this regard, the pseudo-capacitance and dielectric permittivity of Bi2O3 provide a less
costly approach for OER systems and for use in Faradaic supercapacitors.26 Accelerated
ion conductivity due to the intrinsic (disordered) oxygen vacancies and high
polarizability due to the presence of 6s2 lone pair in Bi enables Bi2O3 to be applied as a
solid oxide fuel cell electrolyte.27 Based on the promising characteristics of this earth
abundant metal oxide, our previous reports7,15,16,18,19 have demonstrated the feasibility of
Bi-doped TiO2 (BiOx/TiO2) electrodes for use in the WEC.
Herein, we report on the efficacy of the WEC equipped with the BiOx/TiO2 anode as
a novel, dual-functioning approach for treatment and/or reuse of liquid human waste
coupled with the simultaneous production of molecular hydrogen. Human urine is often a
source of chloride present in domestic wastewater, which in turn can be oxidized to RCS,
resulting in further organic compound oxidation and disinfection. The complex reaction

86 network involved in chloride mediated indirect oxidation4,6 and the large number of
operational variables that include current, applied cell voltage, pre-treatment, influent
dilution, fluid-flow, and mixing28 require reliable kinetic models in order to explore the
role of each operational parameter. Consistent with the electrocatalytic behavior of our
BiOx/TiO2 composite electrodes, a simple kinetic model is derived based on the measured
rate constants for pollutant degradation, current efficiency, and specific energy
consumption.
4. 2. EXPERMIENTAL SECTION
4.2.1. BiOx/TiO2 Electrode Preparation. The multi-layered semiconductor electrodes
were prepared by sequential deposition of mixed metal oxides29 as follows: (i) an anti-
passivation layer of IrO2/Ta2O5 with a molar ratio of 73:27 (Ir:Ta), (ii) a sealing coat of
SnO2/Bi2O3 at Sn:Bi of 9:1, (iii) a slurry deposition of bismuth oxide doped TiO2
(BiOx/TiO2) nanoparticles with Bi:Ti of 1:24, and (iv) BiOx/TiO2 thin film (over-coat)
deposition at a molar ratio of 1:2 (Bi:Ti). Each thermal decomposition procedure requires
a specific precursor composition, heat treatment, and repetition as described in the
Supporting Information. In a recent report, we showed that the electrodes as prepared are
dominated by the elemental composition of Ti, Bi, and O in electrochemically active
outermost surface;18 thus we will refer to our composite anodes as BiOx/TiO2 electrode.
The anti-passivation layer together with the sealing coat is known to enhance the
robustness and electric conductivity.29
4.2.2. Electrochemical Setup. The electrode modules used in this study consisted of a
BiOx/TiO2 anode, a stainless steel (SS, Hastelloy C-22) cathode, and an

87 Ag/AgCl/Saturated KCl reference electrode (BaSi Inc., USA). The effective area of the
anode and cathode was 5.4 cm2 (2.7 cm × 2 cm). The distance between anode and
cathode was 5 mm, while the reference electrode was located as close as possible to the
anode. Hereafter, the electrochemical potentials are always expressed in terms of the
normal hydrogen electrode (NHE). The electrochemical cells were powered by a
potentiostat (SP-50, Bio-Logic, France) in which the applied anodic potential (Ea) was
adjusted with continuous monitoring of the response current (i) and cathodic potential
(Ec).
4.2.3. Electrode Characterization. The cyclic voltammetry (CV) data were collected
using either a 50 mM NaCl or a 50 mM NaClO4 electrolyte solution under quiescent
conditions for three cycles consecutively without open-circuit resting. The scan rate and
scan range were fixed at 5 mV sec–1 and 0 – 3 V, respectively. The chrono-amperometric
data were collected in stirred solutions with 10, 30, and 50 mM NaCl, where the Ea was
varied from 1.5 to 3.5 V in 0.5 V increments. The resulting data were stored for 10 min at
each Ea while resting the system in an open circuit for 5 min before adjustment of each
potential increment. The CV and chrono-amperometric experiments were performed in a
single compartment cell with working volume of 275 mL. In order to assess the direct
oxidation efficacy of the BiOx/TiO2 electrode, a bulk potentiostatic electrolysis (Ea: 3 V)
was performed in 47.5 mL KH2PO4 solution (5.3 mM), whose small fraction (2 mL) was
sequentially replaced with 10 mM NaCOOH solution in 10 min intervals without a
change in σ. The variations in I and [HCO2–] were monitored as functions of electrolysis
time.

88 4.2.4. Wastewater Sample Preparation. Table 4.1 shows the average composition of
urine collected from an Asian male (Age: 30) and domestic wastewater (DWW). The
DWW was obtained at San Jose Creek Wastewater Treatment facility (tertiary treatment)
operated by the Sanitation Districts of Los Angeles County (USA). Samples were
collected after a primary settling tank and stored in 4 ºC before usage.
To simulate septic tank effluents (STEs), the urine was mixed with the DWW with a
volumetric ratio of 1:3 and anaerobically incubated at 35 °C for 2 days (conventional
HRT in septic tanks30). Under these conditions, the high-molecular-weight organic
compounds in urine can be biodegraded into lower molecular weight fragments by the
microorganisms present in wastewater. Pre-treated urine was further diluted with the
DWW with the mixing ratio of 1:9 (STE1), 1:4 (STE2), and 1:1 (STE3), which produced
Table 4.1. Composition of the as-received domestic wastewater (DWW), urine, and model septic
tank effluent (STE 1-4, see Supporting Information for details).
Constituent DWW Urine STE1 STE2 STE3 STE4
pH 7.1 6.6 8.9 9.0 9.1 9.0
Conductivity (mS cm–1) 1.1 24 2.3 3.5 7.0 8.8
COD (mg L–1) 180 5300 310 480 900 460
TN (mM N) 2.6 410 13 25 61 66
Urea (mM) < 0.01 159 2.4 1.1 5.8 7.4
NH4+ (mM) 1.9 21 12 24 38 44
NO3– (mM) < 0.01 1.1 0.01 0.10 0.01 0.10
Cl– (mM) 3.9 180 6.7 10 21 33
Protein (mg BSA L–1) 75 2300 160 250 520 280
Carbohydrate
(mg glucose L–1) 35 530 16 39 63 23
Organic Acids (mM) < 0.01 6.9 0.02 1.6 3.1 0.09

89 variable concentrations of mixed organic waste and chloride, as shown in Table 4.1.
Since the microbial concentration in DWW should be much smaller than in a septic tank,
digested urine after 7 days of incubation was also tested without further dilution (STE4).
4.2.5. WEC Experiments. The WEC setup consists of the electrode module in a single
compartment electrolysis cell equipped with a side-branch sampling port and a gas outlet
port on top. Initial working electrolyte and corresponding headspace volumes in the
reactor were 55 mL and 20 mL, respectively. Potentiostatic electrolyses (Ea: 3 V) were
performed in 30 and 50 mM NaCl solutions for 3 h to investigate the chloride oxidation
kinetics in the absence of organic matter. The WEC experiments using urine (with and
without dilution) and STEs proceeded for 6 h, again with constant Ea (3 V). Small
aliquots of the electrolyte were collected for analyses without changing the working
electrode surface area. During the middle (80 – 110 min) and the end phase (300 – 330
min) of the electrolyses, the sampling port was sealed with a rubber stopper for 30 min to
introduce the headspace gas into a graded burette. The average total volumetric flow rate
of gaseous products (Q) was monitored and the molar flow rate of hydrogen (FH2) was
scaled based on the volumetric fraction of hydrogen (XH2), which was determined by a
GC/TCD (Gas Chromatography with Thermal Conductivity Detector).
4.2.6. Chemical Analyses. The pH and conductivity were monitored using a Mettler
Toledo EL20 pH meter and VWR portable conductivity meter. In order to determine the
chemical oxygen demand (COD), samples were digested in a low range dichromate
digestion solution (3 – 150 mg L–1) in a COD reactor (DRB-200, Hach, USA) and
quantified based on the absorbance at 420 nm. The total nitrogen (TN) concentration was
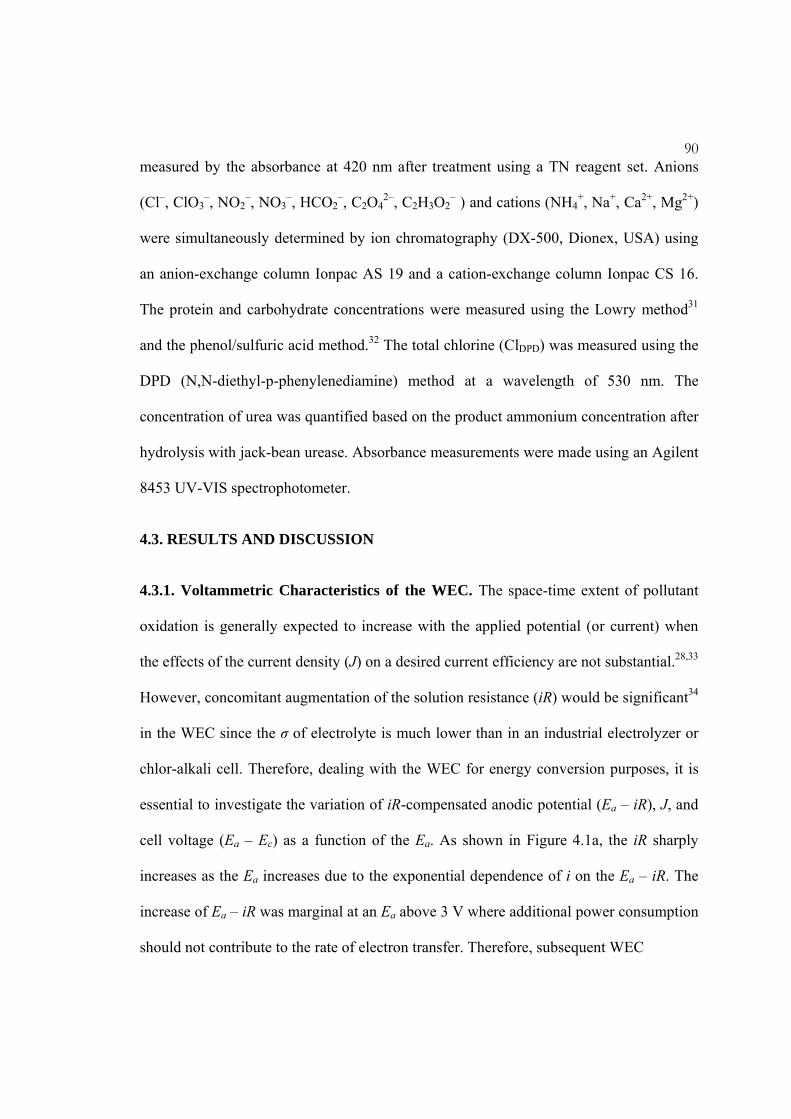
90 measured by the absorbance at 420 nm after treatment using a TN reagent set. Anions
(Cl–, ClO3–, NO2
–, NO3–, HCO2
–, C2O42–, C2H3O2
– ) and cations (NH4+, Na+, Ca2+, Mg2+)
were simultaneously determined by ion chromatography (DX-500, Dionex, USA) using
an anion-exchange column Ionpac AS 19 and a cation-exchange column Ionpac CS 16.
The protein and carbohydrate concentrations were measured using the Lowry method31
and the phenol/sulfuric acid method.32 The total chlorine (ClDPD) was measured using the
DPD (N,N-diethyl-p-phenylenediamine) method at a wavelength of 530 nm. The
concentration of urea was quantified based on the product ammonium concentration after
hydrolysis with jack-bean urease. Absorbance measurements were made using an Agilent
8453 UV-VIS spectrophotometer.
4.3. RESULTS AND DISCUSSION
4.3.1. Voltammetric Characteristics of the WEC. The space-time extent of pollutant
oxidation is generally expected to increase with the applied potential (or current) when
the effects of the current density (J) on a desired current efficiency are not substantial.28,33
However, concomitant augmentation of the solution resistance (iR) would be significant34
in the WEC since the σ of electrolyte is much lower than in an industrial electrolyzer or
chlor-alkali cell. Therefore, dealing with the WEC for energy conversion purposes, it is
essential to investigate the variation of iR-compensated anodic potential (Ea – iR), J, and
cell voltage (Ea – Ec) as a function of the Ea. As shown in Figure 4.1a, the iR sharply
increases as the Ea increases due to the exponential dependence of i on the Ea – iR. The
increase of Ea – iR was marginal at an Ea above 3 V where additional power consumption
should not contribute to the rate of electron transfer. Therefore, subsequent WEC

91
Figure 4.1. Dependence of (a) iR compensated anodic potential (Ea – iR) on applied anodic
potential (Ea), (b) cell potential (Ea – Ec) on Ea, and (c) logarithmic current density (J) on the Ea
– iR during chronoamperometric experiment in a single compartment electrolysis cell with 10
mM (square, R: 21.9 Ω), 30 mM (triangle, R: 6.8 Ω), and 50 mM (circle, R: 4.8 Ω) NaCl solution
(275 mL).

92 experiments were carried out under potentiostatic conditions with the Ea of 3 V. The
energy loss at high applied potentials should be emphasized considering that the Ea – Ec
is the actual determinant of the energy consumption; in this study, an equivalent
magnitude of Ec was required to manipulate the Ea (Figure 4.1b).33 This observation
points out a potential problem, especially in dilute solution, with inferring that various
reactive oxidants are present based on the cell voltage. For example, in 10 mM NaCl
solution, the value of Ea – iR at an Ea – Ec of 6.41 V was only 1.75 V (27%), smaller than
the thermodynamic potential required to form H2O2, O3, as well as ·OH, Cl·, and Cl2–·.
The reactive intermediates such as hydroxyl and chlorine radicals should be surface-
bound to play a role without an Ea – iR exceeding their redox potentials (E).
4.3.2. Electrochemistry of the BiOx/TiO2 Anode in Dilute Chloride Solutions. The
BiOx/TiO2 has been used as a visible-light photocatalyst due to the characteristics of
Bi2O3, including high refractive index and photoconductivity coupled with a relatively
small band gap (~ 2.8 eV).35 We also show that the BiOx/TiO2 anode is an excellent
electrochemical catalyst for generation of oxygen and RCS. In Figure 4.2, we illustrate
the cyclic voltammetry of the BiOx/TiO2 in 50 mM NaCl and 50 mM NaClO4 solutions.
The onset potential of the anodic wave was observed near 1.16 V (NHE) in both
electrolytes; this corresponds to an OER η of 0.32 V. The OER η value of the BiOx/TiO2
is low compared with those of IrO2 and RuO2 based electrodes.8,11,36 Since the OER η
value is closely related to the enthalpy of oxide transition,20 the facile OER activity of the
BiOx/TiO2 anode can be attributed to the oxide ion conducting BiOx rather than the
electrochemically resistant TiO2. According to Comninellis23, the OER on metal oxides
electrodes functions according to the following set of reactions:

93
Figure 4.2. Cyclic voltammetry (CV) of a single compartment electrolysis cell with 50 mM
NaCl (σ: 5.5 mS cm–1, R: 4.5 Ω, pH: 6.6) or 50 mM NaClO4 (inset, σ: 5.1 mS cm–1, R: 4.6 Ω,
pH: 6.6) solution (275 mL).
MOx + H2O 1k MOx(·OH) + H+ + e– (4.1)
MOx(·OH) 2k MOx+1 + H+ + e– (4.2)
MOx(·OH) ak3 MOx + 1/2 O2 + H+ + e– (4.3a)
MOx+1 bk3 MOx + 1/2 O2 (4.3b)
The physi-sorbed (MOx(·OH)) and chemi-sorbed (MOx+1) active oxygen would in
turn react with Cl– to form the RCS, resulting in an indirect oxidation of environmental
pollutants, while reactions of the MOx(·OH) or surface-trapped holes with electron
donors is often classified as direct oxidation.4,6 The contribution of the surface bound
hydroxyl radicals can be estimated by monitoring the current variation at a fixed Ea under
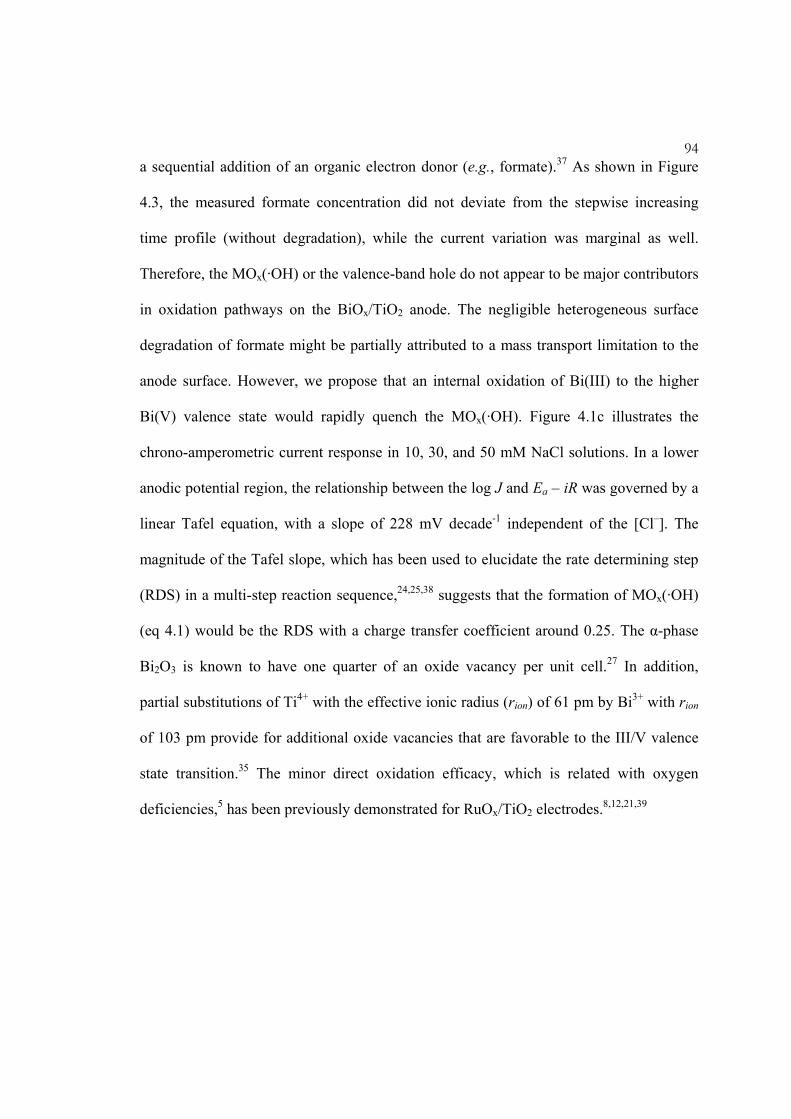
94 a sequential addition of an organic electron donor (e.g., formate).37 As shown in Figure
4.3, the measured formate concentration did not deviate from the stepwise increasing
time profile (without degradation), while the current variation was marginal as well.
Therefore, the MOx(·OH) or the valence-band hole do not appear to be major contributors
in oxidation pathways on the BiOx/TiO2 anode. The negligible heterogeneous surface
degradation of formate might be partially attributed to a mass transport limitation to the
anode surface. However, we propose that an internal oxidation of Bi(III) to the higher
Bi(V) valence state would rapidly quench the MOx(·OH). Figure 4.1c illustrates the
chrono-amperometric current response in 10, 30, and 50 mM NaCl solutions. In a lower
anodic potential region, the relationship between the log J and Ea – iR was governed by a
linear Tafel equation, with a slope of 228 mV decade-1 independent of the [Cl–]. The
magnitude of the Tafel slope, which has been used to elucidate the rate determining step
(RDS) in a multi-step reaction sequence,24,25,38 suggests that the formation of MOx(·OH)
(eq 4.1) would be the RDS with a charge transfer coefficient around 0.25. The α-phase
Bi2O3 is known to have one quarter of an oxide vacancy per unit cell.27 In addition,
partial substitutions of Ti4+ with the effective ionic radius (rion) of 61 pm by Bi3+ with rion
of 103 pm provide for additional oxide vacancies that are favorable to the III/V valence
state transition.35 The minor direct oxidation efficacy, which is related with oxygen
deficiencies,5 has been previously demonstrated for RuOx/TiO2 electrodes.8,12,21,39

95
Figure 4.3. (a) Evolution of the formate concentration and (b) current variation under sequential
substitution (2 mL, arrows) with 10 mM NaCOOH (σ: 0.92 mS/cm) in a potentiostatic (Ea: 3 V),
single compartment electrolysis cell; initial electrolyte: 5.3 mM KH2PO4 47.5 mL (pH: 7.2, σ:
0.92 mS/cm).
Several possible reaction mechanisms for the chlorine evolution reaction (CER) on
the RuO2 or RuO2/TiO2 are consistent with the MOx+1 surface species as the dominant
reactive site for chloride oxidation.24,25,38 In a typical sequence, Cl– is initially oxidized to
a surface bound ClO– (eq 4.4a), which in turn reacts with another chloride in bulk
aqueous solution or on the electrode surface to produce Cl2 (eq 4.4b). In addition, an Ea –
iR exceeding the E of Cl2–·/Cl– couple (2.0 V) should allow for the generation of chlorine
radicals (eqs 4.4c and 4.5c), whose decay rate constants to Cl2 are in the order of 109 M–1
s–1 .7 Regardless of the terminal step in the mechanism, the RCS generation is

96 characterized as first order in [Cl–] with a pseudo-steady-state approximation on
MOx(ClO–).25 At circum-neutral pH, the Cl2 reacts with water to form hypochlorous acid,
hypochlorite, H+, and Cl– (eqs 4.5a and 4.5b).
MOx+1 + Cl– ak4 MOx(ClO–) (4.4a)
MOx(ClO–) + Cl– + 2H+ bk4 MOx + Cl2 + H2O (4.4b)
MOx(ClO–) + Cl– + H+ MOx(·OH) + Cl2–· (4.4c)
Cl2 + H2O aa kk 55 , HOCl + Cl– + H+ (4.5a)
HOCl bb kk 55 , ClO– + H+ (4.5b)
Cl2–· Cl· + Cl– (4.5c)
In the subsequent scan in NaCl solution (dashed line in Figure 4.2), there was a
significant decrease in the current onset potential to 1.06 V. The earlier onset of the
anodic current observed in the chloride solution could be ascribed to the formation of
chlorate, which is a major by-product detected in the wastewater electrolysis (vide infra),
along with the build-up of the RCS during the initial scan. The second onset potential did
not explicitly coincide with the E values of ClO3–/Cl2 (1.47 V at pH 0, 0.97 V at pH 7),
ClO3–/HOCl (1.44 V at pH 0, 0.92 V at pH 7), and ClO3
–/ClO– (1.36 V at pH 0, 0.94 V at
pH 7) couple. However, given the bulk solution near neutral pH, it is conceivable to
assume that HOCl or ClO– should be the primary reductants leading to chlorate
production (eq 4.6).40,41 The reaction scheme described herein neglects perchlorate

97 formation and direct oxidation of chloride to chlorate,42 which are reported to occur in a
very high anodic bias (in the order of 103 A m-2 in terms of J).40,43
2MOx+1 + ClO– ak6 2MOx + ClO3– (4.6a)
2MOx+1 + HOCl bk6 2MOx + ClO3– + H+ (4.6b)
4.3.3. Electrochemical Kinetics in Dilute Chloride Solutions. The polarization curve of
Figure 4.1c shows an inflection in the current response with an augmentation of J in 30
and 50 mM NaCl solutions. An incremental transition of the Tafel slope is generally
interpreted as an artifact of a mass transport limitation or a shift in the RDS24. If we
consider that the RDS at a low Ea is due to the electron transfer reaction of eq 4.1, then
the reactions involving the MOx+1 (eqs 4.3b, 4.4a, and 4.6) become important as the Ea
increases. In the chemical reaction limited regime, heterogeneous reactions including
OER, CER, and chlorate evolution reactions should not significantly depend on the Ea –
iR.23 At a relatively large value of η, the active sites would be virtually saturated with the
higher oxide valence states; i.e., quasi constant [MOx+1] in the Nernstian equilibrium
between MOx and MOx+1. If we define free chlorine (FC) as the sum of Cl2, HOCl, and
ClO–,14,28,40 then the electrochemical conversion of the chloride can be treated as a simple
first-order reaction in series, where the overall kinetics is governed by eqs 4.7 – 4.9 (the
complete derivation given in Supporting Information). Even in the presence of chlorine
radicals, their short lifetimes should allow the [RCS] to be comparable with [FC], which
was quantified as ClDPD in this study. The utilization of the FC as a single component can
be rationalized by an existence of the most abundant reaction intermediate, whose

98 speciation would be dependent on the wastewater composition and the operating
condition.
d[Cl-]
dt= –k4a MOx+1 [Cl-]= –k4
eff[Cl-] (4.7)
d[FC]
dt= k4a MOx+1 Cl- – k6a MOx+1
2 FC = k4eff Cl- – k6
eff FC (4.8)
d[ClO3-]
dt=k6a[MOx+1]2 FC = k6
eff FC (4.9)
Figure 4.4 shows the evolution of the Cl–, FC, and ClO3– concentrations during a
potentiostatic electrolysis in chloride solutions with initial chloride concentrations ([Cl–]0)
of 30 and 50 mM. Anionic chlorine species with other oxidation states (ClO2–, ClO4
–)
were not detected. Despite the different current response (J = 232 ± 20 A m-2 in [Cl–]0 of
30 mM, 364 ± 23 A m-2 in 50 mM), the concentration of each chlorine species when
normalized by [Cl–]0 is governed by identical kinetic parameters. This observation
demonstrates that the CER and chlorate evolution reactions are in chemical reaction
limited regime. The chlorate evolution rate was found to increase with time; this provides
further corroboration that the oxidation of FC is responsible for the chlorate
formation.40,41 The apparent first-order behavior for the reactions taking place on the
BiOx/TiO2 anode suggests that a plug-flow or sequential-batch reactor would be preferred
to a continuous stirred-tank reactor in terms of the yield and selectivity for the FC. The
least-squares estimates for the rate coefficients are 0.17 hr–1 for k4eff and 0.37 hr–1 for k6
eff
using all data sets. However, there are some deviations from the regression lines that are
most likely due to potential interference of cathodic reactions, which reduce the RCS to

99
Figure 4.4. The variation of chloride (circle), free chlorine (triangle), and chlorate (square)
concentration as a function of (a) electrolysis time and (b) specific charge passed during
potentiostatic (Ea: 3 V) electrolysis in 30 mM (filled, R: 7.0 Ω) and 50 mM (empty, R: 5.0 Ω)
NaCl solution (55 mL). The inset figures in (a) and (b) show the logarithmic normalized chloride
concentration and the instantaneous current efficiency versus the electrolysis time.
chloride.7,15 As shown in Figure 4.4a (inset), the k4eff slightly decreased with the
augmentation of the FC concentration. The cathodic FC reduction constitutes a null
electrochemical cycle with the Cl species as an electron relay,7 reducing the apparent rate
and current efficiency of the desired reactions (pollutants removal and hydrogen
generation). With another least-squares estimation using the initial data points, we

100 obtained 0.24 hr–1 for k4
eff and 0.36 hr–1 for k6eff, which can be used to estimate the rate
constants for the homogeneous reactions between the RCS and electron donors (vide
infra).
The instantaneous current efficiency (ICE) and general current efficiency (GCE) are
figures of merit, which have been frequently used to evaluate the selectivity of the passed
charge towards the chemical contaminants oxidation or RCS generation.4,6 For an
electrolysis cell with chloride and water as electron donors, the ICE for FC and chlorate
can be expressed as follows (from eqs 4.3b, 4.8, and 4.9):
ICEFC= iFC
iO2 + iFC + i
ClO3-=
2(k4eff[Cl- – k6
eff FC )
2k3eff + 2k4
eff[Cl- + 4k6eff[FC]
= 2VFd[FC]
i dt (4.10)
ICEClO3
-=iClO3
-
iO2 + iFC + i
ClO3-=
4k6eff[FC]
2k3eff+ 2k4
eff[Cl-] + 4k6eff[FC]
=4VFd[ClO3
-]
i dt (4.11)
where, iO2, iFC, and iClO3- refer to the current used for generation of oxygen, FC, and
chlorate, k3eff represents k3b[MOx+1], while V is electrolyte volume and F is Faraday’s
constant. Figure 4.4b depicts [FC] and [ClO3–] as a function of the specific charge passed
for which the tangential slope is proportional to the ICE. The GCE at a specific time,
defined as the charge required for an observed product divided by the total passed charge,
is visualized by the slope of a secant line toward the initial point. As readily expected
from eqs 4.10 and 4.11 and the analytical solutions of eqs 4.7 – 4.9 (eqs 4.34 and 4.36),
the ICEFC monotonically decreases along with the electrolysis time or passed charge,
while the GCEFC is always higher than the ICEFC (vice versa for the chlorate). The initial
ICEFC should be a strong function of [Cl–]0 (eq 4.35), consistent with the literature on

101 chlorine evolution with metal oxide electrodes.9,44 However, the initial ICEFC was near
0.15 irrespective of the difference in [Cl–]0, while the effects of [Cl–]0 were more
discernible for the initial ICE for chlorate formation. This observation indicates that the
OER is not completely determined by the MOx+1 dismutation (eq 4.3b), but is also
influenced by the electron transfer reactions (eqs 4.1 and 4.2), where k3eff could increase
in part with the σ or [Cl–]0.
The observed first-order decrease of [Cl–] can also be a consequence of a mass
transport limitation, whose impact can be roughly assessed by the limiting current density
(JL) as shown in eq 4.12:34,45
JL = n F km Cl [Cl–], (4.12)
where, n is the number of electrons for Cl– oxidation (2) and kmCl is the mass transfer
coefficient for Cl–. If kmCl is assumed to be on the order of 10–5 m s–1,46,47 then the JL can
be estimated to be 96 A m–2 for 50 mM NaCl solutions and 58 A m–2 for 30 mM
solutions. These values are approximately 70% higher than the current density used for
the FC formation (J multiplied by ICEFC). This implies that chloride oxidation would not
be in the transport-controlled regime. Even if a mass transport limitation is operative, the
forms of kinetic equations are essentially the same.
4.3.4. Electrochemical Treatment of Fresh Urine. Preliminary experiments were
performed to assess the performance of the WEC when fresh human urine is oxidized
under potentiostatic condition (Ea: 3 V). During the electrochemical oxidation, intense
foaming was observed, most likely due to an interaction of the electrolytically produced

102 bubbles (i.e., O2 and H2) with proteins. In addition, precipitation of CaCO3 and Mg(OH)2
occurred on the cathode. The scale deposition is facilitated by high pH in the vicinity of
the cathodes, presumably due to the consumption of protons during hydrogen production.
In this situation, subsequent electrolyses were carried using fresh urine that was diluted
with Milli-Q water by a volume ratio of 1:3. The cathodic deposit in calcareous form was
corroborated by monotonic decreases of [Ca2+] and [Mg2+], as shown in Figure 4.5b
(inset).
In spite of the [Cl–]0 in diluted urine of 45 mM, the observed rate of Cl– decay as
well as the production rates of FC and ClO3– (as shown in Figure 4.5a) were much
smaller than those measured in NaCl solution. In this experiment, the ClDPD can be
composed of either FC or combined chlorine, although each contribution cannot be
estimated precisely by the chlorine mass balance analysis (see analytical details in the
Supporting Information) due to the bulk pH (6.6) smaller than the pKa of HOCl (7.5).
The slower kinetics that were observed during the chlorine redox cycle can be attributed
to facile homogeneous reactions of FC, with the various electron donors present in urine
being reduced back to chloride rather than further oxidized to chlorate. However, there
was little net elimination of COD after 6 h (Figure 4.5b), which is most likely due to the
presence of macro-molecular organic compounds. The proteins concentration in the
diluted urine was 8 times higher than in the DWW (Table 4.1). The decomposition of
high-molecular-weight organic compounds, which may be refractory to dichromate
digestion in COD analysis, may have caused partial increase of the detectable COD.
Since E of Cr2O72–/Cr3+ (1.36 V at pH 0) exceeds the corresponding potentials of ClO–
/Cl– or HOCl/Cl– at circum-neutral pH, the FC would transform the recalcitrant organics

103
Figure 4.5. Evolution of (a) chlorine species, (b) organic species, (c) nitrogen species, and (b
inlet) cations (Ca2+, Mg2+) concentration in a potentiostatic (Ea: 3 V) WEC experiment (J: 247 ± 6
A m–2, Ea – iR: 2.15 ± 0.02 V, Ea – Ec: 5.41 ± 0.04 V) with diluted human urine (pH: 6.6, σ: 6.05
mS/cm, 55 mL).
104 to be kinetically amenable to the dichromate. The concentration profile of protein (Figure
4.5b), in terms of the abundance of peptide bonds determined via the Lowry method,31
gave a pseudo first-order rate coefficient of 0.23 hr–1; this indicates that the organic
transformation by the FC involves cleavages of the peptide bonds.
About 80% of the initial TN in diluted urine was contributed by urea (Table 4.1)
with additional contributions from creatinine, uric acid, amino acids, and protein. Figure
4.5c shows that the degradation of the nitrogen containing organics resulted in the
production of ammonium ion, nitrate, and gaseous nitrogen expressed by the decrease in
the TN concentration. The urea degradation by the FC is known to initiate by sequential
chlorination of the urea to tetrachlorourea which is further oxidized to the chloramine
species.48 The inorganic combined chlorine eventually yields ammonium ion, nitrogen
gas (by dismutation of chloramines in so-called breakpoint chlorination mechanism), and
nitrate via further oxidation by FC.9,49,50 The high concentration of refractory organics in
the fresh urine required an extended electrolysis time for apparent COD conversion. In
light of this observation, a combination with biological pre-treatment including anaerobic
digestion is used to enhance pollutants conversion and to increase the energy efficiency
of the electrochemical treatment,34,36,47 as demonstrated in this study (vide infra).
4.3.5. Chlorine Transformation in the WEC with Model Septic Tank Effluents.
During the potentiostatic (Ea: 3 V) WEC experiments with STEs, J was observed to be
comparable to those in sodium chloride solution (Figure 4.6a). Therefore, we assume that
the redox kinetics for the various chlorine species are in a chemical reaction limited
regime. The main oxidizable components in the STEs were ammonium ion and organic

105
Figure 4.6. Evolution of (a) current density (J), (b) iR-compensated anodic potential (Ea – iR),
and (c) cell voltage (Ea – Ec) in potentiostatic (Ea: 3 V) WEC experiment with model septic tank
effluents; STE1 (green), STE2 (blue), STE3 (red), STE4 (black). Each inset figure shows the
mean value with standard deviation in the error bars.

106 compounds in terms of COD (Table 4.1). Their homogeneous reactions with the FC can
be expressed by the following non-stoichiometric reactions:
COD + FC 13k Product + Cl– (4.13)
2NH4+ + 3FC 14k N2 + 3Cl– (4.14)
NH4+ + 4FC 15k NO3
– + 4Cl– (4.15)
Assuming that bimolecular reactions occur between the ammonium ion and FC with
overall second order kinetics would be ideal, since reactions 14 and 15 are most likely to
proceed via sequential chlorination, producing chloramines as reaction intermediates.9 In
this context, the governing equations for FC in the presence of oxidizable chemical
species can be modified as:
d[FC]
dt= k4
eff Cl- – k6eff FC –k13 FC COD – (3k14+4k15) FC NH4
+ (4.16)
Figure 4.7 illustrates the evolution of ClDPD, following a typical break-point
chlorination curve,49 whose concentration was much smaller than [Cl–]0. In addition, the
sum of apparent [Cl–], including [ClO–], [ClO3–] and [ClDPD], was always conserved with
standard deviations less than 0.1 mM. The initial pH of the STEs was near 9 (Table 4.1)
due to urea hydrolysis during anaerobic pre-treatment. The bulk pH did not change
significantly during electrolysis because of the inherent buffering capacity of STEs and
bicarbonate generation from COD oxidation. Therefore, ClDPD should be dominated by
the sum of the combined chlorines, which followed a typical time profile for
intermediates of reactions in series. The insignificant concentrations of FC again imply

107
Figure 4.7. Time profiles of (a) chloride, (b) chlorate, and (c) ClDPD concentration together with
(b, inset) scatter plots of increase of chlorate versus decrease of chloride concentration, (d) COD
versus chloride concentration, and (e) ammonium ion versus chloride concentration in
potentiostatic (Ea: 3 V) WEC experiments with model septic tank effluents; STE1 (circle), STE2
(square), STE3 (triangle), STE4 (diamond).

108 facile homogeneous reactions between FC and the constituent pollutants, which allows
for a pseudo-steady-state approximation for the FC concentration ([FC]SS). With a quasi-
constant FC concentration, eq 4.16 indicates a linear correlation of [Cl–] with [COD] and
[NH4+] for each experimental condition, as demonstrated in Figure 4.7d and 4.7e. At
given values of k4eff and k6
eff under quasi-saturated active sites, the [FC]SS will be a
function of the initial chloride concentration ([Cl–]0), the initial ratio of pollutants to
chloride concentration ([COD]0/[Cl–]0, [NH4+]0/[Cl–]0), and the rate coefficients for
specific pollutant degradation (k13, k14, k15).
In the STEs electrolysis, a major by-product was again found to be chlorate ion,
whose production rate appeared to be nearly unchanged with time (zero-order kinetics),
as shown in Figure 4.7b and expressed by eq 4.9 at a constant [FC]SS. Using the value of
k6eff, the [FC]SS recorded in the slopes of the chlorate concentration profiles were
estimated to be 0.34, 1.4, 2.8 and 6.3 mM (higher than the bulk [ClDPD]). As noted in the
literature,34 there should be concentration gradients for the heterogeneous reactants and
products in electrode vicinity, often referred to boundary layer or reaction cage. Owing to
higher reactivity and molecular weight, the FC gradient would be more pronounced than
the chloride gradient so that the [FC]SS in the boundary layer can exceed the bulk [FC]SS.
Given our previous arguments, the characteristic mass balance equations can be written
for the near-surface of the anode and bulk solution separately as:
d[FC]ASS
dt= k4
eff Cl- – k6eff FC A
SS–km
FC
δFC A
SS– FC BSS = 0 (4.17)
d[FC]BSS
dt=
kmFC
δFC A
SS– FC BSS – FC B
SS k13 COD + 3k14+4k15 NH4+ 0 (4.18)

109 In this case, [FC]A
SS and [FC]BSS are the quasi-steady-state FC concentrations in the
boundary layer and in bulk, kmFC is the mass transfer coefficient for the FC, and δ is the
depth of boundary layer. When [FC]BSS is much lower than [FC] A
SS and the kmFC /δ is
constant, eqs 4.17 and 4.43 indicate that [FC]ASS and the corresponding chlorate
production rate are strongly dependent on the initial chloride concentration,40 as shown in
Figure 4.7b. On the other hand, as can be inferred from eq 4.18, [FC]BSS should be
affected by the initial concentration of pollutants ([COD]0, [NH4+]0) as well.
4.3.6. COD Removal Characteristics in WEC with Model Septic Tank Effluents.
Figure 4.8 illustrates the evolution of the COD concentration during the WEC
experiments using STEs. The COD conversion after 6 h electrolysis was 15%, 25%, and
34% for STE1–3, whereas almost complete mineralization (i.e., conversion to CO2) of
COD was observed for STE4. The pseudo-steady-state assumption for FC allows us to
characterize the COD degradation kinetics by a pseudo-first-order rate constant, kCODeff.
d[COD]
dt= – k13 FC B
SS COD = – kCODeff COD (4.19)
From a series of nonlinear regressions of eq 4.19 we can estimate kCODeff, which is an
order of magnitude higher for STE4 (0.43 hr–1) than for the others (0.041 – 0.066 hr–1).
The rate constants depend on [COD]0/[Cl–]0 rather than [Cl–]0, in agreement with
previous reports14,33,51 in which the observed rate constants increased with the relative
COD concentration but were not altered by influent dilution. The initial ratio of
pollutants-to-chloride concentration would be an important determinant of [FC]BSS, as
inferred from eq 4.18 with [FC]ASS as a strong function of [Cl–]0. Therefore, an extended

110
Figure 4.8. Time profiles of COD concentration in potentiostatic (Ea: 3 V) WEC experiments
with model septic tank effluents; STE1 (circle), STE2 (square), STE3 (triangle), STE4
(diamond).
anaerobic treatment resulted in STE4 having a lower pollutants-to-chloride ratio than the
other STEs (Figure 4.7d and 4.7e) and superior COD conversion. In addition, a lower
fraction of recalcitrant organics in STE4 (Table 4.1) also contributed to the higher kCODeff
by an augmented k13. Assuming the DWW is analogous to the flushing water for excreta,
the recipe of STE4 is rationalized by a low usage of flushing water, which is threefold
volume of urine, as would be the scenario in communities with water shortages. The HRT
required for STE with a higher flushing would be comparable since the dilution does not
affect the ratio of pollutants to chloride concentration, or even smaller when sticking to
an effluent water quality criteria.
Consequently, the results for STE4 strongly demonstrate that our WEC is suitable
for efficient toilet wastewater treatment system in a relatively short HRT without external
chemical dosages, if combined with proper anaerobic pre-treatment unit. It should be

111 noted that the pre-treatment would require much shorter times than 7 days, since the
biological concentration in septic tanks would be much greater than in DWW.
Figure 4.9 details the transformation characteristics for the organic compounds in
terms of scatter plots for protein, carbohydrates, and carboxylic acids versus the COD
concentration. As in the case of COD, the pseudo first-order rate constant for protein
degradation (kproteineff) was also much higher for STE4 (2.5 hr–1) than for STE1–3 (1.2 –
1.5 hr–1). In addition, the observed kproteineff exceeds kCOD
eff by more than an order of
magnitude for STE1–3, which suggests that the FC would preferentially attack the
nucleophilic sites of organic macromolecules by electrophilic substitution reactions.7,52
The reactions between FC and the peptides, which have second-order rate constants on
the order of 106 – 107 M–1s–1, are known to initiate by chloramination of terminal amine
group.52 The cleavage of peptides bonds should produce measurable COD (carbonyl
compounds and amines with shorter chain lengths), because initial protein degradation
was not accompanied by a noticeable decrease of COD (Figure 4.9a). On the contrary,
the COD degradation caused increases in carbohydrate and carboxylate concentration
(Figure 4.9b and 4.9c), as is reported in a previous work using municipal wastewater.19
While carboxylate ions (e.g., formate, oxalate, and acetate) are often the observed
products of organic compound oxidation,39,53 the increase in apparent carbohydrate may
be due to the release of mono- or oligo-saccharide from decompositions of glycoproteins.
The reaction of FC with electron-rich glycosidic bonds in poly-saccharides should also
yield simple sugars, which can form hydroxymethylfurfural in the phenol/sulphuric acid
analytical method.32 The reactivity of the FC with oxygenated moieties (alcohol and
carboxyl functional groups) in carbohydrates and carboxylic acids are known to be

112
Figure 4.9. Scatter plot for (a) protein, (b) carbohydrate, and (c) carboxylates concentration
versus COD concentration together with (a, inlet) pseudo-first-order rate constants for protein
degradation in potentiostatic (Ea: 3 V) WEC experiments with model septic tank effluents; STE1
(circle), STE2 (square), STE3 (triangle), STE4 (diamond). Arrows indicate an arbitrary varying
direction along with time.

113 relatively slow.52,54 Nevertheless, the accumulation of these organic compounds did not
significantly contribute to the residual COD of STE4.
4.3.7. Nitrogen Removal Characteristics in the WEC with Model Septic Tank
Effluents. The evolution of nitrogen containing compounds, another major constituent of
STEs, is illustrated in Figure 4.10. The conversions of TN and NH4+ after the 6 h of
electrolysis were observed to be less than that of COD, and the TN conversion had a
relative order of STE4 (39%) > STE2 (25%) > STE3 (18%) > STE1 (13%). The kinetics
of the ammonium ion oxidation can be described in terms of the pseudo-first-order rate
constants, kameff, as follows:
d[NH4+]
dt= – (3k14+4k15) FC B
SS NH4+ = –kam
eff NH4+ (4.20)
As shown in Figure 4.10b, the magnitude of kameff was not simply correlated with
[FC]BSS as in the case of COD, and the highest rate constant was observed for STE2.
Table 4.1 and Figure 4.10a (inset) show that ammonium ion constituted 60 – 70% of TN
in STE3–4 and even larger fractions for STE1–2 (higher dilution with DWW). The initial
organic nitrogen, in terms of [TN]0 – [NH4+]0 – [NO3
–]0, was attributed to urea by more
than 50%. As discussed above, the degradation of urea and other nitrogen containing
moieties (amines, amides, amino acids, and peptides) will produce ammonium ion via
organic chloramine formation and consecutive oxidation.48,52 As a result, apparent kameff
values were lower for STE3–4 despite the higher levels of [FC]BSS. Figure 4.10a (inset)
further visualizes that the ostensible decay rates of TN exceeds those of ammonium for
STE3–4. This observation together with low values of [ClDPD] (Figure 4.7c) suggests that

114
Figure 4.10. Time profiles of (a) TN, (b) NH4+, and (c) NO3
– concentration together with
scatter plots for (a, inlet) TN versus NH4+ concentration and (c, inlet) NO3
– versus removed
NH4+ concentration in potentiostatic (Ea: 3 V) WEC experiments with model septic tank
effluents; STE1 (circle), STE2 (square), STE3 (triangle), STE4 (diamond).

115 gaseous nitrogen generation may not be limited by the dismutation reactions of the
chloramine species. The relative reactivity of FC towards amides (including urea) is not
as high as the second-order rate constants of FC with ammonium ion, primary/secondary
amines, amino acids, and peptides.52 On the other hand, the observed rates of the TN
decay were also greater than nitrate generation rate, as shown in Figure 4.10c (inset),
which is more obvious for STE4. Although the mechanism and kinetics for the
breakpoint chlorination are not fully known, the dominance of combined chlorine in the
ClDPD allows us to conclude that the disproportionation of chloramines is favored relative
to their further oxidation to nitrate, as the chloramine concentration increases. Previous
studies on ammonium ion removal from landfill leachates50 and anaerobic digestion
effluents55 reported similar results in that N2 formation is favored over nitrate formation
as J or [Cl–]0 increase.
In the case of the STE4 effluent, which had the highest TN conversion, the WEC
effluents still had significant nitrogen concentrations (~ 40 mM TN), which were
primarily in the form of ammonium ion (76%) and nitrate (8.2%). If we imagine the
bioavailability of residual nitrogen, the treated water can then be regarded as a liquid
fertilizer if used for irrigation water.
4.3.8. Current Efficiency and Energy Consumption of the WEC with Model Septic
Tank Effluents. Based on the kinetic model in this study, the instantaneous current
efficiencies for COD degradation and for production of N2, NO3–, and ClO3
– can be
expressed as follows:

116
ICECOD= k14 FC B
SS COD
2k3eff + 2k4
eff Cl- + 4k6eff FC A
SS
= –4VFd[COD]
i dt (4.21)
ICEN2=
k14 FC BSS NH4
+
2k3eff + 2k4
eff Cl- + 4k6eff FC A
SS
= –3VFd[TN]
i dt (4.22)
ICENO3
-= k15 FC B
SS NH4+
2k3eff + 2k4
eff Cl- + 4k6eff FC A
SS
= 8VFd[NO3
-]
i dt (4.23)
ICEClO3
-= 6k6
eff FC ASS
2k3eff + 2k4
eff Cl- + 4k6eff FC A
SS
= 6VFd[ClO3
-]
i dt (4.24)
In these equations, the [COD] should be expressed in molar concentration units
(mM O2), while N2 is assumed to totally account for the gaseous nitrogen production. The
ICE for chlorate production is expressed based on 6-electron transferred from chloride.
Compared to the ICE for chloride oxidation in the absence of pollutants (eqs. 4.10 – 4.11,
Figure 4.4b) with significant time variations, the differential concentrations of COD, TN,
nitrate, and chlorate appeared to be almost linearly correlated with the specific charge
passed (Figure 4.11). Accordingly, the ICE did not deviate much from the GCE. These
findings can be explained in terms of the pseudo first-order rate constants for pollutant
degradation (kCODeff, kameff) that are much lower than k4
eff and k6eff. The ICE for organic
compound degradation on non-active electrodes such as BDD has sometimes been
reported to approach unity initially but decrease with time, as limited by the mass
transport of substrate to the anode surface.54
A series of linear regressions of the differential concentrations on the specific charge
passed can be used to estimate the mean current efficiencies, as illustrated by Figure
4.12a. The results as well as eqs 4.44 – 4.47 indicate that the current efficiencies of the

117
Figure 4.11. Variations in (a) COD concentration, (b) TN concentration, (c) nitrate
concentration, and (d) chlorate concentration as a function of specific passed charge in
potentiostatic (Ea: 3 V) WEC experiments with model septic tank effluents; STE1 (circle), STE2
(square), STE3 (triangle), STE4 (diamond).

118
Figure 4.12. (a) Average current efficiency for COD, nitrogen, and chlorine conversion, and
(b) specific energy consumption for COD and total nitrogen on average in potentiostatic (Ea: 3
V) WEC experiments with model septic tank effluents. Error bars represent the standard
deviation.
FC mediated oxidation are influenced substantially by [Cl–]0 itself,10,13,28,56 rather than by
the pollutants-to-chloride ratio. The rate of pollutant removal should be a function of [Cl–
]0 only, since it is proportional to the [FC]BSS multiplied by the pollutant concentrations.
At a given [Cl–]0, eqs. 4.44 – 4.47 further indicate that the relative concentration and
reactivity towards the FC govern the charge consumption for each substrate. For example,
in STE4, kCODeff exceeds kam
eff by a greater extent than in the other STEs, which was

119 balanced by the lowest value of the [COD]/[NH4
+] ratio. Independent of the specific STE
composition, the charge required for COD reduction was comparable with that for N2
production, about half of which was consumed for nitrate production. Even though the
‘regression toward the mean’ analysis would underestimate the individual ICE, the sum
of eqs 4.21 to 4.24 as the total current used other than OER was less than 50%. In a
previous direct measurement of oxygen evolution from an electrolysis of a chloride
solution, we estimated the current efficiency of the OER to be less than 25%.15
As can be seen in Figure 4.12b, the energy consumption for unit removal of
pollutants also monotonically decreased with the increase in [Cl–]0. However, the
influence of [Cl–]0 on the SEC is not as significant as on the ICE due to the large
increment of J with [Cl–]0 (Figure 4.6a). These observations suggest that an influent
dilution (increase in flushing volume) might reduce the HRT to achieve an effluent
quality criteria (vide supra), but an increase of energy consumption is inevitable.14,51 The
kinetic model presented herein predicts minor effects of J on the observed rate constants
in the chemical reaction limited regime. This model is in general agreement with previous
reports on RuO2 which experimentally showed a saturation dependence of the observed
rate constants on J.12,33,34,57 It is clear that current density plays a crucial role in the direct
oxidation rate but not in the indirect oxidation rate.33,57 Under these conditions, further
increases in J should favor OER rather than CER, which in turn decreases the current
efficiency of pollutant oxidation but significantly increases the solution resistance, energy
loss and SEC.14 Therefore, a reduction in SEC is expected with an effort to adjust the Ea
to maximize the desired current efficiency.

120 4.3.9. Hydrogen Production in WEC with Model Septic Tank Effluents. Figure 4.13
depicts the quantitative estimates for hydrogen generation as a function of the average J
value. The rate of total gas production (Q) almost linearly increased with the average J.
The volumetric fraction of hydrogen (XH2) was about 40% under current densities less
than 150 A m–2 (STE1), while increased to near 60% at higher current densities. However,
the dependency of XH2 on J was not obvious when taking into account the measurement
error (coefficient of variation: 11% in maximum) in the GC/TCD analysis. The adverse
contribution of gases initially present in the connection tube may explain the lower XH2
for STE1. The remaining fractions of the gaseous products would include oxygen, water
vapor, nitrogen, carbon dioxide, chlorine, ammonia, and hydrogen sulphide (with minor
contribution). The molar flow rate of hydrogen (FH2) is used to estimate the current
efficiency for hydrogen generation (CEH2) to be 50% for STE1, increasing to 90% for
STE2–4. The hydrogen evolution reaction (HER) has a well-known reaction sequence20
that proceeds by combination of eq 4.25 with either eq 4.26 or 4.27:
HA + C + e– → C(H·) + A– (4.25)
C(H·) + HA + e– → H2 + C + A– (4.26)
2 C(H·) → H2 + 2C (4.27)
where C stands for a cathodically active site for the HER and A is the conjugate base of
the proton (OH– or null term in circum-neutral pH). The main constituent acting as the
active sites is presumed to be Ni, in the case of Hastelloy C-22 that was used in this study.
Ni belongs to a near-summit group of the volcano plots under basic conditions.20

121
Figure 4.13. Dependency of (a) generation rate of total gaseous products (Q, solid circle), (b)
volumetric fraction of hydrogen (XH2, void circle), (c) molar generation rate of hydrogen (FH2,
square), (d) current and energy efficiency (CE in triangle and EE in diamond) for hydrogen
generation on average current density (J) during gas collection (80 – 110 min and 300 – 330
min) in potentiostatic (Ea: 3 V) WEC experiments with model septic tank effluents. Error bars
in (b) represent the standard deviations of repetitive GC/TCD measurement, and the reference
line in (c) shows theoretical FH2 with CE of 100%.

122 Ni-based binary or ternary metal composites (with Mo, Co, Cd, and Fe) have been
thoroughly investigated for their catalytic HER activity that is dependent on the bond
strength between the metal surface and adsorbed hydrogen.
Competitive electron acceptors including oxygen, nitrate, chlorate, and FC can
interfere with the HER. The cathodic potential (Ec), which ranged from –2.4 to –2.8 V, is
sufficiently below the E of O2/HO2· (–0.54 V at pH 7) as well as positive E (spontaneous
reduction) of NO3–/NO2
– (0.42 V at pH 7), ClO3–/ ClO–, and ClO–/Cl–. The RCS species
are clearly the major scavengers of HER and their effects on the CEH2 have been
documented in our previous reports. For example, Park et al.7 reported that an injection
of organic electron donors during electrolysis in NaCl solution results in a sharp increase
of CEH2 by quenching the RCS. In the present report, anodically generated FC species
should engage in facile reactions with pollutants in the bulk phase before being
transported to the cathode surface,34 as demonstrated by the quasi-steady-state FC with a
very small bulk-phase concentration ([FC]BSS). The reduction of oxygen to superoxide
radical and resulting reactive oxygen species (ROS) were thought to influence the
oxidation of pollutants. However, the roles of ROS appear to be marginal in this study
because the conversion of COD was insignificant when the chloride concentration was
low (STE1).
In spite of the relatively high current efficiency, the energy efficiency for hydrogen
generation (EEH2) was observed near 25% for STE2–4, which is much lower than an
idealized electrolysis unit. The EEH2 has been reported to increase with lowering cell
voltage19 and in synergy with photocatalytic hydrogen evolution on the BiOx/TiO2

123 electrode under direct solar radiation.18 The energy losses due to the intrinsic
overpotential, the ohmic drop, along with the various side reactions in the complex
electrolyte system within the WEC may be compensated by a net saving of energy for
water treatment and the added costs of electrolyte addition. The US DOE58 estimated that
the wastewater collection and treatment consumes about 60% of the energy requirements
for water supply. The impurities in the gaseous product narrow the usage of the
hydrogen to an internal combustion (IC) engine without an added purification procedure.
Based on the energy efficiency of the current hydrogen IC engines of 35%, a 10%
reduction of the SEC is expected with using the hydrogen as a secondary energy source
for the WEC.
4.4. OUTLOOK FOR THE FUTURE
Conventional water reuse criteria for non-restricted urban reuse applications are generally
based on a BOD of 30 mg L–1.3 The electrochemically treated water for the STE4 showed
negligible COD, suggesting that the treated water is suitable for reuse as toilet flushing
water and for irrigation. The relatively facile removal of protein further implies an
efficient disinfection of coliforms through complete breakage of bacterial cells and
inactivation owing to the reduced carbon source. Since color is also an important
consideration for reuse of treated wastewater, we note that the yellowish color was nearly
eliminated during WEC treatment as shown in Figure 4.14. However, chlorate production
poses a potential health risk, since several drinking water guidelines recommend chlorate
concentrations lower than 10 μM.40 The high level of chlorate most likely will not be a
significant problem when using the treated water only for toilet flushing. The chlorate

124
Figure 4.14. (a) Variation in absorbance spectra (270 – 500 nm) along with the electrolysis time
and (b) absorbance at 425 nm as a function of electrolysis time in potentiostatic (Ea: 3 V) WEC
experiments with STE4. Inset figure in (b) visualizes the color variation.
formation can be reduced with an increase in hydraulic mixing in the WEC resulting in
an increase of kmFC, as inferred from eqs 4.40 and 4.43. A proper selection of cathode
materials, known to have a high activity for nitrate reduction (such as bimetallic Cu/Zn59),
can be another potential solution to facilitate chlorate reduction to chloride under actual
operating conditions. These enhancements would be beneficial with respect to increasing

125 the efficiency of pollutant oxidation even though chlorate reduction could compete with
the HER. Calcareous deposits on the cathode surface could result in significant mass
transport limitation for hydrogen evolution. Current switching (i.e., polarity) has been
shown to remove calcareous deposits, although this would require anti-corrosion cathode
material.
The WEC with or without a PV power source has the potential to meet the growing
demand for on-site wastewater treatment coupled with water reuse and, in select cases,
for alternative fuel production from water-splitting. A scaled-up WEC or PWEC should
be easy to transport to various environments, including urbanized areas, peri-urban
environments, and remote locations in the developing world that lack viable sanitation
facilities to treat domestic black water. These systems may also be used for treatment of
industrial wastewaters, landfill leachates, anaerobic sludge digester effluents, and reverse
osmosis concentrates.
4.5. SUPPORTING INFORMATION
4.5.1. Materials. NaCl and concentrated sulfuric acid were used as received from Macron
Chemicals. Crystalline phenol (99.6%) and Na2C2O4 were purchased from J.T. Baker.
Total Protein Reagent, Folin-Ciocalteu’s phenol reagent, protein standard (bovin serum
albumin), TiOSO4, H2IrCl6, [O2CCH2C(OH)(CO2)CH2CO2]Bi, Bi2O3, SnCl4, and TaCl5
were received from Sigma Aldrich. Chemical oxygen demand (COD) digestion solution,
COD standard solution (potassium acid phthalate), total nitrogen (TN) reagent set, DPD
total chlorine reagent powder, and chlorine standard solution were received from Hach.
Jack Bean Urease was provided by the Worthington Biochemical Corporation. All other

126 chemicals were supplied by Mallinckrodt. Ti metal sheet (Ti-Gr.2 sheet, 0.50 mm thick)
was purchased from ThyssenKrupp Materials. All electrolyte and standard solutions were
prepared in MilliQ water (18.2 MO cm) from a Millipore Milli-Q gradient water
purification system.
4.5.2. BiOx/TiO2 Electrode Preparation. A Ti metal sheet (0.5 mm thick) was sand-
blasted with SiC paper (120 – 240 grits) and degreased with acetone. The precursor
solution for the anti-passivation layer was prepared as 73 mM H2IrCl6 with 27 mM TaCl5
in 4 M HCl solution. Both sides of pretreated Ti support were brushed by the precursor and
annealed at 525 °C for an hour. This procedure was repeated 5 times with the same
annealing temperature for a 10 min duration. A sealing coat was deposited twice by
painting 225 mM SnCl4 and 12.5 mM Bi2O3 in 0.5 M HCl solution and baking at 425 °C
for 10 min. Precipitates from dissolving 10 mmol Bi2O3 and 0.48 mol TiOSO4 in 1.2 M
Na2CO3 (1 L) were calcined at 830 °C for 45 min to produce bismuth oxide doped titanium
dioxide (BiOx/TiO2) nanoparticles. The precursor for the BiOx/TiO2 thin film (overcoat
solution) was 160 mM Ti(OCH2CH2O)2 (i.e., the preparation details are described
elsewhere) with 80 mM [O2CCH2C(OH)(CO2)CH2CO2]Bi in a 0.24 M NH4OH solution.
To prepare the slurry deposition layer, BiOx/TiO2 particles dispersed in MilliQ water (3 M
metal concentration) were brushed on air dried; after this step a 25-fold diluted overcoat
solution was sequentially pasted on to the surface. The slurry deposit was baked on at 250
for 5 min; this procedure was repeated 7 times. In the final sequence, a thin film of
BiOx/TiO2 deposit was made by repetitive sealing with overcoat solution annealed at
250 °C (4 times) and then at 450 °C (2 times).

127 4.5.3. Electrochemical Methods. Before all electrochemical experiments, the electrodes
were rinsed with acetone and a large amount of MilliQ water. The electrode module was
allowed to equilibrate with the electrolyte solution in an open circuit for 1 h while
monitoring the open circuit potential of anode and cathode. As a routine procedure, the pH,
conductivity, and the ohmic resistance between anode and reference electrode (R) were
measured before and after the electrochemical experiments. The R was measured by current
interruption method with current bias of 100 mA. For the chrono-voltammetric data
collection, the current intensity (J) was averaged from 400 to 500 seconds. The variation of
current density after 500 seconds was not significant, since the p-values of the paired t-test
between the averaged current from 400 to 500 seconds and from 500 to 1800 seconds were
always larger than 0.05.
4.5.4. Model Septic Tank Effluent Preparation. The COD degradation during the
anaerobic incubation followed an exponential decay trend, where initial decomposition of
macro-molecules was followed by mineralization of organics with exponential growth of
microorganisms, initially presented in domestic wastewater (DWW). Urea was hydrolyzed
to give ammonium ion enzymatically using urease; this resulted in an increase of the pH of
the model septic tank effluents (STEs) up to 9. The increase in pH resulted in a
considerable amount of precipitation of minerals, including magnesium ammonium
phosphate (struvite). The supernatant of the collected DWW and prepared STEs was used
in the experiments to minimize the effects of particulate matters.
4.5.5. Analyses. COD was measured with standard digestion kits with a low detection
range (3 – 150 mg L–1); the kits were prepared in order to eliminate the interference of the
ammonium ion in the COD analysis60 by controlling the kinetics for ammonium and COD

128 oxidation steps separately. Samples were diluted to adjust the chloride concentration far
below the interference range (2,000 mg L-1) as suggested by the digestion kit supplier
(Hach, USA). For the Dionex DX-500 Ion Chromatography (IC) system, hypochlorite
appeared to have a peak at a retention time identical to the chloride ion with
superimposable calibration curves. Since the hypochlorite would be detected both in the IC
analysis and total chlorine (ClDPD) analysis, the sum of [Cl–], [ClDPD], and [ClO3–] exceeded
the initial chloride concentration, particularly for the electrolysis in pure NaCl solution. In
this case, [Cl–] was calibrated by subtracting the difference, which corresponds to [ClO–].
For urea measurement, 5 mL of diluted samples in 15 mL conical tubes were added by 2
mL of urease solution (63.1 mg L-1) and incubated in water bath (50 °C) for 20 min.
Treated samples were cooled down at room temperature (RT) for IC analysis. Urea
measurements were performed only for the intact electrolyte before the electrolysis due to
the interference of free chlorine. In the phenol-sulfuric acid method,32 0.4 mL samples in
glass tubes were mixed with 0.4 mL phenol solution (5 W/V%) and 2 mL sulfuric acids
(95%) to measure the absorbance at 470 nm after reaction for 30 min at RT. For protein
measurement,31 0.5 mL samples were introduced to 2.5 mL total protein reagent in 15 mL
conical tubes with gentle inversion several times. After reaction for 10 min at RT, twofold
diluted Folin-Ciocalteu’s phenol reagent of 0.2 mL was added with vigorous mixing. With
further holding at RT for 30 min, the absorbance of the supernatant was measured at 600
nm. NH4Cl, NaOCl, NaClO3, NaNO2, NaNO3, HCOONa, Na2C2O4, CH3COONa, MgSO4,
and CaCl2 were used as standards with proper concentration range for the IC analysis.
Potassium acid phthalate, NH4Cl, chlorine, bovine serum albumin, and glucose solution
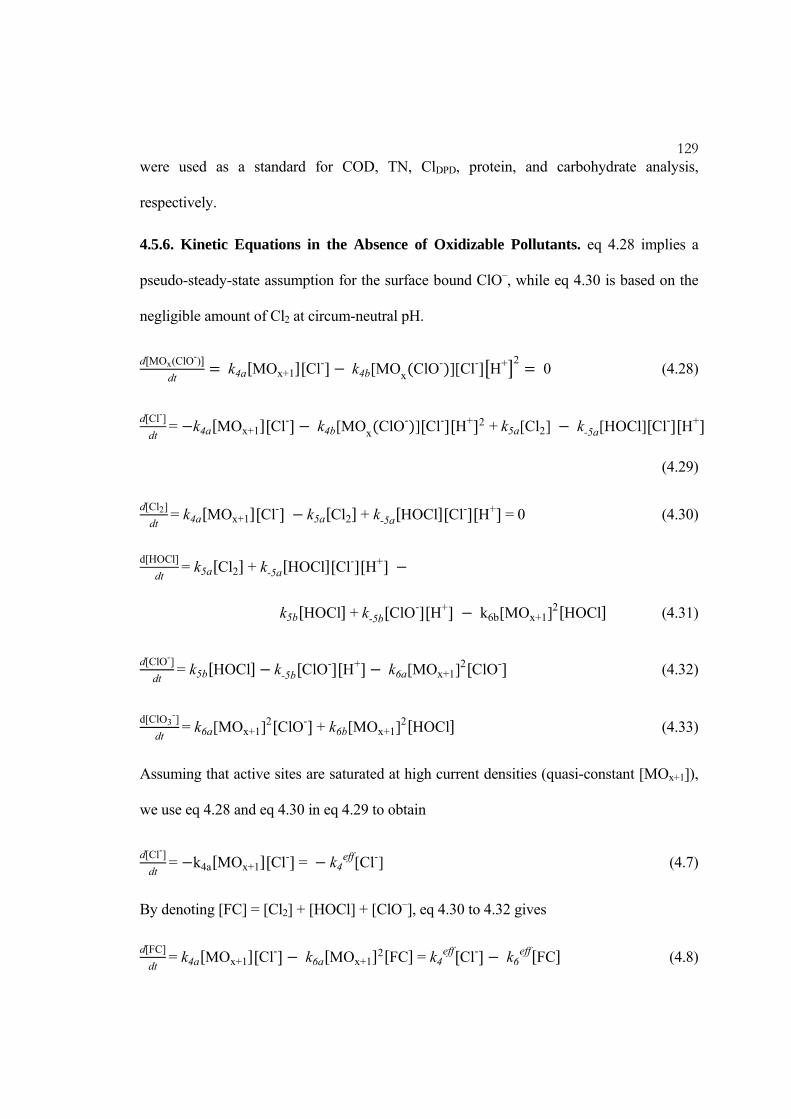
129 were used as a standard for COD, TN, ClDPD, protein, and carbohydrate analysis,
respectively.
4.5.6. Kinetic Equations in the Absence of Oxidizable Pollutants. eq 4.28 implies a
pseudo-steady-state assumption for the surface bound ClO–, while eq 4.30 is based on the
negligible amount of Cl2 at circum-neutral pH.
d MOx(ClO-)
dt k4a MOx+1 Cl- k4b[MOx ClO- ][Cl- H+ 2
0 (4.28)
d[Cl-]
dt= k4a MOx+1 Cl- k4b[MOx ClO- ] Cl- H+ 2 +k5a[Cl2] k-5a[HOCl] Cl- H+
(4.29)
d[Cl2]
dt= k4a MOx+1 Cl- k5a Cl2 + k-5a HOCl Cl- H+ =0 (4.30)
d[HOCl]
dt= k5a Cl2 + k-5a HOCl Cl- H+
k5b HOCl +k-5b ClO- H+ k6b[MOx+1]2 HOCl (4.31)
d[ClO-]
dt= k5b HOCl k-5b ClO- H+ k6a[MOx+1]2 ClO- (4.32)
d[ClO3-]
dt= k6a[MOx+1]2 ClO- + k6b[MOx+1]2 HOCl (4.33)
Assuming that active sites are saturated at high current densities (quasi-constant [MOx+1]),
we use eq 4.28 and eq 4.30 in eq 4.29 to obtain
d[Cl-]
dt= k4a MOx+1 Cl- = k4
eff[Cl-] (4.7)
By denoting [FC] = [Cl2] + [HOCl] + [ClO–], eq 4.30 to 4.32 gives
d[FC]
dt= k4a MOx+1 Cl- k6a MOx+1
2 FC = k4eff Cl- k6
eff FC (4.8)

130 Assuming that k6a is comparable to k6b and [FC] ~ [HOCl] + [ClO–] at circum-neutral pH,
d[ClO3-]
dt= k6a[MOx+1]2 FC =k6
eff FC (4.9)
4.5.7. Instantaneous Current Efficiency (ICE) for Free Chlorine (FC) and Chlorate
without the Presence of Pollutants. Substituting the analytical solutions of eq 4.7 to 4.9 to
eq 4.10 yields,
ICEFC= 2[k4
eff exp k4efft
k4effk6
eff
k6eff k4
eff exp k4
efft exp k6efft ]
2k3eff
Cl- 0
+2k4effexp( k4
efft)+4k4
effk6eff
k6eff k4
eff exp k4
efft exp k6efft
(4.34)
where, [Cl–]0 denotes the initial chloride concentration.
When t → 0, ICEFC= k4
eff
k3eff
Cl- 0
+k4eff
(4.35)
Similarly, the instantaneous current efficiency for chlorate formation is expressed as
ICEClO3
-=
6k4effk6
eff
k6eff k4
eff exp k4
efft exp k6efft
2k3eff
Cl- 0
+2k4effexp( k4
efft)+4k4
effk6eff
k6eff k4
eff exp k4
efft exp k6efft
(4.36)
4.5.8. Kinetic Equations in the Presence of Pollutants. The governing equations for
chloride and FC with the presence of pollutants are derived by modifying eq 4.7 and 4.8 as:
d[Cl-]
dt= k4
eff Cl- + k13 FC COD +(3k14+4k15) FC NH4+ (4.37)
d[FC]
dt= k4
eff Cl- k6eff FC k13 FC COD (3k14+4k15) FC NH4
+ (4.16)
By treating the FC mass balance analyses for the bulk-phase and the electrode boundary
layer separately, we employ pseudo-steady-state approximations for the FC to give

131 d[FC]A
SS
dt= k4
eff Cl- k6eff FC A
SSkm
FC
δFC A
SS FC BSS =0 (4.38)
d[FC]BSS
dt=
kmFC
δFC A
SS FC BSS FC B
SS k13 COD + 3k14+4k15 NH4+ =0
(4.39)
where, [FC]ASS and [FC] B
SS are quasi-steady-state FC concentration in the anode vicinity
and in bulk, kmFC is the mass transfer coefficient for the FC, and δ is the depth of boundary
layer. Since [FC]ASS >> [FC]B
SS, the solutions of eq 4.38 and 4.39 are reduced to
[FC]ASS=
k4eff[Cl-]
k6eff+ km
FC
δ
≡ C[FC]ASS
[Cl-] (4.40)
[FC]BSS=
kmFC
δ k4eff[Cl-]
k6eff+ km
FC
δ k13 COD + 3k14+4k15 NH4+≡
C[FC]B
SS[Cl-]
k13 COD + 3k14+4k15 NH4+ (4.41)
Also, the mass balance equation for chloride (eq 4.37) and chlorate (eq 4.9) are modified as
d[Cl-]
dt= k4
eff Cl- + k13 FC BSS COD +(3k14+4k15) FC B
SS NH4+ (4.42)
d[ClO3-]
dt= k6
eff FC ASS (4.43)
4.5.9. Instantaneous Current Efficiency (ICE) for COD degradation. Substituting eq
4.40 and 4.41 into eqs 4.21 to 4.24 gives
ICECOD= 4C
[FC]BSS
2k3eff
Cl-+2k4
eff+4C[FC]A
SSk6
eff 1+3k14+4k15 NH4
+
k13 COD
(4.44)
ICEN2=
4C[FC]B
SS
2k3eff
Cl-+2k4
eff+4C[FC]A
SSk6
eff 1+4k153k14
+ k13 COD
3k14 NH4+
(4.45)

132
ICENO3
-= 4C
[FC]BSS
2k3eff
Cl-+2k4
eff+4C[FC]A
SSk6
eff 1+3k144k15
+ k13 COD
4k15 NH4+
(4.46)
ICEClO3
-= 6C
[FC]ASS
k6eff
2k3eff
Cl-+2k4
eff+4C[FC]A
SSk6
eff (4.47)
4.6. REFERENCES
(1) Vorosmarty, C. J.; McIntyre, P. B.; Gessner, M. O.; Dudgeon, D.; Prusevich, A.; Green,
P.; Glidden, S.; Bunn, S. E.; Sullivan, C. A.; Liermann, C. R.; Davies, P. M. Global
threats to human water security and river biodiversity. Nature 2010, 467 (7315), 555-
561.
(2) Grant, S. B.; Saphores, J. D.; Feldman, D. L.; Hamilton, A. J.; Fletcher, T. D.; Cook, P.
L. M.; Stewardson, M.; Sanders, B. F.; Levin, L. A.; Ambrose, R. F.; Deletic, A.;
Brown, R.; Jiang, S. C.; Rosso, D.; Cooper, W. J.; Marusic, I. Taking the "Waste" out
of "Wastewater" for human water security and ecosystem sustainability. Science 2012,
337 (6095), 681-686.
(3) Guidelines for water reuse; EPA/600/R-12/618; United States Environmental
Protection Agency: Washington, D.C., 2012.; nepis.epa.gov/Adobe/PDF/P100FS7K.
pdf.
(4) Martinez-Huitle, C. A.; Ferro, S. Electrochemical oxidation of organic pollutants for the
wastewater treatment: direct and indirect processes. Chemical Society Reviews 2006,
35 (12), 1324-1340.
(5) Trasatti, S. Electrocatalysis in the anodic evolution of oxygen and chlorine.
Electrochimica Acta 1984, 29 (11), 1503-1512.
(6) Panizza, M.; Cerisola, G. Direct and mediated anodic oxidation of organic pollutants.
Chemical Reviews 2009, 109 (12), 6541-6569.
(7) Park, H.; Vecitis, C. D.; Hoffmann, M. R. Electrochemical water splitting coupled with
organic compound oxidation: The role of active chlorine species. Journal of Physical
Chemistry C 2009, 113 (18), 7935-7945.

133 (8) Malpass, G. R. P.; Miwa, D. W.; Mortari, D. A.; Machado, S. A. S.; Motheo, A. J.
Decolorisation of real textile waste using electrochemical techniques: Effect of the
chloride concentration. Water Research 2007, 41 (13), 2969-2977.
(9) Chiang, L. C.; Chang, J. E.; Wen, T. C. Indirect oxidation effect in electrochemical
oxidation treatment of landfill leachate. Water Research 1995, 29 (2), 671-678.
(10) Costa, C. R.; Olivi, P. Effect of chloride concentration on the electrochemical
treatment of a synthetic tannery wastewater. Electrochimica Acta 2009, 54 (7), 2046-
2052.
(11) Malpass, G. R. P.; Miwa, D. W.; Machado, S. A. S.; Olivi, P.; Motheo, A. J. Oxidation
of the pesticide atrazine at DSA(R) electrodes. Journal of Hazardous Materials 2006,
137 (1), 565-572.
(12) Miwa, D. W.; Malpass, G. R. P.; Machado, S. A. S.; Motheo, A. J. Electrochemical
degradation of carbaryl on oxide electrodes. Water Research 2006, 40 (17), 3281-
3289.
(13) Rajkumar, D.; Palanivelu, K. Electrochemical degradation of cresols for wastewater
treatment. Industrial & Engineering Chemistry Research 2003, 42 (9), 1833-1839.
(14) Rajkumar, D.; Kim, J. G. Oxidation of various reactive dyes with in situ electro-
generated active chlorine for textile dyeing industry wastewater treatment. Journal of
Hazardous Materials 2006, 136 (2), 203-212.
(15) Park, H.; Vecitis, C. D.; Hoffmann, M. R. Solar-powered electrochemical oxidation of
organic compounds coupled with the cathodic production of molecular hydrogen.
Journal of Physical Chemistry A 2008, 112 (33), 7616-7626.
(16) Choi, J.; Qu, Y.; Hoffmann, M. R. SnO2, IrO2, Ta2O5, Bi2O3, and TiO2 nanoparticle
anodes: electrochemical oxidation coupled with the cathodic reduction of water to
yield molecular H2. Journal of Nanoparticle Research 2012, 14 (8).
(17) Valero, D.; Ortiz, J. M.; Exposito, E.; Montiel, V.; Aldaz, A. Electrochemical
wastewater treatment directly powered by photovoltaic panels: Electrooxidation of a
dye-containing wastewater. Environmental Science & Technology 2010, 44 (13),
5182-5187.

134 (18) Park, H.; Bak, A.; Ahn, Y. Y.; Choi, J.; Hoffmannn, M. R. Photoelectrochemical
performance of multi-layered BiOx-TiO2/Ti electrodes for degradation of phenol and
production of molecular hydrogen in water. Journal of Hazardous Materials 2012,
211, 47-54.
(19) Park, H.; Choo, K.; Park, H.; Choi, J.; Hoffmann, M. R. Electrochemical oxidation and
microfiltration of municipal wastewater with simultaneous hydrogen production:
Influence of organic and particulate matter. Chemical Engineering Journal 2013, 215-
216 (15), 802-810.
(20) Walter, M. G.; Warren, E. L.; McKone, J. R.; Boettcher, S. W.; Mi, Q. X.; Santori, E.
A.; Lewis, N. S. Solar water splitting cells. Chemical Reviews 2010, 110 (11), 6446-
6473.
(21) Panizza, M.; Cerisola, G. Electrochemical oxidation as a final treatment of synthetic
tannery wastewater. Environmental Science & Technology 2004, 38 (20), 5470-5475.
(22) Panizza, M.; Delucchi, M.; Cerisola, G. Electrochemical degradation of anionic
surfactants. Journal of Applied Electrochemistry 2005, 35 (4), 357-361.
(23) Comninellis, C. Electrocatalysis in the electrochemical conversion/combustion of
organic pollutants for waste-water treatment. Electrochimica Acta 1994, 39 (11-12),
1857-1862.
(24) Trasatti, S. Progress in the understanding of the mechanism of chlorine evolution at
oxide electrodes. Electrochimica Acta 1987, 32 (3), 369-382.
(25) Krishtalik, L. I. Kinetics and mechanism of anodic chlorine and oxygen rvolution
reactions on yransition-metal oxide electrodes. Electrochim Acta 1981, 26 (3), 329-
337.
(26) Gujar, T. P.; Shinde, V. R.; Lokhande, C. D.; Han, S. H. Electrosynthesis of Bi2O3 thin
films and their use in electrochemical supercapacitors. Journal of Power Sources 2006,
161 (2), 1479-1485.
(27) Shuk, P.; Wiemhofer, H. D.; Guth, U.; Gopel, W.; Greenblatt, M. Oxide ion
conducting solid electrolytes based on Bi2O3. Solid State Ionics 1996, 89 (3-4), 179-
196.

135 (28) Scialdone, O.; Randazzo, S.; Galia, A.; Silvestri, G. Electrochemical oxidation of
organics in water: Role of operative parameters in the absence and in the presence of
NaCl. Water Research 2009, 43 (8), 2260-2272.
(29) Weres, O. Electrode with surface comprising oxides of titanium and bismuth and
water purification process using this electrode. U.S. Patent 7,494,583 B2, Feb. 24,
2009.
(30) Onsite wastewater treatment systems manual; EPA/625/R-00/008; United States
Environmental Protection Agency: Washington, D.C., 2002.; nepis.epa.gov/Adobe/
PDF/P100FS7K.pdf .
(31) Lowry, O. H.; Rosebrough, N. J.; Farr, A. L.; Randall, R. J. Protein measurement with
the Folin phenol reagent. Journal of Biological Chemistry 1951, 193 (1), 265-275.
(32) Dubois, M.; Gilles, K. A.; Hamilton, J. K.; Rebers, P. A.; Smith, F. Colorimetric
method for determination of sugars and related substances. Analytical Chemistry 1956,
28 (3), 350-356.
(33) Mohan, N.; Balasubramanian, N. In situ electrocatalytic oxidation of acid violet 12
dye effluent. Journal of Hazardous Materials 2006, 136 (2), 239-243.
(34) Szpyrkowicz, L.; Kelsall, G. H.; Kaul, S. N.; De Favei, M. Performance of
electrochemical reactor for treatment of tannery wastewaters. Chemical Engineering
Science 2001, 56 (4), 1579-1586.
(35) Wang, Y.; Wang, Y.; Meng, Y. L.; Ding, H. M.; Shan, Y. K.; Zhao, X.; Tang, X. Z. A
highly efficient visible-light-activated photocatalyst based on bismuth- and sulfur-
codoped TiO2. Journal of Physical Chemistry C 2008, 112 (17), 6620-6626.
(36) Goncalves, M. R.; Marques, I. P.; Correia, J. P. Electrochemical mineralization of
anaerobically digested olive mill wastewater. Water Research 2012, 46 (13), 4217-
4225.
(37) Kesselman, J. M.; Weres, O.; Lewis, N. S.; Hoffmann, M. R. Electrochemical
production of hydroxyl radical at polycrystalline Nb-doped TiO2 electrodes and
estimation of the partitioning between hydroxyl radical and direct Hole oxidation
pathways. Journal of Physical Chemistry B 1997, 101 (14), 2637-2643.

136 (38) Santana, M. H. P.; De Faria, L. A. Oxygen and chlorine evolution on
RuO2+TiO2+CeO2+Nb2O5 mixed oxide electrodes. Electrochimica Acta 2006, 51 (17),
3578-3585.
(39) Panizza, M.; Cerisola, G. Olive mill wastewater treatment by anodic oxidation with
parallel plate electrodes. Water Research 2006, 40 (6), 1179-1184.
(40) Jung, Y. J.; Baek, K. W.; Oh, B. S.; Kang, J. W. An investigation of the formation of
chlorate and perchlorate during electrolysis using Pt/Ti electrodes: The effects of pH
and reactive oxygen species and the results of kinetic studies. Water Research 2010,
44 (18), 5345-5355.
(41) Polcaro, A. M.; Vacca, A.; Mascia, M.; Palmas, S.; Ruiz, J. R. Electrochemical
treatment of waters with BDD anodes: kinetics of the reactions involving chlorides.
Journal of Applied Electrochemistry 2009, 39 (11), 2083-2092.
(42) Czarnetzki, L. R.; Janssen, L. J. J. Formation of hypochlorite, chlorate and oxygen
during NaCl electrolysis from alkaline-solutions at an RuO2/TiO2 Anode. Journal of
Applied Electrochemistry 1992, 22 (4), 315-324.
(43) Bergmann, M. E. H.; Rollin, J.; Iourtchouk, T. The occurrence of perchlorate during
drinking water electrolysis using BDD anodes. Electrochimica Acta 2009, 54 (7),
2102-2107.
(44) Kraft, A.; Stadelmann, M.; Blaschke, M.; Kreysig, D.; Sandt, B.; Schroder, F.; Rennau,
J. Electrochemical water disinfection - Part I: Hypochlorite production from very
dilute chloride solutions. Journal of Applied Electrochemistry 1999, 29 (7), 861-868.
(45) Szpyrkowicz, L.; Radaelli, M.; Daniele, S. Electrocatalysis of chlorine evolution on
different materials and its influence on the performance of an electrochemical reactor
for indirect oxidation of pollutants. Catalysis Today 2005, 100 (3-4), 425-429.
(46) Szpyrkowicz, L.; Kaul, S. N.; Neti, R. N.; Satyanarayan, S. Influence of anode
material on electrochemical oxidation for the treatment of tannery wastewater. Water
Research 2005, 39 (8), 1601-1613.
(47) Szpyrkowicz, L.; Kaul, S. N.; Neti, R. N. Tannery wastewater treatment by electro-
oxidation coupled with a biological process. Journal of Applied Electrochemistry
2005, 35 (4), 381-390.

137 (48) Blatchley, E. R.; Cheng, M. M. Reaction mechanism for vhlorination of urea.
Environmental Science & Technology 2010, 44 (22), 8529-8534.
(49) Kapalka, A.; Katsaounis, A.; Michels, N. L.; Leonidova, A.; Souentie, S.; Comninellis,
C.; Udert, K. M. Ammonia oxidation to nitrogen mediated by electrogenerated active
chlorine on Ti/PtOx-IrO2. Electrochemistry Communications 2010, 12 (9), 1203-1205.
(50) Peez, G.; Saiz, J.; Ibanez, R.; Urtiaga, A. M.; Ortiz, I. Assessment of the formation of
inorganic oxidation by-products during the electrocatalytic treatment of ammonium
from landfill leachates. Water Research 2012, 46 (8), 2579-2590.
(51) Fernandes, A.; Pacheco, M. J.; Ciriaco, L.; Lopes, A. Anodic oxidation of a
biologically treated leachate on a boron-doped diamond anode. Journal of Hazardous
Materials 2012, 199, 82-87.
(52) Deborde, M.; von Gunten, U. Reactions of chlorine with inorganic and organic
compounds during water treatment - Kinetics and mechanisms: A critical review.
Water Research 2008, 42 (1-2), 13-51.
(53) Vlyssides, A.; Barampouti, E. M.; Mai, S.; Arapoglou, D.; Kotronarou, A.
Degradation of methylparathion in aqueous solution by electrochemical oxidation.
Environmental Science & Technology 2004, 38 (22), 6125-6131.
(54) Canizares, P.; Paz, R.; Lobato, J.; Saez, C.; Rodrigo, M. A. Electrochemical treatment
of the effluent of a fine chemical manufacturing plant. Journal of Hazardous
Materials 2006, 138 (1), 173-181.
(55) Lei, X. H.; Maekawa, T. Electrochemical treatment of anaerobic digestion effluent
using a Ti/Pt-IrO2 electrode. Bioresource Technology 2007, 98 (18), 3521-3525.
(56) Bonfatti, F.; Ferro, S.; Lavezzo, F.; Malacarne, M.; Lodi, G.; De Battisti, A.
Electrochemical incineration of glucose as a model organic substrate - II. Role of
active chlorine mediation. Journal of the Electrochemical Society 2000, 147 (2), 592-
596.
(57) Mohan, N.; Balasubramanian, N.; Basha, C. A. Electrochemical oxidation of textile
wastewater and its reuse. Journal of Hazardous Materials 2007, 147 (1-2), 644-651.
(58) Energy demands on water resources: Report to congress on the interdependency of
energy and water; United States Department of Energy: Washington D.C., 2006.;

138 http://www.sandia.gov/energy-water/docs/121-RptToCongress-EWwEIAcomments-
FINAL.pdf.
(59) Li, M.; Feng, C. P.; Zhang, Z. Y.; Shen, Z. L.; Sugiura, N. Electrochemical reduction
of nitrate using various anodes and a Cu/Zn cathode. Electrochemistry
Communications 2009, 11 (10), 1853-1856.
(60) Kim, B. R. Effect of ammonia on COD analysis. Journal Water Pollution Control
Federation 1989, 61 (5), 614-617.

B
WITH A
BIXTI1-XOZ
AN ENHAN
FUNCTIO
NCED REAC
IN DILU
C h a p t
NALIZED
CTIVE CHL
TE AQUEO
t e r 5
HETERO-J
LORINE G
OUS SOLU
JUNCTION
GENERATIO
UTIONS
N ANODE
ON EFFICI
139
IENCY

140 ABSTRACT
New Ir0.7Ta0.3Oy/BixTi1-xOz hetero-junction anodes have been developed and
characterized for reactive chlorine species (RCS) generation in dilute aqueous solution
(50 mM NaCl). The primary objective was to control the electro-stationary speciation of
hydrous metal oxides between hydroxyl radical (>MOx(·OH)) and higher valence-state
oxides (>MOx+1). An underlying layer of the mixed-metal oxide, Ir0.7Ti0.3Oy, was
synthesized to serve as a primary ohmic contact and electron shuttle. Binary thin films of
BixTi1-xOz were prepared from the thermal decomposition of an aqueous solution mixture
of Ti/Bi complexes. With these core components, the measured current efficiency for
RCS generation (ηRCS) was enhanced where the values observed for x = 0.1 or 0.3 were
virtually twice of the ηRCS of the Ir0.7Ti0.3Oy anode. At the same time, the rates of RCS
generation were enhanced by a factor of 20 – 30%. Partial substitution of Ti with Bi
results in a positive shift in surface charge allowing for stronger interaction with anions
as confirmed by FTIR-ATR analysis. A kinetic model to describe the formate ion
degradation showed that an increasing fraction of Bi in the composite promotes a redox
transition of >MOx(·OH) to >MOx+1. In accelerated life tests under conditions
corresponding to a service life of 2 years under an operational current density of 300 A
m-2, dissociation of Ti component from Ir0.7Ta0.3Oy/TiO2 was found to be minimal, while
BiOx in the surface layers undergoes oxidation and a subsequent dissolution.

141 5.1. INTRODUCTION
We developed new hetero-junction mixed-metal oxides anodes, which allow for
enhanced reactive chlorine generation in dilute aqueous solution in terms of current
(energy) efficiency. The outer surface of the hetero-junction anodes is functionalized with
BixTi1-xOz layers which provide elevated electro-stationary concentration of adsorbed
hydroxyl radical, while the underlying Ir0.7Ta0.3Oy layer serves both as ohmic contact and
electron shuttle. This study demonstrates that the surficial binary metal oxides layers,
prepared through traditional thermal decomposition of aqueous Ti and Bi complex
solutions, not only shift the heterogeneous kinetics and selectivity but also reduce a loss
of the precious element (e.g., Iridium) under long-term operation.
Dimensionally stable anodes (DSAs) consisting of mixed-metal oxides containing
either IrO2 or RuO2 as core components have been widely deployed for industrial
chlorine production (chloro-alkali processes),1 energy storage into molecular H2 (polymer
exchange membrane electrolysis),2,3 and high-salinity wastewater treatment processes,4,5
among many other uses. Drawbacks to long-term application include the high materials
cost of Ir and Ru as well as their instability relative to conversion to IrO42- and RuO4
under operational anodic potential bias.6 In recent years, strategies to promote the mass
normalized activities of IrO2 or RuO2 have relied on increasing electro-active surface area
via either quantum sizing the crystalline structure3,7 or elevation in thin film porosity1,2 by
modern material preparation techniques. The use of mixed-metal oxides anodes has been
extended to composites containing Ta2O5,6 TiO2,
6,8-10 SnO2,11,12 ZrO2,
6 CeO2,8,9 and
Sb2O511,12 as a secondary or tertiary component, most often focusing on enhancement in

142 stability or conductivity. Nevertheless, for a couple of decades, IrO2-Ta2O5 (Ir:Ta = 7:3)
and RuO2-TiO2 (Ru:Ti = 3:7) combinations remain the best composition accepted for an
industrial application with respect to oxygen evolution reaction (OER) and chlorine
evolution reaction (ClER), respectively.1,2,6
Another challenge to point out in this regard is that the Pt-group metal oxides with
the lowest over-potential for OER also exhibit outstanding electro-catalytic activities for
chlorine generation. The competition between OER and ClER is due to their competition
for active surface sites (e.g., surface coordinated reactive oxygen species).13 Upon an
electrical potential gradient across the anode/electrolyte interface, hydrous metal oxides
have been known to produce physi-sorbed hydroxyl radicals (>MOx(·OH)) and, by
further oxidative transition, higher oxides (>MOx+1).4,5,14 As a rule of thumb, the surface-
bound >MOx(·OH) is believed to prefer reactions with electron-donating substances
adsorbed on the surface, whereas liberation of active oxygen chemi-sorbed to a higher-
oxidation-state central metal into molecular O2 would be favored for >MOx+1.14 The
quasi-stationary distribution between >MOx(·OH) and >MOx+1 is primarily determined
by the enthalpy change in lower (>MOx) to higher (>MOx+1) oxides transition or the
binding energy of active oxygen.13,15,16 In this context, volcano plots have been used to
interpret the electrochemical activities of variable types of metal oxide.15 Recent density
functional theory calculations suggested that the volcano type relations for OER and
ClER overlap while the highest activity is seen with RuO2 followed by IrO2.13,16
The additives are often used to control the electrolyte composition (i.e., the activities
of chloride ion, water, and proton) and to minimize various scavenging reactions.17 The

143 selectivity toward a desired product is also contingent upon the speciation of surficial
reactive oxygen species which, in turn, is mostly determined by the specific composition
of the anode.4,5 Relatively low metal-oxygen bond strengths for PbO2, SnO2, and TiO2 are
known to facilitate reactions between >MOx(·OH) and electron donating substrates (e.g.,
organics and chloride ion). As a result, metal oxides located at the left-hand side of a
typical volcano plot show considerably high current efficiencies (selectivities of electron
transfer), in spite of a large kinetic barrier (and energy consumption) for initial activation
of >MOx. On the contrary, >MOx(·OH) sites are readily quenched by redox transition of
metal ions in case of IrO2- or RuO2-based mixed metal oxides with relatively low OER
over-potentials. Therefore, the degradation of organic waste products on metal oxides
near the apex of the volcano plot is primarily due to homogeneous reactions with reactive
chlorine species (RCS) that are generated from >MOx+1. In this case, the current
generation from OER is often comparable or dominating that from ClER in dilute
aqueous solutions.
Among several beneficial aspects of hetero-junction fabrication of catalytic thin film,
a shift in heterogeneous kinetics can be anticipated by surface modification18 to enhance
the selectivity towards the reaction of interest. TiO2 in water lead to the formation of
surface-bound hydroxyl radical, >Ti(·OH), by trapping photo-chemically generated
electrons and holes under illumination or with an applied potential bias equal to or greater
than the bandgap energy.19 TiO2 provides active sites for hydroxyl radical formation with
limited transition to >MOx+1.20 On the other hand, Bi2O3 is known to have excellent
pseudo-capacitance capability in the water splitting potential region and dielectric
permittivity for use in Faradaic supercapacitors.21,22 Extraordinary oxide ion conductivity

144 attributed to intrinsic disordered oxygen vacancies and high polarizability by the presence
of a 6s2 lone pair in Bi(III) allows Bi2O3 to be used as a solid oxide fuel cell electrolyte.23
The electrochemical nature of Bi2O3 appears to be suitable for >MOx formation and
OER.24
In this paper, we report on the electrochemical activity and stability of
Ir0.7Ti0.3Oy/BixTi1-xOz hetero-junction anodes and their potential applications for
electrochemical water and wastewater treatment. A systematic parametric study was
undertaken in order to determine the effects of nominal molar fraction of Bi in BixTi1-xOz
functionalities on RCS generation efficacies during the course of potentiostatic
electrolysis of dilute aqueous solutions with circum-neutral pH.
5.2. EXPERIMENTAL SECTION
5.2.1. Ir0.7Ti0.3Oy/BixTi1-xOz Hetero-junction Anode Preparation. The hetero-junction
semiconductor anodes were prepared by sequential thermal decomposition methods. Ti
metal sheets (3 × 2 cm2, 0.5 mm thickness) were pretreated by sand-blast, 50 V/V%
acetone degreasing, and etching in boiling 10 M/V% oxalic acid right before fabrication.
Ir0.7Ta0.3Oy layers were prepared by brushing precursor (70 mM H2IrCl6 + 30 mM TaCl5
in 1:1 ethanol and isopropanol) on both sides of Ti base, drying at 80 ºC (10 min) and
annealing at 525 ºC (10 min). The electrodes underwent five more repetitive sequences
and further heat treatment at 525 ºC for 1 h as a final annealing, ending up with catalysts
loading of 0.64 mg cm-2 on average. Aqueous titanium-glycolate complex was prepared
from hydroxo-peroxo method,25-27 with proper modifications. In a typical recipe, titanium
butoxide (250 mM of final concentration) and glycolic acid (375 mM) were added into a

145 relevant amount of water. The resulting precipitates were re-dissolved with 30 W/W%
H2O2 (ca. 40% of final precursor volume). Exothermic reactions with a presence of dark
red color appeared with vigorous generations of CO2 and O2 bubbles. In order to adjust
the pH to be circum-neutral, a small aliquot of concentrated NH4OH (ca. 3.5% of final
precursor volume) was added. The color quickly changed into yellow with the pH
adjustment while mild bubble generations (including N2) continued with a decay of
residual H2O2. Aqueous Bi solutions were prepared by dissolving 250 mM bismuth
citrate in 750 mM NH4OH solutions. The resulting precursors of Ti and Bi were mixed
together for preparation of BixTi1-xOz layers with variable nominal molar fraction of Bi (x
= 0, 0.1, 0.3, 0.5, 0.7, 1). Analogous thermal decomposition procedures were carried out
on top of the Ir0.7Ta0.3Oy anode with annealing temperature at 425 ºC. The mass loading
of outer BixTi1-xOz layer ranged from 0.51 to 1.4 mg cm-2, depending on the precursor
composition (x). The prepared electrodes were cleaned with dilute acetone and a large
amount of deionized water before electro-analytical and physic-chemical characterization.
5.2.2. Electroanalysis. The electrochemical reactor employed throughout this study
consisted of an anode under investigation, a stainless steel cathode in parallel (3 × 2 cm2,
5 mm distance), and a Ag/AgCl/Sat. KCl reference electrode (Basi Inc.) in a one
compartment cell (working volume of 60 mL). The Vycor® glass tip of the reference
electrode was located 3 mm apart from the center of the anode. Applied anodic potential
(Ea) from a potentiostat (SP-50, BioLogic) was converted to the normal hydrogen
electrode (NHE) scale by Ea (NHE) = Ea (Ag/AgCl) + 0.197 V. Cyclic voltammetry (CV)
data in stirred 50 mM NaCl solutions (three consecutive cycles without open-circuit
resting) were recorded in the range of Ea from 0.2 to 1.0 V at the scan rate of 20 mV sec-1.

146 The quasi-stationary polarization data from 0.8 to 2.5 V were also collected with the scan
rate of 5 mV sec-1. Before each electrochemical experiment, open circuit potentials of
anode and cathode were monitored for 30 min. The ohmic resistances were measured
before and after each experiment by a current interruption method with current bias of
200 mA.
5.2.3. Potentiostatic RCS Generation and Formate Ion Degradation. The generation
rate and current efficiency of RCS generation were estimated during potentiostatic
electrolysis in 50 mM NaCl solutions under several different Ea (2.0, 2.5, and 3.0 V). The
RCS concentration was measured by DPD (N,N-diethyl-p-phenylenediamine) reagent at
a fixed time interval (2 min) three times with proper dilutions. The relatively low reaction
time was intended to minimize an occurrence of chlorine species with higher oxidation
states (ClO3-, ClO4
-).28 The current efficiency for the RCS generation was estimated by
the following equation:
dtI
CldVF DPD][2RCS (5.1)
where, V is electrolyte volume (0.06 L), F is Faraday constant (96485.3 C mol-1), [ClDPD]
is the concentration of RCS (M), I is current (A), and t is electrolysis time (sec). In order
to assess the contribution of >MOx(·OH) on the RCS generation, formate ion was chosen
as a probe compound for the surficial hydroxyl radical. Potentiostatic electrolysis
experiments were performed in 50 mM NaCOOH solutions for 1 h. The [HCOO-] was
measured for periodically collected samples using ion chromatography (Dionex, USA)
with anion-exchange column (Ionpac AS 19).

147 5.2.4. Surface Characterization. After finishing the electrochemical experiments,
anodes were cut into half pieces, each of which was subject to the physicochemical
surface analysis and accelerated life test, respectively. The horizontal or cross-sectional
morphology were observed by ZEISS 1550VP field emission scanning electron
microscopy (SEM), while elemental compositions were analyzed by Oxford X-Max SDD
X-ray energy dispersive spectrometer (EDS) system either in point-and-identification or
mapping mode. X-ray diffraction (XRD) profiles were collected using an X’pert MD
(Panalytical) diffractometer with Cu-K radiation. Thermo-Scientific Nicolet™ iS™50
Fourier transform infrared spectroscopy (FTIR) was used to characterize surface
functionalities. Hetero-junction anodes were held on attenuated total reflectance (ATR)
unit in contact either with deionized water or 1 M NaClO4 solutions.
5.2.5. Accelerated Life Test. The stabilities of the Ir0.7Ta0.3Oy/BixTi1-xOz hetero-junction
anodes with variable molar fraction of Bi (x) were compared using accelerated life tests.
Each hetero-junction anode sandwiched with a stainless steel cathode (0.5 × 2 cm2, 3 mm
distance) was immersed in 1 M NaClO4 solution in a conical tube. Neware Battery
Testing System powered the galvanostatic (current density= 1 A cm-2) electrolysis in each
test cell. The electrolyte was replaced periodically (3 to 5 h interval), and dissociated
amounts of Ti, Bi and Ir in the electrolyte were quantified by Agilent inductivity coupled
plasma-mass spectrometry (ICP-MS).
5.3. RESULTS
5.3.1. Physico-chemical Properties. Figure 5.1 shows SEM images of the
Ir0.7Ta0.3Oy/BixTi1-xOz hetero-junction anodes with variable molar fraction of Bi (x) after

Figure 5.1
Ir0.7Ta0.3Oy/
magnificatio
1. Scanning
/BixTi1-xOz h
on of ×5000
g Electron
hetero-juncti
(a – e) or ×1
Microscopy
ion anode
1000 (f).
y (SEM) im
with variab
mages of
ble molar f
horizontal v
fraction of
148
view for
Bi with

Figure 5.2
Ir0.7Ta0.3Oy
mapping of
2. Scanning
/Bi0.3Ti0.7Oz
f Ti (b), Bi (c
Electron M
hetero-junc
c), Ir (d), and
Microscopy (
ction anode
Ta (e).
(SEM) imag
with Energy
ge (a) of cr
y Dispersive
ross-section
Spectroscop
149
view for
py (EDS)

150 undergoing the electrochemical experiments. The horizontal morphology of the outer
surface appeared to have a cracked and fragmented shapes, where the size of discrete
islands appeared to be the lowest for x = 0.1. Observations of vertical cross-section
estimated the total depth of mixed metal oxides deposit on Ti support to be approximately
70 μm, while suggested that the depth of cracks is much less than the total film thickness.
The surficial cracks were more distinct for the binary compositions (x = 0.1 ~ 0.7), which
presumably ascribed to the differences in thermal expansion coefficients of titanium and
bismuth oxides.10 The interface between the underlying Ir0.7Ta0.3Oy and BixTi1-xOz was
not distinct perhaps due to inter-diffusions of ions. An EDS mapping image on a cross-
section view of Ir0.7Ta0.3Oy/Bi0.3Ti0.7Oz anode (Figure 5.2) indicated, in fact, that thermal
inter-diffusion of the metal ions had taken place across the hetero-junction during
annealing, on the basis of vertical gradients of Ir and Ta signals.
According to the XRD profiles (Figure 5.3), the hetero-junction anode without Bi
doping (x = 0) was characterized by a mixture of anatase and rutile phase TiO2. In the
presence of Bi with fractions higher than 10%, the peak from the anatase TiO2 (2θ = 25 º)
disappeared. The anatase TiO2 structure has been known to be transformed into a
thermodynamically more stable rutile structure by thermal stresses with temperatures
higher than 600 ºC.29 However, evidence has been presented that an existence of
impurities in the TiO2 lattice structure can significantly reduce the transition
temperature;1 the annealing temperature in this study was 425 ºC, which is in the lower
range reported by Hanaor and Sorrell29. In addition, Tomita et al.25 reported the
crystalline structure of TiO2 prepared from the aqueous titanium-glycolate complexes can

151
Figure 5.3. X-ray diffraction patterns of hetero-junction anodes Ir0.7Ta0.3Oy / BixTi1-xOz with
variable molar fraction (x) of Bi (a) referenced with a library for metal oxides of interests (b).
be influenced by the pH of precursor solution. With the current formulation for
preparation of the anodes, the process of mixing with the Bi precursor (bismuth citrate
dissolved in ammonia) should elevate the mixture precursor pH. In the absence of Ti
(Ir0.7Ta0.3Oy/BiOz), the surficial XRD patterns indicate α-phase Bi2O3 and Bi2O4,
suggesting that the effective oxidation state of Bi is a mixture of +3 and +5. In this regard,
it is well known that monoclinic α-Bi2O3 is converted to cubic δ-Bi2O3 at temperatures

152 higher than 730 ºC. After cooling the product, metastable β- and γ-phase Bi2O3 are
found.23 A visual observation, that the light yellow color of the initial composite as
deposited changed into white after the electrochemical experiments, implied that the
partial oxidation of Bi (III) to Bi (V) was likely to occur via an anodic potential bias
rather than via thermal annealing. For the hetero-junction anodes with Bi fraction from
0.3 to 0.7, the diffraction intensities appeared to be much lower than the other
compositional formulations using the same XRD instrument. The relative differences in
the effective ionic radii of Bi (103 pm) and Ti (60.5 pm) may result in distortions in the
lattice microstructure, which is often observed in binary metal oxide thin film.30
The infrared absorption bands of the hetero-junction anodes in contact with
deionized water (Figure 5.4a) were mostly characterized by broad bands at 3000 – 3600
cm-1, relatively sharp peaks centered at 1640 cm-1, and prominent bands starting at
around 900 cm-1. Peaks at 1640 cm-1 are usually assigned to bending (deformation)
vibrations of free or physi-sorbed water, while the absorption bands ranged from 3000 to
3600 cm-1 are ascribed to stretching vibrations of surface titanol group (>Ti-OH) or
hydrogen bonded H2O. Absorption regions at wavenumbers lower than 900 cm-1 occur
owing to fundamental vibrations of oxides lattice, particularly from M-O stretching and
M-O-M bridging modes (where M is Ti or Bi). The minor peaks at around 2400 cm-1 are
attributed to adsorption of carbonaceous species from air. Regarding the Bi-enriched
hetero-junction anodes (x = 0.7 and 1), peaks centered near 1400 cm-1 appeared due to
hydrated bismuth oxide moieties or surface hydroxyl functionalities (i.e., >Bi-OH) via
hydrolysis as in the common case of metal oxides exposed to water (e.g., TiO2, Fe2O3,
SiO2, WO3, etc.). The absorption peaks near 3300 cm-1 broadened as the fraction of Bi

153
Figure 5.4. Fourier transform infrared spectroscopy with attenuated total reflectance (FTIR-
ATR) analysis of Ir0.73Ta0.27Oy/BixTi1-xOz hetero-junction anodes with variable molar fraction
(x); (a) in contact with deionized water, (b) in contact with 1 M NaClO4 solutions, (c)
integrated intensities of peaks at 1110 cm-1 in contact with 1 M NaClO4 solutions. Each
adsorption spectra was collected with respect to the background signal of the contacting liquid.
increased. In contrast, the intensity of the peak at 1640 cm-1 did not change along with the
molar fraction of Bi, presumably due to the interference of interstitial water molecule
layers between solid samples and internal reflectance element. Evidence has been
presented that the absorption bands in this range (1640 cm-1) originate primarily from
coordinated H2O rather than from surficial hydroxyl group.31

154 According to traditional models describing the surface charge of metal oxides based
on their amphoteric nature, the IR absorption from M-OH bonds is expected to decay
with the deprotonation of OH functionalities. Therefore, increased isoelectric point of
metal oxides at a given solution composition (bulk pH) would allow for losses in
absorption by M-OH. In an attempt to assess the role of Bi on the surface charge more
clearly, IR spectra were collected in 1 M NaClO4 background solutions with circum-
neutral pH. Aside from the absorption profiles described above, characteristic peaks of
adsorbed ClO4- appeared at 1110 cm-1 (Figure 5.4b). The integrated intensities of the
characteristic peaks monotonically increased along with the molar fraction of Bi (Figure
5.4c). This observation clearly demonstrates that an increase in the surficial Bi fraction is
accompanied by an increase in positive surface charges.
5.3.2. Voltammetric Characteristics. Water oxidation on metal oxide anodes is initiated
by the one electron oxidation of surface hydroxyl groups to form bound hydroxyl radical
(>MOx(·OH)) and, sequentially, these intermediate states can be further oxidized to
higher oxides (>MOx).4,5,14 Eqs 5.2-5.5 describe the overall reaction sequence of the
OER,17,32,33 where the rate constant for each reaction step is governed by the bond
strength between the corresponding metal ion and active oxygen.15,16
>MOx + H2O → >MOx(·OH) + H+ + e– (k1) (5.2)
>MOx(·OH) → >MOx + 1/2 O2 + H+ + e– (k2) (5.3)
>MOx(·OH) → >MOx+1 + H+ + e– (k3) (5.4)
>MOx+1 → >MOx + 1/2 O2 (k4) (5.5)

155 Figure 5.5a illustrates the electrochemical activities of the Ir0.7Ta0.3Oy/BixTi1-xOz
hetero-junction anodes in 50 mM NaCl solutions with circum-neutral pH in terms of
current density (J) during anodic polarization. The anodic wave followed a quasi-linear
relation with the applied potential; i.e., an exponential dependence given by the Butler-
Volmer formulation was relaxed due to an increase in ohmic resistance. The onset
potential for the anodic current, which is defined as the iR-corrected anodic potential (Ea
– iR) at the J of 1 A m-2,34 was observed at near 1.2 V on average without a significant
variation with composition (coefficient of variation: 5 %). The corresponding over-
potential of OER was 0.4 V, which is comparable to previously reported values for
anodes based on IrO2.7,33 The Tafel slopes, from the linear regions of log J versus Ea – iR
relationships, appeared to be near 120 mV decade-1 in the range of Ea – iR lower than
1.55 V. These values were not dependent on the surface composition as well (coefficient
of variation: 7%). Under a larger anodic bias, there were substantial increases in the Tafel
slopes most likely due to mass transport limitations. The observed Tafel slopes can be
interpreted in terms of the initial formation of hydroxyl radical (eq 5.2) as the rate-
determining step.15,17,32
In the absence of the Ir0.7Ta0.3Oy layer, the current generation was always negligible,
as shown in Figure 5.5a (Bi0.3Ti0.7Oz as an example). Even with the presumed redox
transitions of surficial Bi, the Ir0.7Ta0.3Oy layer was essential as an ohmic contact to
overcome the Schottky barrier to electron transfer (metal oxides toward base metals). The
magnitudes of J on the hetero-junction anodes were lower than on the Ir0.7Ta0.3Oy anode,
owing to the electrical resistance across the hetero-junction. In addition, the intensity of

156
Figure 5.5. (a) Current generation during linear sweep voltammetry (scan rate: 5 mV sec-1)
together with (a, inset) ohmic resistance measured by current interruption and (b) integrated
charge (Q*) during cyclic voltammetry (scan range: 0.2 ~ 1.0 V NHE, scan rate: 20 mV sec-1)
with Ir0.73Ta0.27Oy/BixTi1-xOz hetero-junction anodes with variable molar fraction (x);
electrolyte: 50 mM NaCl (pH ~ 7), cathode: stainless steel, geometric surface area: 3×2 cm2.
Data for Ir0.7Ta0.3Oy or Bi0.3Ti0.7Oz anode are shown as references.

157 the anodic wave decreased as the molar fraction of Bi increased. In light of nearly
consistent onset potentials and Tafel slopes, the effects of Bi content on current
generation can be explained in terms of the ohmic resistance measured by a current
interruption technique (inset of Figure 5.5a). The ohmic resistance consists of electrolyte
resistance to ion migration, polarization resistance coupled with resistance across the
catalytic film.35 Their combined effects can be depicted as resistors in series for a
simplified equivalent (e.g., Randles circuit).10,32,36-38 Because double layer capacitances
usually overwhelm the physical capacitances of metal oxides films by several orders of
magnitude,37 the polarization resistance would not significantly contribute to the ohmic
resistances in measurements by the current interruption method.35 Therefore, the adverse
effects of the Bi content on current response are ascribed to an increasing electrical
resistance within the anode. This observation is therefore analogous to p-n junction under
reverse bias, since the Bi2O3 has often been regarded as a p-type semiconductor.39
On the other hand, integrated charge (Q*) in a cyclic voltammogram within the
potential region between the hydrogen evolution reaction and OER has been widely used
as a parameter for electrochemically active surface area.8,10,36 Figure 5.6 shows the CV
profiles in 50 mM NaCl solutions under Ea between 0.2 and 1.0 V. The integrated
charges in anodic current (anodic Q*) was superimposable to those in cathodic current
(cathodic Q*), as depicted in Figure 5.5b. The reversible redox reactions (described either
by eq 5.2 or eq 5.4) at the active sites should account for the symmetric voltammograms.8
The ratio of Ti to Bi contents was not well correlated with the magnitude of Q*, which
was observed to be the highest for the Bi fraction of 0.1. In addition, there was little

158
Figure 5.6. Cyclic voltammogram of Ir0.7Ta0.3Oy/BixTi1-xOz hetero-junction anode with variable
molar fraction of Bi (x) referenced with Ir0.7Ta0.3Oy anode; counter electrode: stainless steel,
geometric surface area: 3×2 cm2, electrolyte: 50 mM NaCl, scan range: 0.2 – 1.0 V NHE, scan
rate: 20 mV sec-1.
relationship between the current density and Q*, which suggests that the current
generation is primarily governed by ohmic resistance rather than by the surface area.
5.3.3. Reactive Chlorine Species Generation. Figure 5.7 shows reactive chlorine
generation on Ir0.7Ta0.3Oy/BixTi1-xOz hetero-junction anodes in 50 mM NaCl solutions.
The Ea was adjusted from 2.0 to 3.0 V, which corresponded to the cell voltage from 4 to
6 V versus the counter electrode. The current generation during the course of
potentiostatic electrolysis (Figure 5.7a) was in general agreement with the polarization
curve in Figure 5.5a. In comparison with the Ir0.7Ta0.3Oy anode, the quasi-steady-state
values of J were reduced for the hetero-junction anodes by 20 to 60% as the molar

159 fraction of Bi increased, primarily due to augmented iR (vide supra). Nevertheless, the
BixTi1-xOz hetero-junction layer was found to substantially increase the current efficiency
of RCS generation as calculated using eq 5.1 (Figure 5.7c). The ηRCS was estimated to
average 53% for Ir0.7Ta0.3Oy anode, in agreement with previous reports under comparable
condition.28 This value increased to 85% via the layering of an protective overcoat of
TiO2 (x = 0). Even higher magnitudes of ηRCS were observed for the hetero-junction
anodes with Bi contents of 10 or 30%. Consequently, the rates of RCS generation (Figure
5.7b) were enhanced by a factor of 20 to 30%. The improvements in ηRCS should be
underscored because the energy efficiency, in terms of the specific RCS generation rate
normalized by power input, is directly proportional to the ηRCS (and cell voltage).
The electrochemical oxidation of chloride ion on metal oxides anodes occurs due to
reactions with either hydroxyl radical or active oxygen adsorbed on the surface, as
described by the following equations:5,13,40
>MOx(·OH) + Cl– → >MOx + 1/2Cl2 + OH– (k5 = 4.3 × 10⁹ M-1 s-1) (5.6)
>MOx+1 + Cl– → >MOx + ClO– (k6) (5.7)
Outer-sphere electron transfer from chloride ion (eq 5.6) is most likely much faster than
by direct transfer of active surficial oxygen (eq 5.7). In this regard, the ηRCS is likely to be
determined primarily by speciation between >MOx(·OH) and >MOx+1. The relative
concentration of surface reactive oxygen will depend on the rate of eq 5.4, whose electro-
stationary distribution can be described in terms of a ‘Nernstian’ equilibrium. The

160
Figure 5.7. (a) Mean current density together with (b) specific rate and (c) current efficiency of
reactive chlorine species generation during the course of potentiostatic electrolysis with
Ir0.7Ta0.3Oy/BixTi1-xOz hetero-junction anodes with variable molar fraction (x); electrolyte: 50
mM NaCl (pH ~ 7), cathode: stainless steel, geometric surface area: 3×2 cm2, applied anodic
potential: 2.0, 2.5, 3.0 V NHE. Data for Ir0.7Ta0.3Oy anode are shown as references.

161 increase in ηRCS on BixTi1-xOz hetero-junction system can be explained as the lower to
higher oxide transition via electron transfer is more thermodynamically favorable (i.e.,
lower enthalpy change) to IrO2 rather than to TiO2.
When Bi is the majority surface constituent (x = 0.5 to 1), the ηRCS decreased with
increasing anodic potential. The decrease of ηRCS could be possibly explained in
association with bulk pH. Electrolysis in dilute NaCl solutions results in an increase of
pH from non-stoichiometric water splitting.41 The increase of solution pH that is
proportional to the conversion of chloride ion to RCS favors the OER since higher pH
reduces the redox potential of water oxidation. In some cases, however, the Bi may
accelerate the higher oxide formation24 with a net result of increasing rate with increasing
anodic potential.
5.3.4. Formate Ion Degradation. Formate ion was used in this study as a prove for
surface-bound hydroxyl radical.20 Many investigators employ reactive dye compounds
such as methylene blue and RNO (p-nitrosodimethylaniline) for quantitative ·OH
estimation with relatively simple instrumentation.14,42 However, the low aqueous
solubility of these dye compounds limits the operational concentration (< 1 mM).
Furthermore, degradation of a dye compound via a direct electron transfer or active
oxygen transfer from higher oxides has been reported for IrO2-based anodes.42 The
reaction between formate ion and ·OH produces the carbon dioxide radical anions (eq 5.8
and 5.9) and the homogeneous bimolecular rate constants for this sequence are well
known.43 We assume that oxygen atom transfer from >MOx+1 to formate is very slow in

162 comparison. For example, the O-atom transfer between ozone and formate ion was
reported to be in the range of 102 M-1 s-1.43
>MOx(·OH) + HCOO– → >MOx + COO–· + H2O (k7 = 3.2 × 10⁹ M-1 s-1) (5.8)
>MOx(·OH) + COO–· → >MOx + CO2 + OH– (5.9)
[>MOx(·OH)]SS = 119
1
sM103.2
)s(
formate
obsk (5.10)
The formate ion degradation in 50 mM NaCOOH solutions (Figure 5.8) followed
pseudo-first-order reaction profile that in turn allows for a steady-state kinetic analysis.
The quasi-steady-state concentration of hydroxyl radical on each anode surface
([>MOx(·OH)]SS) was estimated according to the observed pseudo-first-order rate
constant of formate decay (kobsformate), using eq 5.10, given the homogeneous bimolecular
rate constant. The estimated concentration of >MOx(·OH) (Figure 5.9) was orders of
magnitude lower than the typical site density of >Ti-OH moieties on TiO2 particles (1 ×
10-8 mol cm-2), but in comparable order with estimations for thin film TiO2 electrodes.41
The rates of formate degradation rate under variable surface composition (Figure 5.9)
were largely in parallel with those of RCS generation; both the kobsformate and
[>MOx(·OH)]SS showed peaks at x of 0.1 or 0.3 and monotonically decreased with further
increases of the Bi content. This observation could also result from a combinational
consequences of ohmic resistance (vide supra) and branching ratio of >MOx(·OH) to
>MOx+1. However, in comparison with the hetero-junction anodes giving the highest rate

163
Figure 5.8. Time profiles of formate ion oxidation during the course of potentiostatic
electrolysis with Ir0.7Ta0.3Oy/BixTi1-xOz hetero-junction anodes with variable molar fraction (x);
electrolyte: 50 mM NaCOOH, cathode: stainless steel, geometric surface area: 3×2 cm2,
applied anodic potential: (a) 2.5 and (b) 3.0 V NHE. Data for Ir0.7Ta0.3Oy anode are shown as
references.

164
Figure 5.9. Observed pseudo-first-order rate constant of formate ion oxidation with
corresponding surface hydroxyl radical concentration during the course of potentiostatic
electrolysis with Ir0.7Ta0.3Oy/BixTi1-xOz hetero-junction anodes with variable molar fraction (x);
electrolyte: 50 mM NaCOOH, cathode: stainless steel, geometric surface area: 3×2 cm2,
applied anodic potential: 2.5 or 3.0 V NHE. Data for Ir0.7Ta0.3Oy anode are shown as references.
constants (x = 0.1 or 0.3), the anodes without Bi (Ir0.7Ta0.3Oy with or without TiO2
hetero-junction) resulted in slower reactions with HCOO- (particularly at the Ea of 2.5 V).
Recalling that the anodes without Bi showed comparable RCS generation rates with the
hetero-junction anodes with x of 0.1 or 0.3, contributions of lattice oxygen atoms to RCS
generation appear to be more significant for anodes without Bi. On the other hand, when
Bi fraction exceeds 0.1, the [>MOx(·OH)]SS at the Ea of 3.0 V was found to be even lower
than those at 2.5 V.

165 5.3.5. Stability. The accelerated life tests are the most widely used protocols to estimate
the service life of anodes for OER or ClER. In these methods, the goal is usually to
monitor the cell voltage under a harsh galvanostatic environment (J up to 1 A cm-2) such
that the dissolution or detachment of electro-active catalysts occurs more rapidly. An
accelerated life, as determined by the point when an abrupt jump of cell voltage occurs
along with complete deactivation, can be converted into an estimated service life under
practical operating conditions according to empirical proportionalities to J 1/m (m range
from 1.4 to 2.0).11 However, in the case of the hetero-junction anodes, removal of the
outer BixTi1-xOz layer would not deteriorate the voltammetric response from the
Ir0.7Ta0.3Oy layer. In this regard, the definition of accelerated life was modified to an
endpoint in which the free metal concentration in the background electrolyte would
signify complete failure of BixTi1-xOz layer. Passivation of the base metal by insulating
TiO211 was assumed to be insignificant when compared to dissolution or detachment of
the catalytic films.
Figure 5.10 shows the variations of cell voltage and cumulative metal concentrations in
the electrolyte (1 M NaClO4 solutions) during the course of galvanostatic electrolysis.
The electrolyte solution was maintained to have near circum-neutral pH. During the life
test, the cell voltage ranged from 4.0 to 5.5 V (Figure 5.10a) without a noticeable failure
for 48 h of electrolysis. The impact of an increasing ohmic resistance for higher Bi levels
was not obvious because of fluctuations in cell voltage that were associated with vigorous
bubble generation and changes in electrode area exposed to solutions. The dissociation of
the BixTi1-xOz layer is likely to be via dissolution rather than detachment since macro-

166
Figure 5.10. Variations of cell voltage (a) together with cumulative molar amounts of dissociated
Ti (b) and Bi (c) during the course of galvanostatic electrolysis with Ir0.7Ta0.3Oy/BixTi1-xOz hetero-
junction anodes with variable molar fraction (x); electrolyte: 1 M NaClO4 (pH ~ 7), cathode:
stainless steel, geometric surface area: 2×0.5 cm2, current density: 1 A cm-2. Estimated service
life under operating current density of 300 A m-2 is shown in a parallel axis with electrolysis time
(h) with proportionality to current density1/1.7.

167 particles did not exist in visual observations of the electrolyte. The cumulative amounts
of dissolved Bi (Figure 5.10c) increased faster with augmenting Bi content, which
indicates that Bi components mitigate the stability of the BixTi1-xOz layer. According to
the Pourbaix diagram of Bi,44 the vicinal acidity produced by water discharge should be
responsible for the dissolution of Bi2O3 to Bi(III) ions (Bi3+, BiOH2+, BiO+), whereas
higher oxides of Bi (Bi4O7, Bi2O4, and Bi2O5) are expected to require more acidic pH for
dissolution. Destruction of the Ti lattice appeared to accompany the dissolution of Bi, as
illustrated by the cumulative Ti concentration in Figure 5.10b. The highest amount of Ti
released into the solution was observed for an anode with an equi-molar ratio of Ti to Bi
(x = 0.5).
5.4. DISCUSSION
From an analogy with Hume-Rothery rules, Bi2O3 was not expected to constitute a
homogeneous solid solution within the TiO2 lattice, because of substantial differences in
lattice structure (tetragonal for rutile TiO219 and monoclinic for α-phase Bi2O3
23,45) and
effective radius of metal ions. In addition, the XRD intensity profiles of
Ir0.7Ta0.3Oy/BixTi1-xOz anodes showed insignificant variations with respect to the fraction
of Bi. Therefore, the microstructure of the outer layer is likely to be a mixed phase oxide
crystal with a limited miscibility.6,38 Given this assumption, the physico-chemical
characteristics of the BixTi1-xOz layer should locally conform to the properties of TiO2
and Bi2O3 individually for which the overall characteristics would depend on the molar
mixing ratio. For example, the instability of Bi under (water discharge induced) acidic
condition agrees with the phase transformation given by Pourbaix diagram of Bi2O3.44

168 The electrochemically active surface areas estimated by Q* were found to be
primarily determined by physical surface area. As shown in Figure 5.11, the Q* of the
anodes under investigation (Figure 5.5b) followed fairly well an inverse relationship with
the physical lattice dimensions estimated by the XRD peaks in Figure 5.3 and the
Scherrer equation. Regardless of the type of metal ions, the hydrous metal oxides can
serve as electrochemically active sites as long as proper electron shuttles are electrically
accessible.30 This correlation in spite of the variation in surface composition indicates
that the Ir0.7Ta0.3Oy layer is the acting electron carrier in this potential window (0.2 to 1.0
V).8,10 The half potentials of the symmetric voltamograms in Figure 5.6 were close to the
redox potential of the Ir2O3/IrO2 couple (E = 0.51 V, at pH 7). On a thermodynamic basis,
the redox transitions of Ti2O3/TiO2 (E = -0.47 V at pH 7) or Bi/Bi2O3 (E = -0.04 V at pH
7) are infeasible to drive the oxidation of surface hydroxyl group.
Figure 5.11. Relationship between Q* as a parameter of electrochemically active surface area
and crystalline dimension estimated from XRD intensity by Scherer equation.

169 Moderate increases of ηRCS and kobs
formate with an increasing Bi fraction up to 0.3
should be primarily associated with the surface charge depending on the amphoteric
properties of the metal oxides. The point of zero charge (pHpzc) of Bi2O3 (9.4) is reported
to be much greater than TiO2 (5.1 – 6.4) or IrO2 (3.3).46 Thus, the surface of BixTi1-xOz
layers should be more positively charged at higher Bi fraction, x. This change enhances
the accumulation of anions (Cl- and HCOO-) in the electrical double layer. The
magnitude of ClO4- adsorption in Figure 5.4c is consistent with this interpretation, given
the monotonic increase in the characteristic IR peak area of ClO4- (at 1110 cm-1) with the
increase of x. In addition, Bi-doping increases the intensities of the Ti-OH bond under the
molar fraction of Bi lower than 10%.47,48 Alves et al.9 also noted that substitution of TiO2
with CeO2 (pHpzc ~ 8.1) increases the surface OH group concentration as measured by X-
ray photoelectron spectroscopy. Stronger speciation of the -OH functionality towards
protonated moieties, with corresponding IR signals either of >Ti-OH (3000 to 3600 cm-1)
or >Bi-OH (centered at 1400 cm-1), would be beneficial to the hydroxyl radical formation.
The electro-stationary [>MOx(·OH)] was estimated to be the highest for x of 0.1 or 0.3
(Figure 5.9), even though [>MOx(·OH)]SS should implicitly include the partitioning
constants of formate ion in our simple kinetic analysis.
Under a potential bias within the domain of water splitting, the >MOx(·OH) site
should be quenched by a redox transformation of transition metal (Ir or Bi) to produce
>MOx+1. Given several simplifying assumptions for the kinetics of formate degradation,
the rate constants for eq 5.4 (k3) could be estimated by rearrangement of the governing
equation for [>MOx+1] under pseudo-steady-state conditions.

170
k3 = SS
O
SS AF
Ik
]OH)(MO[
1
2]OH)(MO[
]MO[
xx
1x4 2
(5.11)
where, ηO2 is the current efficiency of OER and A is the geometric surface area of the
electrode. The ηO2 can be calculated from the charge balance equations. We also assume
that >MOx(·OH) and >MOx+1 are exclusively responsible to HCOO- oxidation and OER,
respectively; i.e., eq 5.3 is relatively slow and productions of homogeneous reactive
oxygen species (e.g., H2O2, O3, O2·-) are negligible.
Figure 5.12 illustrates k3 for Ir0.7Ta0.3Oy/BixTi1-xOz anodes which mostly increases
together with the surficial Bi concentration. This finding suggests an oxidation of Bi(III)
to Bi(IV) or Bi(V) can be an active electron sink for insertion of oxygen into the lattice.
The behavior of Bi2O3 is analogous to that of electroactive IrO2, since Zhang et al.33
reported that an increasing Ir fraction in IrxSi1-xOy anodes nonlinearly promotes the rate
constant of higher oxide formation. The redox potential at pH 7 is 0.92 V for Bi4O7/Bi2O3
and 1.13 V for Bi2O4/Bi4O7 couple. The Bi(V) would reduce the kinetic barrier to oxide
transition more effectively, as supported by the considerable increase of k3 with Ea (2.5 V
versus 3.0 V). On the contrary, in the absence of surficial Bi, the influence of Ea on k3
value was not distinct, raising a possibility that dismutations of bound hydroxyl radical
(2>MOx(·OH) → >MOx + >MOx+1 + H2O)8,17,49 might account for the higher oxides
formation with Ir(IV)/Ir(VI) transition. The highest k3 value was observed mostly for the
Ir0.7Ta0.3Oy layer, as expected by the redox potential of IrO3/IrO2 couple (0.94 V at pH 7)
falling below that of Bi2O4/Bi4O7 couple. The kinetics of >MOx/>MOx+1 transition would

171
Figure 5.12. Estimated rate constant for transition from surface bound hydroxyl radical to higher
oxide in 50 mM NaCOOH solutions.
also be influenced by concentrations of oxide ion vacancy in the lattice structure.14 The
magnitudes of k3 estimated in this study (0.5 - 3.5 × 10⁸ sec-1) were in a similar order
with k5[Cl-] (2.2 × 10⁸ sec-1) or k7[HCOO-] (1.6 × 10⁸ sec-1). The relative reaction rate of
[>MOx(·OH)] to form >MOx+1 in comparison with oxidizing electron donating substrates
(Cl- or HCOO-) would be the primary determinant of the current efficiency, which was
found to be affected by the surface compositions and Ea. The higher oxide formation
driven by electro-active Bi would rationalize the behaviors of anodes with high Bi
contents (x > 0.5); the decrease of ηRCS and kobsformate along with x and Ea.
The dissociation of BixTi1-xOz layers would provoke a direct contact of the
Ir0.7Ta0.3Oy layer with the electrolyte and losses of Ir component, albeit the Ir
concentrations in the electrolyte were always near the detection limit. Visual observation

172 of blackish deposits as well as EDS analysis confirmed precipitation of Ir, presumably in
the form of Ir(OH)x, on cathodes. Compared with the estimated total metal loading (ca.
25 μmol), the hetero-junction anodes with Bi fractions higher than 0.5 approached
complete dissociation after 21 h of electrolysis. The corresponding service life was
estimated to be ca. 1 year assuming operational current density and the factor of m to be
300 A m-2 and 1.7, respectively. For the other anodes with lower Bi concentrations (x =
0.1 and 0.3), the cumulative metal concentrations in the electrolyte did not reached their
expected plateaus, indicating service lifes higher than 2 years. More importantly, the Ti
concentration in electrolyte was negligible for Ir0.7Ta0.3Oy/TiO2 anode throughout the
experiments, demonstrating an outstanding stability in anodic environment. Even after
the failure of the outer layer of the hetero-junction anodes, they can be regenerated with
minimal cost by subsequent coating with oxide of earth-abundant and environmentally
benign19,45 Ti and Bi.
In conclusion, we demonstrated that surface modification of an Ir0.7Ta0.3Oy anode
with an over layer of BixTi1-xOz leads to an enhancement in current efficiency for reactive
chlorine generation during the electrochemical oxidation of chloride ion. In particular,
lower mole fractions of Bi in the surface layer (x = 0 – 0.3) yield higher current
efficiency. Long-term operation can be achieved without the loss of Ir since the overlying
BixTi1-xOz layer prevents the Ir0.7Ta0.3Oy from direct contact with electrolyte, even though
bismuth oxide is vulnerable to dissolution under anodic environment. Results of this
study could lead to improvements in commercial electrochemical chlorine production or
to advanced treatment of high-salinity wastewater treatment with a reduced energy input.

173 5.5. REFERENCES
(1) Menzel, N.; Ortel, E.; Mette, K.; Kraehnert, R.; Strasser, P. Dimensionally stable
Ru/Ir/TiO2-anodes with tailored mesoporosity for efficient electrochemical chlorine
evolution. Acs Catalysis 2013, 3 (6), 1324-1333.
(2) Hu, W.; Wang, Y. Q.; Hu, X. H.; Zhou, Y. Q.; Chen, S. L. Three-dimensional ordered
macroporous IrO2 as electrocatalyst for oxygen evolution reaction in acidic medium.
Journal of Materials Chemistry 2012, 22 (13), 6010-6016.
(3) Mamaca, N.; Mayousse, E.; Arrii-Clacens, S.; Napporn, T. W.; Servat, K.; Guillet, N.;
Kokoh, K. B. Electrochemical activity of ruthenium and iridium based catalysts for
oxygen evolution reaction. Applied Catalysis B-Environmental 2012, 111, 376-380.
(4) Panizza, M.; Cerisola, G. Direct and mediated anodic oxidation of organic pollutants.
Chemical Reviews 2009, 109 (12), 6541-6569.
(5) Martinez-Huitle, C. A.; Ferro, S. Electrochemical oxidation of organic pollutants for the
wastewater treatment: direct and indirect processes. Chemical Society Reviews 2006,
35 (12), 1324-1340.
(6) Comninellis, C.; Vercesi, G. P. Characterization of DSA-type oxygen evolving
electrodes - Choice of a coating. Journal of Applied Electrochemistry 1991, 21 (4),
335-345.
(7) Lee, Y.; Suntivich, J.; May, K. J.; Perry, E. E.; Shao-Horn, Y. Synthesis and activities
of rutile IrO2 and RuO2 nanoparticles for oxygen evolution in acid and alkaline
solutions. Journal of Physical Chemistry Letters 2012, 3 (3), 399-404.
(8) Alves, V. A.; Dasilva, L. A.; Boodts, J. F. C.; Trasatti, S. Kinetics and mechanism of
oxygen evolution on IrO2-based electrodes containing Ti and Ce acidic solutions.
Electrochimica Acta 1994, 39 (11-12), 1585-1589.
(9) Alves, V. A.; da Silva, L. A.; de Castro, S. C.; Boodts, J. F. C. Surface characterization
by UHV techniques and cyclic voltammetry of thermal IrO2-based electrocatalysts
containing TiO2 and CeO2. Journal of the Chemical Society-Faraday Transactions
1998, 94 (5), 711-717.

174 (10) daSilva, L. A.; Alves, V. A.; daSilva, M. A. P.; Trasatti, S.; Boodts, J. F. C. Oxygen
evolution in acid solution on IrO2+TiO2 ceramic films. A study by impedance,
voltammetry and SEM. Electrochimica Acta 1997, 42 (2), 271-281.
(11) Chen, X. M.; Chen, G. H.; Yue, P. L. Stable Ti/IrOx-Sb2O5-SnO2 anode for O2
evolution with low Ir content. Journal of Physical Chemistry B 2001, 105 (20), 4623-
4628.
(12) Chen, S. Y.; Zheng, Y. H.; Wang, S. W.; Chen, X. M. Ti/RuO2-Sb2O5-SnO2 electrodes
for chlorine evolution from seawater. Chemical Engineering Journal 2011, 172 (1),
47-51.
(13) Hansen, H. A.; Man, I. C.; Studt, F.; Abild-Pedersen, F.; Bligaard, T.; Rossmeisl, J.
Electrochemical chlorine evolution at rutile oxide (110) surfaces. Physical Chemistry
Chemical Physics 2010, 12 (1), 283-290.
(14) Comninellis, C. Electrocatalysis in the Electrochemical conversion/combustion of
organic pollutants for waste-water treatment. Electrochimica Acta 1994, 39 (11-12),
1857-1862.
(15) Trasatti, S. Electrocatalysis in the anodic evolution of oxygen and chlorine.
Electrochimica Acta 1984, 29 (11), 1503-1512.
(16) Rossmeisl, J.; Qu, Z. W.; Zhu, H.; Kroes, G. J.; Norskov, J. K. Electrolysis of water on
oxide surfaces. Journal of Electroanalytical Chemistry 2007, 607 (1-2), 83-89.
(17) Santana, M. H. P.; De Faria, L. A. Oxygen and chlorine evolution on
RuO2+TiO2+CeO2+Nb2O5 mixed oxide electrodes. Electrochimica Acta 2006, 51 (17),
3578-3585.
(18) Kronawitter, C. X.; Vayssieres, L.; Shen, S. H.; Guo, L. J.; Wheeler, D. A.; Zhang, J.
Z.; Antoun, B. R.; Mao, S. S. A perspective on solar-driven water splitting with all-
oxide hetero-nanostructures. Energy & Environmental Science 2011, 4 (10), 3889-
3899.
(19) Hoffmann, M. R.; Martin, S. T.; Choi, W. Y.; Bahnemann, D. W. Environmental
applications of semiconductor photocatalysis. Chemical Reviews 1995, 95 (1), 69-96.
(20) Kesselman, J. M.; Weres, O.; Lewis, N. S.; Hoffmann, M. R. Electrochemical
production of hydroxyl radical at polycrystalline Nb-doped TiO2 electrodes and

175 estimation of the partitioning between hydroxyl radical and direct hole oxidation
pathways. Journal of Physical Chemistry B 1997, 101 (14), 2637-2643.
(21) Gujar, T. P.; Shinde, V. R.; Lokhande, C. D.; Han, S. H. Electrosynthesis of Bi2O3 thin
films and their use in electrochemical supercapacitors. Journal of Power Sources 2006,
161 (2), 1479-1485.
(22) Yuan, D.; Zeng, J.; Kristian, N.; Wang, Y.; Wang, X. Bi2O3 deposited on highly
ordered mesoporous carbon for supercapacitors. Electrochemistry Communications
2009, 11 (2), 313-317.
(23) Shuk, P.; Wiemhofer, H. D.; Guth, U.; Gopel, W.; Greenblatt, M. Oxide ion
conducting solid electrolytes based on Bi2O3. Solid State Ionics 1996, 89 (3-4), 179-
196.
(24) Tahar, N. B.; Savall, A. Electrochemical degradation of phenol in aqueous solution on
bismuth doped lead dioxide: a comparison of the activities of various electrode
formulations. Journal of Applied Electrochemistry 1999, 29 (3), 277-283.
(25) Tomita, K.; Petrykin, V.; Kobayashi, M.; Shiro, M.; Yoshimura, M.; Kakihana, M. A
water-soluble titanium complex for the selective synthesis of nanocrystalline brookite,
rutile, and anatase by a hydrothermal method. Angewandte Chemie-International
Edition 2006, 45 (15), 2378-2381.
(26) Gao, Y. F.; Masuda, Y.; Peng, Z. F.; Yonezawa, T.; Koumoto, K. Room temperature
deposition of a TiO2 thin film from aqueous peroxotitanate solution. Journal of
Materials Chemistry 2003, 13 (3), 608-613.
(27) Van de Velde, N.; Arin, M.; Lommens, P.; Poelman, D.; Van Driessche, I.
Characterization of the aqueous peroxomethod for the synthesis of transparent TiO2
thin films. Thin Solid Films 2011, 519 (11), 3475-3479.
(28) Kraft, A.; Stadelmann, M.; Blaschke, M.; Kreysig, D.; Sandt, B.; Schroder, F.; Rennau,
J. Electrochemical water disinfection - Part I: Hypochlorite production from very
dilute chloride solutions. Journal of Applied Electrochemistry 1999, 29 (7), 861-868.
(29) Hanaor, D. A. H.; Sorrell, C. C. Review of the anatase to rutile phase transformation.
Journal of Materials Science 2011, 46 (4), 855-874.

176 (30) Ardizzone, S.; Bianchi, C. L.; Cappelletti, G.; Ionita, M.; Minguzzi, A.; Rondinini, S.;
Vertova, A. Composite ternary SnO2-IrO2-Ta2O5 oxide electrocatalysts. Journal of
Electroanalytical Chemistry 2006, 589 (1), 160-166.
(31) Connor, P. A.; Dobson, K. D.; McQuillan, A. J. Infrared spectroscopy of the
TiO2/aqueous solution interface. Langmuir 1999, 15 (7), 2402-2408.
(32) Hu, J. M.; Zhang, J. Q.; Cao, C. N. Oxygen evolution reaction on IrO2-based DSA(R)
type electrodes: kinetics analysis of Tafel lines and EIS. International Journal of
Hydrogen Energy 2004, 29 (8), 791-797.
(33) Zhang, J. J.; Hu, J. M.; Zhang, J. Q.; Cao, C. N. IrO2-SiO2 binary oxide films:
Geometric or kinetic interpretation of the improved electrocatalytic activity for the
oxygen evolution reaction. International Journal of Hydrogen Energy 2011, 36 (9),
5218-5226.
(34) Kotz, R.; Stucki, S. Stabilization of RuO2 by IrO2 for anodic oxygen evolution in acid-
media. Electrochimica Acta 1986, 31 (10), 1311-1316.
(35) Cooper, K. R.; Smith, M. Electrical test methods for on-line fuel cell ohmic resistance
measurement. Journal of Power Sources 2006, 160 (2), 1088-1095.
(36) Hou, Y. Y.; Hu, J. M.; Liu, L.; Zhang, J. Q.; Cao, C. N. Effect of calcination
temperature on electrocatalytic activities of Ti/IrO2 electrodes in methanol aqueous
solutions. Electrochimica Acta 2006, 51 (28), 6258-6267.
(37) Zhou, X. L.; Ye, Z. G.; Hua, X. Z.; Zou, A. H.; Dong, Y. H. Electrocatalytic activity
and stability of Ti/IrO2 + MnO2 anode in 0.5 M NaCl solution. Journal of Solid State
Electrochemistry 2010, 14 (7), 1213-1219.
(38) Xu, J. Y.; Liu, G. Y.; Li, J. L.; Wang, X. D. The electrocatalytic properties of an
IrO2/SnO2 catalyst using SnO2 as a support and an assisting reagent for the oxygen
evolution reaction. Electrochimica Acta 2012, 59, 105-112.
(39) Hameed, A.; Montini, T.; Gombac, V.; Fornasiero, P. Surface phases and
photocatalytic activity correlation of Bi2O3/Bi2O4-x nanocomposite. Journal of the
American Chemical Society 2008, 130 (30), 9658-+.
(40) Trasatti, S. Progress in the understanding of the mechanism of chlorine evolution at
oxide electrodes. Electrochimica Acta 1987, 32 (3), 369-382.

177 (41) Park, H.; Vecitis, C. D.; Hoffmann, M. R. Electrochemical water splitting coupled
with organic compound oxidation: The role of active chlorine species. Journal of
Physical Chemistry C 2009, 113 (18), 7935-7945.
(42) Muff, J.; Bennedsen, L. R.; Sogaard, E. G. Study of electrochemical bleaching of p-
nitrosodimethylaniline and its role as hydroxyl radical probe compound. Journal of
Applied Electrochemistry 2011, 41 (5), 599-607.
(43) Neta, P.; Huie, R. E.; Ross, A. B. Rate constants for reactions of inorganic radicals in
aqueous-solution. Journal of Physical and Chemical Reference Data 1988, 17 (3),
1027-1284.
(44) Pourbaix, M., Atlas of electrochemical equilibria in aqueous solutions. 2nd English
ed.; National Association of Corrosion Engineers: Houston, Tex., 1974.
(45) Sarma, B.; Jurovitzki, A. L.; Smith, Y. R.; Mohanty, S. K.; Misra, M. Redox-induced
enhancement in interfacial capacitance of the titania nanotube/bismuth oxide
composite electrode. ACS Applied Materials & Interfaces 2013, 5 (5), 1688-1697.
(46) Kosmulski, M. Compilation of PZC and IEP of sparingly soluble metal oxides and
hydroxides from literature. Advances in Colloid and Interface Science 2009, 152 (1-2),
14-25.
(47) Shamaila, S.; Sajjad, A. K. L.; Chen, F.; Zhang, J. L. Study on highly visible light
active Bi2O3 loaded ordered mesoporous titania. Applied Catalysis B-Environmental
2010, 94 (3-4), 272-280.
(48) Bagwasi, S.; Niu, Y. X.; Nasir, M.; Tian, B. Z.; Zhang, J. L. The study of visible light
active bismuth modified nitrogen doped titanium dioxide photocatlysts: Role of
bismuth. Applied Surface Science 2013, 264, 139-147.
(49) Da Silva, L. M.; Boodts, J. F. C.; De Faria, L. A. Oxygen evolution at RuO2(x) plus
Co3O4(1-x) electrodes from acid solution. Electrochimica Acta 2001, 46 (9), 1369-
1375.

178 C h a p t e r 6
OUTLOOK FOR THE FUTURE

179 6.1. REACTION NETWORK IN WASTEWATER ELECTROLYSIS CELL
The wastewater electrolysis cell (WEC) for treatment of urea (Chapter 21), domestic
wastewater (Chapter 32), and model toilet wastewater (Chapter 43) showed evidence for the
reaction pathway proposed in Figure 6.1. The higher oxide active sites on BiOx/TiO2 anode
oxidize the Cl- to RCS, which should be transported to bulk phase to oxidize organics to
eventually CO2. The ammonium ions (or other organic N-rich organics such as urea) are
oxidized either to N2 via breakpoint chlorination pathway or to nitrate ions by further
oxidation of chloramines. The results in Chapter 2 and 3 demonstrated potential liberation
of chlorine radicals (Cl·/Cl2-·) based on iR-compensated anodic potential (thermodynamic
basis) and enhanced pseudo-first-order rate constants (kinetic basis).1,2 Even under the
generation of chlorine radicals in bulk phase, the contribution of free chlorine could not be
Figure 6.1. Reaction network in wastewater electrolysis cell.

180 ruled out, due to the facile disproportionation of chlorine radical to free chlorine. The
speciation of electrochemically generated RCS was found to be primarily determined by
the applied anodic potential and the chloride ion concentration, although a quantitative
fractionation was beyond the scope of this study.
On the stainless steel cathodes, water and proton accept electrons to produce
molecular hydrogen, while main scavenging reactions include reduction of RCS to chloride
ion and molecular oxygen to superoxide radical. In particular, the reduction of RCS results
in a null electrochemical cycle reducing the current efficiency both for the desired anodic
(pollutants removal) and cathodic (molecular hydrogen generation) reactions.
A presumed facile transition of surface bound hydroxyl radical to higher oxide
alleviated the contributions of direct oxidation on the multi-junction BiOx/TiO2 electrodes,
prepared as in Table 1.1.1-3 However, the electro-stationary surface concentration of
hydroxyl radicals was greatly enhanced in the bilayer hetero-junction anode developed in
this study (Chapter 5). Therefore, direct oxidation can be operative on the
Ir0.7Ta0.3Oy/BixTi1-xOz anodes, as demonstrated by efficient degradations of the formate ion
in 50 mM NaCOOH solutions (without chloride ion). With the presence of chloride ion,
however, the overall reaction network would be still dominated by mediations of RCS, as
in Figure 6.1. Since the molar concentrations of organics in domestic wastewater or human
wastes would be much smaller than those of chloride ions, the direct oxidation of organics
would be limited by mass transport. Nevertheless, significance enhancements in kinetic
constants and current (energy) efficiency are expected when employing the
Ir0.7Ta0.3Oy/BixTi1-xOz anodes in the wastewater electrolysis cell.
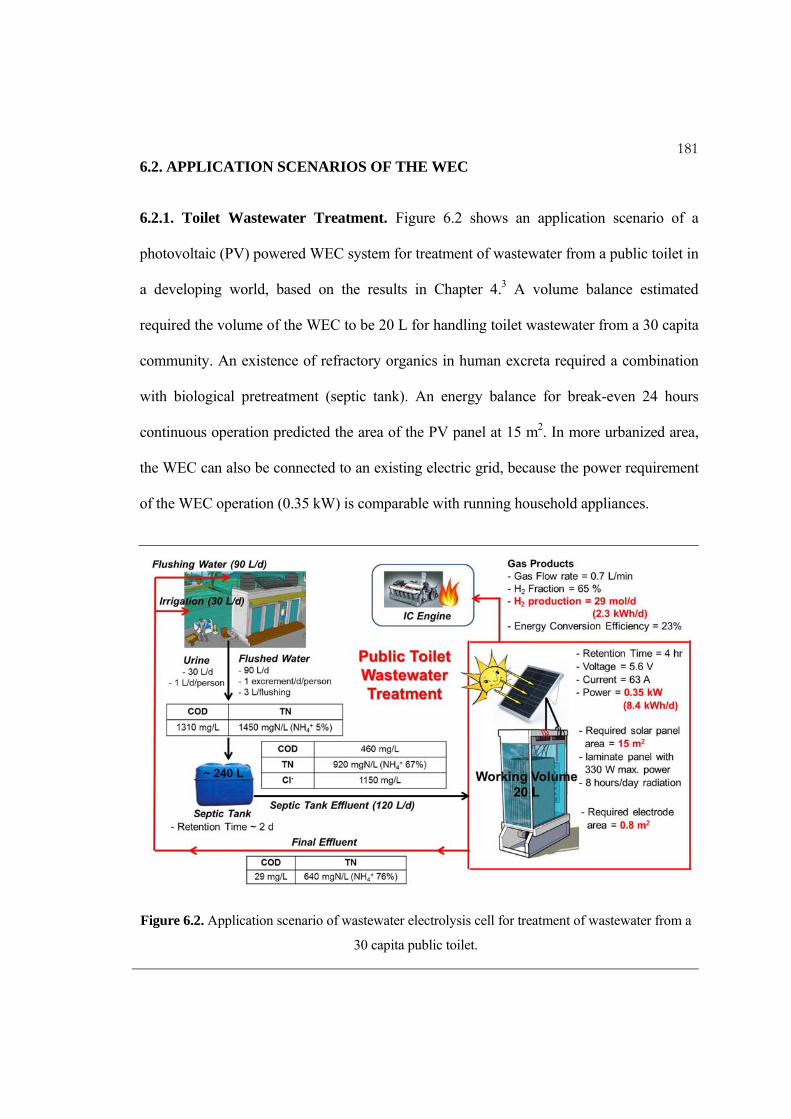
181 6.2. APPLICATION SCENARIOS OF THE WEC
6.2.1. Toilet Wastewater Treatment. Figure 6.2 shows an application scenario of a
photovoltaic (PV) powered WEC system for treatment of wastewater from a public toilet in
a developing world, based on the results in Chapter 4.3 A volume balance estimated
required the volume of the WEC to be 20 L for handling toilet wastewater from a 30 capita
community. An existence of refractory organics in human excreta required a combination
with biological pretreatment (septic tank). An energy balance for break-even 24 hours
continuous operation predicted the area of the PV panel at 15 m2. In more urbanized area,
the WEC can also be connected to an existing electric grid, because the power requirement
of the WEC operation (0.35 kW) is comparable with running household appliances.
Figure 6.2. Application scenario of wastewater electrolysis cell for treatment of wastewater from a
30 capita public toilet.

182 US EPA4 suggests reclaimed water quality for environmental reuse to satisfy BOD <
30 mg L-1, total suspended solids (TSS) < 30 mg L-1, coliform concentration < 200 CFU
100 mL-1, and residual chlorine > 1 mg L-1. The laboratory and scaled-up experiments
(with hydraulic retention time less than 6 h) in Chapter 3 and 4 fully demonstrated the
feasibility of effluent reuse for toilet flushing, irrigation, and stream flow recharge.2,3 The
mixed state molecular hydrogen produced with moderate levels of energy conversion
efficiency can be utilized by running a H2 internal combustion engine.
Consequently, beneficial contributions of the WEC are expected in terms of increased
sanitation level, energy saving for wastewater delivery and treatment, alternative water
resource by reusing effluents, and fuel production from water-splitting in select cases.
When fully assembled a sufficient number of PV panels, a scaled-up PV-powered WEC
should be easy to transport to various environments, including urbanized areas, peri-urban
environments, and remote locations in the developing world that lack viable sanitation
facilities.
6.2.2. Treatment of Other High Salinity Wastewater. The strong oxidation potentials of
surface bound hydroxyl radicals and RCS make one envisage that analogous WEC setups
can be used for treatment of various kinds of industrial wastewater and secondary waste
from environment remediation facilities. Depending on the type of the wastewater, the
WEC can be flexibly combined with other physical unit processes to boost the efficacy for
remediation and energy storage.
One of the scenarios for industrial wastewater treatment is related with recent progress
in Shale gas production. The current method of hydraulic fracturing results in a large

183 volume of wastewater (flowback water) which carries considerable amounts of
suspended/dissolved solids, chloride ion, bromide ion, metals (Ca, Ba, and Sr), and
oil/grease.5,6 The brine wastewater has been usually treated by a municipal wastewater
treatment plant, often causing a deterioration of effluent water quality due to the excessive
pollutant loads. The high salinity of the flowback water should let the WEC suitable to an
alternative treatment unit process, though the high solids concentration would require a
pretreatment for solids/liquid separation. To this end, an electrochemical pretreatment unit
with sacrificial anodes (Fe or Al metal) can provide an efficient solids/liquid separation by
coagulation and flotation.7 In this approach, the dissolving electrodes produce a range of
coagulant species. The precipitates from charge neutralization and flocculation can be
collected by sedimentation for a given duration or via collision with H2 bubbles generated
on the cathodes surface. Electrolysis is also a well-known technique for generating very
fine gas bubbles at sizes smaller than 50 μm. It can be expected that the fine bubbles collide
with and attach to the particles and float to the top of the reactor.8 Therefore, so-called
electroflotation merged with electrocoagulation (electro-coagulation-flotation, ECF) has
been investigated for use in treatment of industrial wastewater.7
In addition, the WEC makes a perfect fit to treat the brine concentrate from reverse
osmosis facilities for desalination or polishing effluents from wastewater or drinking water
treatment plants.9 The brine water generated in reverse osmosis of wastewater effluent
contains biorefractory organics, chloride ion, and nitrate ion (as a byproduct of biological
nitrification process). Although a reductive removal of nitrate was not investigated in this
study, bimetallic cathodes (e.g., Cu/Zn10) have been reported to show a strong activity for
the reduction of nitrate ion to ammonium ion, which can be degraded to N2, as thoroughly

184 discussed in Chapter 2.1 The effluent from the WEC for treatment of the concentrates can
be recycled back to the reverse osmosis unit, if potential chlorinated byproducts from the
WEC are of significant concern. Based on the compatibility of the WEC with the reverse
osmosis (or other filtration unit process such as nano-filtration), one can further imagine a
compact and advanced wastewater treatment processes, which consists of an aerated
bioreactor (converting organics to CO2 and NH4+ to NO3
-), a reverse osmosis for producing
purified water, and the WEC to reduce the pollutant loadings of concentrated brine
(converting biorefractory organics to CO2 and NO3- to N2).
The greater selectivity to N2 in the electrochemical transformation of urea, as shown
in Chapter 2,1 allows for broader application of the WEC for remediation of N-rich
wastewater (wastewater from livestock and fish-farm industry, landfill leachate, and
anaerobic sludge digester effluents). The WEC is flexible enough to adjust the final
products depending on the purposes; i.e., an adjustment of current density or external
reactive chlorine generation in a multi-component reactor can increase the yield of nitrate
ion for fertilizer production.

185 6.3. REFERENCES (1) Cho, K.; Hoffmann, M. R. Urea degradation by electrochemically generated reactive
chlorine species: Products and reaction pathways. Environmental Science &
Technology 2014, In Revision.
(2) Cho, K.; Qu, Y.; Kwon, D.; Zhang, H.; Cid, C. A.; Aryanfar, A.; Hoffmann, M. R.
Effects of Anodic Potential and Chloride Ion on Overall Reactivity in Electrochemical
Reactors Designed for Solar-Powered Wastewater Treatment. Environmental Science
& Technology 2014, 48 (4), 2377-2384.
(3) Cho, K.; Kwon, D.; Hoffmann, M. R. Electrochemical treatment of human waste
coupled with molecular hydrogen production. RSC Advances 2014, 4 (9), 4596-4608.
(4) Guidelines for water reuse; EPA/600/R-12/618; United States Environmental
Protection Agency: Washington, D.C., 2012.
(5) Warner, N. R.; Christie, C. A.; Jackson, R. B.; Vengosh, A. Impacts of Shale Gas
Wastewater Disposal on Water Quality in Western Pennsylvania. Environmental
Science & Technology 2013, 47 (20), 11849-11857.
(6) Gregory, K. B.; Vidic, R. D.; Dzombak, D. A. Water Management Challenges
Associated with the Production of Shale Gas by Hydraulic Fracturing. Elements 2011,
7 (3), 181-186.
(7) Jiang, J. Q.; Graham, N.; Andre, C.; Kelsall, G. H.; Brandon, N. Laboratory study of
electro-coagulation-flotation for water treatment. Water Research 2002, 36 (16),
4064-4078.
(8) Cho, K.; Chung, C. M.; Kim, Y. J.; Hoffmann, M. R.; Chung, T. H. Electroflotation
clarifier to enhance nitrogen removal in a two-stage alternating aeration bioreactor.
Environmental Technology 2013, 34 (19), 2769-2776.
(9) Bagastyo, A. Y.; Batstone, D. J.; Rabaey, K.; Radjenovic, J. Electrochemical oxidation
of electrodialysed reverse osmosis concentrate on Ti/Pt-IrO2, Ti/SnO2-Sb and boron-
doped diamond electrodes. Water Research 2013, 47 (1), 242-250.
(10) Li, M.; Feng, C. P.; Zhang, Z. Y.; Shen, Z. L.; Sugiura, N. Electrochemical reduction
of nitrate using various anodes and a Cu/Zn cathode. Electrochemistry
Communications 2009, 11 (10), 1853-1856.


