Waste-to-Energy in Austria
41
© UV&P 2011 999_2011_ISWA_Novi-Sad_PRINT_2011-11-30 Novi Sad WASTE-TO-ENERGY in Austria, November, 2011 A‐1020 Vienna, Lassallestrasse 42 / 14, Austria Tel. ++ 43‐1‐2149520‐16, Fax ++ 43‐1‐2149520‐20 [email protected]; http://www.uvp.at Franz P. Neubacher M.Sc. Chemical Engineering (T.U. Graz, Austria) M.Sc. Technology & Policy (M.I.T., USA) Waste-to-Energy in Austria
Transcript of Waste-to-Energy in Austria

© UV&P 2011999_2011_ISWA_Novi-Sad_PRINT_2011-11-30
Novi Sad WASTE-TO-ENERGY in Austria,November, 2011
A‐1020 Vienna, Lassallestrasse 42 / 14, AustriaTel. ++ 43‐1‐2149520‐16, Fax ++ 43‐1‐2149520‐[email protected]; http://www.uvp.at
Franz P. NeubacherM.Sc. Chemical Engineering (T.U. Graz, Austria)
M.Sc. Technology & Policy (M.I.T., USA)
Waste-to-Energyin Austria

2 © UV&P 2011999_2011_ISWA_Novi-Sad_PRINT_2011-11-30
Novi Sad WASTE-TO-ENERGY in Austria,November, 2011
Table of Content
1. Introduction to development of waste management in Austria
2. Municipal waste-to-energy plants for combined heat & powerproduction: Examples: Vienna, Linz
3. Integrated waste-to-energy in industrial production processes -Examples: Cement Industry, Lenzing, MMK
4. Lessons to be learned from (expensive) “mistakes” made:• Concept design• Selection of site, • Information and public relations• Economics of Scale• “Miraculous” technologies with overall failures
5. Conclusions and recommendations for know-how transfer and transboundary cooperation
3 © UV&P 2011999_2011_ISWA_Novi-Sad_PRINT_2011-11-30
Novi Sad WASTE-TO-ENERGY in Austria,November, 2011
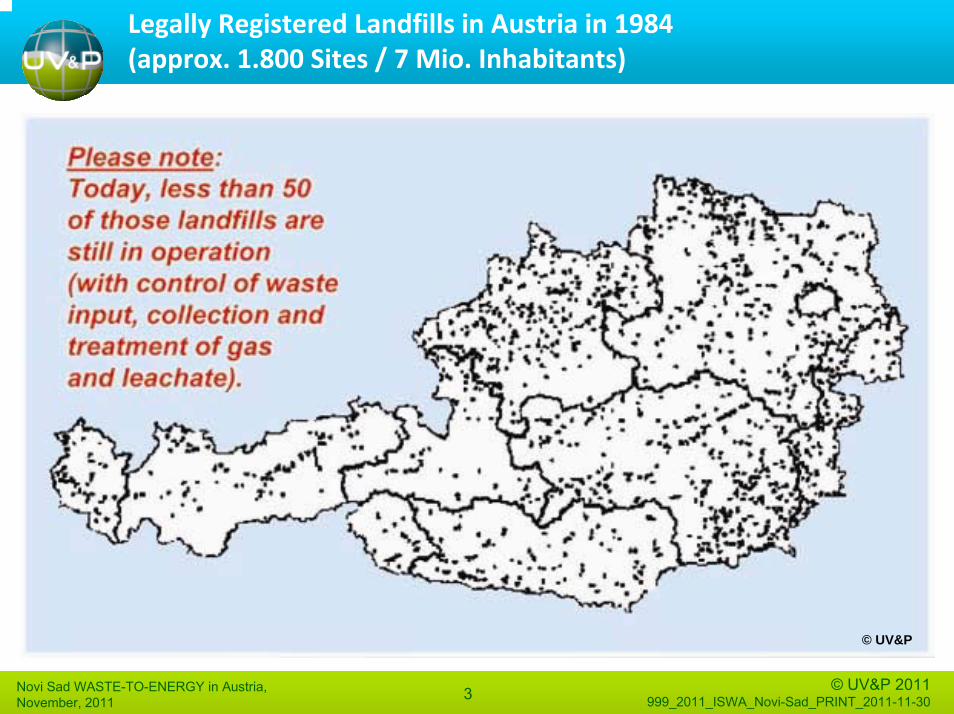
Legally Registered Landfills in Austria in 1984(approx. 1.800 Sites / 7 Mio. Inhabitants)
© UV&P
4 © UV&P 2011999_2011_ISWA_Novi-Sad_PRINT_2011-11-30
Novi Sad WASTE-TO-ENERGY in Austria,November, 2011
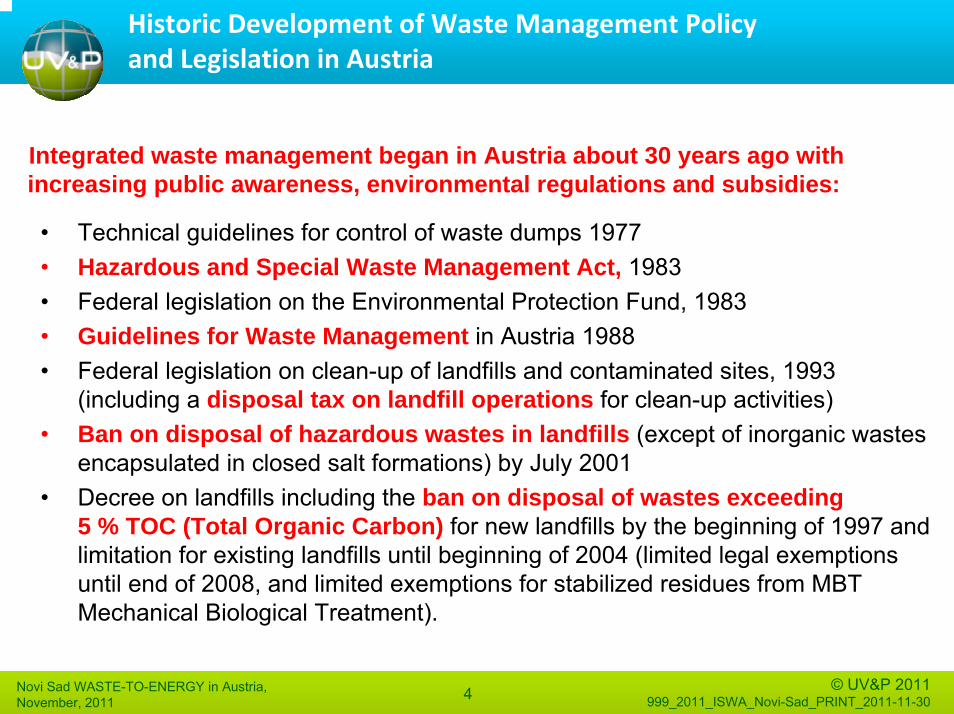
Historic Development of Waste Management Policy and Legislation in Austria
Integrated waste management began in Austria about 30 years ago withincreasing public awareness, environmental regulations and subsidies:
• Technical guidelines for control of waste dumps 1977• Hazardous and Special Waste Management Act, 1983• Federal legislation on the Environmental Protection Fund, 1983• Guidelines for Waste Management in Austria 1988• Federal legislation on clean-up of landfills and contaminated sites, 1993
(including a disposal tax on landfill operations for clean-up activities) • Ban on disposal of hazardous wastes in landfills (except of inorganic wastes
encapsulated in closed salt formations) by July 2001• Decree on landfills including the ban on disposal of wastes exceeding
5 % TOC (Total Organic Carbon) for new landfills by the beginning of 1997 and limitation for existing landfills until beginning of 2004 (limited legal exemptions until end of 2008, and limited exemptions for stabilized residues from MBT Mechanical Biological Treatment).
5 © UV&P 2011999_2011_ISWA_Novi-Sad_PRINT_2011-11-30
Novi Sad WASTE-TO-ENERGY in Austria,November, 2011
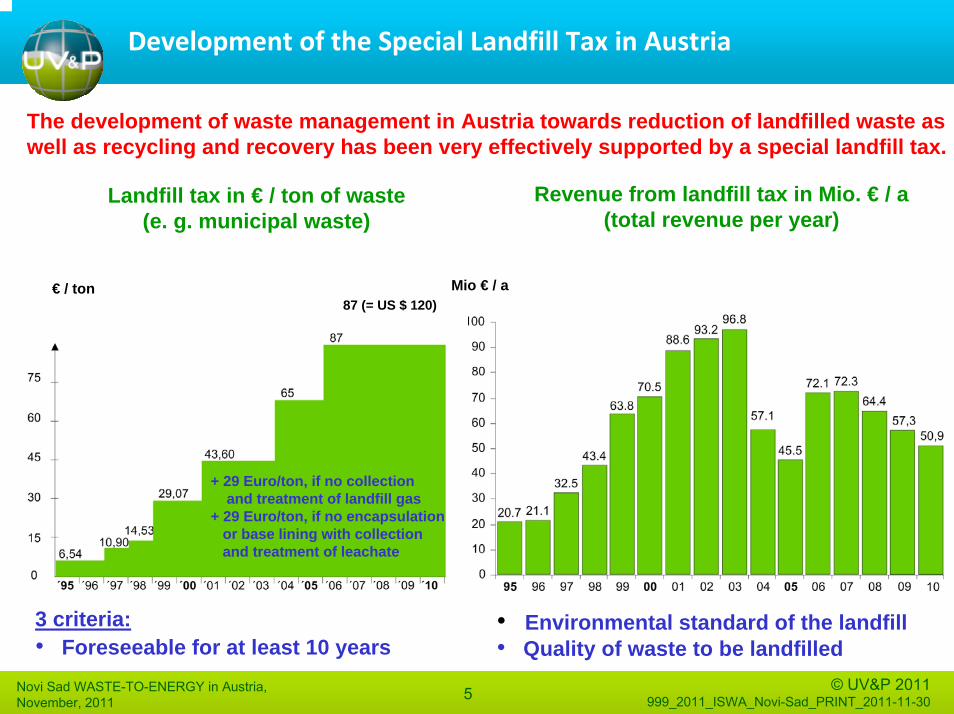
Development of the Special Landfill Tax in Austria
Revenue from landfill tax in Mio. € / a(total revenue per year)
Landfill tax in € / ton of waste(e. g. municipal waste)
3 criteria:• Foreseeable for at least 10 years
The development of waste management in Austria towards reduction of landfilled waste as well as recycling and recovery has been very effectively supported by a special landfill tax.
• Environmental standard of the landfill• Quality of waste to be landfilled
€ / ton Mio € / a87 (= US $ 120)
+ 29 Euro/ton, if no collectionand treatment of landfill gas
+ 29 Euro/ton, if no encapsulation or base lining with collection and treatment of leachate

6 © UV&P 2011999_2011_ISWA_Novi-Sad_PRINT_2011-11-30
Novi Sad WASTE-TO-ENERGY in Austria,November, 2011
Environmental Consulting & Engineering for Sustainable Waste Management
©U
V&P
Different technologies are needed for specific wastes in an integrated treatment system, also taking into consideration specific regional conditions.
Successful project design must be based on the
1st and 2nd Law of Thermodynamics!
Our project designs are profitable for our clients
and protect the environment.
(UV&P, since 1991)
©U
V&P

7 © UV&P 2011999_2011_ISWA_Novi-Sad_PRINT_2011-11-30
Novi Sad WASTE-TO-ENERGY in Austria,November, 2011
Example for Public Education in Prevention of Waste: “The Beautiful Danube starts here …“
© EbS, Austria

8 © UV&P 2011999_2011_ISWA_Novi-Sad_PRINT_2011-11-30
Novi Sad WASTE-TO-ENERGY in Austria,November, 2011
Separated collection of
Source Separation & Separate Collection of Municipal Wastesfor Recovery of Materials and Energy
Type of wastefraction
Incinerationin % weight Comments
Paper, Cardboard
approx. 5 – 15
Sorting and processing
Plastics, Composites
approx. 30 – 70
„Plastic PackagingBag“, „Oekobox“
Packaging glass, Laminated glass
approx. 2 – 10
Plastics, Composite films
Construction waste
approx. 10 – 40
Wood, shavings,plastic pipes, foils, packaging, carpeting
Biological waste approx. 5 – 10
Plastics, non-biodegradablematerials
Bulky waste, scrap tires
approx. 70 – 90
without metals and recyclable fractions
Non-recyclablegarbage
approx. 45 – 98
without metals, due to biological processes(MBT)
Separate collection and recyclingmust be complemented bywaste-to-energy

9 © UV&P 2011999_2011_ISWA_Novi-Sad_PRINT_2011-11-30
Novi Sad WASTE-TO-ENERGY in Austria,November, 2011
Efficient Use of Non-renewable Resources Example Mineral Oil
More efficient useof crude oil forproduction of
valuable materials, including recycling
and recovery of energy from waste
100 kg differencein weight of vehicle
may change fuelconsumption by
0,3 l / 100 km
Zero disposal! (despite Landfill
Directive1999/31/EC)

10 © UV&P 2011999_2011_ISWA_Novi-Sad_PRINT_2011-11-30
Novi Sad WASTE-TO-ENERGY in Austria,November, 2011
Site‐specific Options for Utilization of Energy
Condensing Turbine (electricity only) Co-Generation (electricity + heat)
Energy utilization approx. 80 %Energy utilization approx. 20 %
incineration/boiler
incineration/boiler
flue-gastreatment
condensingturbine
waste waterand residuetreatment
calorific value of fueland latent heat
100%heat losses
ca. 15%
flue-gastreatment
waste waterand residuetreatment
heat lossesca. 15%
thermalenergyca. 70%
co-generation
calorific value of fuel and latent heat
100%
generation of electricityca. 18%
generation of electricityca. 12%
loss of heatby cooling
ca. 64% ©U
V&
P

11 © UV&P 2011999_2011_ISWA_Novi-Sad_PRINT_2011-11-30
Novi Sad WASTE-TO-ENERGY in Austria,November, 2011
Technical Requirements according to State‐of‐the‐Art
Fundamentals: 1st and 2nd Law of Thermodynamics!Austrian Standard ÖNORM S 2108-1 (2006-05-01) Thermal treatment of wastes - Part 1
Requirements and boundary conditions:
• Logical mass balances /emissions at minimum for S, Cl, F, Cr, Cd, Hg; which is fundamental for treatment of flue-gas and options for recoveryand treatment of residues
• Necessary flue-gas treatment (for different wastes according to wastecode) i.e., fine particulates, SOx, Halogens, POP, Hg, NOx
• Suggestion for utilization in specific production processes(e.g. main burner cement clinker kiln)
• Suggestions for recovery of (inorganic) material from thermal treatmentprocess (e.g., recovery of metal from shredder residues)
12 © UV&P 2011999_2011_ISWA_Novi-Sad_PRINT_2011-11-30
Novi Sad WASTE-TO-ENERGY in Austria,November, 2011
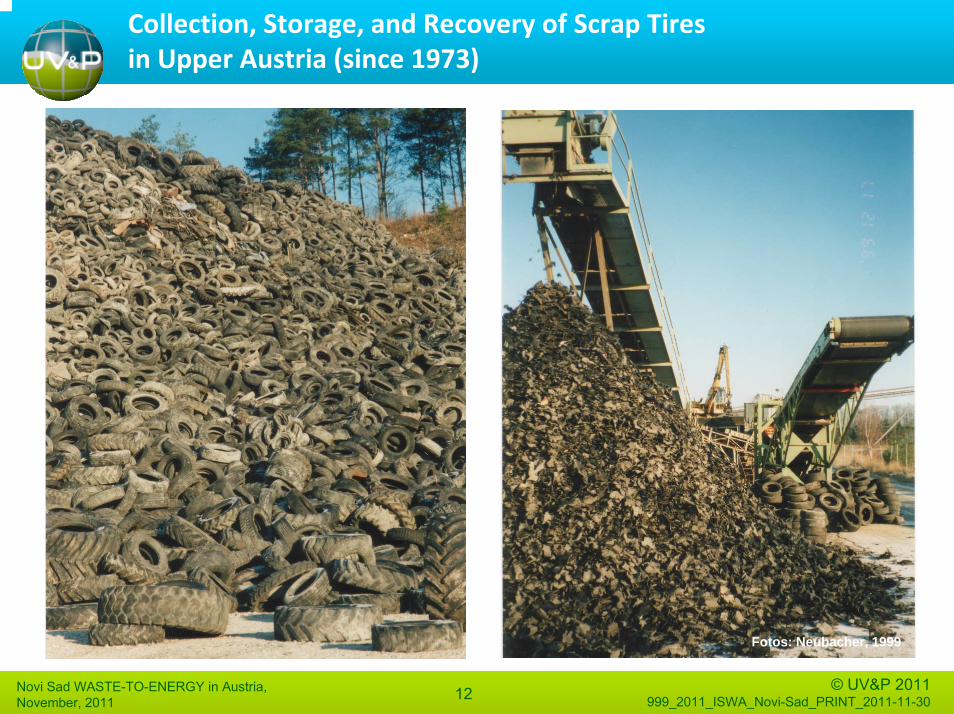
Collection, Storage, and Recovery of Scrap Tiresin Upper Austria (since 1973)
Fotos: Neubacher, 1999

13 © UV&P 2011999_2011_ISWA_Novi-Sad_PRINT_2011-11-30
Novi Sad WASTE-TO-ENERGY in Austria,November, 2011
Example of Shredded Tires for Waste‐to‐Energy in Cement Clinker Production in Gmunden
(Fotos: UV&P / G. Danzinger, 2002)

14 © UV&P 2011999_2011_ISWA_Novi-Sad_PRINT_2011-11-30
Novi Sad WASTE-TO-ENERGY in Austria,November, 2011
Overall Development of the Utilization of Alternative Fuels in the Austrian Cement Clinker Industry 1988 ‐ 2009
Sour
ce: A
ssoc
iatio
n of
Aus
trian
Cem
ent I
ndus
try, V
ienn
a 20
11
Less than 7% of total waste incineration for cement clinker production in Austria
Alternative fuels 2010: approx. 377.081 tSubstitution of primary fuels 2010: 62,8%
GJ / a

15 © UV&P 2011999_2011_ISWA_Novi-Sad_PRINT_2011-11-30
Novi Sad WASTE-TO-ENERGY in Austria,November, 2011
Large Waste Incineration Facilities in Austria
Large facilites for thermal treatment of waste in Austria:• 16 fluidized bed incinerators• 14 grate systems• 3 rotary kilns (for hazardous wastes)• 9 cement kilns with co-firing of waste fuels
Subtotal: 42 facilities in operation
Planned projects:• 4 fluidized bed incinerators• 1 grate system
Subtotal: 5 facilities plannedTotal:Total: 47 47 large waste incineration facilities in Austria large waste incineration facilities in Austria
Austria (approx. 8 Mio. people) Serbia (approx. 7,5 Mio. people)

16 © UV&P 2011999_2011_ISWA_Novi-Sad_PRINT_2011-11-30
Novi Sad WASTE-TO-ENERGY in Austria,November, 2011
Development of Emissions fromWaste Incinerationaccording to State‐of‐the‐Art in Austria and Switzerland
Dust Cd HCI SO2 NOx Hg PCDD/F*
1970 100 0,2 1.000 500 300 0,5 50
1980 50 0,1 100 100 300 0,2 20
1990 1 0,005 5 20 100 0,01 0,05
2000 1 0,001 1 5 40 0,005 0,05
Source: Vogg (values for 1970 - 1990); RVL (values for 2000)
* Values in ng/m3N = 10-6 mg/m3
Values in mg/m3N (11% O2, dry):
17 © UV&P 2011999_2011_ISWA_Novi-Sad_PRINT_2011-11-30
Novi Sad WASTE-TO-ENERGY in Austria,November, 2011
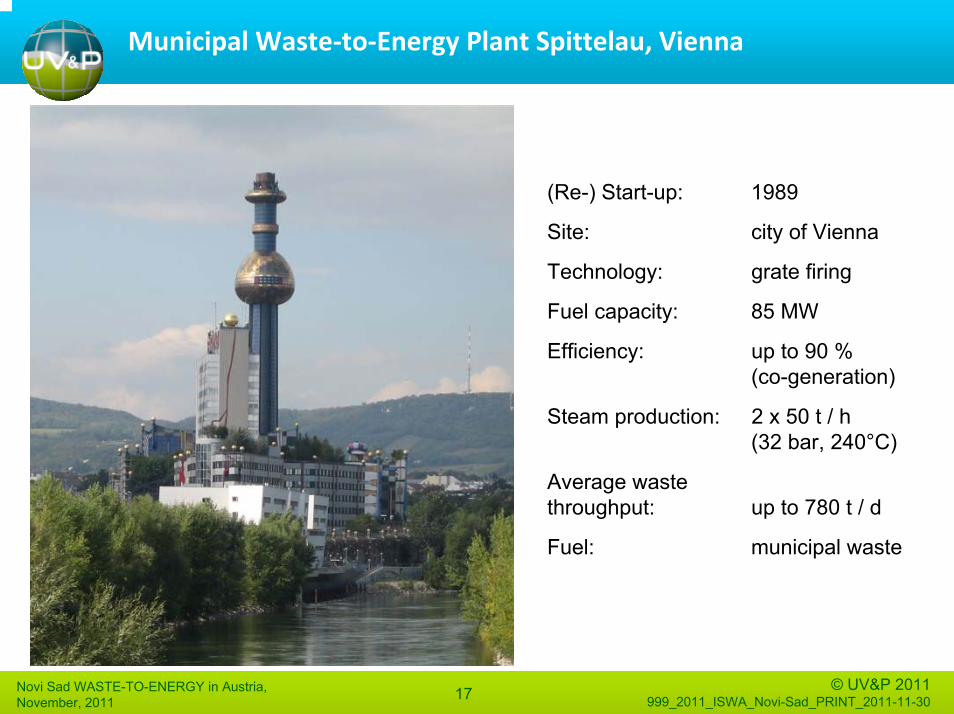
Municipal Waste‐to‐Energy Plant Spittelau, Vienna
(Re-) Start-up: 1989
Site: city of Vienna
Technology: grate firing
Fuel capacity: 85 MW
Efficiency: up to 90 % (co-generation)
Steam production: 2 x 50 t / h (32 bar, 240°C)
Average wastethroughput: up to 780 t / d
Fuel: municipal waste

18 © UV&P 2011999_2011_ISWA_Novi-Sad_PRINT_2011-11-30
Novi Sad WASTE-TO-ENERGY in Austria,November, 2011
Atmospheric Emissions from Supply of Heat (Example Vienna)
Pollutants in tons per year based on the same heating capacity
Source: Kirchner, IIR Conference: Efficient future Waste Treatment Technologies, 2008

19 © UV&P 2011999_2011_ISWA_Novi-Sad_PRINT_2011-11-30
Novi Sad WASTE-TO-ENERGY in Austria,November, 2011
Reduction of Greenhouse ‐ Gas Emissions by Municipal Waste Incineration compared to (legally banned) Landfilling in Vienna
Source: Kirchner, IIR Conference: Efficient future Waste Treatment Technologies, 2008
CO2- equivalent [kg/ton waste]
Reduction in household heating fromwaste-to-energy plant (district heating)
Reduction from reduced landfilling dueto incineration in waste-to-energy plant
Reduction from electricity generatedfrom waste-to-energy plant CO2-reduction from waste-to-energy plant
CO2-emission waste-to-energy plant
CO2- Net reduction

20 © UV&P 2011999_2011_ISWA_Novi-Sad_PRINT_2011-11-30
Novi Sad WASTE-TO-ENERGY in Austria,November, 2011
Example for Waste‐to‐Energy in Industrial Production:RVL Lenzing, Upper Austria
Fuel mix in 2010 at Lenzing AG:
Fuel Input: 12.600.863 GJ / a
Source: Rosenauer, 2008
Planning (UV&P): 1993/94Start Up: 1998Technology: fluidized bedFuel capacity: 110 MWSteam production: 120 t / h
(80 bar, 500°C)Waste throughput: up to 1.000 t / d
6,3 %
27,6 %
5,2 %
1,8 %
47,4 %11,7 %

21 © UV&P 2011999_2011_ISWA_Novi-Sad_PRINT_2011-11-30
Novi Sad WASTE-TO-ENERGY in Austria,November, 2011
Industrial Site of Lenzing in Salzkammergut, Upper Austria
The 3 arguments:1. Energy demand
2. Reduction of odour3. No landfilling
The waste-to-energyplant RVL is integratedin the industrial site of Lenzing Austria – with
advanced environmentaltechnology to protect
the natural environmentin the famous touristregion around Lake
Attersee.

22 © UV&P 2011999_2011_ISWA_Novi-Sad_PRINT_2011-11-30
Novi Sad WASTE-TO-ENERGY in Austria,November, 2011
Control of Cleaned Flue‐Gas from Waste Incineration(Example: RVL Lenzing, operation since 1998)

23 © UV&P 2011999_2011_ISWA_Novi-Sad_PRINT_2011-11-30
Novi Sad WASTE-TO-ENERGY in Austria,November, 2011
Illustration for Efficiency of Controlled Incinerationand Multi‐stage Flue‐Gas Cleaning (Example RVL, 1994)
Comparison of organic compounds from incineration plant / cars
Incineration plant 14 cars=Calculation:Car exhaust contains ca. 20 g C-org / kg fuel(Source: Schopp G., Ö. Chemz. 1993/9)
Flue gas of the incinerationplant with multi-stage fluegas cleaning contains lessthan 1.980 g C-org / h(Source: Expertise ZAMG, 22.12.1993)
Cleaned flue-gas of an incineration plant containsless organic compounds than the exhaust of 14 cars
24 © UV&P 2011999_2011_ISWA_Novi-Sad_PRINT_2011-11-30
Novi Sad WASTE-TO-ENERGY in Austria,November, 2011
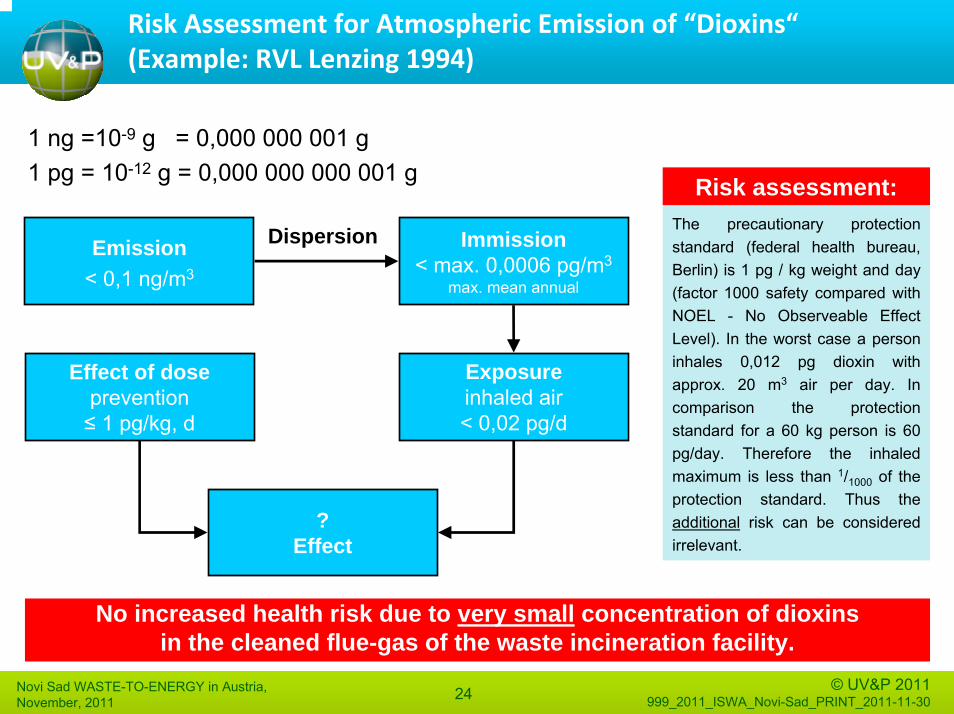
Risk Assessment for Atmospheric Emission of “Dioxins“(Example: RVL Lenzing 1994)
1 ng =10-9 g = 0,000 000 001 g1 pg = 10-12 g = 0,000 000 000 001 g
No increased health risk due to very small concentration of dioxinsin the cleaned flue-gas of the waste incineration facility.
The precautionary protectionstandard (federal health bureau, Berlin) is 1 pg / kg weight and day(factor 1000 safety compared withNOEL - No Observeable EffectLevel). In the worst case a personinhales 0,012 pg dioxin withapprox. 20 m3 air per day. In comparison the protectionstandard for a 60 kg person is 60 pg/day. Therefore the inhaledmaximum is less than 1/1000 of theprotection standard. Thus theadditional risk can be consideredirrelevant.
Risk assessment:
Dispersion Immission< max. 0,0006 pg/m3
max. mean annual
Emission< 0,1 ng/m3
Effect of doseprevention≤ 1 pg/kg, d
Exposureinhaled air< 0,02 pg/d
?Effect

25 © UV&P 2011999_2011_ISWA_Novi-Sad_PRINT_2011-11-30
Novi Sad WASTE-TO-ENERGY in Austria,November, 2011
Illustration for Risk Assessment regarding “Dioxins“Example RVL, 1994
Assumption: 3 cigarettes per day = marginalvalue of impact (no effect observable)
Thus the precautious protectionstandard (=1/1000) is equivalentto 1 cigarette per year.
Conclusion : An incineration plant with multi-stage flue gas cleaning isfactor 1000 below the protection standard
thus = equivalent to 1 additional cigarette in 1000 years

26 © UV&P 2011999_2011_ISWA_Novi-Sad_PRINT_2011-11-30
Novi Sad WASTE-TO-ENERGY in Austria,November, 2011
Treatment Methods for Residual Municipal Solid Waste Development from 1980 to 2013 in Austria
Source: Gerd Mauschitz, Klimarelevanz der Abfallwirtschaft IV, Studie im Auftrag des Bundesministeriums für Land- und Forstwirtschaft, Umwelt und Wasserwirtschaft

27 © UV&P 2011999_2011_ISWA_Novi-Sad_PRINT_2011-11-30
Novi Sad WASTE-TO-ENERGY in Austria,November, 2011
Forecasted GHG – Emissions for the Treament of Residual Waste for the Year 2013 in Austria
Total emissions (106 tons of CO2 equivalent)

28 © UV&P 2011999_2011_ISWA_Novi-Sad_PRINT_2011-11-30
Novi Sad WASTE-TO-ENERGY in Austria,November, 2011
Discussion on Mechanical ‐ Biological Treatment (MBT) vs. Mechanical Processing (MP) and Recovery (Austria, 2007)
29 © UV&P 2011999_2011_ISWA_Novi-Sad_PRINT_2011-11-30
Novi Sad WASTE-TO-ENERGY in Austria,November, 2011
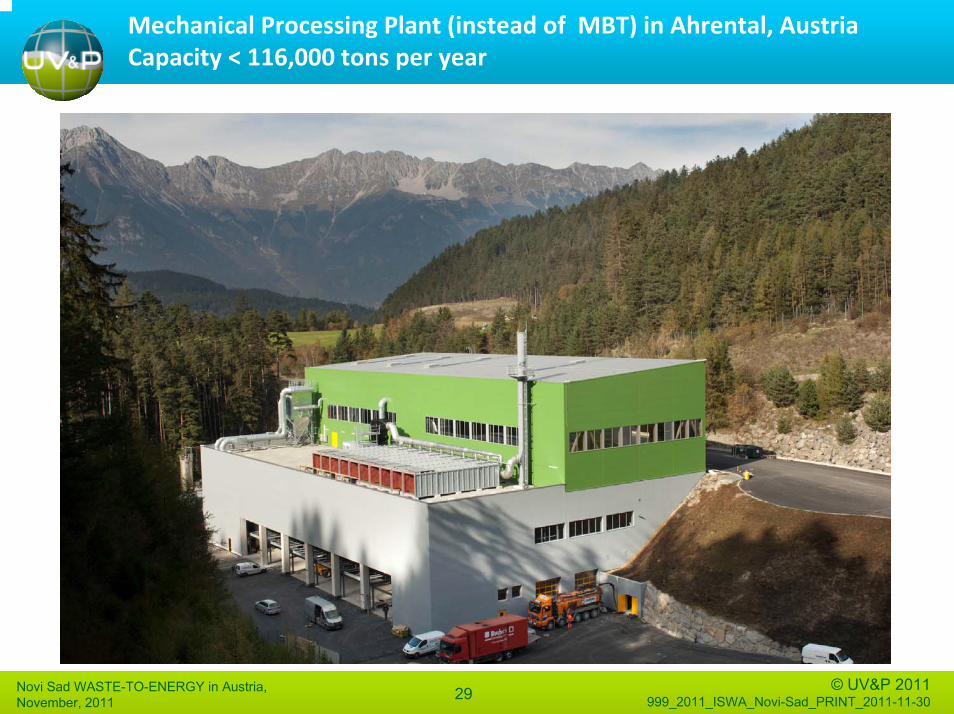
Mechanical Processing Plant (instead of MBT) in Ahrental, AustriaCapacity < 116,000 tons per year

30 © UV&P 2011999_2011_ISWA_Novi-Sad_PRINT_2011-11-30
Novi Sad WASTE-TO-ENERGY in Austria,November, 2011
Example RHKW Residual Waste Heat and Power Plant Linz: Co‐Generation Project based on Waste Derived Fuel
Planning (UV&P): 2006/07Start Up: 2011Technology: fluidized bedFuel capacity: 66 MW (+ 10%)Efficiency: ca. 80 %
(co-generation)Steam production: 78 t / h
(42 bar, 405°C)Average wastethroughput: up to 800 t / dFuels: municipal and
commercial waste, sewage sludge, screening wastes, shredderresidues
Mechanical waste processing and
intermediate storage
Pipe conveyor for waste transport from fuel storage to power plant
power plant includingfluidized bed boiler
smoke stack (180 m – existing)

31 © UV&P 2011999_2011_ISWA_Novi-Sad_PRINT_2011-11-30
Novi Sad WASTE-TO-ENERGY in Austria,November, 2011
Specific Treatment Costs and Composition of Costs of typical Municipal Waste Incinerators in Austria
The specific investment costs depend on the size (economies of scale), appropriate selectionof site (available infrastructure, etc.) and competent design / competitive prices for supply of equipment)
Major revenues include production of steam (electricity and heat), revenues for waste treatment, and recovery of inorganic materials (in special cases)
based on average calorific value of approx. 10 MJ / kg and annual operation of 8.000 h
Source: White Book „Waste-to-Energy in Austria“, 2010

32 © UV&P 2011999_2011_ISWA_Novi-Sad_PRINT_2011-11-30
Novi Sad WASTE-TO-ENERGY in Austria,November, 2011
Example for future Perspective: MMK Cardboard Industry with New Energy Center, Frohnleiten, Styria
Planning (UV&P): 2005/07
Technology: fluidized bed
Fuel capacity: 160 MW
Efficiency: ca. 80 % (co-generation)
Steam production: 190 t / h (70 bar, 470°C)
Average RDF up to 1.360 t / dthroughput: (< 450.000 t / a)
Fuels: refuse derived fuel, residues from paper recycling, waste wood, sludge from waste water treatment(biomass, coal)
Vis
ual d
esig
n by
arc
hite
ct G
ango
ly, 2
007

33 © UV&P 2011999_2011_ISWA_Novi-Sad_PRINT_2011-11-30
Novi Sad WASTE-TO-ENERGY in Austria,November, 2011
Central‐ and South–Eastern Europe Region: Inhabitants / Land filling in % of MSW (EUROSTAT, 2008)
© 2011 The Bortner Vacation Travelogue
22 Mio. 99 %
5 Mio. 83 %
38 Mio. 87 %
10 Mio. 74 %
2 Mio. 66 % 5 Mio.
95 %
10 Mio. 83 %
8 Mio. 3 % MMK
SLO
SK
7 Mio. 100 %

34 © UV&P 2011999_2011_ISWA_Novi-Sad_PRINT_2011-11-30
Novi Sad WASTE-TO-ENERGY in Austria,November, 2011
Short‐term Alternatives for Energy and Metal Recoveryfrom Mixed Municipal Waste in the “Transient Phase“
Separation of mixedmunicipal waste into:
Metal scrap for recycling+
Fine fraction forlandfill / bio-reactor with
recovery of gas +
Refuse-derived fuel forwaste-to-energy plants(Option: Intermediate
Storage)

35 © UV&P 2011999_2011_ISWA_Novi-Sad_PRINT_2011-11-30
Novi Sad WASTE-TO-ENERGY in Austria,November, 2011
Technical Standards for the Intermediate Storageof High‐calorific Wastes (Ministry of Environment, Austria, 2007)
http://publikationen.lebensministerium.at/publication/publication/view/3058/28567

36 © UV&P 2011999_2011_ISWA_Novi-Sad_PRINT_2011-11-30
Novi Sad WASTE-TO-ENERGY in Austria,November, 2011
System for Safe and Clean Storage of Waste‐Derived Fuel (Patent Applications A1037/2008, PCT/EP2009/050238)
State-of-the-art: cylindrical bales with approx. 1,2 m diameter and 1,2 m heightCapacity per packing machine approx. 30 bales/h, 3.000 to 4.000 h/a ⇒ ca. 60.000 to 120.000 t/a
Storage amount dependent on height of pile: up to 60.000 t/ha storage area
Protective cornerstonesagainst accidents and foundationfor monitoring, light poles and hydrants
37 © UV&P 2011999_2011_ISWA_Novi-Sad_PRINT_2011-11-30
Novi Sad WASTE-TO-ENERGY in Austria,November, 2011
Precaution against New “Miraculous“ Technologies
The technical concept should be based on:
• State-of-the-art technology (BAT) for such type of waste• Prove of successful technical operation of a similar type and
size of facility (e.g. > 80% of requested thermal capacity) overa minimum period of 3 years
The financial risks for installation of un-proven technology are significant and have to be legally well-defined and financially secured.
The following scenarios must be considered:
1. Costs for immediate upgrading in case of insufficient performance
2. Costs for installation of a system according to state-of-the-art in case of a continuous failure
3. Costs for alternative treatment of waste during incomplete or malfunctioning of the overall system.

38 © UV&P 2011999_2011_ISWA_Novi-Sad_PRINT_2011-11-30
Novi Sad WASTE-TO-ENERGY in Austria,November, 2011
Necessary cooperation for Successful Implementation of Waste‐to‐Energy Projects

39 © UV&P 2011999_2011_ISWA_Novi-Sad_PRINT_2011-11-30
Novi Sad WASTE-TO-ENERGY in Austria,November, 2011
Overall Costs for Project Development, Implementation and Operation of large Waste‐to‐Energy Plants
Concept- and feasibility studies approx. 0.2 – 0.5 Mio. EuroManagement, consulting & engineering approx. 10 Mio. Euro
Supply and construction approx. 100 – 200 Mio. Euro
Operation & maintenance of waste-to-energy plant (e.g. 40 years) approx. 600 – 1,600 Mio. Euro
Typical cash-flow of large waste-to-energy plants over lifetime(e.g. RVL Lenzing, EVN Lower Austria, RHKW Linz)
Recommendation: The determining factor for future success is the competent development and systematic evaluation of technical alternatives and feasibility studies byindependent expert teams in cooperation with local partners.
40 © UV&P 2011999_2011_ISWA_Novi-Sad_PRINT_2011-11-30
Novi Sad WASTE-TO-ENERGY in Austria,November, 2011
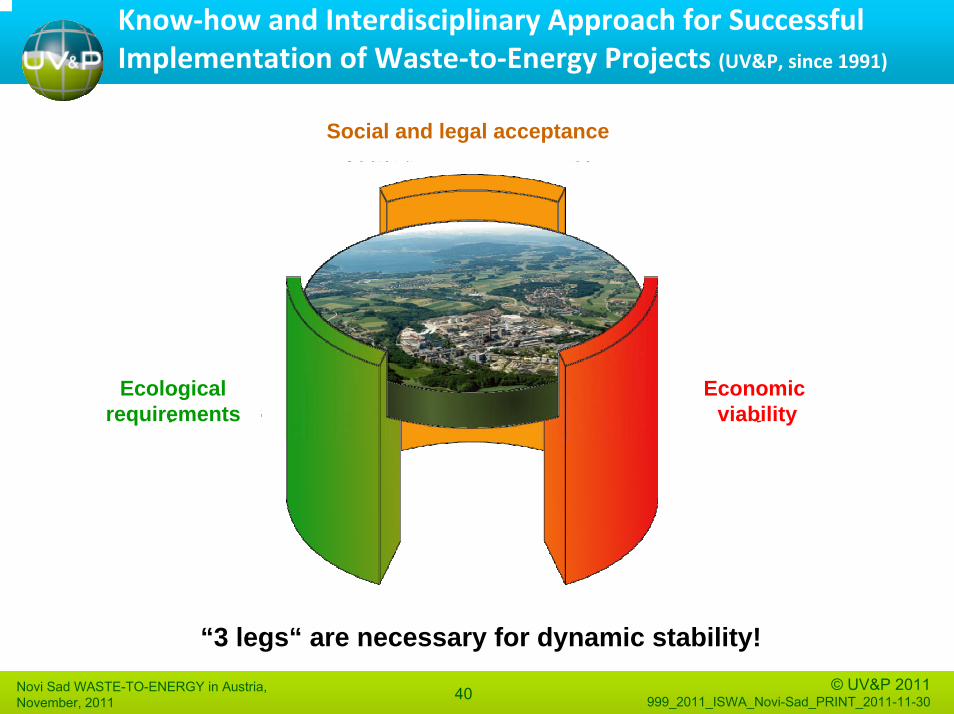
Know‐how and Interdisciplinary Approach for Successful Implementation of Waste‐to‐Energy Projects (UV&P, since 1991)
© UV&P“3 legs“ are necessary for dynamic stability!
Ecologicalrequirements
Social and legal acceptance
Economicviability

41 © UV&P 2011999_2011_ISWA_Novi-Sad_PRINT_2011-11-30
Novi Sad WASTE-TO-ENERGY in Austria,November, 2011
Thank you for your Attention !Comments & Questions ?