Waste Recovery Quick Wins guidance - Wrap
36
Practical solutions for sustainable construction Waste Recovery Quick Wins Improving recovery rates without increasing costs Guidance for construction clients, design teams and contractors explaining how Quick Wins boost recovery rates and thus increase profits Project code: WAS7-001 ISBN: 1-84405-352-0 Research date: July 2006 Date: July 2007
Transcript of Waste Recovery Quick Wins guidance - Wrap

Practical solutions for sustainable construction
Waste Recovery Quick Wins
Improving recovery rates without increasing costs
Guidance for construction clients, design teams and contractors explaining how Quick Wins boost recovery rates and thus increase profits
Project code: WAS7-001 ISBN: 1-84405-352-0 Research date: July 2006 Date: July 2007

Front cover photograph: South Lanarkshire Primary School
WRAP and EnviroCentre believe the content of this report to be correct as at the date of writing. However, factors such as prices, levels of recycled content and regulatory requirements are subject to change and users of the report should check with their suppliers to confirm the current situation. In addition, care should be taken in using any of the cost information provided as it is based upon numerous project-specific assumptions (such as scale, location, tender context, etc.). The report does not claim to be exhaustive, nor does it claim to cover all relevant products and specifications available on the market. While steps have been taken to ensure accuracy, WRAP cannot accept responsibility or be held liable to any person for any loss or damage arising out of or in connection with this information being inaccurate, incomplete or misleading. It is the responsibility of the potential user of a material or product to consult with the supplier or manufacturer and ascertain whether a particular product will satisfy their specific requirements. The listing or featuring of a particular product or company does not constitute an endorsement by WRAP and WRAP cannot guarantee the performance of individual products or materials. For more detail, please refer to WRAP's Terms & Conditions on its web site: www.wrap.org.uk." Published by Waste & Resources The Old Academy Tel: 01295 819 900 Helpline freephone Action Programme 21 Horse Fair Fax: 01295 819 911 0808 100 2040 Banbury, Oxon E-mail: [email protected] OX16 0AH
Improving recovery rates without increasing costs 1
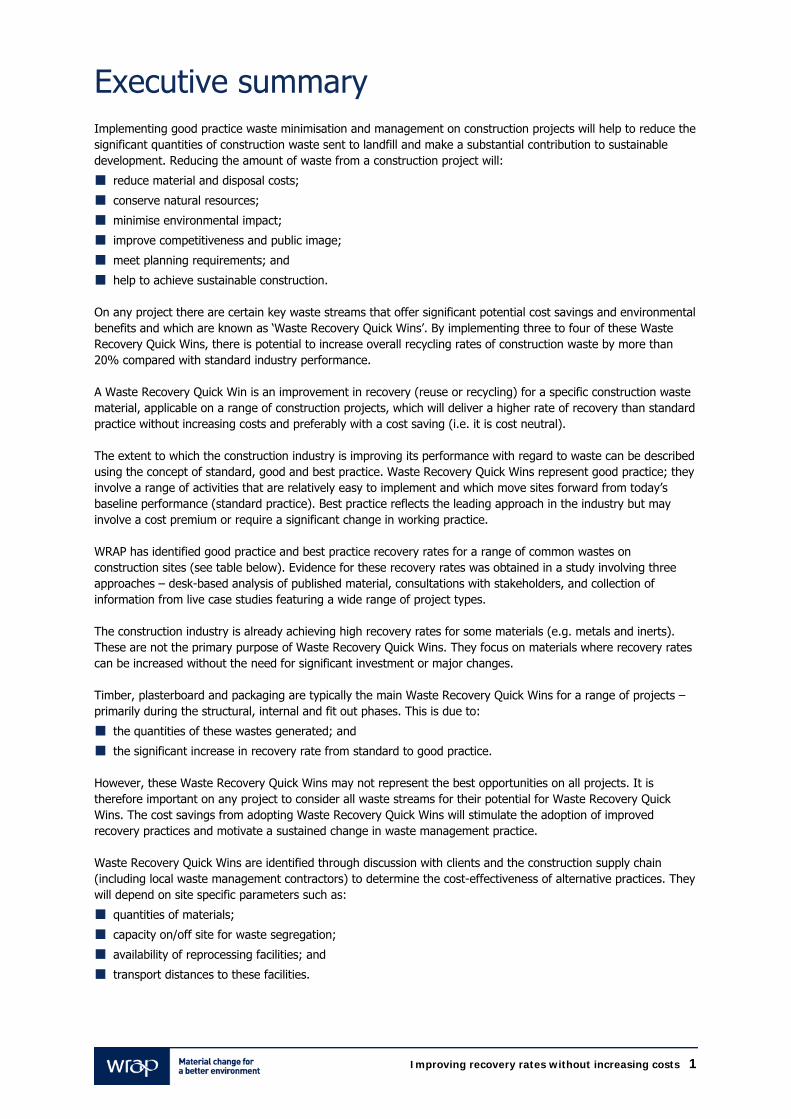
Executive summary Implementing good practice waste minimisation and management on construction projects will help to reduce the significant quantities of construction waste sent to landfill and make a substantial contribution to sustainable development. Reducing the amount of waste from a construction project will:
reduce material and disposal costs;
conserve natural resources;
minimise environmental impact;
improve competitiveness and public image;
meet planning requirements; and
help to achieve sustainable construction.
On any project there are certain key waste streams that offer significant potential cost savings and environmental benefits and which are known as ‘Waste Recovery Quick Wins’. By implementing three to four of these Waste Recovery Quick Wins, there is potential to increase overall recycling rates of construction waste by more than 20% compared with standard industry performance. A Waste Recovery Quick Win is an improvement in recovery (reuse or recycling) for a specific construction waste material, applicable on a range of construction projects, which will deliver a higher rate of recovery than standard practice without increasing costs and preferably with a cost saving (i.e. it is cost neutral). The extent to which the construction industry is improving its performance with regard to waste can be described using the concept of standard, good and best practice. Waste Recovery Quick Wins represent good practice; they involve a range of activities that are relatively easy to implement and which move sites forward from today’s baseline performance (standard practice). Best practice reflects the leading approach in the industry but may involve a cost premium or require a significant change in working practice. WRAP has identified good practice and best practice recovery rates for a range of common wastes on construction sites (see table below). Evidence for these recovery rates was obtained in a study involving three approaches – desk-based analysis of published material, consultations with stakeholders, and collection of information from live case studies featuring a wide range of project types. The construction industry is already achieving high recovery rates for some materials (e.g. metals and inerts). These are not the primary purpose of Waste Recovery Quick Wins. They focus on materials where recovery rates can be increased without the need for significant investment or major changes. Timber, plasterboard and packaging are typically the main Waste Recovery Quick Wins for a range of projects – primarily during the structural, internal and fit out phases. This is due to:
the quantities of these wastes generated; and
the significant increase in recovery rate from standard to good practice.
However, these Waste Recovery Quick Wins may not represent the best opportunities on all projects. It is therefore important on any project to consider all waste streams for their potential for Waste Recovery Quick Wins. The cost savings from adopting Waste Recovery Quick Wins will stimulate the adoption of improved recovery practices and motivate a sustained change in waste management practice. Waste Recovery Quick Wins are identified through discussion with clients and the construction supply chain (including local waste management contractors) to determine the cost-effectiveness of alternative practices. They will depend on site specific parameters such as:
quantities of materials;
capacity on/off site for waste segregation;
availability of reprocessing facilities; and
transport distances to these facilities.

Improving recovery rates without increasing costs 2
Space constraints on site, time available and project type are further factors influencing the choice of Waste Recovery Quick Wins.
Standard, good and best practice recovery rates by material
Material Standard practice
recovery (%) Good practice Quick Win
(%) Best practice recovery (%)
Timber 57 90 95 Metals 95 100 100 Plasterboard* 30 90 95 Packaging 60 85 95 Ceramics/masonry 75 85 100 Concrete 75 95 100 Inert 75 95 100 Plastics 60 80 95 Miscellaneous 12 50 75 Electrical equipment Limited information 70† 95 Furniture 0–15 25 50 Insulation 12 50 75 Cement Limited information 75 95 Liquids and oils 100 100 100 Hazardous 50 Limited information** Limited information** * Excludes demolition. † This is a required recovery target for the type of WEEE likely to be produced from construction sites, e.g. lighting (WEEE Regulations, January 2007). ** This cannot be 100% as much hazardous waste (e.g. asbestos) must be landfilled. The guide describes current performance and suggests measures necessary to achieve good practice and best practice during different construction phases (site clearance, structural, internal, fit out and external). Effective segregation is vital to achieving good practice. Separate skips for different waste streams are particularly important for Waste Recovery Quick Wins in the structural, fit out and internal phases. Planning ahead to consider waste arisings and opportunities for segregation during different phases is essential, as is working with waste management contractors who can work with high segregation levels or offer recovery from mixed waste streams. Setting targets and/or establishing key performance indicators help to achieve the benefits of Waste Recovery Quick Wins, especially when part of a Site Waste Management Plan (SWMP). The case studies accompanying this guide illustrate the cost savings available from adopting Waste Recovery Quick Wins and demonstrate that it is possible to be significantly more efficient in the use of natural resources without compromising cost, quality or construction programmes. These case studies cover new build (commercial, housing, public and retail), refurbishment (commercial, high density housing, public and retail) and infrastructure projects. The case studies, together with a technical appendix, are available from the WRAP website (www.wrap.org.uk/construction). Detailed guidance on how to improve recovery rates and advice on good practice waste minimisation and management are also available from WRAP.

Improving recovery rates without increasing costs 3
Contents 1.0 Introduction................................................................................................................................ 4
1.1 Purpose of this guide .............................................................................................................5 2.0 Why is waste recovery important?............................................................................................. 6
2.1 Benefits of improved material efficiency ..................................................................................6 2.2 True cost of waste.................................................................................................................6 2.3 Policy drivers.........................................................................................................................7
2.3.1 Landfill Tax...............................................................................................................7 2.3.2 Site Waste Management Plans ...................................................................................7 2.3.3 Code for Sustainable Homes ......................................................................................7
2.4 Waste minimisation ...............................................................................................................8 2.5 Carbon savings......................................................................................................................8
3.0 What are Waste Recovery Quick Wins....................................................................................... 8 3.1 Definition of a Waste Recovery Quick Win...............................................................................8 3.2 Identifying Waste Recovery Quick Wins ..................................................................................9
3.2.1 Factors influencing Waste Recovery Quick Wins..........................................................9 3.2.2 Sectoral variations .................................................................................................. 10 3.2.3 Regional variations.................................................................................................. 10
3.3 Performance benchmarks..................................................................................................... 10 3.3.1 Timber ................................................................................................................... 11 3.3.2 Plasterboard ........................................................................................................... 11 3.3.3 Packaging............................................................................................................... 12 3.3.4 Other materials....................................................................................................... 12
3.4 Financial benefits of Waste Recovery Quick Wins................................................................... 13 4.0 Construction waste arisings and fate ...................................................................................... 14 5.0 Current performance on construction sites ............................................................................. 16
5.1 Standard practice ................................................................................................................ 16 5.2 Good practice...................................................................................................................... 18 5.3 Best practice ....................................................................................................................... 19
6.0 Waste Recovery Quick Wins in the main phases of construction ........................................... 21 6.1 Introduction ........................................................................................................................ 21 6.2 Key phases ......................................................................................................................... 21
6.2.1 Differences between new build and refurbishment .................................................... 24 6.3 The importance of segregation rather than mixed skips ......................................................... 24 6.4 Behaviour changes ..............................................................................................................25
6.4.1 Implementing Site Waste Management Plans (SWMPs) ............................................. 26 6.4.2 KPIs and targets ..................................................................................................... 26 6.4.3 Planning ahead....................................................................................................... 27
6.5 Barriers and constraints to improved waste recovery ............................................................. 28 6.6 Moving to best practice........................................................................................................28
7.0 Overview of case studies.......................................................................................................... 31 8.0 What next?................................................................................................................................ 33

Improving recovery rates without increasing costs 4
1.0 Introduction The construction industry in the UK uses over 400 million tonnes of natural resources per year and generates more than a third of the UK’s waste arisings, of which only half is reused or recycled (primarily aggregates and metals). Over 60 million tonnes of waste from the construction industry is sent to landfill or similar disposal sites every year. More efficient use of materials would make a major contribution to reducing the environmental impacts of construction, including reducing demand for landfill and the depletion of finite natural resources. Materials efficiency can be improved without increasing costs by:
minimising the amount of waste produced in the first place;
reducing the amount of waste sent to landfill through effective waste management;
recovering materials already on the construction site for reuse and recycling; and
using more recycled materials and those with a higher recycled content.
Taking action in these areas enables construction projects to achieve good or best practice in materials efficiency. Producing less waste not only reduces raw material costs but has the added benefit of minimising the cost of managing the waste and removing it from the site. In light of recent and future increases in the Landfill Tax, reducing the amount of waste produced and improving management and recovery options will produce ever increasing financial savings as well as environmental benefits. This guide is concerned with improving recovery rates for materials wasted on construction sites without increasing overall costs. On any project, there are certain key waste streams that can offer significant potential cost savings and environmental benefits, otherwise known as ‘Waste Recovery Quick Wins’. By implementing three to four of these good practice ‘Waste Recovery Quick Wins’, there is potential to increase overall recycling rates of construction waste by more than 20% compared with standard industry performance. To help those wishing to set waste recovery rate targets, WRAP has identified good practice recovery rates for a range of common wastes on construction sites. The evidence for these recovery rates was obtained by WRAP-commissioned consultants, EnviroCentre, using three approaches:
desk-based analysis of information available on the internet including reviews, case studies and government
reports;
consultations with stakeholders based on specially designed questionnaires – seven major construction
companies, four waste management companies, National Industrial Symbiosis Programme (NISP)1, London
Remade,2 BRE,3 CIRIA4 and National Green Specification;5 and
collection of information from different types of ‘live’ project to form a series of case studies based on the
practices of Bovis Lend Lease. These case studies are available separately from WRAP (an overview is given in
Section 7).
The study sought views on standard, good and best practice (see Section 5) and secured information on the
relative costs of waste disposal and recycling, and the costs of segregation versus non-segregation. Examples of
emerging technologies and improved practices were identified. Discussions with stakeholders provided a ‘reality
check’ and allowed the questionnaire responses to be compared with information obtained from the desk-based
research and live case studies.
1 www.nisp.org.uk
2 www.londonremade.com
3 www.bre.co.uk
4 www.ciria.org
5 www.greenspec.co.uk

Improving recovery rates without increasing costs 5
The case studies cover the following categories of construction project:
New build: o commercial; o housing; o public; and o retail.
Refurbishment: o commercial; o high density housing; o public; and o retail.
Infrastructure projects.
Data were also gathered on the various phases of the construction project (Table 1).
Table 1 Construction phases investigated to identify Waste Recovery Quick Wins
Phase Examples
Site clearance, preparations and underground services Demolition Remediation Bulk earthworks Utilities Foundations
Structural phase Frame Walls Roofs Floors Cladding
Internal phase Internal walls Plastering Mechanical and electrical (M & E) plant
Fit out Doors Suspended ceilings Bathroom suites and tiling Carpets and flooring Electrics
External works Roads Pavements Hard and soft landscaping
1.1 Purpose of this guide This guide is intended to be of interest to clients, developers and major construction companies. It stresses the benefits of waste recovery and explains how concentrating on Waste Recovery Quick Wins during the different phases of the construction stage will help companies make more efficient use of materials. The guide also describes:
what is meant by ‘Waste Recovery Quick Wins’;
priority waste streams for Waste Recovery Quick Wins;
current performance on UK construction sites in recovering waste materials (standard, good and best
practice);
Waste Recovery Quick Wins (good practice) in the main phases of construction;
the importance of segregation for successful recovery;
the need for behavioural change;
barriers and constraints to Waste Recovery Quick Wins;
moving to best practice;

Improving recovery rates without increasing costs 6
the case studies available featuring different types of project; and
what to do next.
Detailed advice on how to improve recovery rates on construction sites is available from the WRAP website (www.wrap.org.uk/construction). 2.0 Why is waste recovery important? Efficient use of materials by recovering and recycling them contributes to sustainable construction, minimises environmental damage and conserves natural resources. There are two important aspects of materials efficiency:
Materials in – product and materials selection, e.g. utilising materials recovered on site or locally; and
Materials out – good practice waste minimisation and management (WMM), e.g. returning packaging and
surplus materials for reuse/recycling and the collection, segregation and recycling of waste.
2.1 Benefits of improved material efficiency Waste recovery is an important element of good practice WMM. Adopting good practice WMM demonstrates a commitment to sustainable construction and environmental management. It is relatively straightforward to develop and implement, and need not impact on the overall design and financial outcomes of a project. If implemented correctly, good practice WMM can improve resource efficiency and achieve other significant benefits. These include:
reduced material and waste disposal costs – less waste generated means smaller quantities of materials
need to be purchased and less money is spent on landfill gate fees and landfill tax;
conserving natural resources – recycling packaging and construction materials results in less demand for
virgin materials;
minimising environmental damage – reduced waste saves landfill space and reduces the environmental
impacts associated with extracting, transporting and manufacturing/processing the raw materials making up
construction products;
lower carbon dioxide (CO2) emissions – e.g. implementing good practice plasterboard recovery
compared with standard practice can save 4.2 tonnes of CO2 for each tonne of additionally recovered
plasterboard;
increased competitive differentiation – benefits both developers and contractors, particularly where this
will help to meet the sustainability objectives of prospective clients;
increased performance against corporate social responsibility (CSR) objectives – progress in
achieving corporate responsibility and sustainability policies can be quantified for reporting to external
stakeholders and employees;
meeting planning requirements – planning authorities are increasingly setting conditions for
environmental performance as part of the development process;
complementing other aspects of sustainable design; and
responding to and pre-empting public policy – companies that respond to policy demands for increased
sustainability of construction and the built environment will have an advantage over those that wait until
legislation compels them to act.
2.2 True cost of waste The true cost of waste is not just the cost of paying a waste contractor to remove a skip from site. There are also the costs associated with:
the materials that are bought and then wasted (often the most significant cost);
sorting, handling and managing waste on site;
poor packing or overfilling of skips leading to double handling; and
the lost opportunity to sell waste for salvage or not recycling the waste.
Improving recovery rates without increasing costs 7
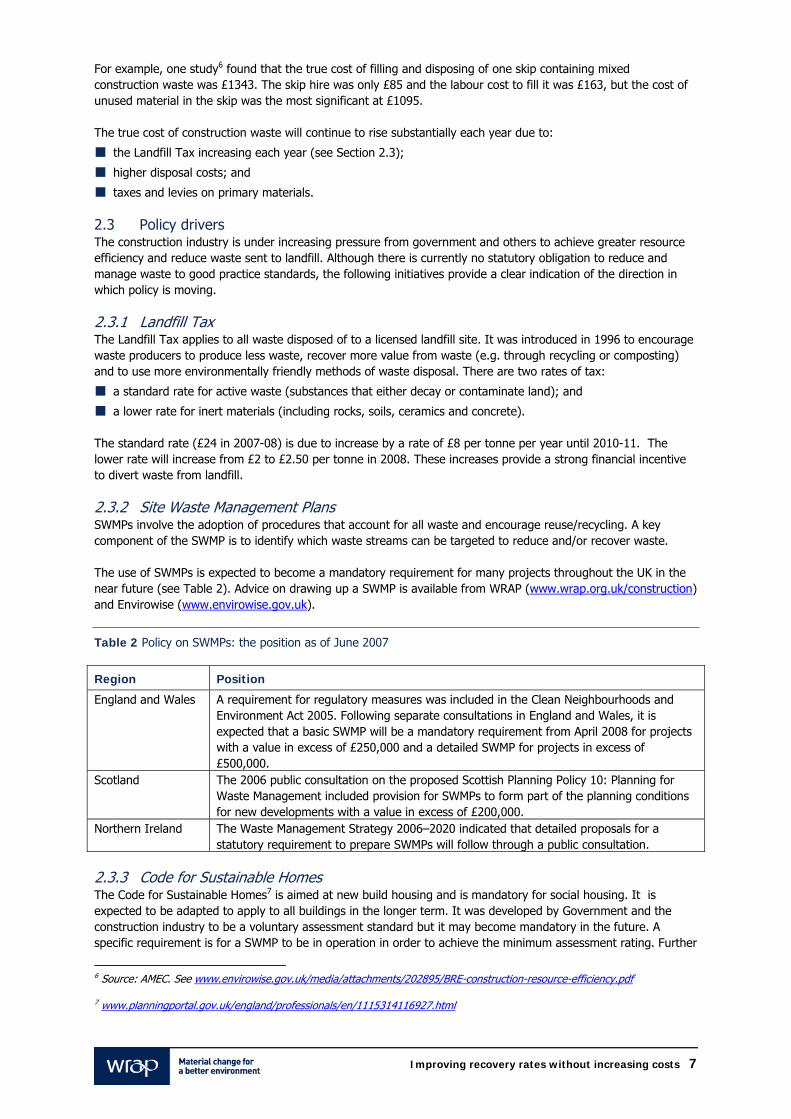
For example, one study6 found that the true cost of filling and disposing of one skip containing mixed construction waste was £1343. The skip hire was only £85 and the labour cost to fill it was £163, but the cost of unused material in the skip was the most significant at £1095. The true cost of construction waste will continue to rise substantially each year due to:
the Landfill Tax increasing each year (see Section 2.3);
higher disposal costs; and
taxes and levies on primary materials.
2.3 Policy drivers The construction industry is under increasing pressure from government and others to achieve greater resource efficiency and reduce waste sent to landfill. Although there is currently no statutory obligation to reduce and manage waste to good practice standards, the following initiatives provide a clear indication of the direction in which policy is moving. 2.3.1 Landfill Tax The Landfill Tax applies to all waste disposed of to a licensed landfill site. It was introduced in 1996 to encourage waste producers to produce less waste, recover more value from waste (e.g. through recycling or composting) and to use more environmentally friendly methods of waste disposal. There are two rates of tax:
a standard rate for active waste (substances that either decay or contaminate land); and
a lower rate for inert materials (including rocks, soils, ceramics and concrete).
The standard rate (£24 in 2007-08) is due to increase by a rate of £8 per tonne per year until 2010-11. The lower rate will increase from £2 to £2.50 per tonne in 2008. These increases provide a strong financial incentive to divert waste from landfill. 2.3.2 Site Waste Management Plans SWMPs involve the adoption of procedures that account for all waste and encourage reuse/recycling. A key component of the SWMP is to identify which waste streams can be targeted to reduce and/or recover waste. The use of SWMPs is expected to become a mandatory requirement for many projects throughout the UK in the near future (see Table 2). Advice on drawing up a SWMP is available from WRAP (www.wrap.org.uk/construction) and Envirowise (www.envirowise.gov.uk).
Table 2 Policy on SWMPs: the position as of June 2007
Region Position
England and Wales A requirement for regulatory measures was included in the Clean Neighbourhoods and Environment Act 2005. Following separate consultations in England and Wales, it is expected that a basic SWMP will be a mandatory requirement from April 2008 for projects with a value in excess of £250,000 and a detailed SWMP for projects in excess of £500,000.
Scotland The 2006 public consultation on the proposed Scottish Planning Policy 10: Planning for Waste Management included provision for SWMPs to form part of the planning conditions for new developments with a value in excess of £200,000.
Northern Ireland The Waste Management Strategy 2006–2020 indicated that detailed proposals for a statutory requirement to prepare SWMPs will follow through a public consultation.
2.3.3 Code for Sustainable Homes The Code for Sustainable Homes7 is aimed at new build housing and is mandatory for social housing. It is expected to be adapted to apply to all buildings in the longer term. It was developed by Government and the construction industry to be a voluntary assessment standard but it may become mandatory in the future. A specific requirement is for a SWMP to be in operation in order to achieve the minimum assessment rating. Further
6 Source: AMEC. See www.envirowise.gov.uk/media/attachments/202895/BRE-construction-resource-efficiency.pdf
7 www.planningportal.gov.uk/england/professionals/en/1115314116927.html
Improving recovery rates without increasing costs 8
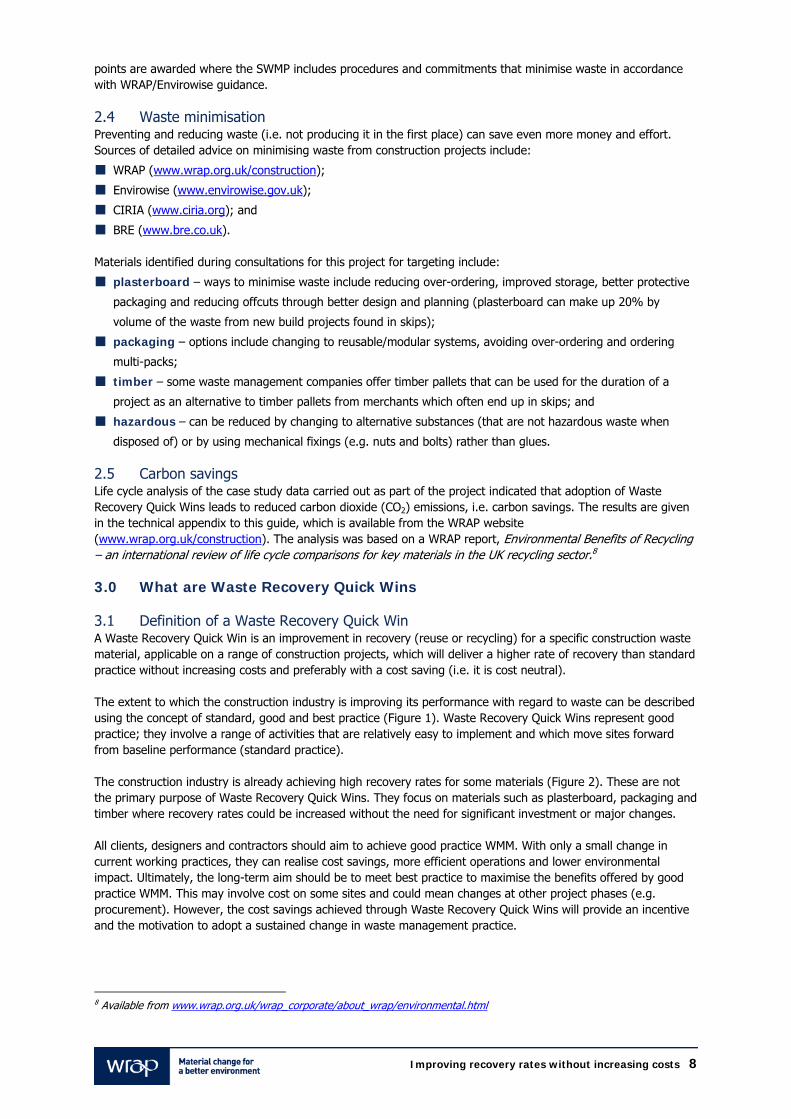
points are awarded where the SWMP includes procedures and commitments that minimise waste in accordance with WRAP/Envirowise guidance. 2.4 Waste minimisation Preventing and reducing waste (i.e. not producing it in the first place) can save even more money and effort. Sources of detailed advice on minimising waste from construction projects include:
WRAP (www.wrap.org.uk/construction);
Envirowise (www.envirowise.gov.uk);
CIRIA (www.ciria.org); and
BRE (www.bre.co.uk).
Materials identified during consultations for this project for targeting include:
plasterboard – ways to minimise waste include reducing over-ordering, improved storage, better protective
packaging and reducing offcuts through better design and planning (plasterboard can make up 20% by
volume of the waste from new build projects found in skips);
packaging – options include changing to reusable/modular systems, avoiding over-ordering and ordering
multi-packs;
timber – some waste management companies offer timber pallets that can be used for the duration of a
project as an alternative to timber pallets from merchants which often end up in skips; and
hazardous – can be reduced by changing to alternative substances (that are not hazardous waste when
disposed of) or by using mechanical fixings (e.g. nuts and bolts) rather than glues.
2.5 Carbon savings Life cycle analysis of the case study data carried out as part of the project indicated that adoption of Waste Recovery Quick Wins leads to reduced carbon dioxide (CO2) emissions, i.e. carbon savings. The results are given in the technical appendix to this guide, which is available from the WRAP website (www.wrap.org.uk/construction). The analysis was based on a WRAP report, Environmental Benefits of Recycling – an international review of life cycle comparisons for key materials in the UK recycling sector.8 3.0 What are Waste Recovery Quick Wins 3.1 Definition of a Waste Recovery Quick Win A Waste Recovery Quick Win is an improvement in recovery (reuse or recycling) for a specific construction waste material, applicable on a range of construction projects, which will deliver a higher rate of recovery than standard practice without increasing costs and preferably with a cost saving (i.e. it is cost neutral). The extent to which the construction industry is improving its performance with regard to waste can be described using the concept of standard, good and best practice (Figure 1). Waste Recovery Quick Wins represent good practice; they involve a range of activities that are relatively easy to implement and which move sites forward from baseline performance (standard practice). The construction industry is already achieving high recovery rates for some materials (Figure 2). These are not the primary purpose of Waste Recovery Quick Wins. They focus on materials such as plasterboard, packaging and timber where recovery rates could be increased without the need for significant investment or major changes. All clients, designers and contractors should aim to achieve good practice WMM. With only a small change in current working practices, they can realise cost savings, more efficient operations and lower environmental impact. Ultimately, the long-term aim should be to meet best practice to maximise the benefits offered by good practice WMM. This may involve cost on some sites and could mean changes at other project phases (e.g. procurement). However, the cost savings achieved through Waste Recovery Quick Wins will provide an incentive and the motivation to adopt a sustained change in waste management practice.
8 Available from www.wrap.org.uk/wrap_corporate/about_wrap/environmental.html

Improving recovery rates without increasing costs 9
Figure 1 Standard, good and best practice waste minimisation and management
Standard practice Good practice (Quick Wins)
Best practice
Baseline performance of the construction industry based on achieving minimum standards and legal requirements.
Going beyond standard practice to realise ‘Quick Wins’ – benefits that are easy to achieve on a majority of projects without a fundamental change in working practice and are at least cost neutral.
Reflects the leading approach in the industry, but may involve a cost premium or require a significant change in working practice.
Figure 2 Recycling of materials: standard, good and best practice Standard Good Best Metals and high value materials Timber, plasterboard, packaging and inert Take-back schemes with suppliers for materials, packaging , etc. Key Activity carried out thoroughly on all sites Activity carried out occasionally or at low levels Activity not carried out 3.2 Identifying Waste Recovery Quick Wins Certain types of materials lend themselves to alternative recovery practices depending on whether they are:
produced in sufficient quantities to make the operating costs of the recovery practice economically
attractive;
easily segregated on site;
significantly higher in value as a segregated waste compared with mixed waste; and
produced in a locality where reprocessing options for those materials are readily available.
In practical terms, Waste Recovery Quick Wins will be identified through discussion with clients and the construction supply chain (including local waste management contractors) to determine the economics and performance levels of alternative recovery practices. These will depend on site specific parameters such as:
quantities of materials;
capacity on/off site for waste segregation;
availability of reprocessing facilities; and
transport distances to these facilities.
3.2.1 Factors influencing Waste Recovery Quick Wins The extent to which material can be recovered in a cost-effective way is determined by the amount of effort and nature of the technology utilised. In practice, the factors that influence the choice of Waste Recovery Quick Wins for a project include:
waste recovery infrastructure – local availability of, for example, a company able to receive plasterboard
from demolition and/or construction projects for onward recycling;
gate fees – the difference between the gate fee charged for material accepted at landfill sites, exempt sites
and reprocessing facilities, and the value gained from the sale of segregated waste materials;

Improving recovery rates without increasing costs 10
project baseline – the baseline performance on waste recovery (standard practice) from which the project
is starting;
site type – the location and space constraints of the site; and
time – the programme and resource constraints of the project.
3.2.2 Sectoral variations The potential to recover specific waste streams may vary between sectors. For example, the approach taken by civil engineers and demolition contractors to material recovery may not be cost-effective or replicable in other sectors (e.g. housing) and vice versa. This will be influenced by the nature of the waste arisings which, in turn, will be determined by the type of construction project, building structure, phase etc. In addition, waste management contractors may be set up to recover materials in a way that is more responsive and efficient for one sector than another. 3.2.3 Regional variations There will be regional variations in the potential to recover certain materials as a result of the way in which waste management companies have developed at different locations. For example, a company in one location may be able to add value to a waste such as concrete fines which is not possible 50 miles away because they have a market outlet for these fines involving the production of hydraulically bound mixtures. 3.3 Performance benchmarks Table 3 presents the standard, good and best practice recovery rates established during this project for 15 common waste streams on construction sites. The recovery rates are for total waste recovery, i.e. on and off site. The waste categories used in Table 3 are derived from the waste streams used in the SMARTWaste programme. Example components of these waste streams are given in Table 4. The approach taken to setting the Quick Wins recovery rate recognises a demonstrably achievable recovery level that is significantly higher than the baseline (standard practice) and marginally higher than the average found in the case studies.
Table 3 Standard, good and best practice recovery rates by material
Material Standard practice recovery (%)
Good practice Quick Win (%)
Best practice recovery (%)
Timber 57 90 95 Metals 95 100 100 Plasterboard* 30 90 95 Packaging 60 85 95 Ceramics/masonry 75 85 100 Concrete 75 95 100 Inert 75 95 100 Plastics 60 80 95 Miscellaneous 12 50 75 Electrical equipment Limited information 70† 95 Furniture 0–15 25 50 Insulation 12 50 75 Cement Limited information 75 95 Liquids and oils 100 100 100 Hazardous 50 Limited information** Limited information** * Excludes demolition. † This is a required recovery target for the type of WEEE likely to be produced from construction sites, e.g. lighting (WEEE Regulations, January 2007). ** This cannot be 100% as much hazardous waste (e.g. asbestos) must be landfilled.

Improving recovery rates without increasing costs 11
Table 4 Waste categories
Material Examples in the waste stream
Timber Plywood, chipboard, noggins, battens, doors and windows, MDF Plasterboard Plasterboard, plaster Packaging Pallets, cardboard, bubble wrap, cable drums Metals Radiators, metal formwork, metal sinks, cables and wires Ceramics/masonry Bricks, ceramic tiles, clay roof tiles, ceramic toilets and sinks Concrete Concrete pipes, kerb stones, paving slabs, concrete, rubble Inert Soils, clays, sand, gravel, natural stone Liquids and oils Hydraulic oil, engine oil, lubricating oil, transmission oil, liquid fuel Plastics Gutters and downpipes, DPC, uPVC windows and doors Miscellaneous Office and canteen waste, vegetation, ad hoc materials (often means mixed waste) Electrical equipment TVs, fridges, air conditioning units, lamps Furniture Tables, chairs, desks, sofas, blinds, carpets Insulation Glass fibre, mineral wool, purlboard, breather paper Cement Render, cement, fibre cement sheets, mortar Hazardous Paint pots, creosoted timber, asbestos, radioactive waste, bituminous mixtures with coal
tar Timber, plasterboard and packaging are typically the main Waste Recovery Quick Wins for a range of projects – primarily during the structural, internal and fit out phases. This is due to:
the quantities of these wastes generated (see Section 4); and
the significant increase in recovery rate from standard to good practice.
However, these Waste Recovery Quick Wins may not represent the best opportunities on all projects. It is therefore important on any project to consider all waste streams for their potential for Quick Wins (Section 3.2). 3.3.1 Timber Timber recovery is a major opportunity at the structural phase because of the quantity of form-work and shuttering produced. The nature of this material (its bulk, potential to be recycled and waste quantity) makes it worthwhile to target and manage through segregation and specialist recovery contracts (Section 6). For example, the project identified a Quick Win of 90% for timber in the structural phase compared with standard practice of 57%. The case studies achieved an average recovery rate of 82% (Section 7). Mixed skips can often contain 70–90% timber. In one case study, mixed rates were being charged for skips that contained all 100% timber. Timber has significant Quick Win potential because:
there are potential cost savings through segregation with rebates paid by waste management contractors;
it can be segregated from the structural phase onwards; and
structural phases often provide particularly good recovery rates due to the large sections of formwork
produced.
3.3.2 Plasterboard Through careful targeting and management, plasterboard presents major opportunities for improved levels of waste recovery, particularly at the internal and fit out phases; Waste Recovery Quick Wins of 90% for plasterboard compared with standard practice of 30% were identified. Plasterboard makes a good Quick Win because:
it can be targeted and segregated at specific phases of the project; and
there are specialist services provided by a number of companies (including British Gypsum) plus a range of
smaller scale operators and schemes, which support the segregation of plasterboard.

Improving recovery rates without increasing costs 12
The best practice recovery rate for plasterboard of 95% (Table 3) reflects the understanding obtained during this study of how much technology developments and improvements in behaviour could deliver improved results compared with good practice. In fact, four of the case studies9 (see Section 7) achieved 100% recovery of plasterboard. This success was obtained by setting up a separate collection system for waste plasterboard for particular phases of the project and arranging for the collected materials to be sent to a specialist plasterboard recycling facility. Such systems are efficient and capable of achieving 100% recovery if managed properly and utilised by all workers on site. Although the charges are generally higher (and may incur a premium) compared with those of waste management contractors, there are overall cost savings if significant amounts of plasterboard waste are generated during a particular phase. The savings also depend on the contract negotiated. 3.3.3 Packaging Packaging is a Quick Win mainly from the internal and fit out phases where it forms a significant proportion of the waste produced and presents a major opportunity for improved levels of waste recovery. A good practice recovery rate of 85% for packaging compared with standard practice of 60% is considered achievable; 90% and 80% of packaging waste was recovered in two case studies. The choice of packaging as a Quick Win depends on having sufficient materials to justify the effort involved to manage the waste stream separately (e.g. there is enough waste to fill a skip). Materials handling can be improved by:
using a compactor or baler on site to reduce volumes for storage and transportation; and
using enclosed containers to prevent materials ‘blowing’ away.
Rebates may be offered if paper and cardboard packaging is separated out. 3.3.4 Other materials Table 3 shows good practice and best practice levels of 100% for metals. This reflects the already high levels of recovery being achieved in the construction industry as a whole (as demonstrated in the case studies); standard practice is 95%. Coupled with the high market values for metals, close to 100% recovery is a reasonable level for both Waste Recovery Quick Wins (good practice) and best practice (100% is used for simplicity in Table 3). Similarly, the development of the recycled aggregates market (with procurement, policy, standards and specifications evolving to support this) suggests that high levels of recovery are possible for ceramic and concrete wastes – either on site or in a local market. The reuse of 100% of ceramics and concrete wastes has been demonstrated on a number of projects across the UK.10 The good practice and best practice recovery rates of 95% and 100% respectively for concrete, and 85% and 100% for ceramics, shown in Table 3 reflect the existing and potential marketplace. These levels were demonstrated to be achievable in the case studies. The project identified standard practice as 75%. Opportunities for the recovery of inert materials have developed in a similar fashion to concrete and masonry materials; standard practice is also 75%. This is because:
high tonnages of inert materials are generated – primarily during the site clearance and structural phases (in
infrastructure projects, inert materials can comprise up to 70% of the waste stream at this point);
they are already segregated at many sites, often for reuse on site; and
unlike plasterboard, there is no shortage of reprocessors handling inert materials.
The good practice and best practice recovery levels shown in Table 3 are 95% and 100% respectively for inert materials. None of these materials is likely to be a Waste Recovery Quick Win – the gap between standard and good practice is too low to achieve significant additional savings without incurring extra costs. However, this is only
9 Case Study 2: Quick Win opportunities in mixed commercial development; Case Study 4: Quick Win opportunities in commercial refurbishment; Case Study 9: Quick Win opportunities in high density housing development; Case Study 10: Quick Win opportunities in housing development
10 As shown in AggRegain (www.aggregain.org.uk).

Improving recovery rates without increasing costs 13
true for the projects already achieving standard practice. In addition, maintaining this rate of recovery is vital and any improvement towards best practice will bring further benefits. Recovery of liquids and oils is already 100%; it is cheaper to collect them for recovery than to pay for their disposal. The recovery rates given in Table 3 for plastics, electrical equipment, furniture, insulation, cement and hazardous reflect the particular and differing circumstances associated with these waste streams. However, these materials may form Waste Recovery Quick Wins for some projects if the criteria for selection are met (see Section 3.2) – primarily that sufficient quantities are produced to merit segregation. In addition, segregation of miscellaneous wastes (mixed waste) (see Section 6.3) offers significant opportunities to increase recovery rates of these wastes and reduce disposal costs. 3.4 Financial benefits of Waste Recovery Quick Wins The identification, targeting and delivery of Waste Recovery Quick Wins can result in significant cost savings. For example, Table 5 shows that potential cost savings for a £150 million city centre development incorporating retail, commercial, leisure and residential. The project already makes savings of over £160,000 from recovering excavated soil, but adopting good practice could result in further savings approaching £100,000 The case studies developed during this project also demonstrate the cost savings available from adopting Waste Recovery Quick Wins. These case studies are available separately from WRAP (www.wrap.org.uk/construction).
Table 5 Example savings from a development project by adopting good and best practice recovery
Project savings
Material Practice Recycling rate
(with source segregation) Tonnes diverted from landfill
Potential cost savings
Current 0% 0 £0 Good 70% 575 £27,200 Concrete Best 100% 822 £38,800
Current 0% 0 £0 Good 93% 176 £14,300 Metal Best 100% 189 £15,400
Current 0% 0 £0 Good 70% 120 £15,100 Timber Best 90% 155 £19,400
Current 0% 0 £0 Good 60% 122 £33,800 Packaging Best 95% 194 £53,600
Current Good Excavated soil Best
95% 84,075 Current Practice
saving £168,200
Current 0% 0 £0 Good 30% 44 £3,000 Canteen waste Best 80% 118 £7,900
Current 0% Good 80% Plasterboard Best 100%
n/a n/a
Current Practice 84,075 £168,200 Good Practice Saving
(above current practice) 1,037 £93,400
SUMMARY TOTAL
Best Practice Savings (above good practice)
441 £41,700
Improving recovery rates without increasing costs 14
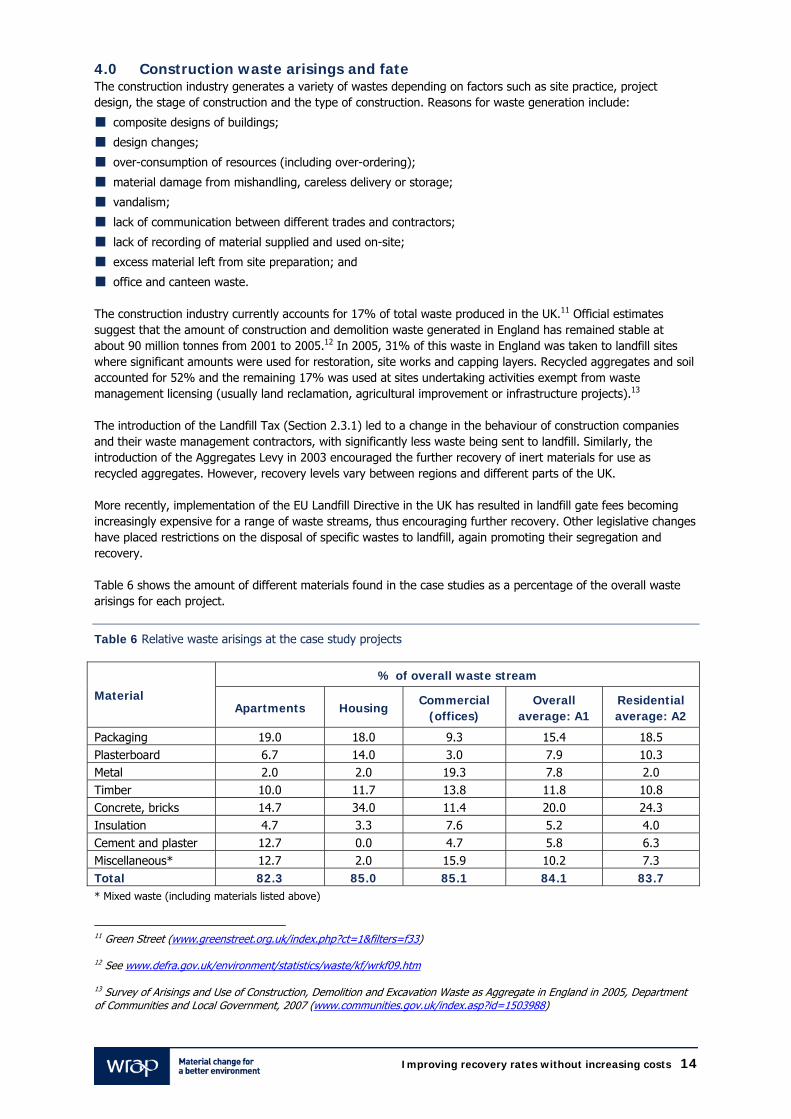
4.0 Construction waste arisings and fate The construction industry generates a variety of wastes depending on factors such as site practice, project design, the stage of construction and the type of construction. Reasons for waste generation include:
composite designs of buildings;
design changes;
over-consumption of resources (including over-ordering);
material damage from mishandling, careless delivery or storage;
vandalism;
lack of communication between different trades and contractors;
lack of recording of material supplied and used on-site;
excess material left from site preparation; and
office and canteen waste.
The construction industry currently accounts for 17% of total waste produced in the UK.11 Official estimates suggest that the amount of construction and demolition waste generated in England has remained stable at about 90 million tonnes from 2001 to 2005.12 In 2005, 31% of this waste in England was taken to landfill sites where significant amounts were used for restoration, site works and capping layers. Recycled aggregates and soil accounted for 52% and the remaining 17% was used at sites undertaking activities exempt from waste management licensing (usually land reclamation, agricultural improvement or infrastructure projects).13 The introduction of the Landfill Tax (Section 2.3.1) led to a change in the behaviour of construction companies and their waste management contractors, with significantly less waste being sent to landfill. Similarly, the introduction of the Aggregates Levy in 2003 encouraged the further recovery of inert materials for use as recycled aggregates. However, recovery levels vary between regions and different parts of the UK. More recently, implementation of the EU Landfill Directive in the UK has resulted in landfill gate fees becoming increasingly expensive for a range of waste streams, thus encouraging further recovery. Other legislative changes have placed restrictions on the disposal of specific wastes to landfill, again promoting their segregation and recovery. Table 6 shows the amount of different materials found in the case studies as a percentage of the overall waste arisings for each project.
Table 6 Relative waste arisings at the case study projects
% of overall waste stream
Material Apartments Housing
Commercial (offices)
Overall average: A1
Residential average: A2
Packaging 19.0 18.0 9.3 15.4 18.5 Plasterboard 6.7 14.0 3.0 7.9 10.3 Metal 2.0 2.0 19.3 7.8 2.0 Timber 10.0 11.7 13.8 11.8 10.8 Concrete, bricks 14.7 34.0 11.4 20.0 24.3 Insulation 4.7 3.3 7.6 5.2 4.0 Cement and plaster 12.7 0.0 4.7 5.8 6.3 Miscellaneous* 12.7 2.0 15.9 10.2 7.3 Total 82.3 85.0 85.1 84.1 83.7 * Mixed waste (including materials listed above)
11 Green Street (www.greenstreet.org.uk/index.php?ct=1&filters=f33)
12 See www.defra.gov.uk/environment/statistics/waste/kf/wrkf09.htm
13 Survey of Arisings and Use of Construction, Demolition and Excavation Waste as Aggregate in England in 2005, Department of Communities and Local Government, 2007 (www.communities.gov.uk/index.asp?id=1503988)

Improving recovery rates without increasing costs 15
Table 6 suggests that the top five waste streams in terms of volume are:
Residential – concrete/ bricks, packaging, timber, plasterboard and mixed waste; and
Commercial – metals, timber, mixed waste, concrete/bricks, packaging
A recent study for WRAP by AMA Research examined information on construction waste arisings from a number of independent studies from a range of housing, apartment and office developments. Table 7 shows that the largest waste streams by volume are masonry, packaging, timber and plasterboard. Figures by weight based on 2000 data indicate waste arisings are dominated by heavier waste streams such as masonry and metals.14 Masonry, timber, packaging and plasterboard also featured as the largest waste streams in a study by the Environment Agency (Figure 3).
Table 7 Main waste streams by volume on traditional new builds
Waste material Modal range (%)
Broken bricks, blocks , tiles, etc. 25–40 Packaging (including wood pallets, plastic, cardboard, tins) 25–35 Timber (excluding pallets) 15–25 Plasterboard 5–36 Cement and plaster 10–17 Insulation – rockwool and fibreglass 6–15 Metal 3–9 Dry concrete products – blocks, slabs, etc. 2–12 Plastic products (excludes packaging) 1–11 Ceramic material 1–8 Source: AMA Research for WRAP, unpublished report 2006
Figure 3 What the construction industry throws away
33%
26%
18%
10%
3%
10%
Bricks and blocksTimberPackagingPlasterboardMetalsOther
Source: Environment Agency (as cited in Target: Zero, Wates Group, 2006; www.wates.co.uk/uploads/pdfs/Corporate%20Responsibililty/Target%20Zero%20Landfil%20Report.pdf)
14 Sustainable Construction – The Data, BRE, 2000 (http://projects.bre.co.uk/sustainable/SusConstructionData.pdf)
Improving recovery rates without increasing costs 16
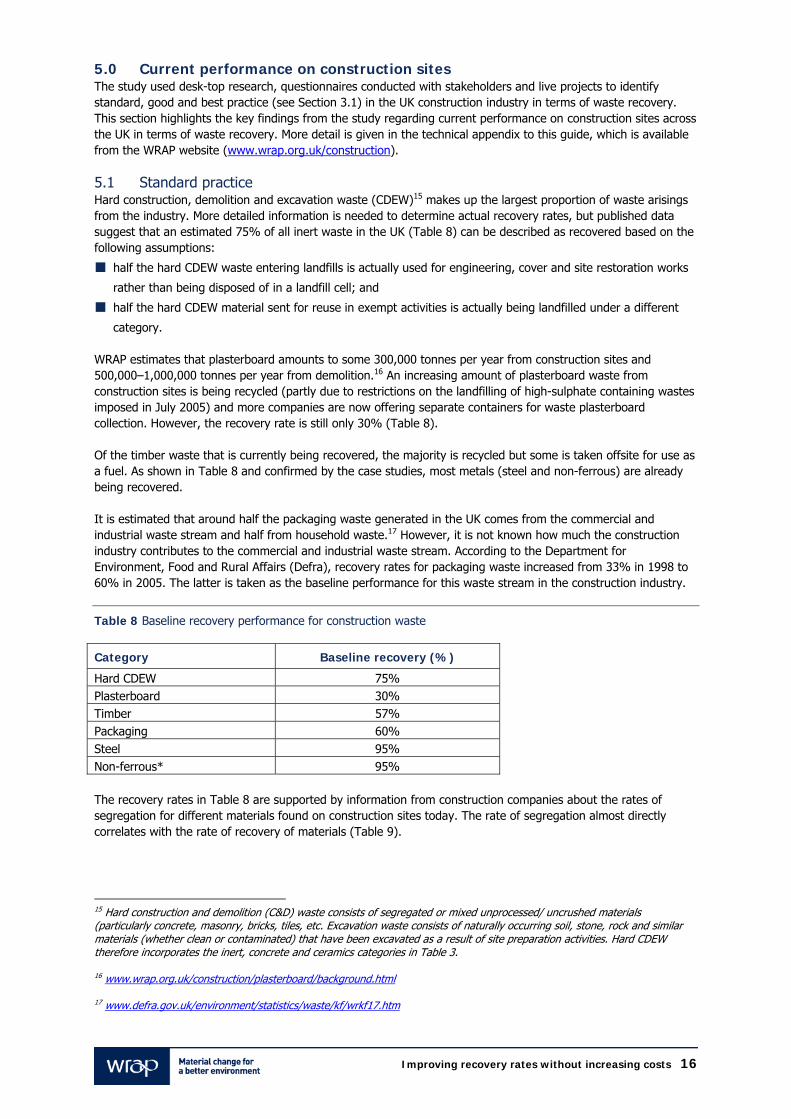
5.0 Current performance on construction sites The study used desk-top research, questionnaires conducted with stakeholders and live projects to identify standard, good and best practice (see Section 3.1) in the UK construction industry in terms of waste recovery. This section highlights the key findings from the study regarding current performance on construction sites across the UK in terms of waste recovery. More detail is given in the technical appendix to this guide, which is available from the WRAP website (www.wrap.org.uk/construction). 5.1 Standard practice Hard construction, demolition and excavation waste (CDEW)15 makes up the largest proportion of waste arisings from the industry. More detailed information is needed to determine actual recovery rates, but published data suggest that an estimated 75% of all inert waste in the UK (Table 8) can be described as recovered based on the following assumptions:
half the hard CDEW waste entering landfills is actually used for engineering, cover and site restoration works
rather than being disposed of in a landfill cell; and
half the hard CDEW material sent for reuse in exempt activities is actually being landfilled under a different
category.
WRAP estimates that plasterboard amounts to some 300,000 tonnes per year from construction sites and 500,000–1,000,000 tonnes per year from demolition.16 An increasing amount of plasterboard waste from construction sites is being recycled (partly due to restrictions on the landfilling of high-sulphate containing wastes imposed in July 2005) and more companies are now offering separate containers for waste plasterboard collection. However, the recovery rate is still only 30% (Table 8). Of the timber waste that is currently being recovered, the majority is recycled but some is taken offsite for use as a fuel. As shown in Table 8 and confirmed by the case studies, most metals (steel and non-ferrous) are already being recovered. It is estimated that around half the packaging waste generated in the UK comes from the commercial and industrial waste stream and half from household waste.17 However, it is not known how much the construction industry contributes to the commercial and industrial waste stream. According to the Department for Environment, Food and Rural Affairs (Defra), recovery rates for packaging waste increased from 33% in 1998 to 60% in 2005. The latter is taken as the baseline performance for this waste stream in the construction industry.
Table 8 Baseline recovery performance for construction waste
Category Baseline recovery (%)
Hard CDEW 75% Plasterboard 30% Timber 57% Packaging 60% Steel 95% Non-ferrous* 95% The recovery rates in Table 8 are supported by information from construction companies about the rates of segregation for different materials found on construction sites today. The rate of segregation almost directly correlates with the rate of recovery of materials (Table 9).
15 Hard construction and demolition (C&D) waste consists of segregated or mixed unprocessed/ uncrushed materials (particularly concrete, masonry, bricks, tiles, etc. Excavation waste consists of naturally occurring soil, stone, rock and similar materials (whether clean or contaminated) that have been excavated as a result of site preparation activities. Hard CDEW therefore incorporates the inert, concrete and ceramics categories in Table 3.
16 www.wrap.org.uk/construction/plasterboard/background.html
17 www.defra.gov.uk/environment/statistics/waste/kf/wrkf17.htm

Improving recovery rates without increasing costs 17
Table 9 Correlation of segregation with recovery rates*
High segregation Low segregation High levels of recovery Low levels of recovery
Inert Insulation Metals Insulation Metals Packaging Inert Furniture Ceramics Plastics Concrete Packaging Concrete Electrical equipment Ceramics Electrical equipment Timber Furniture Timber Liquids & oils/Hazardous Liquids & oils * Order of materials provides an indicative ranking Some materials (e.g. metals) had high levels of segregation and recycling (≥70%) across all construction types, except for refurbishment where there was often a large variation in practices. Some sites achieved 100% recovery for metals with, as a minimum, a general skip for mixed waste and segregated skips for metals, inert and hazardous wastes. This practice reduced costs by 30% and reduced the amount of waste going to landfill. Other sites achieved 30–85% metal recovery from mixed waste skips, with lower rates from refurbishment projects where it is harder to separate materials. Inert materials in new build projects were another waste stream where recovery practices varied. Some sites segregated 100% of excavation and hard construction wastes for reuse on site because the high tonnages (and therefore costs) gave an incentive to manage the material on site. Other sites cited staff/time pressures as the main reason for sending 100% of hard construction waste off site for reprocessing with 100% of clays sent to landfill (often for site restoration, cover applications). Space limitations on some sites led to segregation of only 40% of hard construction waste (50% reprocessed and 50% sent to landfill). The main reason given in the study for recovering relatively high levels of a material was cost (i.e. cheaper to recover than send to landfill). Lower recovery rates related to the state of development of the markets for those materials. While numerous outlets are available for some materials (e.g. metals and inerts), markets for materials such as timber, plastics and paper are less lucrative with fewer processing opportunities and less local outlets. Another common factor prompting the adoption of segregation for a particular waste stream was when there was enough material to merit this. This applied to:
plastics;
cement (as part of the inert waste stream);
ceramics (bricks);
electrical equipment; and
plasterboard.
The high disposal cost of hazardous waste was cited as the main reason for its segregation. Most construction sites have only mixed waste skips. Segregation takes place on occasions when space permits or when other drivers such as cost (e.g. large volumes of inert waste) provide an incentive. Waste on city centre sites is often not segregated as standard due to lack of space for skips and time restrictions which means that mixed skips are preferred during the structural phase. Infrastructure projects are more likely to have space for skips for different materials. Some sites already have SWMPs and some use an audit tool to monitor waste. However, many projects do not allocate time for either segregation or crushing and reuse on site. Sub-contractors have a tendency not to make full use of skips and to leave waste lying around. The largest tonnage of waste is produced during site clearance (particularly for new build projects) and this phase is when some of the highest recovery rates occur for some materials (e.g. cement/inert materials). Because the largest number of different waste streams is produced during fit out, material skips are more likely to be found during this phase as they are able to remain in one place for longer than during other phases such as structural when skips have to be moved regularly to suit site work.

Improving recovery rates without increasing costs 18
Waste management companies consulted during the study generally concurred with the information provided by the construction companies regarding segregation. They stated that the lowest rates of recovery were obtained for:
plasterboard;
insulation;
miscellaneous;
furniture; and
some plastics, packaging and rubber.
5.2 Good practice Examples of good practice identified during the study include:
development and implementation of a Site Waste Management Plan;
use of spreadsheets and other waste management tools to record waste quantities (totals) and percentage
recycled;
toolbox talks to staff to raise awareness of waste and to provide training on waste management practices;
waste segregation at all sites (space permitting);
use of Waste Aware Construction18 colour coding for mixed, plasterboard, metal, timber and packaging skips;
phasing of waste segregation with other demolition activities to create additional space for material skips;
identifying a waste stream with large volumes that could potentially be segregated (e.g. plasterboard) or one
for which the company might receive payment or be picked up free (e.g. metals);
segregation of all inerts and concrete for reuse on site;
ensuring project timeframes allowed time for on site crushing/ reuse/ segregation;
segregation of metals and timber for off site reprocessing;
segregation of waste during cladding and fit out phases when there is more chance to collect waste at the
point of creation (skips need to be moved less often);
operating a three skip system (general, inerts and metals), leading to 100% recycling of inerts and metals;
packaging waste targeted at the fit out phase (when amount increases);
compacted skip (packaging/plastics) or 6 cu. yd skip (plasterboard) brought on site if enough packaging/
plastic/ plasterboard waste generated during the fit out phase;
segregation of timber during the structural phase if there is local recycling infrastructure;
identifying local waste companies/ processors that may offer a rebate for segregated skips;
using a local waste transfer station providing high levels of segregation;
minimising the number of waste streams in the mixed waste skip;
accumulating waste at sites where space constraints mean there is a one skip system until there is enough to
fill a segregated skip; and
appointing a waste management contractor(s) committed to recovering a broad range of materials.
The case studies highlighted opportunities for improved recovery based on increased segregation, making use of the services available from waste contractors and local facilities (e.g. waste transfer sites) (Table 10).
18 www.wasteawareconstruction.org.uk

Improving recovery rates without increasing costs 19
Table 10 Material-specific potential savings from the case studies by adopting good practice Case study
Additional material recovery potential
Cost saving Description
1 Plasterboard – 15%, Timber and miscellaneous – 50%
25% by skip Segregation in this project could involve two materials (maximum) stored in each skip.
2 Miscellaneous – 50% Timber – 10% Packaging – 5%
20% by skip Target miscellaneous waste (biggest waste stream) and reclassify some materials to other headings where high recovery rates are proven. As above for Case Study 1.
3 Timber – 45% Miscellaneous – 50% Packaging – 5% (concrete 100% recovered)
Concrete – possible savings 20% by skip
Increase quality of source-segregated concrete by minimising contamination with other materials. Ensure waste contractor recovers timber as part of service provision and that timber is not landfilled directly.
4 Metals – 5% Subject to contract negotiations
Segregate metals during phases when this is a major component of the waste stream. Could be stored with one other material.
5 Metals – 10% Metal: possible revenue credit or scrap value
Segregate metals, packaging and plastics during phases when a major component of the waste stream.
6 Packaging, timber and metals – 11%
Metal: 15–33% saving Timber: 15–23% saving Metals: 15–50% plus revenue from re sale
Segregate packaging, timber and metals during phases when this is a major component of the waste stream. Could be stored with one other material.
7 Concrete – 15% Ceramics – 5% Miscellaneous – 15%
5% saving Segregate during phases when this is a major component of the waste stream. Could be stored with one other material.
8 Inert – 5% Miscellaneous – 50%
5% saving Seek to define miscellaneous wastes more accurately. More segregation of inert wastes.
9 Packaging, ceramics – 15% Plastics – 10%
Possible savings Segregate during phases when a major component of the waste stream. Could be stored with one other material.
10 Packaging – 10% Plastics – 5% Miscellaneous – 50%
Possible savings Segregate packaging & plastics during phases when this is a major component of the waste stream. Could be stored with one other material. Seek to recover materials misallocated.
11 Inert – 85%, Ceramics – 9% Plasterboard – 14%
Subject to contract negotiations, but possible savings
Prioritise recovery of inert materials. Segregate plasterboard, ceramics, packaging (fit out) and concrete (structural) when a major component of the waste stream. Seek to recover materials misallocated.
5.3 Best practice General actions and measures to deliver best practice identified by the study include:
adoption of Site Waste Management Plans coupled with training of staff to achieve effective implementation;
development and use of audit/resource efficiency tools to monitor waste arisings and track material usage in
the construction process;
development of distribution centres for materials to improve the effectiveness of waste recovery;
Improving recovery rates without increasing costs 20
on site consolidation centres to eliminate damage to products brought on site, minimise packaging waste and
prevent the loss of materials on site;
use of new construction techniques such as Modern Methods of Construction (MMC),19 which can reduce on
site construction time and waste but have comparable costs to traditional build;
greater use of offsite build practices to minimise waste generated on site;
changes to material procurement practices to buy material in sizes that minimise waste on site (e.g. use of
plasterboard in smaller sections instead of larger sections that are more prone to damage); and
greater use of compactors on site or compactor vehicles to minimise vehicle movements associated with
uncompacted, higher volume waste.
Implementation of segregation may require a combination of additional time, training, innovation and capital investment. Practices to support the effectiveness of segregation include:
determining whether crushing and reuse of materials on site is possible before the project begins and allow
sufficient time for this to happen;
overcoming issues related to lack of space for segregating waste by phasing segregation with phases where
additional space may become available (e.g. post-structural phases where floor slabs are in place and
additional space may be available);
identifying one high-volume material to segregate or segregate high value materials where a rebate can be
negotiated (e.g. ferrous and non-ferrous metals, timber and paper); and
obtaining support from waste management companies for the use of colour coded skips together with on site
training on waste segregation (colour-codes magnetic stick-on labels are one option if colour-coded skips pose
problems with multiple contractors employing different colours – a problem that can be overcome by using
the Waste Aware Construction system).
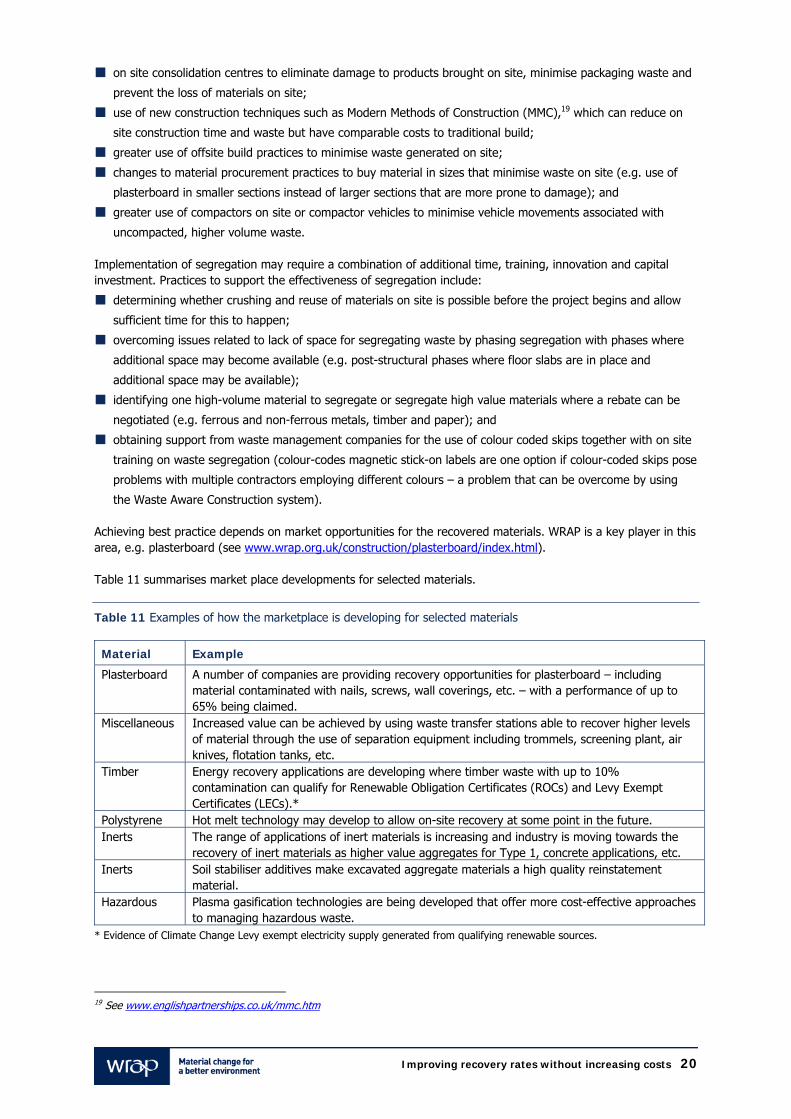
Achieving best practice depends on market opportunities for the recovered materials. WRAP is a key player in this area, e.g. plasterboard (see www.wrap.org.uk/construction/plasterboard/index.html). Table 11 summarises market place developments for selected materials.
Table 11 Examples of how the marketplace is developing for selected materials
Material Example
Plasterboard A number of companies are providing recovery opportunities for plasterboard – including material contaminated with nails, screws, wall coverings, etc. – with a performance of up to 65% being claimed.
Miscellaneous Increased value can be achieved by using waste transfer stations able to recover higher levels of material through the use of separation equipment including trommels, screening plant, air knives, flotation tanks, etc.
Timber Energy recovery applications are developing where timber waste with up to 10% contamination can qualify for Renewable Obligation Certificates (ROCs) and Levy Exempt Certificates (LECs).*
Polystyrene Hot melt technology may develop to allow on-site recovery at some point in the future. Inerts The range of applications of inert materials is increasing and industry is moving towards the
recovery of inert materials as higher value aggregates for Type 1, concrete applications, etc. Inerts Soil stabiliser additives make excavated aggregate materials a high quality reinstatement
material. Hazardous Plasma gasification technologies are being developed that offer more cost-effective approaches
to managing hazardous waste. * Evidence of Climate Change Levy exempt electricity supply generated from qualifying renewable sources.
19 See www.englishpartnerships.co.uk/mmc.htm
Improving recovery rates without increasing costs 21
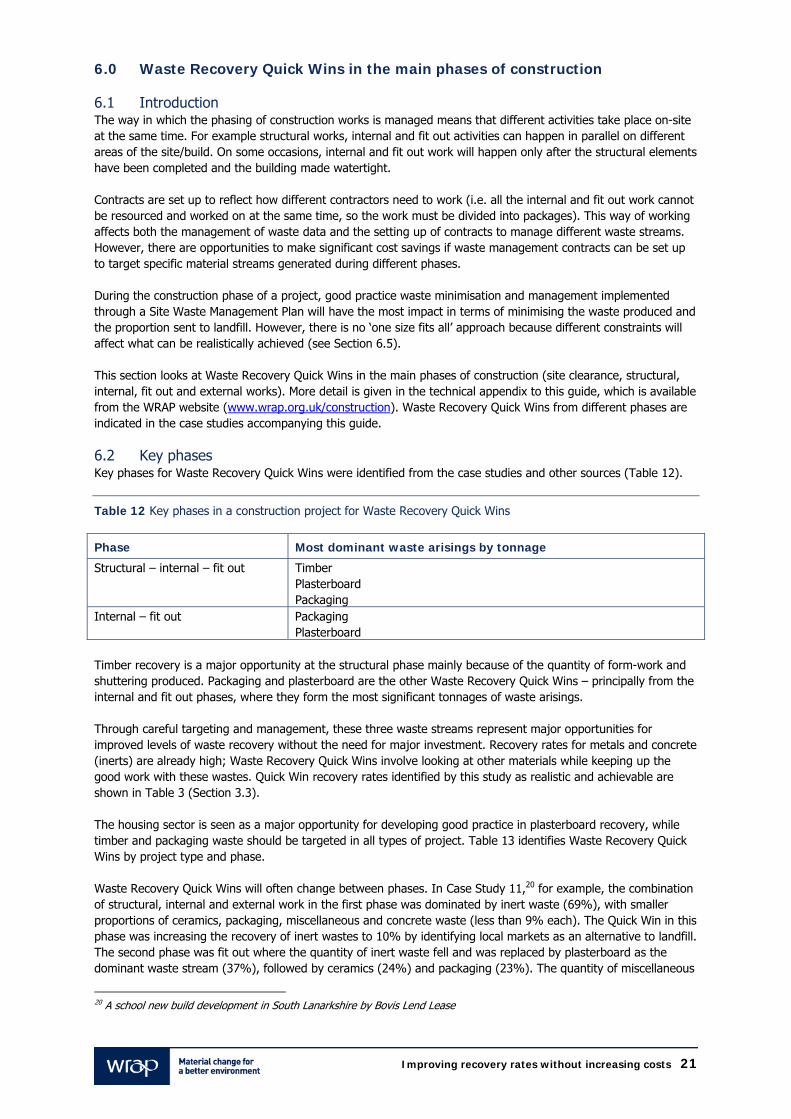
6.0 Waste Recovery Quick Wins in the main phases of construction 6.1 Introduction The way in which the phasing of construction works is managed means that different activities take place on-site at the same time. For example structural works, internal and fit out activities can happen in parallel on different areas of the site/build. On some occasions, internal and fit out work will happen only after the structural elements have been completed and the building made watertight. Contracts are set up to reflect how different contractors need to work (i.e. all the internal and fit out work cannot be resourced and worked on at the same time, so the work must be divided into packages). This way of working affects both the management of waste data and the setting up of contracts to manage different waste streams. However, there are opportunities to make significant cost savings if waste management contracts can be set up to target specific material streams generated during different phases. During the construction phase of a project, good practice waste minimisation and management implemented through a Site Waste Management Plan will have the most impact in terms of minimising the waste produced and the proportion sent to landfill. However, there is no ‘one size fits all’ approach because different constraints will affect what can be realistically achieved (see Section 6.5). This section looks at Waste Recovery Quick Wins in the main phases of construction (site clearance, structural, internal, fit out and external works). More detail is given in the technical appendix to this guide, which is available from the WRAP website (www.wrap.org.uk/construction). Waste Recovery Quick Wins from different phases are indicated in the case studies accompanying this guide. 6.2 Key phases Key phases for Waste Recovery Quick Wins were identified from the case studies and other sources (Table 12).
Table 12 Key phases in a construction project for Waste Recovery Quick Wins
Phase Most dominant waste arisings by tonnage
Structural – internal – fit out Timber Plasterboard Packaging
Internal – fit out Packaging Plasterboard
Timber recovery is a major opportunity at the structural phase mainly because of the quantity of form-work and shuttering produced. Packaging and plasterboard are the other Waste Recovery Quick Wins – principally from the internal and fit out phases, where they form the most significant tonnages of waste arisings. Through careful targeting and management, these three waste streams represent major opportunities for improved levels of waste recovery without the need for major investment. Recovery rates for metals and concrete (inerts) are already high; Waste Recovery Quick Wins involve looking at other materials while keeping up the good work with these wastes. Quick Win recovery rates identified by this study as realistic and achievable are shown in Table 3 (Section 3.3). The housing sector is seen as a major opportunity for developing good practice in plasterboard recovery, while timber and packaging waste should be targeted in all types of project. Table 13 identifies Waste Recovery Quick Wins by project type and phase. Waste Recovery Quick Wins will often change between phases. In Case Study 11,20 for example, the combination of structural, internal and external work in the first phase was dominated by inert waste (69%), with smaller proportions of ceramics, packaging, miscellaneous and concrete waste (less than 9% each). The Quick Win in this phase was increasing the recovery of inert wastes to 10% by identifying local markets as an alternative to landfill. The second phase was fit out where the quantity of inert waste fell and was replaced by plasterboard as the dominant waste stream (37%), followed by ceramics (24%) and packaging (23%). The quantity of miscellaneous
20 A school new build development in South Lanarkshire by Bovis Lend Lease

Improving recovery rates without increasing costs 22
waste also increased during fit out. Waste Recovery Quick Wins for this phase were therefore plasterboard (through improved segregation), ceramics and packaging.
Table 13 Material specific good practice by project type Project type Phase Materials
(top 3)* Description
Housing All Timber Packaging Plasterboard
100% recovered from segregated containers. Segregate when major component of the waste stream. 100% recovered from segregated containers.
High density housing
Internal/ fit out Plasterboard Packaging Plastics
100% recovered from segregated containers. Packaging and plastics – segregate when major component of the waste stream.
Commercial new build
Structural/ internal
Plasterboard Timber Plastics
All – segregate when major component of the waste stream.
Structural/ fit out Miscellaneous Timber Packaging
Seek to recover materials reallocated. Timber and packaging – segregate when major component of the waste stream.
Commercial refurbishment
Site clearance/ structural
Concrete Inert Timber
Minimise contamination. 100% recovered. Ensure waste contractor recovers timber as part of service.
Fit out Plasterboard Metals Packaging
100% recycled from segregated containers. Segregate when major component of the waste stream. 95% recovered from mixed containers.
Structural/ internal
Timber Concrete Ceramics
All – segregate when major component of the waste stream.
Retail new build
Internal/ fit out/ external
Packaging Plasterboard Timber
Segregate when major component of the waste stream. 90% recovered from mixed containers. 90% recovered from mixed containers.
Public new build
Internal Plasterboard Metals Packaging
>90% recovered from mixed containers. Segregate when major component of the waste stream. Segregate when major component of the waste stream.
Structural/ internal/ fit out/ external
Inert Plasterboard Ceramics
85% recovered from segregated containers. Segregate when major component of mixed stream. Segregate when major component of mixed stream.
Public refurbishment
Structural/ fit out Packaging Timber Metals
All – segregate when major component of the waste stream.
* Materials are listed in order of priority The highest tonnages of waste materials are produced during the site clearance phase. These materials should be targeted for recovery and recycling. Other key measures include:
Structural phase. Replace mixed skips with segregated skips for at least the top one or two materials (e.g.
timber, metals) in terms of volumes produced and recovery potential.
Fit out. Use smaller containers in this phase if there are space restrictions. Adopt separate skips for different
materials as the skips are more likely to stay put during this phase (unlike phases such as the structural phase
where the rate of development means skips have to be moved regularly).
Infrastructure. Use separate skips for recyclable materials such as plastics and packaging, which have
recovery potential if segregated.
Table 14 suggests opportunities for Waste Recovery Quick Wins, highlighting the actions to be taken during different phases. Detailed guidance on how to improve material recovery for different materials is available from the WRAP website (www.wrap.org.uk/construction).

Improving recovery rates without increasing costs 23
Table 14 Opportunities for Waste Recovery Quick Wins by material and phase
Material Action Phase
Plasterboard Segregate and recycle 80% of plasterboard generated. Use segregated bags provided by British Gypsum for direct collection from site. Adopt batch processes to avoid mixing with other materials in skips which could raise the disposal cost if skip
contains >10% plasterboard. Realise cost saving of 30% between segregated skip and mixed skip (based on 8 cu. yd skip). Implement Waste Aware Construction colour codes for different material skips. Segregate during fit out if enough material to fill a 6 cu. yd skip.
All except site clearance and external Target segregation during fit out Coded skips throughout project
Timber Segregate for close to 100% recycling and reclamation. Implement Waste Aware Construction colour codes for different material skips. Seek cost rebates for segregated timber.
All Fit out Coded skips throughout project
Packaging 100% segregate paper and card – can be baled for transport to paper processors. Implement Waste Aware Construction colour codes for different material skips. Cost rebates can be offered for segregated paper (reduced costs up front and payment made later). Target segregation of packaging waste at the fit out stage (higher level of packaging waste produced at this phase). Assess if sufficient material to fill a compacted skip during fit out. If so, then segregate.
All except site clearance Coded skips throughout project Target segregation during fit out
Metals Realise cost saving of 50% by using segregated skips instead of mixed skips (based on 8 cu. yd skip). Implement Waste Aware Construction colour codes for different material skips. Seek cost rebates for segregated metals (reduced costs up front and payment made later).
All Coded skips throughout project
Inert Segregate 100% from active waste and reuseon-site as recycled aggregates and soils. 100% recycle – markets include hardcore base for roads and pavements. Realise cost saving of 30% by using segregated skips instead of mixed skips (based on 8 cu. yd skip). Seek cost saving of £10/tonne if reused on-site.
Site clearance Structural
Ceramics 100% bricks to be segregated for recycling. Site clearance Structural
Concrete Segregate for 100% recycling. Site clearance Cement Realise cost saving of 30% between segregated skip and mixed skip (based on 8 cu. yd skip). Mainly site clearance and
structural Plastics Assess if sufficient material to fill a compacted skip during fit out. If so, then segregate. Target segregation during fit out Miscellaneous Audit the wastes likely to be classed as miscellaneous and prepare segregation recovery plan.
Audit residual wastes going to landfill and prepare improved recovery plan. Realise cost rebates for segregated paper.
All

Improving recovery rates without increasing costs 24
6.2.1 Differences between new build and refurbishment New build often takes place on brownfield sites, so there is often more waste to be managed during the site clearance phase than with refurbishment projects. However, because new builds are responsible for bringing all materials onto site, waste is more predictable, tends to be clean (i.e. not contaminated with nails/paint) and can be controlled better. Waste from refurbishment projects tends to be harder to recycle and segregate as its composition is more difficult to predict. For example, much of the material is composites which have fewer opportunities for segregation (e.g. painted surfaces or plaster and blockwork mixed together). There are fewer opportunities for segregation, or segregation is more difficult due to the additional effort required to separate out the different materials. Waste from refurbishment projects contains less inert materials and more soft materials such as packaging and cabling. On-site segregation can be more difficult as there is often less space for multiple skips for different materials. New build
Good practice: During the site clearance phase, where practicable reuse all appropriate material (i.e. non-
contaminated or remediated) on-site for landscaping/site fill.
Best practice: Introduce site management practices to control all materials coming onto site to minimise
waste (e.g. off-site manufacture or cut to size). This should be specified in contracts with sub-contractors.
Refurbishment
Good practice: If there is limited space for segregation, use waste contractors that offer a high level of
segregation. Some waste companies can achieve over 90% recovery from mixed wastes.
Good practice: Identify dominant materials through a pre-refurbishment audit (or Bill of Quantities). Provide
separate containers for only the top one or two materials to minimise disruption to current site practices and
pressure on restricted space.
Good practice: Applying design for deconstruction principles – while this may not help sites in the immediate
future this is a ‘good practice’ Quick Win that will help future refurbishment sites, while being able to
segregate waste materials more easily.
Best practice: Careful planning and company practices allow even sites with limited space to segregate waste.
Best practice: Site Waste Management Plans are compulsory on all sites.
6.3 The importance of segregation rather than mixed skips The production of waste at any stage of the construction process translates into extra costs and reduced profits for the client and the contractor. An average 8 cu. yd skip costs around £150, yet the average cost of its contents is over £1,200.21 Effective segregation of different waste materials is crucial for Waste Recovery Quick Wins. Use of separate skips for different waste streams rather than mixed skips makes it easier to recovery materials and thus reduces the hire cost of the skip as the value of its contents offsets some of the charge. The actual overall cost reduction will depend on the additional labour cost on site to manage the separate skips. However, labour costs would need to double before the cost benefits are wiped out (Table 15). Separate skips for different waste streams are particularly important for Waste Recovery Quick Wins in the structural, fit out and internal phases.
Table 15 Cost savings from replacing mixed skips with material specific skips
Scenario Cost saving (£/tonne) Percentage cost saving
Segregated 21.40 67% Segregated + 20% labour cost 19.28 60% Segregated + 100% labour cost 10.80 34%
21 The Small Environmental Guide for Construction Workers, SEPA and CIRIA (www.sepa.org.uk/pdf/publications/leaflets/wastemin/env_guide_cons_workers.pdf)

Improving recovery rates without increasing costs 25
While waste management companies are generally willing to provide separate skips, current practice on construction sites is to use mixed skips (see Section 5.1). However, the study findings emphasise the importance of segregation in boosting recovering rates and achieving cost savings. Greater application of the Waste Aware Construction colour-coded labelling on skips would help to rationalise skip colours and make skip management easier. Table 16 highlights the differences in cost between segregated and mixed skips. Skips can often be sourced for free if there is good local recycling infrastructure (e.g. one site identified by the study had four out of nine skips provided free).
Table 16 Difference in costs between segregated and mixed skips
Material Mixed costs* Segregated costs* Cost of disposal versus recovery
Ceramics General skip: £75/tonne Inert skip: £15/tonne Can be 40% cheaper.
£30/tonne more to dispose
Electrical equipment
Currently no major difference
Currently no major difference. Recovery costs: £250–300/tonne. Landfill costs are typically lower than this.
Inert General skip: £75/tonne Inert skip: £15/tonne Can be 40% cheaper.
Approx £10/tonne disposal. Can save £5/tonne by recycling. Can reuse on-site for free.
Metals General skip: £75/tonne, £110/skip†
50% cheaper to segregate. Skip can be provided free Can get paid (e.g. £70/tonne)†.
Can cost up to £80/tonne more to dispose.
Packaging General skip: £75/tonne, £110/skip†
Sometimes free. Depending on type but can be 20% cheaper to segregate.
Up to £40/tonne more to dispose.
Plastics General skip: £75/tonne, £110/skip†
Sometimes free. Depending on type but can be 20% cheaper to segregate.
Up to £40/tonne more to dispose.
Concrete General skip: £75/tonne Inert skip: £15/tonne Can be 40% cheaper.
Approx £10/tonne disposal. Can cost up to £60/tonne more to dispose.
Furniture General skip: £75/tonne Not segregated Limited market, and depends on type.
Insulation General skip: £75/tonne Not segregated Misc. General skip: £75/tonne,
£110/skip† n/a £75/tonne
Plasterboard General skip: £75/tonne Up to £120/tonne. Various estimates – some state more to dispose (£10/tonne more), others state more to recycle (no figure given).
Cement General skip: £75/tonne Inert skip: £15/tonne Can be 40% cheaper.
Approx £10/tonne disposal. Can cost up to £60/tonne more to dispose.
Timber General skip: £75/tonne £25/tonne Can be 40% cheaper.
Can cost up to £40/tonne more to dispose.
Liquid oils General skip: £75/tonne £1000/tonne Cheaper to recycle – exact figure not provided.
Hazardous General skip: £75/tonne £1000/tonne Cheaper to recycle – exact figure not provided.
* By tonne or based on 8 cu. yd skip. † Estimated costs based on more than one consultee (some responses were provided by skip and some by tonne). 6.4 Behaviour changes The key behavioural changes to support the Waste Recovery Quick Wins for each material identified by the study include:
adopting Site Waste Management Plans (see Section 6.4.1);

Improving recovery rates without increasing costs 26
establishing targets and key performance indicators (KPIs) (see Section 6.4.2);
planning ahead to consider waste arisings and opportunities for segregation during different phases (see
Section 6.4.3);
setting tender and contract requirements for the delivery of more segregated waste systems; and
appointing contractors who can work with segregation levels of ≥90%.
High recovery rates can still be achieved with mixed waste streams, although success will depend on the employment of suitable contractors. A further alternative is to incorporate improved waste recovery performance through an environmental management system (EMS). Waste impacts could be identified as key environmental aspects of the EMS, with objectives and target setting increased recovery and then forming a part of a delivery mechanism. 6.4.1 Implementing Site Waste Management Plans (SWMPs) A SWMP can be used to change site behaviour and reduce the quantity of waste being sent to landfill. The Plan could include:
measurement and monitoring of waste arisings and their fate;
tailoring of segregation for different phases of construction (e.g. inerts during the site clearance and
packaging and plasterboard during fit out).
use of Waste Awareness Construction colour codes for skips;
greater use of toolbox talks;
planning for the bulking up of wastes for their removal in larger containers to minimise vehicle movements
and reduce container costs; and
potential use of compactor trucks.
6.4.2 KPIs and targets Good practice WMM requires the agreement of targets using KPIs for the recovery of materials from the waste stream. For example, these targets could be based on the Quick Win recovery rates identified by this study (see Section 3.3) or on KPIs developed by the contractor from the lessons learnt from previous project reviews. The main contractor and sub-contractors should have a contractual obligation to meet these targets and KPIs. These enable performance to be monitored both during the construction phase and for different projects over a number of years, thus establishing trends and opportunities for improvement programmes. KPIs also allow a company to demonstrate that it is delivering good practice rather than standard practice. Data should be expressed in absolute terms, by tonnage, on quantities of materials with percentages provided on materials recovered and landfilled. The following types of target and KPIs, expressed in percentage terms, can be established:
recovery of waste materials for reuse and recycling – different target levels may be appropriate for
different phases of construction;
reuse of materials on-site – particularly relevant where large-scale demolition is included; and
reduction in tonnage of waste per unit of construction activity (evaluated as a continuous
improvement target) – if the designer and contractor identify specific areas to be targeted for improvement
(e.g. plasterboard and packaging waste), then specific targets can be agreed in these areas.
It is also possible to compare total waste quantities against the waste benchmark maintained by Constructing Excellence22 (i.e. the amount of waste including extracted material, demolition waste, etc.) in m2 removed from site during the construction process per £100,000 of project value. The measurement of ‘percentage recovery’ KPIs enables the performance to be compared between projects by clients and contractors. Performance indicators and benchmarks being developed by BRE under its SMARTWaste scheme will allow projects to be compared with industry benchmarks in the future.
22 www.constructingexcellence.org.uk

Improving recovery rates without increasing costs 27
George Wimpey has demonstrated the value in this approach (Table 17); a 5% increase in recycling was reported in 2005 compared with 2004, with 1% additional segregation (now at 84% of all wastes). In addition, George Wimpey has identified target savings of £1.2 million, with a programme implementation date of January 2007. Savings identified for 2006 totalled £300,000. Segregation of inert and active waste on site and a reduction in the total amount of waste taken off site are cited as the key actions to achieve this target.
Table 17 George Wimpey’s KPIs Key Performance Indicators 2003 2004 2005 Measure and reduce the tonnage of waste produced per unit of housing completed 9.7 9.6 7.0 Measure and increase the percentage of waste segregated on-site – 83% 84% Measure and reduce the percentage of waste sent to landfill – 35% 30% Measure and increase the percentage of waste recycled – 65% 70%
6.4.3 Planning ahead Planning for Waste Recovery Quick Wins involves the project team thinking ahead in terms of how behaviour (segregation, bin size, collection frequency, etc.) needs to change for different phases. The Site Waste Management Plan can then be shaped to reflect these considerations and requirements inserted as appropriate in the clauses of tenders and contracts. Such clauses recognise the importance of targeting material recovery at specific phases with targets set appropriately to deliver Waste Recovery Quick Wins. Managing Packaging Waste on your Construction Site (GG606)23 includes a Construction Packaging Waste Estimator – a spreadsheet designed to help estimate the weight and volume of packaging that will be created from a particular construction project. The tool is based on a set of predetermined levels of packaging for certain common construction projects. This information makes it easier to plan the delivery of improved recovery practices (e.g. when separate skips will be needed on-site to manage packaging waste). High rise or high density projects often have limited space for segregation, but targeting the key waste streams that arise across different project phases will help to maximise recovery. Production of a Site Waste Management Plan will improve understanding of how different phases provide specific opportunities for improved waste recovery practices. For example:
use skips during site excavation when there is more space but move to mixed containers during later phases;
use skips for the structural phase and smaller 660 litre and 360 litre containers for fit out;
use a combination of bins for different phases of refurbishment projects, including smaller containers for
higher levels and skip size that fit into available spaces;
identify areas for bins in high rise developments once the structure is up and the concrete beams and steel
flooring is in place; and
collect smaller containers daily to prevent double handling of wastes between containers and skips.
Other examples are given in the Case Studies available separately from WRAP. Where large quantities of concrete or inert waste are produced during the site clearance phase, one material may dominate the composition of a significant number of skips. But although a skip may contain only two or three waste streams, this does not necessarily mean each material will be subsequently segregated for recycling. For example, an aggregates processor collecting mixed skips may landfill the timber present, having little interest in recovering this material apart from removing it from the inert waste stream to improve the quality of the recycled aggregates. Consultation with waste management companies collecting inerts, concrete, bricks, etc. to produce recycled aggregates may increase the extent to which non-aggregate materials are segregated out of the collected waste for subsequent recovery. The alternative is to segregate timber and other materials from inert materials on-site. The site clearance phase provides opportunities for bulking and storing materials on-site until they can be collected in larger containers or 20-tonne trucks. The cost of employing a 20-tonne truck can vary between £30
23 Available from www.envirowise.gov.uk

Improving recovery rates without increasing costs 28
and £145 per movement (depending on the distances involved) compared with an 8 cu. yd skip costing around £128/skip for a three-tonne payload. The reduced prices offered by waste management companies for segregated skips are often based on a flat rate reduction in the costs depending on the type of materials involved. However, this will vary significantly depending on the materials, companies, locations, etc. In some cases, there is potential to generate revenue from sales of the recovered material (e.g. metals, paper, cardboard, timber). 6.5 Barriers and constraints to improved waste recovery It is thought that most construction sites currently collect waste in mixed skips due to four main barriers:
People – additional training of construction site staff is necessary and people do not make full use of skips;
Time – a lot of jobs need to be done quickly on construction sites so little time is allocated to recycling/
recovery/reuse of materials;
Money – perceived cost of recycling/ recovery; and
Facilities – lack of supporting recycling infrastructure.
In addition there are a number of important constraints which require attention (Table 18).
Table 18 Key constraints to achieving good practice
Constraint Implication Achieving good practice
Lack of a client requirement for good practice
The lack of a contractual obligation may not encourage the contractor to implement waste recovery.
Make contractor aware that undertaking more than standard practice is likely to achieve cost savings and more efficient site operations.
Space on-site Small sites and high density projects can have limited room for locate skips for different materials.
Target the key waste streams in each phase.
Place a requirement on the waste management contractor to segregate and recover materials off-site.
Adopt other segregation approaches such as smaller containers at each floor level.
Site location Difficult to find local recycling markets Appoint a waste management contractor who can provide a cost-effective recycling service.
Project type Some projects offer fewer opportunities for waste recovery than others.
Identify and focus on material streams that offer Waste Recovery Quick Wins.
Project timescales Projects with short lead-in periods, tight programmes and quick construction rates often overlook good practice.
Identify and focus on material streams that offer Waste Recovery Quick Wins.
Implement aspects of good practice shown to be effective during previous projects.
Establish partnerships with waste management contractors to undertake a greater role and thus remove effort from contractor and sub-contractors.
6.6 Moving to best practice The cost and other benefits of implementing and achieving Waste Recovery Quick Wins should provide an incentive to adopt best practice. Best practice, in terms of behaviour, can be considered to include:
enhanced Site Waste Management Plans (beyond the proposed current requirements), i.e. Materials Resource
Efficiency (MRE) Site Waste Management Plans which demonstrate innovation and highest possible recovery
rates;
improved working practices involving segregation of materials and use of innovative technologies;

Improving recovery rates without increasing costs 29
using tools to audit construction waste arisings; and
developing waste data collection and reporting protocols with waste management contractors in order to
establish recovery performance for all materials streams.
Unless waste is measured it cannot be managed effectively. Tools are needed that allow the prediction/ estimation of waste arisings and recovery rates, with the tonnages, fate and costs recorded as part of the process. Use of data collection and reporting protocols could add some initial costs but are likely to lead to reduced costs in the future as the practice becomes established and new, additional recovery opportunities are exploited. Section 5.3 outlines other best practice approaches and Table 19 summarises best practice opportunities for different materials by phase.
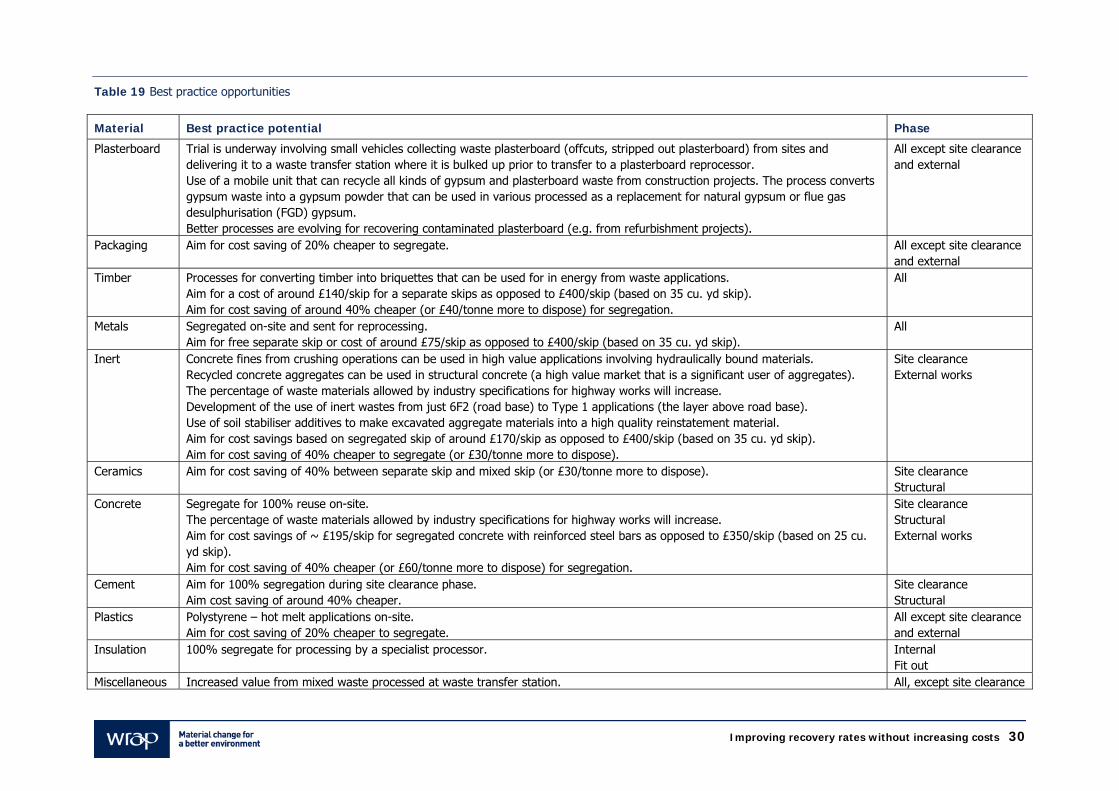
Improving recovery rates without increasing costs 30
Table 19 Best practice opportunities
Material Best practice potential Phase
Plasterboard Trial is underway involving small vehicles collecting waste plasterboard (offcuts, stripped out plasterboard) from sites and delivering it to a waste transfer station where it is bulked up prior to transfer to a plasterboard reprocessor. Use of a mobile unit that can recycle all kinds of gypsum and plasterboard waste from construction projects. The process converts gypsum waste into a gypsum powder that can be used in various processed as a replacement for natural gypsum or flue gas desulphurisation (FGD) gypsum. Better processes are evolving for recovering contaminated plasterboard (e.g. from refurbishment projects).
All except site clearance and external
Packaging Aim for cost saving of 20% cheaper to segregate. All except site clearance and external
Timber Processes for converting timber into briquettes that can be used for in energy from waste applications. Aim for a cost of around £140/skip for a separate skips as opposed to £400/skip (based on 35 cu. yd skip). Aim for cost saving of around 40% cheaper (or £40/tonne more to dispose) for segregation.
All
Metals Segregated on-site and sent for reprocessing. Aim for free separate skip or cost of around £75/skip as opposed to £400/skip (based on 35 cu. yd skip).
All
Inert Concrete fines from crushing operations can be used in high value applications involving hydraulically bound materials. Recycled concrete aggregates can be used in structural concrete (a high value market that is a significant user of aggregates). The percentage of waste materials allowed by industry specifications for highway works will increase. Development of the use of inert wastes from just 6F2 (road base) to Type 1 applications (the layer above road base). Use of soil stabiliser additives to make excavated aggregate materials into a high quality reinstatement material. Aim for cost savings based on segregated skip of around £170/skip as opposed to £400/skip (based on 35 cu. yd skip). Aim for cost saving of 40% cheaper to segregate (or £30/tonne more to dispose).
Site clearance External works
Ceramics Aim for cost saving of 40% between separate skip and mixed skip (or £30/tonne more to dispose). Site clearance Structural
Concrete Segregate for 100% reuse on-site. The percentage of waste materials allowed by industry specifications for highway works will increase. Aim for cost savings of ~ £195/skip for segregated concrete with reinforced steel bars as opposed to £350/skip (based on 25 cu. yd skip). Aim for cost saving of 40% cheaper (or £60/tonne more to dispose) for segregation.
Site clearance Structural External works
Cement Aim for 100% segregation during site clearance phase. Aim cost saving of around 40% cheaper.
Site clearance Structural
Plastics Polystyrene – hot melt applications on-site. Aim for cost saving of 20% cheaper to segregate.
All except site clearance and external
Insulation 100% segregate for processing by a specialist processor. Internal Fit out
Miscellaneous Increased value from mixed waste processed at waste transfer station. All, except site clearance

Improving recovery rates without increasing costs 31
7.0 Overview of case studies The case studies feature the different types of construction project and construction phases considered in this study. They illustrate how Waste Recovery Quick Wins can be applied and demonstrate the benefits of setting targets to measure and improve waste management. The case studies are available from www.wrap.org.uk/construction Table 20 gives a summary of the 11 projects including their location, value, type and duration. The matrix shown in Table 21 provides a summary by location, type of project and construction phase. Recovery rates for different materials from the case studies are shown in Table 22, which gives the average for structural, internal and fit out. These averages apply to both new build and refurbishment projects (commercial, retail and residential). In general, the case study projects performed on average better than standard practice but, with the exception of plasterboard, less well than good practice (Waste Recovery Quick Win).
Table 21 Case study summary by location, project type and construction phase
1 2 3 4 5 6 7 8 9 10 11
Alde
rman
bury
Sq
uare
, Lon
don
York
Bui
ldin
g,
Lond
on
Old
Bro
ad S
tree
t,
Lond
on
Mor
gan
Stan
ley
offic
es, L
ondo
n
York
shire
Can
cer
Cent
re, L
eeds
New
Hos
pita
ls
Dev
elop
men
t,
Man
ches
ter
Gra
nd A
rcad
e,
Cam
brid
ge
Brid
gew
ater
Pl
ace,
Lee
ds
Apar
tmen
ts in
Ch
elte
nham
Wes
tcro
ft, M
ilton
Ke
ynes
Sout
h La
nark
shire
Sc
hool
s
Location
Southern England Midlands North of England Scotland Sector Housing new-build High density housing Commercial new-build Commercial refurbishment Retail new-build Public new-build Public refurbishment Construction phase Site clearance Structural phase Internal phase Fit out External works
Table 22 Summary of standard, good and best practice rates achieved in case studies
Recovery rates for different waste streams (%) Phases
Timber Metals Plaster-board
Packaging Ceramics Concrete Inert Plastics Misc.
Structural – fit out – internal
Case study average 82.3 82.0 79.7 79.7 80.0 90.0 – 76.3 0.0
Internal – fit out
Case study average 80.0 90.0 92.0* 75.3 78.0 – – 75.0 0.0
Standard practice (baseline)
57.0 95.0 30.0 60.0 75.0 75.0 75.0 60.0 12.0
Good practice (Quick Win )
90.0 100.0 90.0 85.0 85.0 95.0 95.0 80.0 50.0
Best practice 95.0 100.0 95.0 95.0 100.0 100.0 100.0 95.0 75.0
* Only material where case study average is better than good practice.

Improving recovery rates without increasing costs 32
Table 20 Summary of live case studies Location Value of
project Duration of project
Construction type Description Phases covered
Case Study 1 Aldermanbury Square
London £72 million ~2 years Commercial new build Office high rise – 18 storeys. Structural and internal (all weeks)
Case Study 2 York Building
London £40 million Duration of build: 2 years
Commercial and retail new build, high density housing
Mixed office, residential and retail. Internal and fit out (weeks 1–2), fit out (weeks 3–7)
Case Study 3 Old Broad Street
London £81 million 88 weeks Commercial refurbishment
Office high rise – 29 storeys, 300,000 sq. ft (including three basements).
Site clearance and structural (all weeks)
Case Study 4 Morgan Stanley
London ~£30 million All phases: ~3 years
Commercial refurbishment
Office refurbishment. Fit out
Case Study 5 Yorkshire Cancer Centre
Leeds £174 million Sep 2004 to Dec 2007 for construction phase
Public new build Cancer care centre built along side existing hospital. 12-storey reinforced concrete frame. Centre will include a 1300 space car park (707,500 sq. ft/67,000 m²).
Structural, internal and fit out (all weeks)
Case Study 6 New Hospitals Development
Manchester £380 million Sep 2004 to Apr 2009 for construction phase.
Public refurbishment and infrastructure
Re-provision of four existing hospitals on the Manchester Royal Infirmary Site and creation of a new children’s hospital including a 1600 space multi-storey car park (1.6 million sq. ft/155,074 m² (total new build), 1.16 million ft/109,704 m² (retained estate).
Structural and fit out (all weeks)
Case Study 7 Grand Arcade
Cambridge £90 million ~3 years Commercial refurbishment and infrastructure
Predominantly a retail development with 52 shop units, new multi-storey car park, John Lewis and refurbishment of retained/listed buildings (450,000 sq. ft/43,000 m²).
Structural and internal (all weeks)
Case Study 8 Bridgewater Place
Leeds £59 million Jan 2004 to Dec 2006, 117 weeks duration
Retail and commercial new build, high density housing
Retail, mixed office, and residential high rise – 31 storeys. Post-tensioned concrete frame clad in mixture of precast concrete panels and unitised curtain walling.
Structural, internal, fit out and external (all weeks)
Case Study 9 Apartments
Cheltenham £20 million Contract period: 86 weeks from May 2005
High density housing High density residential development containing 142 apartments. The building is ~60 m x 57 m x 20 m high.
Fit out
Case Study 10 Westcroft
Milton Keynes
~£7–10 million
Sep 04 to Jun 06 Housing 12-month project constructing timber-framed homes to EcoHomes Excellent standard, with all inert recycled on-site.
All phases
Case Study 11 South Lanarkshire Schools
Lanarkshire, Scotland
£65 million ~195 weeks: Sep 2004 to Mar 2008
Public new build Modernisation programme for 20 schools in South Lanarkshire – normally single storey with timber or steelwork structural frames. Case study was steel-framed, with brick and blockwork cladding.
All phases except site clearance
Improving recovery rates without increasing costs 33
8.0 What next? Implementing Waste Recovery Quick Wins (i.e. good practice) on 3–4 key waste streams at a construction site will boost recycling rates without incurring extra cost – and could even result in cost savings. This WRAP study has shown that Waste Recovery Quick Wins are possible and are already being achieved by UK construction companies as illustrated by the case studies accompanying this guide.
Start by looking at waste arisings at the site during the different construction phases and deciding which
materials to prioritise for Waste Recovery Quick Wins for the project. The study identified timber, plasterboard
and packaging waste as Quick Win materials in the structural, internal and fit out phases of a construction
project. While these are the most likely Quick Wins, site circumstances may mean other materials should be
selected as Quick Wins.
Many sites already recover metals, ceramics, concrete and inerts for reuse or recycling. Maintain or improve
performance alongside the Waste Recovery Quick Wins for the site.
Ring the WRAP Helpline (0808 100 2040) or visit the WRAP website (www.wrap.org.uk/construction) for more
detailed advice on measures to promote recovery at different phases and for different materials. The
‘Achieving Good Practice’ suite of guidance material is a good starting point. The WRAP website also has
details of other organisations that can help.
Set targets and/or KPIs for recovery rates for Quick Wins.
Implement measures to achieve these targets – segregation, SWMPs, colour-coded skips, liaison with waste
management contractors, etc.
Consider making more fundamental changes to working and procurement practices to move to best practice
and thus achieve even greater cost and environmental benefits.

Written by: Brian Menzies, EnviroCentre, with assistance from Bovis Lend Lease
Published by Waste & Resources The Old Academy Tel: 01295 819 900 Helpline freephone Action Programme 21 Horse Fair Fax: 01295 819 911 0808 100 2040 Banbury, Oxon E-mail: [email protected] OX16 0AH www.wrap.org.uk