
Waste Management in Europe. Good Jobs in the Circular … · Waste Management in Europe. Good Jobs...
38
Waste Management in Europe. Good Jobs in the Circular Economy? by Vera Weghmann December 2017 A report commissioned by The Public Services International Research Unit (PSIRU) investigates the impact of privatisation and liber- alisation on public services, with a specific focus on water, energy, waste management, health and social care sectors. Other research topics include the function and structure of public services, the strategies of multinational companies and influence of international finance institutions on public services. PSIRU is based in the Business Faculty, University of Greenwich, London, UK. Researchers: Prof. Steve Thomas, Dr. Jane Lethbridge (Director), Dr. Emanuele Lobina, Prof. David Hall, Dr. Jeff Powell, Sandra Van Niekerk, Dr. Vera Weghmann, Dr. Yuliya Yurchenko
Transcript of Waste Management in Europe. Good Jobs in the Circular … · Waste Management in Europe. Good Jobs...

Waste Management in Europe. Good Jobs in the Circular Economy?
by
Vera Weghmann December 2017
A report commissioned by
The Public Services International Research Unit (PSIRU) investigates the impact of privatisation and liber-alisation on public services, with a specific focus on water, energy, waste management, health and social care sectors. Other research topics include the function and structure of public services, the strategies of multinational companies and influence of international finance institutions on public services. PSIRU is based in the Business Faculty, University of Greenwich, London, UK. Researchers: Prof. Steve Thomas, Dr. Jane Lethbridge (Director), Dr. Emanuele Lobina, Prof. David Hall, Dr. Jeff Powell, Sandra Van Niekerk, Dr. Vera Weghmann, Dr. Yuliya Yurchenko

PUBLIC SERVICES INTERNATIONAL RESEARCH UNIT (PSIRU) https://www.gre.ac.uk/business/research/centres/public-services/home
2
Contents
1. INTRODUCTION
2. TRENDS
2.1 The Public-Private Split
2.2 PPPS
2.3 Remunicipalisation
3. THE CIRCULAR ECONOMY
3.1 What is the circular economy?
3.2 The European Union and the circular economy
4. EMPLOYMENT IN THE CIRCULAR ECONOMY
4.1 Employment in the waste management sector
4.2 Job Creation in the circular economy
4.3 Working conditions in the circular economy
5. COMPANIES – THE BIG 5
5.1 The largest companies by size
5.2 Veolia
5.3 Suez
5.4 Remodis-Rethmann
5.5 FCC
5.6 Alba
6. SOCIAL DIALOUGE
6.1 Employers: main actors at national and European levels
6.2 Structure of the industry
6.3 Key countries / key models
6.4 European social dialogue
7. CONCLUSION

PUBLIC SERVICES INTERNATIONAL RESEARCH UNIT (PSIRU) https://www.gre.ac.uk/business/research/centres/public-services/home
3
Waste Management in Europe. Good Jobs in the Circular Economy?
1. Introduction
This report was commissioned by the European Federation of Public Service Unions (EPSU) to inform a workshop entitled ‘the future of the waste sector in Europe: challenges and opportunities for workers’ to be held on 7th December 2017 in Brussels. The main research questions are:
• What are the EU policies towards waste management?
• What are the implications of the circular economy for the waste management sector?
• What is the public/private provision in waste management in Europe?
• Which multinational companies dominate the sector?
• What are the current collective bargaining arrangements?
• What are the opportunities and obstacles for organising waste management workers in Europe?
Approximately 2.6 billion tons of waste were produced in the EU-28 in 2014.1 Construction and mining alone were responsible for over 60 per cent of the overall rubbish. Municipal waste is with 10 per cent only a small proportion of the overall waste. It is, however, one of the most polluting waste.
Each inhabitant in Europe is currently producing, on average, half a tonne of household waste every year. Only 36% of it is recycled. While the use of landfills is steadily declining almost half of the waste is still landfilled or released into water. In some EU Member States, such as Croatia, Greece, Malta and Latvia, more than 80% of municipal waste is landfilled. Another big proportion is incinerated. In 20 years, between 1995 and 2015, the amount of municipal waste incinerated in the EU-27 has risen by 99%.2 The good news is, however, that in general municipal waste generation per capita is going down. It has dropped by 8% in a decade - from around 515 kg per capita in 2005 to 476 kg per capita in 2015.3 Yet, in several member states, such as Denmark, Germany, Lithuania, Slovakia, Croatia and Latvia the municipal waste generation is rising.4
Figure 1: Waste treatment methods used for waste generated in the EU-28 in 2014
Source: Eurostat, in European Parliament 2017. 5

PUBLIC SERVICES INTERNATIONAL RESEARCH UNIT (PSIRU) https://www.gre.ac.uk/business/research/centres/public-services/home
4
It is unsustainable that large amount of materials are buried, dumped out at sea or turned into ash, polluting the environment and creating the need for the extraction of further raw materials.
The circular economy promises to overcome that. Instead of disposing materials that are no longer useful, it aims to re-use the existing resources. The trend is to see waste no longer as a problem but as a resource. Hence, the circular economy has not only become a popular policy tool but also a lucrative business opportunity for multinational companies. Companies can profit twice: by disposing the waste and by re-selling it for further re-use. Treating waste as wealth translates into a scramble for resources in the waste sector.
While the circular economy provides an opportunity to make Europe more sustainable it also bears the danger of stimulating the creation of ever more, rather than less, waste. Re-use and recycling provide the perfect excuses to stimulate consumption. However, the European Circular Economy agenda not only includes proposals for recycling, repair and re-use. It also emphasises waste reduction. But the measures to prevent waste are very limited and usually do not go beyond consumer education.6
Europe’s transition into a circular economy will significantly change the labour market. The circular economy has implications that go well beyond the traditional waste sector. It promises the creation of green jobs. But the conditions of these jobs are seldom discussed. The European circular economy package lacks concrete proposals to protect workers in the circular economy from low-skilled and low-wage employment and poor health and safety standards. Against this backdrop this report examines the waste management sector in Europe in 2017 including recent policies concerning the transition towards a circular economy. It covers the following issues:
• An overview of the waste management sector in Europe;
• The main trends affecting waste management in Europe;
• Maps the circular economy and portrays its implications on waste management;
• An analysis of the business strategies of the biggest companies dominating the waste sector in Europe;
• The main stakeholders in the waste sector in Europe;
• The obstacles and opportunities of the circular economy for workers; and
• An overview of exciting social bargaining avenues.

PUBLIC SERVICES INTERNATIONAL RESEARCH UNIT (PSIRU) https://www.gre.ac.uk/business/research/centres/public-services/home
5
2. Trends 2.1 The Public-Private Split Public authorities carry the main responsibility for the municipal waste management. The services are either delivered directly through the municipal departments or through municipally owned waste management companies, or indirectly through outsourcing to private providers.7 All EU Member States employ a combination of direct and indirect waste service delivery. However, a few country specific tendencies can be identified. For example, the collection and transport of municipal waste management the direct service delivery or through a municipally owned management company is common in Germany and Italy. In Germany a further trend towards public ownership can be observed in recent years as more and more local authorities municipalized their waste collection services (see section 2.3). In Poland, Romania, Spain, Sweden and the United Kingdom outsourcing the collection and transport of municipal waste to a private provider is far more common.8 In the treatment and disposal phase of municipal waste management Italy, Germany and Sweden have a slightly higher share of direct delivery in comparison to outsourced services. In Poland, Romania, Spain and the United Kingdom these services were mostly subcontracted to private companies. 9 In general, private participation was more prevalent in the collection and transport phase than in the treatment phase. The public-private split in the organisation of the waste sector can also be found in the table (Table 1) below. Table 1: Estimated share of services provided by type of provider in the selected Member States
Source: Ramboll Management Consulting in European Commission 201610 Note: The data presented in the table is not fully comparable across the countries as they refer to different time periods. * Based on market revenues. No data available on the share of public, private and mixed providers
Contrary to the commonly held assumption that privatization increases efficiency, several econometric and empirical studies on efficiency and privatisation in waste management have found no systematic evidence to support a difference in costs between public and private provision. An overview of the different international and national studies on waste manage-ment that show that public waste management either performed as well as or better than private waste management can be found in a PSIRU report on public and private sector effi-ciency.11 For example, a study that reviewed 27 empirical studies on comparative efficiency in waste and water management in various countries came to the conclusion that “private

PUBLIC SERVICES INTERNATIONAL RESEARCH UNIT (PSIRU) https://www.gre.ac.uk/business/research/centres/public-services/home
6
production of local services is not systematically less costly than that of public production”.12 This can be illustrated on the case of Targoviste in Romania. In 1994 Prescom a private waste management contractor started to provide services to about 80% of Targoviste’s population and five neighbouring communes. In 2004 the annual revenue of the company was €20m, of which three quarters came from household billing. Its profit margin was 20% which is very high. Simultaneously a public run company, Salubrita, run municipal waste collection services for the rest of the population. Salubrita is self-financing and also has a positive cashflow. Its charges were significantly lower and it reinvested all its profits into the municipality. 13 This shows that the private sector was not more efficient than the public sector. In fact, this case demonstrates the opposite. Often efficiency and saving costs are treated as synonyms but they are fundamentally different. Lower costs can simply mean a lower service or worse conditions for the workers delivering these services. Hence, it is important not to confuse the two. The PSIRU report on efficiency in 2012 therefore argued that: “Public and private provision must be compared for their effectiveness in delivering these public goods, not just their cost-efficiency”. 14 Research in Germany and Sweden also suggests that the waste services delivered by public entities is of higher quality than if delivered by private companies.15 Moreover, Sardinia in Southern Italy shows what public waste management can achieve. Sardinia has reduced its waste generation by 16% (143724 tonnes) over a span of just nine years (Graph 1). It has a door-to-door separate collection system, where the municipalities themselves are held accountable and are either punished or rewarded for the amount of waste they bear. Waste management in Sardinia is currently undergoing a transformation with municipal waste companies being grouped together into larger organisations. Graph 1: Record of the production of municipal waste in Sardinia (figures expressed in tonnes/year)
Source: Zero Waste Europe 201716 2.2 Public Private Partnerships Direct private management, where the public authority places the whole responsibility and execution of service delivery in the hands of the private party, is not common in the waste
PUBLIC SERVICES INTERNATIONAL RESEARCH UNIT (PSIRU) https://www.gre.ac.uk/business/research/centres/public-services/home
7
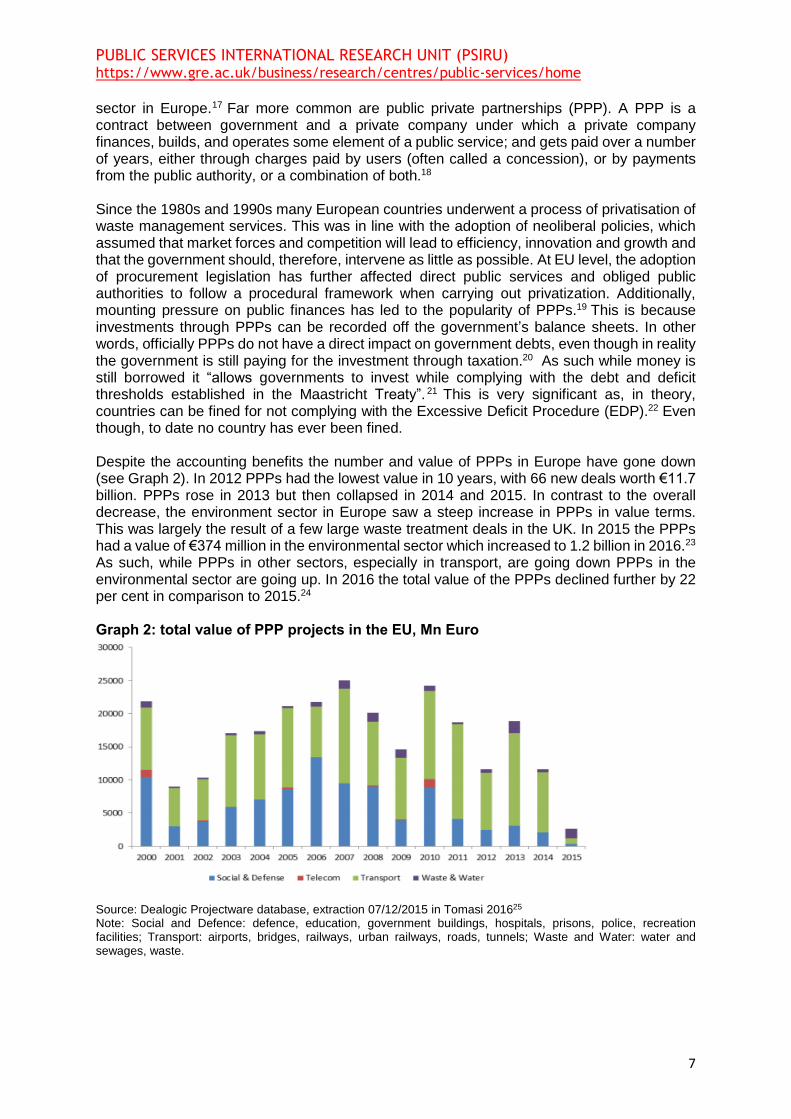
sector in Europe.17 Far more common are public private partnerships (PPP). A PPP is a contract between government and a private company under which a private company finances, builds, and operates some element of a public service; and gets paid over a number of years, either through charges paid by users (often called a concession), or by payments from the public authority, or a combination of both.18 Since the 1980s and 1990s many European countries underwent a process of privatisation of waste management services. This was in line with the adoption of neoliberal policies, which assumed that market forces and competition will lead to efficiency, innovation and growth and that the government should, therefore, intervene as little as possible. At EU level, the adoption of procurement legislation has further affected direct public services and obliged public authorities to follow a procedural framework when carrying out privatization. Additionally, mounting pressure on public finances has led to the popularity of PPPs.19 This is because investments through PPPs can be recorded off the government’s balance sheets. In other words, officially PPPs do not have a direct impact on government debts, even though in reality the government is still paying for the investment through taxation.20 As such while money is still borrowed it “allows governments to invest while complying with the debt and deficit thresholds established in the Maastricht Treaty”. 21 This is very significant as, in theory, countries can be fined for not complying with the Excessive Deficit Procedure (EDP).22 Even though, to date no country has ever been fined. Despite the accounting benefits the number and value of PPPs in Europe have gone down (see Graph 2). In 2012 PPPs had the lowest value in 10 years, with 66 new deals worth €11.7 billion. PPPs rose in 2013 but then collapsed in 2014 and 2015. In contrast to the overall decrease, the environment sector in Europe saw a steep increase in PPPs in value terms. This was largely the result of a few large waste treatment deals in the UK. In 2015 the PPPs had a value of €374 million in the environmental sector which increased to 1.2 billion in 2016.23 As such, while PPPs in other sectors, especially in transport, are going down PPPs in the environmental sector are going up. In 2016 the total value of the PPPs declined further by 22 per cent in comparison to 2015.24 Graph 2: total value of PPP projects in the EU, Mn Euro
Source: Dealogic Projectware database, extraction 07/12/2015 in Tomasi 201625 Note: Social and Defence: defence, education, government buildings, hospitals, prisons, police, recreation facilities; Transport: airports, bridges, railways, urban railways, roads, tunnels; Waste and Water: water and sewages, waste.

PUBLIC SERVICES INTERNATIONAL RESEARCH UNIT (PSIRU) https://www.gre.ac.uk/business/research/centres/public-services/home
8
3 country case studies of countries with a high private sector involvement in waste services: The United Kingdom The UK is the largest and growing PPP market in Europe, contrasting the declining trend in Europe (see Graph 2). In terms of value PPPs increased from a total of €2.4 billion in 2015 to €3.8 billion in 2016. PPP projects almost duplicated within a year, while there were 15 project deals in 2015, there
were 28 deals recorded in 2016. 26 In times of austerity the government is constrained from borrowing
more. PPPs are, therefore, a way to build infrastructure while keeping the recorded government spending low. However, the increase of PPPs poses a severe financial burden on the government. Since the crisis, private borrowing has become much more expensive and the average cost of PPP
finance is double that of government bonds. 27 It is estimated that PPP finance paying an interest rate
of 8% is significantly larger than through direct government bonds which has a rate of 4%. As such, PPPs are a very expensive way to provide public services. Moreover, within many of the PPPs major problems have occurred. In the UK, 17.7% of the contracts (as a percentage of investment) have been bought out, terminated or faced major problems, costing the government millions of pounds. Regarding the waste sector, the problems with PPPs can be demonstrated in Sheffield and in Man-chester. In 2017 both municipalities made the decision to terminate waste service PPPs. In Sheffield, the council voted in January for an early end of the city’s 35 year contract with Veolia, which was agreed in 2001 and due to expire in 2036.28 For the council the contract which was signed 16 years ago was no longer perceived to meet the city’s needs. Additionally, the GMB union discovered that Veolia diverted recyclable waste to its waste to energy to incinerators.29 This not only increased pol-lution and prevented Sheffield from meeting its recycling targets but also the workers missed out on the bonuses they would have received if recycling targets were met. However, due to very high com-pensation costs the council would need to pay to Veolia it is not yet clear if the contract will actually be terminated.30 In Manchester the Greater Manchester Waste Disposal Authority terminated a con-tract with Vividor Ltd in September 2017 due to frustration with failures in repair work and a dissatis-faction with its value for money. Yet, the city had to pay a lot to end this contract as it took over all outstanding loans from the company. 31 Spain Research indicates that there is a high share of outsourcing in the provision of municipal waste man-agement services. In recent years the market share of private companies has further increased by 4,5%.32 This indicates a trend to even further privatisation. Moreover, the waste sector shows a strong concentration with five companies having more than 70 % of total market revenues.33 Abuses of their dominant market positions have been identified by the European Commission. Their recent report on corruption in the EU found that the waste sector is one of the sectors that is most affected by corrup-tion. Two of the most famous examples reported were the Cloaca Operation and the Brugal Operation in Spain. In both cases the accusations were of crimes as prevarication, bribery, fraud, concealment and influence peddling by the alleged payment of commissions for the award of contracts related to waste management.34 These example confirm Hall’s findings that due to its long term concessions PPPs are incentives for corruption.35 They are a one-off opportunity for private companies to win a stream of government-backed revenue lasting for several decades. Poland In Poland an increased privatisation in the waste sector has been registered. A stark increase of privatisation in the municipal waste sector was identified before 2013. In this wave of privatisation public companies became either fully privatised or mixed joint ventures with private suppliers. This is because, until recently, the Polish law prohibited the use of in-house arrangements from public pro-curement in the waste sector and instead mandated the outsourcing of services. However, as this law has recently been changed to allow in-house provision, a trend towards public service provision is anticipated. 36 In the period between 2010 and 2014 non-domestic private providers (Remondis, Sita, Veolia, Alba) owned over 40% in market value (in annual terms). 37 Like in Spain also in Poland com-panies have abused their dominant market position. For example an investigation of the Office of Competition and Consumer Protection (UOKiK) in 2013 showed that the company Chemeko-System in Wroclaw - the owner of the only installation for the processing of municipal waste in the region - used its monopoly position in the local market to unjustifiably raise prices. The price increase was nearly 115%.38

PUBLIC SERVICES INTERNATIONAL RESEARCH UNIT (PSIRU) https://www.gre.ac.uk/business/research/centres/public-services/home
9
The implications of PPPs for workers are best assessed on a case by case basis. However, generally speaking PPPs worsen employment conditions for workers. David Hall (2015) identified five reasons why this is the case: 1. The private company has a greater incentive to reduce employment in order to increase profit margins; 2. As workers usually lose their status as public employees this could mean that workers lose public sector pension schemes; 3. Private employers may provide worse employment conditions for new entrants compared with transferred workers, which leads to a ‘two-tier’ workforce 4.The division of workers into smaller units weakens trade union organization; 5.The PPPs might impact other public service workers as PPPs are more expansive and thus create the need for budget cuts and potentially the cutting of staff costs elsewhere.39 2.3 Remunicipalisation Despite the increased private sector involvement in some European countries in recent years, a converse trend can also be observed. However, while some re-municipalisation cases have been recorded in the UK, France and Spain this trend is mostly restricted to Germany. In Germany there was a trend to privatize waste collection from the mid-1980s onwards but this trend was reversed in the beginning of the 21st century. Similar to the energy sector Germany experienced a wave of re-municipalisation in waste management. Unfortunately, the data about the re-municipalisation processes in the waste collection in Germany, which is collected by the federal office of statistics in Germany, has severe limitations. As in this data set PPPs with a majority of public ownership are included in the figure on public enterprises. A more precise analysis of the re--municipalisation processes can be based on the data collected by the multinational waste company Remondis about the waste providers in Germany in 2003, 2009 and 2015. 40 Graph 3: Percentage of municipal and PPP waste collection in Germany
Source: ECA Economics based on Remondis data.41 Note: Eigenerstellung means public waste collection provision.
As graph 3 above shows, 36 % of all municipalities provided their own residual waste collection in 2003. In 2015 this increased by 10 per cent to almost 46%. Simultaneously, a decrease of
PUBLIC SERVICES INTERNATIONAL RESEARCH UNIT (PSIRU) https://www.gre.ac.uk/business/research/centres/public-services/home
10
PPPs can be observed since 2009. This trend towards increased re-municipalisation has taken place in all federal states (apart from the city states Berlin and Hamburg which had a municipal residual waste collection from the beginning and Bremen where the residual waste services are performed through a PPP). However, municipal waste collection is especially prominent in cities with more than 100,000 inhabitants - in 92 % of them the municipality is in charge of the rubbish collection.42 Increasingly also rural areas are re-municipalising the waste collection services. 43 A report by the European Commission found that in Germany also 31% of the waste treatment activities and 4 % of the waste recovery activities were provided by the municipalities in 2016.44 There are several motives for why cities and regions decided to take back their waste services
under public ownership. The need for flexibility and control over the delivery of services were
the main reasons. Further reasons for the re-municipalisation processes were cost-benefit
advantages, the aim to reduce public spending, the securing of jobs for local authorities and
the expiry of contracts with private providers. In terms of the latter, it is very common for re-
municipalisation processes to coincide with the expiry of contracts as the early termination of
contracts with private providers can be very expensive.45
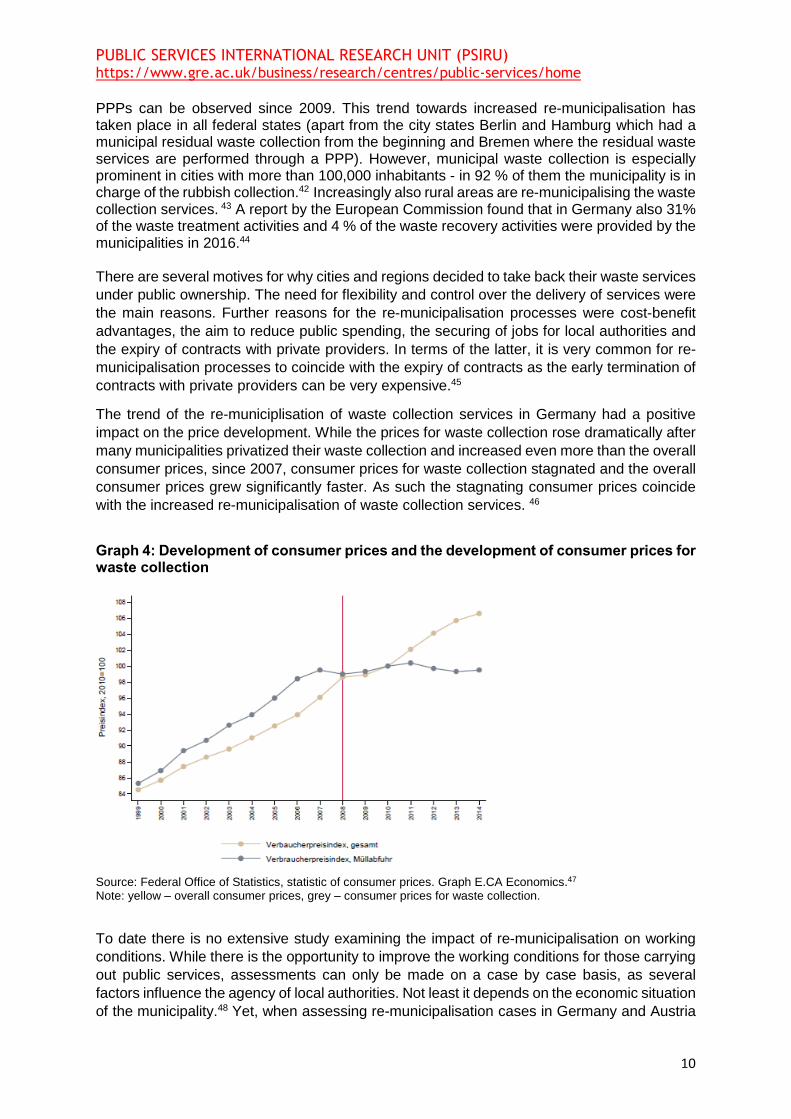
The trend of the re-municiplisation of waste collection services in Germany had a positive
impact on the price development. While the prices for waste collection rose dramatically after
many municipalities privatized their waste collection and increased even more than the overall
consumer prices, since 2007, consumer prices for waste collection stagnated and the overall
consumer prices grew significantly faster. As such the stagnating consumer prices coincide
with the increased re-municipalisation of waste collection services. 46
Graph 4: Development of consumer prices and the development of consumer prices for waste collection
Source: Federal Office of Statistics, statistic of consumer prices. Graph E.CA Economics.47 Note: yellow – overall consumer prices, grey – consumer prices for waste collection.
To date there is no extensive study examining the impact of re-municipalisation on working
conditions. While there is the opportunity to improve the working conditions for those carrying
out public services, assessments can only be made on a case by case basis, as several
factors influence the agency of local authorities. Not least it depends on the economic situation
of the municipality.48 Yet, when assessing re-municipalisation cases in Germany and Austria

PUBLIC SERVICES INTERNATIONAL RESEARCH UNIT (PSIRU) https://www.gre.ac.uk/business/research/centres/public-services/home
11
across different sectors, Terzic finds that in most cases re-municipalisation led to improved
working conditions. Working conditions especially enhanced for workers who were struggling
with low wages and temporary contracts.49
3. The Circular Economy
3.1 Towards the Circular Economy
The circular economy is an alternative to a traditional linear economy (make, use, dispose) in which resources are kept in use for as long as possible, extracting the maximum value from them whilst in use, then recovering and regenerating products and materials at the end of
each service life.50
Figure 2: The Circular Economy
Source: EEA, 2015
The circular economy aims to fundamentally change how we think about waste: treating it as a resource rather than something we just want to get rid of. Environmental organisations argue that the circular economy bears the potential for us to live resource efficient while enjoying a “low-carbon prosperity”. A clean production and sustainable consumption contributes to saving the planet.51
The world’s leading multinational companies in the waste management sector (see section 5.2-5.6) are also very enthusiastic about the circular economy but for very different reasons. In the circular economy the companies can profit twice from the same material: for disposing it and for selling it as a resource to producers. The circular economy also bears an opportunity for companies to reinforce their market position. The companies argue that due to their long experience and expertise it is only them who can successfully deliver in a circular economy, as the municipalities do not reach this standard.52 This is especially important in light of the threat of re-municipalisation (see section 2.3). Suez, for example, rebrands itself as heading the “resource revolution”53 and regularly pays for articles in the Guardian that promote the circular economy.54 Moreover, we see that the circular economy also was promoted by World

PUBLIC SERVICES INTERNATIONAL RESEARCH UNIT (PSIRU) https://www.gre.ac.uk/business/research/centres/public-services/home
12
Economic Forum (WEF). The WEF is an annual event which has a significant global policy- setting influence. Every January at the ski resort of Davos, in Switzerland, international corporations and consultants meet with governments and international organisations to develop and promote policy recommendations. That the circular economy is promoted by the WEF demonstrates the increasing business interests in waste as a resource.
Social benefits cannot be assumed to magically appear through the circular economy. Unless democratic change is at the heart of the circular economy, it is expected to mainly benefit large multinational companies. It is, therefore, important that labour requirements are integrated into the circular economy by respecting collective bargaining agreements, social security entitlements and tax contributions. While the circular economy has the potential of job creation good working conditions need to be ensured and the transition for workers must be managed.
3.2 The EU and the Circular Economy
In 2014 the European Commission (EC) published a report entitled “Towards a circular economy: A zero waste programme for Europe”. In this document it proposed that “the EU and the Member States should encourage investment in circular economy innovation and its take-up”. 55 However, just half a year later the proposals on the circular economy were eliminated as part of the drive to cut red tape.56 A revised circular economy package was published by the European Commission a year later. The new document entitled “Circular Economy closing the Loop – An EU Action Plan for the Circular Economy” sets out the new policies on the circular economy.57 While the EC argued that the new package would be more ambitious it was, in fact, the opposite. A comparison between the two policy packages shows that the 2015 outline of the circular economy will create 110,000 less jobs.58 Nonetheless, the EC’s action plan for the circular economy still has an ambitious aim: to treat waste as a resource and to turn Europe into a circular economy. While the suggested policies go far beyond the waste sector, waste sector management plays a key role in the transition to a circular economy. As such, the EC’s 2015 action for a circular economy sets the current scene for a new approach to waste management in Europe. Changes on the following legislations were proposed by the EC in order to turn Europe into a circular economy:
1. Directive 2008/98/EC on waste 2. Directive 1999/31/EC on the landfill of waste 3. Directive 94/62/EC on packaging and packaging waste 4. Directives 2000/53/EC on end-of-life vehicles,
2006/66/EC on batteries and accumulators and waste batteries and accumulators, 2012/19/EU on waste electrical and electronic equipment (WEEE)
The action plan proposes three specific changes to the regulations by including the following targets by 2030:
• A binding landfill target to reduce landfill to a maximum of 10 per cent of municipal waste;
• A target to prepare 65 per cent of municipal waste for re-use and recycling; • A target to prepare 75 per cent of packaging waste for re-use and recycling by
2030 (with supplementary targets for specific packaging material).
In total the EU is dedicated to spend €5.5 billion on the current waste financing programme through the European Regional Development Fund (ERDF) and the Cohesion Fund in the period between 2014 and 2020.59

PUBLIC SERVICES INTERNATIONAL RESEARCH UNIT (PSIRU) https://www.gre.ac.uk/business/research/centres/public-services/home
13
A key challenge for the transition to the circular economy will be how the EU member states integrate the waste management approach set out by the EC. Therefore, the EC will together with the European Environment Agency (EEA) monitor the implementation of the circular economy in member states.60 It is noteworthy, that in the EC’s vision for a circular economy PPPs play a pivotal role. Already in the earlier 2014 programme for the circular economy the EC promoted PPPs as an “effective instruments for levering private action and investment in resource efficiency” .61 Also in the 2015 action plan for the circular economy the EC pledged to “actively engage stakeholders in the implementation of this action plan, in particular through existing sectorial platforms. This will be complemented by further support for public private partnerships…”.62 Considered in the context of the ECs overall active promotion of PPPs, it is not surprising that it sees PPPs as key to the success of the circular economy. Also in 2015 the EC launched together with the European Investment Bank (EIB) an investment plan for Europe in which PPPs are regarded to be pivotal for getting Europe’s infrastructure back on track after the economic crisis. Moreover, given the overall decline of PPPs in Europe (see section 2.2) an active outreach campaign was launched by the EC, the EIB and the European PPP Expertise Centre (EPEC), which informs member states about accounting rules and especially the importance of PPPs in the Excessive Debt Procedure (EDP). As outlined in section 2.2 PPPs can be recorded of the governments’ balance sheets. 4. Employment in the Circular Economy
4.1 Employment in the waste management sector
There is a lack of employment statistics in the waste sector. Figures also vary, depending on the source of the data. This is because there is no consistent definition of which activities are included in the waste sector. But there is a general consensus that employment in the waste sector is rising. According to Eurostat there were 0.8 million employees (full-time equivalents) in waste management in 2000. By 2014 the number of employees increased to 1.1 million full-time equivalents. In other words, there was a 36 % increase in employment.63 While Eurostat does not provide data for each waste management activity it is possible to roughly distinguish between different waste management phases. The two graphs (Graph 5 and Graph 6) below show that when looking at waste collection, waste treatment and disposal as well as material recovery a steady growth of employment can be identified in the EU from 2010 onwards.

PUBLIC SERVICES INTERNATIONAL RESEARCH UNIT (PSIRU) https://www.gre.ac.uk/business/research/centres/public-services/home
14
Graph 5: European Union (27 countries) Number of persons employed; Waste collection, treatment and disposal activities; materials recovery; Total
Source: Eurostat64
Graph 6: European Union (28 countries) Number of persons employed; Waste collection, treatment and disposal activities; materials recovery; Total
Source: Eurostat65
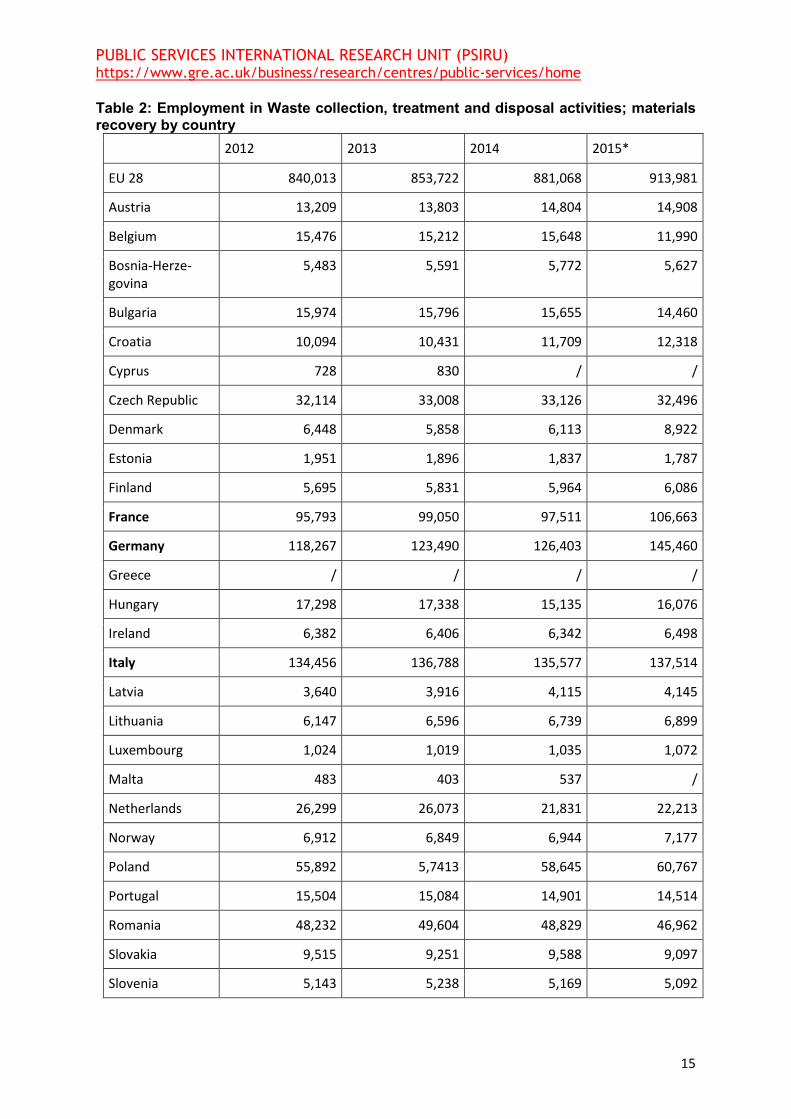
However, when comparing the countries it becomes obvious that employment in the waste sector is concentrated in a few EU countries. The five biggest waste sector employers are Germany, Italy, France, Spain and the United Kingdom which together cover over 65 percent of the employment in the waste sector of the whole EU 28 (Table 2).
PUBLIC SERVICES INTERNATIONAL RESEARCH UNIT (PSIRU) https://www.gre.ac.uk/business/research/centres/public-services/home
15
Table 2: Employment in Waste collection, treatment and disposal activities; materials recovery by country
2012 2013 2014 2015*
EU 28 840,013 853,722 881,068 913,981
Austria 13,209 13,803 14,804 14,908
Belgium 15,476 15,212 15,648 11,990
Bosnia-Herze-govina
5,483 5,591 5,772 5,627
Bulgaria 15,974 15,796 15,655 14,460
Croatia 10,094 10,431 11,709 12,318
Cyprus 728 830 / /
Czech Republic 32,114 33,008 33,126 32,496
Denmark 6,448 5,858 6,113 8,922
Estonia 1,951 1,896 1,837 1,787
Finland 5,695 5,831 5,964 6,086
France 95,793 99,050 97,511 106,663
Germany 118,267 123,490 126,403 145,460
Greece / / / /
Hungary 17,298 17,338 15,135 16,076
Ireland 6,382 6,406 6,342 6,498
Italy 134,456 136,788 135,577 137,514
Latvia 3,640 3,916 4,115 4,145
Lithuania 6,147 6,596 6,739 6,899
Luxembourg 1,024 1,019 1,035 1,072
Malta 483 403 537 /
Netherlands 26,299 26,073 21,831 22,213
Norway 6,912 6,849 6,944 7,177
Poland 55,892 5,7413 58,645 60,767
Portugal 15,504 15,084 14,901 14,514
Romania 48,232 49,604 48,829 46,962
Slovakia 9,515 9,251 9,588 9,097
Slovenia 5,143 5,238 5,169 5,092
PUBLIC SERVICES INTERNATIONAL RESEARCH UNIT (PSIRU) https://www.gre.ac.uk/business/research/centres/public-services/home
16
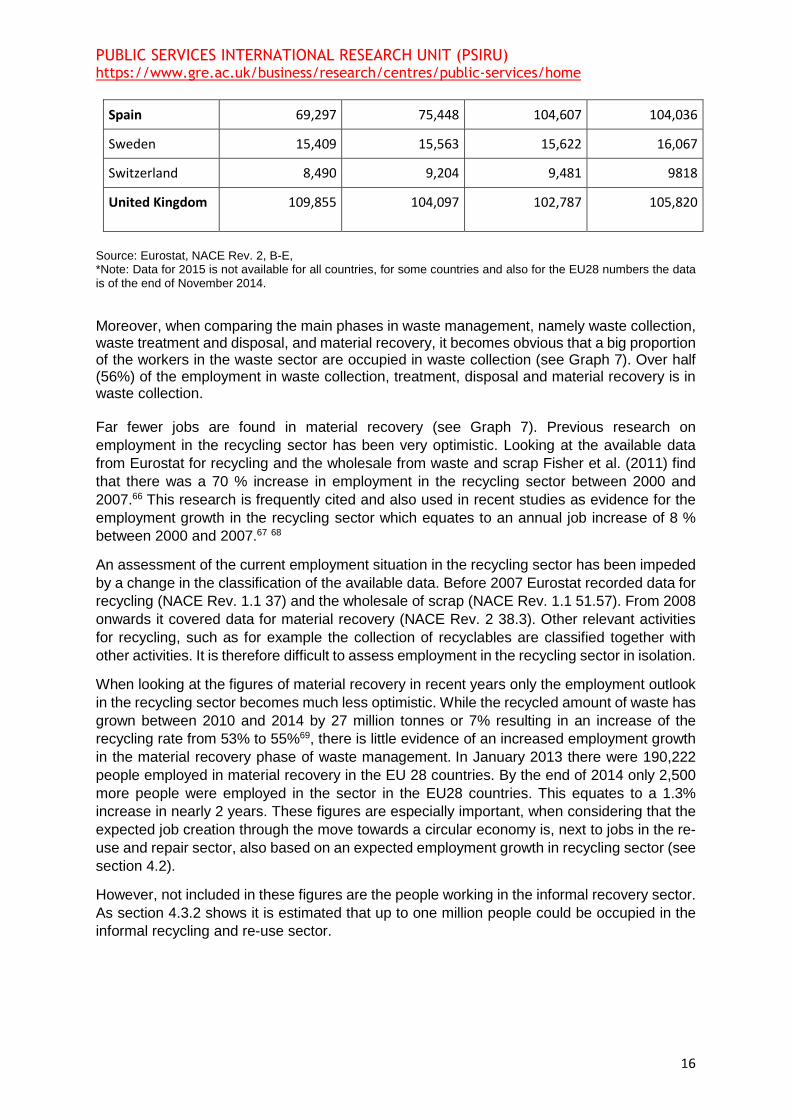
Spain 69,297 75,448 104,607 104,036
Sweden 15,409 15,563 15,622 16,067
Switzerland 8,490 9,204 9,481 9818
United Kingdom 109,855 104,097 102,787 105,820
Source: Eurostat, NACE Rev. 2, B-E, *Note: Data for 2015 is not available for all countries, for some countries and also for the EU28 numbers the data is of the end of November 2014.
Moreover, when comparing the main phases in waste management, namely waste collection, waste treatment and disposal, and material recovery, it becomes obvious that a big proportion of the workers in the waste sector are occupied in waste collection (see Graph 7). Over half (56%) of the employment in waste collection, treatment, disposal and material recovery is in waste collection. Far fewer jobs are found in material recovery (see Graph 7). Previous research on
employment in the recycling sector has been very optimistic. Looking at the available data
from Eurostat for recycling and the wholesale from waste and scrap Fisher et al. (2011) find
that there was a 70 % increase in employment in the recycling sector between 2000 and
2007.66 This research is frequently cited and also used in recent studies as evidence for the
employment growth in the recycling sector which equates to an annual job increase of 8 %
between 2000 and 2007.67 68
An assessment of the current employment situation in the recycling sector has been impeded
by a change in the classification of the available data. Before 2007 Eurostat recorded data for
recycling (NACE Rev. 1.1 37) and the wholesale of scrap (NACE Rev. 1.1 51.57). From 2008
onwards it covered data for material recovery (NACE Rev. 2 38.3). Other relevant activities
for recycling, such as for example the collection of recyclables are classified together with
other activities. It is therefore difficult to assess employment in the recycling sector in isolation.
When looking at the figures of material recovery in recent years only the employment outlook
in the recycling sector becomes much less optimistic. While the recycled amount of waste has
grown between 2010 and 2014 by 27 million tonnes or 7% resulting in an increase of the
recycling rate from 53% to 55%69, there is little evidence of an increased employment growth
in the material recovery phase of waste management. In January 2013 there were 190,222
people employed in material recovery in the EU 28 countries. By the end of 2014 only 2,500
more people were employed in the sector in the EU28 countries. This equates to a 1.3%
increase in nearly 2 years. These figures are especially important, when considering that the
expected job creation through the move towards a circular economy is, next to jobs in the re-
use and repair sector, also based on an expected employment growth in recycling sector (see
section 4.2).
However, not included in these figures are the people working in the informal recovery sector.
As section 4.3.2 shows it is estimated that up to one million people could be occupied in the
informal recycling and re-use sector.

PUBLIC SERVICES INTERNATIONAL RESEARCH UNIT (PSIRU) https://www.gre.ac.uk/business/research/centres/public-services/home
17
Graph 7: Number of persons employed in the waste management sector per waste management phase (2014)
Source: Ramboll Management Consulting based on Eurostat in European Commission 2016.70
Conversely, to the job increases in waste management, employment decreased in waste water management. Between 2000 and 2014 employment decreased by 63,000 (full time equivalent, falling to 586,000 (full-time equivalents) in 2014. In other words, employment in waste water management decreased by 10 per cent in this period. 71 When looking at employment in sewerage in the EU 28 it becomes clear that while employment has been rising since 2012 and peaked in December 2014, it sharply decreased since then (see Graph 8). Graph 8: Number of persons employed in sewerage in EU 28
Source: Eurostat72
Looking beyond waste management at the circular economy it becomes even more difficult to
measure employment. This is because any estimate depends on which sectors are included
in the circular economy. A report by WRAP estimated that 3.38 million people were employed
in the circular economy in 2015.73
Figure 5: Estimates of jobs in circular economy activities across Europe in 201574

PUBLIC SERVICES INTERNATIONAL RESEARCH UNIT (PSIRU) https://www.gre.ac.uk/business/research/centres/public-services/home
18
4. 2 Job Creation
The circular economy has the potential to create jobs because re-use and recycling are more labour intensive than disposal. In this way, the circular economy agenda feeds into the European Commission 2020 Strategy for smart, sustainable and inclusive growth, which sets a target of 75 per cent of 20 to 64 year olds to be in employment by 2020.75 To achieve this target 17.6 million additional jobs are needed.
Broadly four different categories can be identified when looking at employment in the circular economy, namely waste, recycling and wholesale of waste; repair work retail of second hand goods; and renting and leasing.76
Current circular economy activities are estimated to create more than 1 million new jobs across the EU-28 by 2030, and with further advancements in the circular economy even up to 3 million jobs could be achieved by 2030.77 However, these jobs are likely to be created in countries in which waste sector employment is already strong, namely Germany, the UK, Italy France and Spain (see Figure 6). Almost half of these new jobs are expected to be created in Germany and in the UK alone. Nonetheless, it is estimated that most European countries will benefit to some extend from the job creation through the circular economy.78

PUBLIC SERVICES INTERNATIONAL RESEARCH UNIT (PSIRU) https://www.gre.ac.uk/business/research/centres/public-services/home
19
Figure 6: Potential jobs in Europe created through expansion in circular economy
activity to 2030
However, in the enthusiasm about job creation the discussions of the conditions and the pay of these jobs are often side lined. To date not much has been written about the quality of these jobs and what the transition to a circular economy means for skill changes and job relocation.
4.3 Mapping Working Conditions in the Circular Economy
Employment conditions in the circular economy are a highly under-researched topic. Yet, existing research comes to optimistic conclusions. A report done by the green alliance on employment in the circular economy uses data from the UK only to argue that ‘circular economy jobs are good jobs’ as ‘a more circular economy could improve job security and satisfaction across Europe by providing thousands of high quality, long lasting jobs in remanufacturing, repair, servisation, recycling and circular bio-economy activities’ 79
It thus presents a rather positive picture of the employment conditions in the circular economy in Europe, based on the UK example. It finds that when compared to the overall economy: workers in the circular economy are less likely to be underemployed, employment is more stable, it creates opportunities where unemployment is high, and it has the potential of job creation for skilled and unskilled jobs. It especially emphasizes the job creation of low skilled – and low paid – jobs. This, so the report argues, is significant as in the UK unskilled work is in decline.80 In the UK 41% of the jobs in waste and recycling are lower paid occupations.81 This is very high even for the UK standard, where one quarter of all employees is paid less than a living wage.82 In 2016 most of the unskilled workers were only paid the living wage or below.83

PUBLIC SERVICES INTERNATIONAL RESEARCH UNIT (PSIRU) https://www.gre.ac.uk/business/research/centres/public-services/home
20
Developments in the circular economy not only involve major industry transformations but it also poses new challenges and opportunities for trade union organising. To stimulate the discussion on the role of trade unions in the circular economy the sections below will provide a snapshot of the employment conditions within the circular economy. Further research on the employment conditions in the circular economy is highly recommended.
4.3.1 The recycling sector
A closer look at the working conditions in the recycling sector reveals the dark side of the circular economy. The research on the circular economy to date has largely ignored the recycling labour in the global North. The emphasis is on green job creation but little attention has been paid to the condition of these jobs. Statistical data on the workforce in the circular economy is lacking too. However, pioneering research on the working conditions in the Material Recovery Facilities (MRF) for municipal solid waste (also called dry recyclables) in Belgium and the UK showed that it is ‘hard, dirty, manufacturing work – the kind of low paid assembly-line working that largely disappeared from Northern and Western Europe with the flight of manufacturing capital to Asia’.84 The workers in the picking cabin are often working beyond eight hours a day, with very few breaks. The work environment is very noisy, smelly and the work monotonous. People are working in a confined space and with the belt running at a high speed. Their research also suggests that most of the workers at the MRF cabin process are mostly migrants. Typically the pay is the minimum wage.
Similar conditions are found in a textile recycling plant in the UK, where clothes are sorted by type and then by wear from the belt. Some clothes are destined for re-sell in different parts of the world, some material will be recovered for industrial rags or fibre reclamation. The research conducted by Botticello, Calestani, Crang (2016) in a recycling plant in the UK found that most workers are women, all of them migrants mostly from Eastern Europe, as this is where many of the clothes will be exported to.85 The work is physically demanding, as it involves a lot of standing and the belts are moving fast. The work environment is smelly and dusty. Consequently the workers often suffer from dust allergies, runny noses and excessive sneezing. In order to feel the material the workers are not using gloves, which often causes skin irritations.
4.3.2 The informal recycling and re-use sector
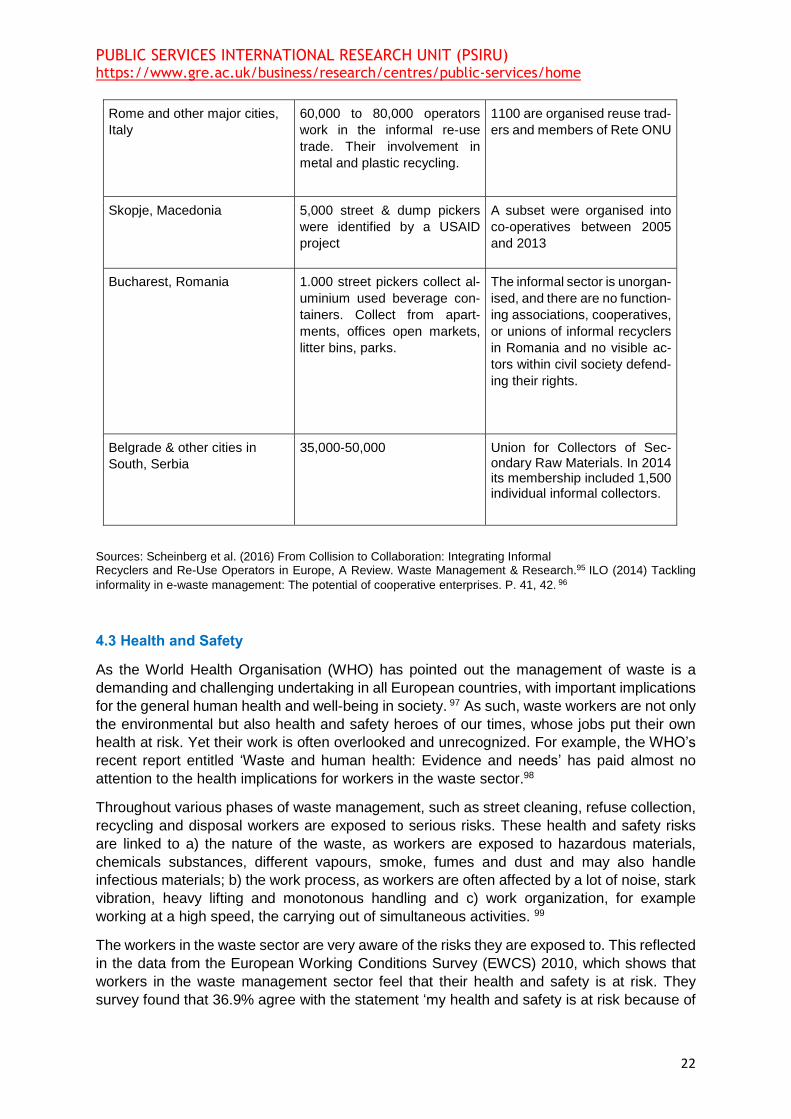
Additionally, there is a significant amount of informal recycling taking place especially in East-ern and Southern Europe but also in Northern European Countries, for example through bottle collectors in Germany and Denmark. Informal recyclers make a living by the extraction of dis-carded items from disposal sites, streets, containers and sometimes directly from generators. They then sell the collected materials to the value chains. Usually these informal waste man-agement activities are associated with the global South. For example, in Latin America alone 4 million people are estimated to make a living through the collection, the transport and the sorting of recyclable products.86 According to UN Habitat it is assumed that 25%-50% of all recyclable waste in Latin America and the Caribbean is recycled by informal waste pickers. 87 The contribution of the informal sector to recycling is completely sidelined in the European circular economy agenda.88 However, a number of studies have shown that informal recyclers in Europe have kept many tons of waste out of landfills. 89 While there is very little research done about the informal waste economy in Europe and there are obvious difficulties in attaining reliable data, initial research suggests that there could be as many as one million active re-users and recyclers in Europe.90 So, on the one hand, these informal recyclers make a significant contribution to the circular economy. As for example a recent study found that a considerable amount of used beverage cans are collected by waste-pickers, particularly in

PUBLIC SERVICES INTERNATIONAL RESEARCH UNIT (PSIRU) https://www.gre.ac.uk/business/research/centres/public-services/home
21
countries like Romania, Greece and Hungary. The study estimates that each individual informal collector amasses an average of 1.6 kg of used beverage cans per day.91 On the other hand, however, the earnings of the informal recyclers are often surpassing the minimum wage, as they are not receiving a wage but survive on the little money they make by selling the material. They are also exposed to greater health and safety risks as they are working without protective clothing. This informal recycling is mostly performed by vulnerable people. Scheinberg et al. (2016) find that most informal waste pickers in Europe are usually of Roma ethnicity; or migrants or refugees often without formal identity papers; and/or are young or elderly people; and/or homeless.92
Unionising in the informal economy in Serbia
It is assumed that 35.000 and 50,000 informal collectors work in Serbia. These figures are not represented in official statistics. Most of the waste pickers are of Roma origin.93 In 2011, 350 waste pickers founded a Union for Collectors of Secondary Raw Materials. This initiative was born through the support of the YUROM Center, an association created and run by Roma people which works on behalf of Roma citizens to improve their quality of life and end discrimination against them. The Union focuses on solidarity and mutual assistance among collectors, improvement of their legal and social status, and the inclu-sion in social dialogue at the local and national levels. In 2014 its membership included 1,500 individual informal collectors.94
Table 3: Numbers of Informal Recyclers and Re-use Operators and level of organizing
in six European Countries
City and Country Numbers Organisation
Sofia, Bulgaria Diverse group of at least
2,000 pickers in Sofia. Roma
men, and women and their
young children, waste pick at
non-compliant dumpsites near
bigger towns.
No organising is reported
Greece, including Athens As many as 100,000 in
Greece, including part-time
and seasonal pickers. Esti-
mated 40% increase in waste
picking since the economic cri-
sis.
The oldest waste pickers asso-ciation of 1,185 persons, that are selfdescribed as “mostly Muslim Greeks”
PUBLIC SERVICES INTERNATIONAL RESEARCH UNIT (PSIRU) https://www.gre.ac.uk/business/research/centres/public-services/home
22
Rome and other major cities,
Italy
60,000 to 80,000 operators
work in the informal re-use
trade. Their involvement in
metal and plastic recycling.
1100 are organised reuse trad-
ers and members of Rete ONU
Skopje, Macedonia 5,000 street & dump pickers
were identified by a USAID
project
A subset were organised into
co-operatives between 2005
and 2013
Bucharest, Romania 1.000 street pickers collect al-
uminium used beverage con-
tainers. Collect from apart-
ments, offices open markets,
litter bins, parks.
The informal sector is unorgan-
ised, and there are no function-
ing associations, cooperatives,
or unions of informal recyclers
in Romania and no visible ac-
tors within civil society defend-
ing their rights.
Belgrade & other cities in
South, Serbia
35,000-50,000 Union for Collectors of Sec-ondary Raw Materials. In 2014 its membership included 1,500 individual informal collectors.
Sources: Scheinberg et al. (2016) From Collision to Collaboration: Integrating Informal Recyclers and Re-Use Operators in Europe, A Review. Waste Management & Research.95 ILO (2014) Tackling
informality in e-waste management: The potential of cooperative enterprises. P. 41, 42. 96
4.3 Health and Safety
As the World Health Organisation (WHO) has pointed out the management of waste is a
demanding and challenging undertaking in all European countries, with important implications
for the general human health and well-being in society. 97 As such, waste workers are not only
the environmental but also health and safety heroes of our times, whose jobs put their own
health at risk. Yet their work is often overlooked and unrecognized. For example, the WHO’s
recent report entitled ‘Waste and human health: Evidence and needs’ has paid almost no
attention to the health implications for workers in the waste sector.98
Throughout various phases of waste management, such as street cleaning, refuse collection,
recycling and disposal workers are exposed to serious risks. These health and safety risks
are linked to a) the nature of the waste, as workers are exposed to hazardous materials,
chemicals substances, different vapours, smoke, fumes and dust and may also handle
infectious materials; b) the work process, as workers are often affected by a lot of noise, stark
vibration, heavy lifting and monotonous handling and c) work organization, for example
working at a high speed, the carrying out of simultaneous activities. 99
The workers in the waste sector are very aware of the risks they are exposed to. This reflected
in the data from the European Working Conditions Survey (EWCS) 2010, which shows that
workers in the waste management sector feel that their health and safety is at risk. They
survey found that 36.9% agree with the statement ‘my health and safety is at risk because of

PUBLIC SERVICES INTERNATIONAL RESEARCH UNIT (PSIRU) https://www.gre.ac.uk/business/research/centres/public-services/home
23
my work’ and 33.9% feel that their health is negatively affected by their work. This is a higher
percentage than for all other sectors and it is even higher than in the industry sector.100
Moreover, the data from the EWCS 2010 shows that the exposure is very high. For example
9% of the workers in waste management state that they are exposed to smoke, fumes and
dust ‘all the time’ (see Graph 9).
Graph 9: Exposure to physical factors in the waste management sector – EWCS 2010
Source: EWCS in oshwiki101.
Moreover, the number of accidents in the waste management sector are very high: the risk of
an accident at work is 2.5 times higher in the waste management sector compared to the
average for all other sectors.102
Unfortunately there are few detailed studies available which provide data on health and safety
in the waste sector per country. For the UK more detailed data is available. According to the
latest report by the Health and Safety Executive (HSE) there were 14 fatal injuries in the waste
sector in the UK. On average 5,000 workers in the UK waste industry get injured and 6,000
suffer from work related illnesses. The risk of fires on landfills and recycling sites is especially
severe. On average there were more than 300 fires per year at waste and recycling plants
between 2001 and 2013.103 Furthermore, it has been reported that in the UK sharp injuries are
common when sorting recycling, caused by needles, jagged tin cans and other sharp objects.
They can lead to permanent disability and infection. Yet there are no statistics about these
injuries. 104

PUBLIC SERVICES INTERNATIONAL RESEARCH UNIT (PSIRU) https://www.gre.ac.uk/business/research/centres/public-services/home
24
5. Companies
5. 1 The largest companies by size
In the following table the five biggest waste companies in Europe are compared by revenue,
their EBITDA, their net-income, the CEO’s earnings and the number of employees.
There are several ways to compare companies’ financial performances. Their revenue depicts
the amount of money that is brought into a company by its business activities. Yet, the revenue
does not give an indication of the expenses a company has. EBITDA is a useful indicator as
it shows the earnings a company has before paying interests, taxes, depreciation and
amortisation. Since it does not include interests or tax expenses EBITDA is a useful measure
of a company’s profitability when making international comparisons. But it also has its
pitfalls. Companies can adjust their profitability by using EBITA, which will always be higher
than the reported net-income. The net-income is a company’s total earning/profit and therefore
a much more precise indicator of a company’s profitability. The net income is calculated by
taking revenues and subtracting the costs of doing business such as depreciation, interest,
taxes and other expenses. Yet, two of the European biggest waste companies do not even
report their net income in their annual report but use only the EBITA figure instead.
Table 4: The largest waste multinationals
Company Revenue EBITDA Net income CEO’s earnings Number of em-ployees
Veolia €24.39 Billion €3.05 Billion €610 Million Salary: €950,000 Bonus: €953,553 Total: €1,903,553
163,226
Suez €15.3 Billion €2.65 Billion €622.8 Million Salary: €750,000 Bonus: €940,292
Benefits in kind:
€10,373
Total: €1,700,665
83,921
Remondis* €6.4 Billion / €398.24 Thou-sand
/ over 30,000
FCC €5952 Million €834 Million / / 54,467
Alba €597 Million
€5.9 Million / Salary: €0.5 Mil-lion Bonus: €45.000
net
1,353
Source: combined data from the companies annual financial reports 2016
* Figures are from 2015
PUBLIC SERVICES INTERNATIONAL RESEARCH UNIT (PSIRU) https://www.gre.ac.uk/business/research/centres/public-services/home
25
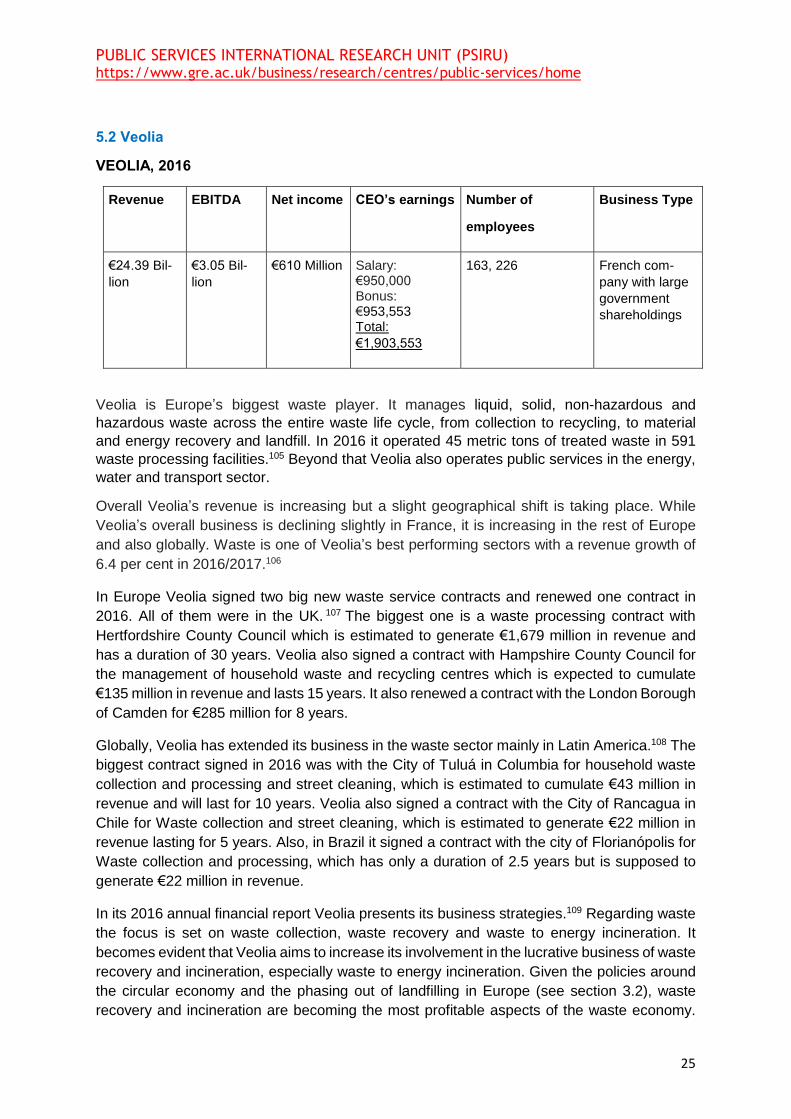
5.2 Veolia
VEOLIA, 2016
Revenue EBITDA Net income CEO’s earnings Number of
employees
Business Type
€24.39 Bil-
lion
€3.05 Bil-
lion
€610 Million Salary: €950,000 Bonus: €953,553 Total:
€1,903,553
163, 226 French com-
pany with large
government
shareholdings
Veolia is Europe’s biggest waste player. It manages liquid, solid, non-hazardous and
hazardous waste across the entire waste life cycle, from collection to recycling, to material
and energy recovery and landfill. In 2016 it operated 45 metric tons of treated waste in 591
waste processing facilities.105 Beyond that Veolia also operates public services in the energy,
water and transport sector.
Overall Veolia’s revenue is increasing but a slight geographical shift is taking place. While
Veolia’s overall business is declining slightly in France, it is increasing in the rest of Europe
and also globally. Waste is one of Veolia’s best performing sectors with a revenue growth of
6.4 per cent in 2016/2017.106
In Europe Veolia signed two big new waste service contracts and renewed one contract in
2016. All of them were in the UK. 107 The biggest one is a waste processing contract with
Hertfordshire County Council which is estimated to generate €1,679 million in revenue and
has a duration of 30 years. Veolia also signed a contract with Hampshire County Council for
the management of household waste and recycling centres which is expected to cumulate
€135 million in revenue and lasts 15 years. It also renewed a contract with the London Borough
of Camden for €285 million for 8 years.
Globally, Veolia has extended its business in the waste sector mainly in Latin America.108 The
biggest contract signed in 2016 was with the City of Tuluá in Columbia for household waste
collection and processing and street cleaning, which is estimated to cumulate €43 million in
revenue and will last for 10 years. Veolia also signed a contract with the City of Rancagua in
Chile for Waste collection and street cleaning, which is estimated to generate €22 million in
revenue lasting for 5 years. Also, in Brazil it signed a contract with the city of Florianópolis for
Waste collection and processing, which has only a duration of 2.5 years but is supposed to
generate €22 million in revenue.
In its 2016 annual financial report Veolia presents its business strategies.109 Regarding waste
the focus is set on waste collection, waste recovery and waste to energy incineration. It
becomes evident that Veolia aims to increase its involvement in the lucrative business of waste
recovery and incineration, especially waste to energy incineration. Given the policies around
the circular economy and the phasing out of landfilling in Europe (see section 3.2), waste
recovery and incineration are becoming the most profitable aspects of the waste economy.

PUBLIC SERVICES INTERNATIONAL RESEARCH UNIT (PSIRU) https://www.gre.ac.uk/business/research/centres/public-services/home
26
Interestingly, the aspect of waste prevention is striking by its absence from Veolia’s business
strategies.
Veolia’s CEO is Antonie Frerot who was remunerated with €1,903,553 in 2016.
Table 5: Veolia’s global revenue distribution
Source: Veolia, 2017.
5.3 Suez
Revenue EBITDA Net income CEO’s earnings Number of employees
Business type
€15.3 bil-lion
€2,651 million
€ 420 million Salary: €750,000 Bonus: €940,292 Benefits in kind: €10,373 Total (2016): €1,700,665
83,921 French company with large government shareholdings
Overall Suez business is growing. It increased its revenue in comparison to 2015, when it was
with €15.1 billion slightly lower. 110 It also increased its net income in comparison to the
previous year (€407 million net income in 2015). 111 Suez also increased its number of
employees: Suez employed 1,385 more people in 2016 than in 2015. The total number of
employees are 83,921 of which 61,064 are in Europe. In other words, over 72% of its
employees are in Europe. 112
Suez is mainly active in delivering water and waste services, almost to an equal share. In 2016
51% of the Suez revenues were generated in the water segment and 49% in the waste
segment.113Most of Suez waste business is in Europe (see figure 7). In Europe, Suez is
especially strong in France, the Benelux countries and Germany, where Suez aims ‘to control
the value chain, rather than own or operate it’.114 It aims to expand its business in the UK
especially through waste to energy recovery units.

PUBLIC SERVICES INTERNATIONAL RESEARCH UNIT (PSIRU) https://www.gre.ac.uk/business/research/centres/public-services/home
27
Suez plans to expand its waste recovery business in Europe. As such, Suez is an advocator
of the circular economy and, like Veolia, sees great business potential in the material and
energy recovery from waste.115
Suez is confident that due to the increasing compliance with European regulations it will be
able to increase its business in Central and Mediterranean Europe, and it is especially seeking
to expand in Poland and the Czech Republic. In these countries the use of landfills is still very
high, so there are business opportunities for waste to energy incineration.
Figure 7: distribution of the Group’s consolidated revenues as of December 31, 2016.
Source: Suez, reference document 2016116
Suez CEO is Jean-Louis Chaussade who gets paid a salary of €750,000. Additionally he received in 2016 a bonus of €940,292 and €10,373 benefits in kind. This amounts to a total earning of €1,700,665 in 2016.117
5. 4 Remondis-Rethmann
Remondis, 2015
Revenue Net income Number of em-ployees
Parent Business type
€ 6,024 M €398.24 Thou-sand
over 32,000 Rethmann Group German, traditional, private
The company Remondis is part of the Rethmann group, owned by the Rethmann family. The
family is one of the 10 richest families in Germany with an estimated wealth of 6 billion.118 The
Rethman group has an annual turnover of € 12.418 million in 2015 and employed 64,456
people.
Remondis is part of the biggest service deliverers of water and recycling worldwide. Remondis
operates in over 30 countries with over 800 sites globally. Its main market is Europe, especially
Germany, and Asia. It has the leading market position in Germany and the third biggest market
share in Europe119. Remondis employs more than 32,000 employees globally120.

PUBLIC SERVICES INTERNATIONAL RESEARCH UNIT (PSIRU) https://www.gre.ac.uk/business/research/centres/public-services/home
28
In Germany the waste market is segmented. The largest companies dominate specific areas.
Remondis for example has a monopoly position in residual waste in the provinces Schlesswig-
Holstein, Nordrhein-Westfalen.121
The continuous trend of re-municipalisation caused Remondis to lose profitable contracts. As outlined above, Germany, Remondis key market, went through a wave of re-municipalisation processes in the waste management sector (see section 2.3). For example the city of Münster re-municipalised its mechanical-biological waste treatment plant after the contract expired in May 2015. Remonis was operating the plant for 10 years previously122.
Moreover, Remodis business has been affected by the termination of Public Private Partnerships (PPPs). The district Ilm, for example, bought back Remondis 49% share of the Ilmenauer Umweltdienst GmbH, the local waste management site, through which it became
100% publicly owned.123
5.5 Fomento de Construcciones y Contratas (FCC)
FCC, 2016
Revenue EBITDA Number of Em-
ployees Company type
€5952 Million €834 Million 54,467 Spanish, shareholder
The FCC Group reported net attributable profit amounting to €153.5 million in the first nine months of 2017, contrasting with the loss of € 179.4 million in the same period of 2016.124 The EBITDA increased from €834 Million in 2015 to €834 in 2016. In the first 9 months of 2017 the EBITDA declined by 2.6 %.
FCC is mainly operating in Spain, where over half of its revenue are coming from (see Figure 8).

PUBLIC SERVICES INTERNATIONAL RESEARCH UNIT (PSIRU) https://www.gre.ac.uk/business/research/centres/public-services/home
29
Figure 8: FCC Revenue by region
Source: FCC, 2017125
Environmental services, which waste management is part of, are FCC’s largest activity. In 2016 over 51 % of its EBITDA came from this business stream. Yet this was a 3.8% decline in comparison to the previous year which was mainly due to the depreciation of both the pound sterling and the Egyptian pound.126
FCC has the following main shareholders. Inversora Carso, S.A. de C.V holds 231,504,295 shares, which is 61.11% of the whole shares. Esther Koplowitz, who is also the chairperson of the FCC groups holds 75,807,584, which comes to 20.01% of the total shares. William H. Gates III holds 21,729,431 shares, which are 5.73% of the total shares.
FCC is aiming to expand its energy from waste activities. In 2017 it commissioned its ninth energy-from waste plant serving Worcestershire and Herefordshire, in the United Kingdom. The complex was designed, developed and built by Mercia Waste Management, a company owned 50% by FCC. 127
The number of staff has been reduced slightly, whereby most of them were seconded employees. The proportion of seconded employees has increased over the last 3 years. In total there were 54,467 employees in 2016 out of which only 9,438 were on permanent contracts, and 7,846 were on fixed contracts while the majority, 43,031, were seconded employees. In other words almost 80 per cent of the workforce were seconded employees.128 Seconded employees means that an employee (or group of employees) is temporarily assigned to work for another organisation or a different part of their employer. Further research on why FCC has a large majority of seconded employees is necessary. There are a few reasons for this. One possibility relates to FCC’s practice of subcontracting, as FCC works with numerous subcontractors. 129 Under the Spanish law (article 44 of the workers statute) outsourcing continues under the same terms. This means that all contractual benefits transfer when a transfer of an undertaking takes place (for example, pension commitments, car allowance, medical insurance, lunch and nursery vouchers) and the subcontractor must continue to observe the terms and conditions agreed in any collective bargaining agreements.130 However, it is possible to structure employment as a secondment, especially on a short-term basis. And there is a lack of clarity in the law whether or not seconded employees are covered by article 44 of the workers statue.131 It is therefore possible that FCC is using seconded employees to get around workers protection and collective bargaining

PUBLIC SERVICES INTERNATIONAL RESEARCH UNIT (PSIRU) https://www.gre.ac.uk/business/research/centres/public-services/home
30
agreements. Another possibility is that FCC is using secondment of employees for employees that temporarily work in other countries.
In 2016 FCC spent €1,389,944 on wages and salaries (which does not include social security costs).132
In 2016 there have been 6 death caused by occupational accidents.
In the last few years the CEO of FCC has changed frequently. In 2015 it was Juan Béjar Ochoa, who was then replaced by Carlos M. Jarque CEO in 2016. In September 2017 Pablo Colio replaced Carlos M. Jarque. The earnings of the CEOs are not publicly available.
5. 6 Alba Group
Alba, 2016
Revenue EBITDA Net income Number of em-ployees
Parent Business type
€ 597 M €5.9 M €28 M 1,353 Alba Group German, traditional, private
Alba had a significantly smaller revenue in 2016 than in 2015, as it decreased from € 1 Billion
in 2015 to € 597 Million in 2016. Yet in the same time its net income more than doubled from
€11 Million in 2015 to €28 Million in 2016. This is because due to the falling global metal prices
it sold a number of sites in Germany, while in the same time expanding and increasing
investment in China.
Alba is mainly operating in Germany, where it specialises in residual waste metal recycling. It
has a strong market concentration in residual waste in East Germany. Alba is expanding its
business mainly to China in partnership with the Deng family, who own the company Techcent.
In China Alba operates in electronic and metal recycling, mainly car recycling. In Germany
Alba is keen for Germany to remain a key recycling site in Europe.133
Of its 1.353 employees the majority (784 workers) are occupied in steal and metal recycling
sector while 569 are occupied in other services. Alba decreased the number of its employees
in 2016.134
Alba’s CEO Dr. Axel Schweitzer, who like the other two directors on the board gets paid a €
0.5 M annually. In addition the chair Axel Schweitzer gets another €45.000 net.135

PUBLIC SERVICES INTERNATIONAL RESEARCH UNIT (PSIRU) https://www.gre.ac.uk/business/research/centres/public-services/home
31
6. Social Dialogue
6. 1 Structure of the industry
The European Federation of Waste Management and Environmental Services (FEAD) represents the private waste and resource management industry across Europe. Its members are national waste management associations in 19 member states as well as Norway and Serbia. The executive council of the FEAD consists of directors or managing directors of key national waste management associations (currently of the BDE in Germany, the ESA in the UK, the DWMA in the Netherlands, the VOEB in Austria, FNADE in France, ASEGRE in Spain, SRI in Sweden and FISE in Italy).
FEAD is an important player lobbying for the Circular Economy in Europe. In its strategy for the circular economy for 2014-2020136 FEAD calls among other aspects for:
• Fair competition between the private and public sector providers of waste and recycling services, to allow the private sector to invest in the circular economy;
• The opening up of household waste management markets to competition from private entities.
FEAD also lobbies at EU level for less public sector involvement in the recycling market. In a position paper before the plenary vote in the European Parliament on Circular Economy Package in March 2017 FEAD states that it ‘observed a clear trend towards increasing public sector activity in the recycling market in several Member States, resulting in cross-subsidisation and no tendering or restrictive tendering of these services’. And subsequently argues for more competition and private sector involvement.137
Municipal Waste Europe is the European representative umbrella organisation of public sector associations operating in the waste sector. Its members are public waste associations. Municipal Waste Europe promotes an approach to waste management that minimises the impact of waste on the environment and promotes resource efficiency, taking into account local conditions.138 Municipal Waste Europe promotes the circular economy and especially lobbied for a new circular economy package when the European Commission scrapped its first Circular Economy package in 2014. 139 Municipal Waste Europe advocates inter-communal cooperation and public-public co-operations.140
The European Centre of Employers and Enterprises providing Public Services and Services of general interest (CEEP) represents employers and enterprises providing public services.141 CEEP lobbies for public services in Europe. Also, CEEP favours the circular economy approach to a linear approach to waste management and in particular it advocates a quick ban on landfilling.142
The Council of European Municipalities and Regions (CEMR) is a European association of local and regional governments, which defends the interests of local and regional governments as employers. The CEMR is a partner consulted at each European initiative related to working conditions and work organisation. Through European social dialogue of local and regional governments it cooperates with EPSU in order to negotiate and agree on common solutions in the matter of European social policies.143

PUBLIC SERVICES INTERNATIONAL RESEARCH UNIT (PSIRU) https://www.gre.ac.uk/business/research/centres/public-services/home
32
6.2 European social dialogue
European works councils (EWCs) are a fundamental aspect of social dialogue at the European level.
Through EWCs workers representatives are informed and consulted at European level by the central management of their employer on the progress of the company and any significant decision that could affect the workers. If a company employs at least 1000 employees in the EEA and at least 150 employees in two member states the company or the employees can establish a European Work Council. The right to create EWCs was introduced by Directive 94/45/EC.
EWCs are an important tool of industrial relations at the European level as they improve the information flow between workers and management significantly, allowing for consultation of workers on relevant cross-border issues.
In total 1094 EWCs are in operation (figure from June 2016). While there has been a steady growth in the number of EWCs each year, this growth has been moderate and recently it has been gradually declining.144
All five waste companies analysed in this report fulfill the criteria for the creation of EWCs. However, only two of them, namely Veolia and Suez have EWCs. To date, FCC, Remondis and Alba have not established EWCs.
On the national level, Alba actively tries to avoid having a work council in Germany. By law, employees in Germany have the right to elect a works council that must be consulted about specific issues and have the right to make proposals to management. In 2015 the Hans Boekler Foundation found out that Alba created a ‘pseudo-foreign corporation’ to keep their supervisory board free from employee representatives. 145
Regarding publicly-employed waste workers social bargaining is taking place in the Sectoral Social Dialogue Committee for Local and Regional Government. The Sectoral Social Dialogue Committee for Local and Regional Government was established by the European Commission in 2004 and EPSU and CEMR are the most important EU-wide representatives of the sector’s employers and employees.146
7. Conclusion
This report was commissioned by the European Federation of Public Service Unions (EPSU)
to inform a workshop entitled ‘the future of the waste sector in Europe: challenges and
opportunities for workers’ to be held on 7th December 2017 in Brussels. Its main research
findings are:
• The public/private split in the waste sector remains. There are cases of further privatization
in some member states while simultaneously there are also cases of re-municipalisation.
• Re-municipalistion is mainly a trend in Germany, where it had a positive impact on the
consumer prices of waste collection and bears the potential of improved working
conditions.
• The circular economy package leads to a further reduction in landfilling. Therefore, there
will be an increase in the incineration of waste as well as recycling. This will change the
employment in the waste sector significantly.

PUBLIC SERVICES INTERNATIONAL RESEARCH UNIT (PSIRU) https://www.gre.ac.uk/business/research/centres/public-services/home
33
• Employment in the waste management sector is increasing. In 2014 1.1 million full-time
equivalents were employed in the sector. This is a 36 % increase in employment since the
year 2000.
• Employment in the waste management sector is unevenly distributed between countries.
Most of the jobs in the sector are located in Germany, the UK, Italy, France and Spain. It
is assumed that the jobs created as part of the transition towards a circular economy will
mainly benefit the exact same countries.
• Waste collection provides the majority of jobs in the waste sector. Far fewer employment
opportunities are found in material recovery. It also seems that the increase in recycling is
not mirrored by a significant increase in jobs. Less than 200,000 people are occupied in
material recovery and the employment growth has been just 1.3% from the beginning of
2013 to the end of 2014. However, this picture changes drastically when taking the
informal sector into account. It is estimated that up to one million people in Europe are
occupied in the informal recycling and re-use economy.
• To date, little research has been done on the working conditions of people employed in
the waste management sector and the wider circular economy.
• The circular economy brings challenges and opportunities for trade unions. Recycling is
an important aspect in the transition towards the circular economy and therefore should
be encouraged. More research on the working conditions in recycling plants is highly
recommended as initial research on recycling factories in Northern and Central Europe
suggests that most working conditions are poor, advantage is taken of a predominately
migrant workforce and that the pay is low. Organising these workers create opportunities
to facilitate a transition to a circular economy that is not only sustainable but also non-
exploitative.
• Another major challenge and opportunity for workers strength in the circular economy lies
in the informal sector. As it is assumed that far more people are occupied in the informal
than in the formal recycling sector, the integration of these workers into the formal
economy has a lot of potential. If recycling was seen as an important public service, then
public sector jobs with improved working conditions could be created. Informal waste
pickers could then be employed by the public sector. Several organisations, especially in
Southern and Eastern Europe, have been set up that represent the interests of the informal
waste workers, which could provide potential allies for public sector trade unions.

PUBLIC SERVICES INTERNATIONAL RESEARCH UNIT (PSIRU) https://www.gre.ac.uk/business/research/centres/public-services/home
34
1 European Parliament (2017) Towards a circular economy- waste management in the EU. P. 31. Available at: http://www.europarl.europa.eu/RegData/etudes/STUD/2017/581913/EPRS_STU(2017)581913_EN.pdf 2 http://ec.europa.eu/eurostat/statistics-explained/index.php/File:Municipal_waste_landfilled,_incinerated,_recycled_and_composted_in_the_EU-27,_1995_to_2015_update.png 3 European Parliament (2017) Towards a circular economy- waste management in the EU. P. 32. Available at: http://www.europarl.europa.eu/RegData/etudes/STUD/2017/581913/EPRS_STU(2017)581913_EN.pdf 4 European Parliament (2017) Towards a circular economy- waste management in the EU. P. 33. Available at: http://www.europarl.europa.eu/RegData/etudes/STUD/2017/581913/EPRS_STU(2017)581913_EN.pdf 5 European Parliament (2017) Towards a circular economy- waste management in the EU. P. 31. Available at: http://www.europarl.europa.eu/RegData/etudes/STUD/2017/581913/EPRS_STU(2017)581913_EN.pdf 6 European Parliament (2017) Towards a circular economy- waste management in the EU. P. 99. Available at: http://www.europarl.europa.eu/RegData/etudes/STUD/2017/581913/EPRS_STU(2017)581913_EN.pdf 7 European Commission (2016) Legal Assistance on the application of public procurement rules in the waste sector. P. 22. Available at: https://www.bde.de/assets/public/Dokumente/Europa/MP/Legal-Assistance-on-the-application-of-public-procurement-rules-in-the-waste-sector.pdf? 8 European Commission (2016) Legal Assistance on the application of public procurement rules in the waste sector. P. 22. Available at: https://www.bde.de/assets/public/Dokumente/Europa/MP/Legal-Assistance-on-the-application-of-public-procurement-rules-in-the-waste-sector.pdf? 9 European Commission (2016) Legal Assistance on the application of public procurement rules in the waste sector. P. 22. Available at: https://www.bde.de/assets/public/Dokumente/Europa/MP/Legal-Assistance-on-the-application-of-public-procurement-rules-in-the-waste-sector.pdf? 10 European Commission (2016) Legal Assistance on the application of public procurement rules in the waste sector. P. 24. Available at: https://www.bde.de/assets/public/Dokumente/Europa/MP/Legal-Assistance-on-the-application-of-public-procurement-rules-in-the-waste-sector.pdf? 11 PSIRU (2012) Public and Private Sector Efficiency. Available at: http://www.psiru.org/sites/default/files/2014-07-EWGHT-efficiency.pdf 12 Bel, G./Fageda, X. and Warner, M. (2010) Is private production of public services cheaper than public production? A meta-regression analysis of solid waste and water services. P. 575. Available at: http://onlineli-brary.wiley.com/doi/10.1002/pam.20509/full 13 European Commission (2004) Resource Book on PPP Case Studies. P. 77. Available at: http://ec.europa.eu/regional_policy/sources/docgener/guides/pppresourcebook.pdf 14 PSIRU (2012) Public and Private Sector Efficiency. http://www.psiru.org/sites/default/files/2014-07-EWGHT-efficiency.pdf 15 Bel,G. and Warner, M. (2008) Does privatization of solid waste and water services reduce costs? A review of empirical stud-ies. Available at: http://www.sciencedirect.com/science/article/pii/S0921344908001195 16 Nicastro, C. (n.d.) Sardinia demonstrates that islands can achieve zero waste. Available at: https://www.zerowasteeurope.eu/2017/07/sardinia-proves-that-zero-waste-is-possible-on-islands-too/ 17 European Commission (2016) Legal Assistance on the application of public procurement rules in the waste sector. P. 23. Available at: https://publications.europa.eu/en/publication-detail/-/publication/999dcc69-e2cc-11e6-ad7c-01aa75ed71a1 18 Hall, D. (2015) Why Public Private Partnerships don’t Work. The many advantages of the public alternative. P.7. Available at: http://www.world-psi.org/sites/default/files/rapport_eng_56pages_a4_lr.pdf 19 European Commission (2016) Legal Assistance on the application of public procurement rules in the waste sector. P. 34. Available at: https://publications.europa.eu/en/publication-detail/-/publication/999dcc69-e2cc-11e6-ad7c-01aa75ed71a1 20 Hall, D. (2015) Why Public Private Partnerships don’t Work. The many advantages of the public alternative. P.30. Available at: http://www.world-psi.org/sites/default/files/documents/research/rapport_eng_56pages_a4_lr.pdf
21 European Comission (2016) European Commission and EIB present guidance paper on the Eurostat treatment of PPPs. [Press release]. Available at: http://europa.eu/rapid/press-release_IP-16-3209_en.htm
22 http://eur-lex.europa.eu/summary/glossary/excessive_deficit_procedure.html 23 EIB and epec (2017) Market Update Review of the European PPP Market in 2016. P. 3. Available at: http://www.eib.org/attachments/epec/epec_market_update_2016_en.pdf 24 EIB and epec (2017) Market Update Review of the European PPP Market in 2016. P. 1. Available at: http://www.eib.org/attachments/epec/epec_market_update_2016_en.pdf 25 European Commission (2016) Public Private Partnerships in Memberstates [Power Point by Mirco Tomasi]. Slide 3. Available at: http://ec.europa.eu/economy_finance/events/2016/20160302-pfn/documents/03_tomasi_presentation_on_en.pdf 26 EIB and epec (2017) Market Update Review of the European PPP Market in 2016. P. 2. Available at: http://www.eib.org/attachments/epec/epec_market_update_2016_en.pdf 27 Hall, D. (2015) Why Public Private Partnerships don’t Work. The many advantages of the public alternative. P.41. Available at: http://www.world-psi.org/sites/default/files/rapport_eng_56pages_a4_lr.pdf http://www.world-psi.org/sites/default/files/rapport_eng_56pages_a4_lr.pdf 28 Resource (19 January 2017) Sheffield votes to rip up 35-year Veolia contract. Available at: http://resource.co/article/sheffield-votes-rip-35-year-veolia-contract-11620 29 GMB (17 July 2017) Leaked emails prove Veolia diverting recycling waste to incinerator. Available at: http://www.gmb.org.uk/newsroom/veolia-leaked-email 30 Resource (3 August 2017) Veolia confident of avoiding Sheffield waste contract cancellation. Available at: http://resource.co/article/veolia-confident-avoiding-sheffield-waste-contract-cancellation-12011

PUBLIC SERVICES INTERNATIONAL RESEARCH UNIT (PSIRU) https://www.gre.ac.uk/business/research/centres/public-services/home
35
31 FM World (24 August 2017) Manchester waste authority quits PFI deal with Viridor Laing. Available at: http://www.fm-world.co.uk/news/manchester-waste-authority-quits-pfi-deal-with-viridor-laing/ 32 European Commission (2016) Legal Assistance on the application of public procurement rules in the waste sector. P. 35. Available at: https://www.bde.de/assets/public/Dokumente/Europa/MP/Legal-Assistance-on-the-application-of-public-procurement-rules-in-the-waste-sector.pdf? 33 European Commission (2016) Legal Assistance on the application of public procurement rules in the waste sector. P. 25. Available at: https://www.bde.de/assets/public/Dokumente/Europa/MP/Legal-Assistance-on-the-application-of-public-procurement-rules-in-the-waste-sector.pdf? 34 European Commission (2016) Legal Assistance on the application of public procurement rules in the waste sector. P. 73. Available at: https://www.bde.de/assets/public/Dokumente/Europa/MP/Legal-Assistance-on-the-application-of-public-procurement-rules-in-the-waste-sector.pdf? 35 Hall, D. (2015) Why Public Private Partnerships don’t work. The many advantages of the public alternative. P. 31. Available at: http://www.world-psi.org/sites/default/files/rapport_eng_56pages_a4_lr.pdf 36 European Commission (2016) Legal Assistance on the application of public procurement rules in the waste sector. P. 48. Available at: https://www.bde.de/assets/public/Dokumente/Europa/MP/Legal-Assistance-on-the-application-of-public-procurement-rules-in-the-waste-sector.pdf? 37 European Commission (2016) Legal Assistance on the application of public procurement rules in the waste sector. P. 55. Available at: https://www.bde.de/assets/public/Dokumente/Europa/MP/Legal-Assistance-on-the-application-of-public-procurement-rules-in-the-waste-sector.pdf? 38 European Commission (2016) Legal Assistance on the application of public procurement rules in the waste sector. P. 72. Available at: https://www.bde.de/assets/public/Dokumente/Europa/MP/Legal-Assistance-on-the-application-of-public-procurement-rules-in-the-waste-sector.pdf? 39 Hall, D. (2015) Why Public Private Partnerships don’t work. The many advantages of the public alternative. P. 37. Available at: http://www.world-psi.org/sites/default/files/rapport_eng_56pages_a4_lr.pdf 40 European Commission (2016) Legal Assistance on the application of public procurement rules in the waste sector. P. 13. Available at: https://www.bde.de/assets/public/Dokumente/Europa/MP/Legal-Assistance-on-the-application-of-public-procurement-rules-in-the-waste-sector.pdf? 41 Friederiszick, H. and Reinhold, S. (2016) Rekommunalisierung und Wettbewerb in der Entsorgungswirtschaft: Trends, Erklärungen und wettbewerbspolitische Implikationen. ESMT White Paper No. WP–16–01. Available at: https://www.daserste.de/information/wirtschaft-boerse/plusminus/sendung/hr/rekommunalisierung-muellentsorger-100.pdf 42 Bockers, V. and Hardorp, L. et al. (2016) Wettbewerb in der Restmüllerfassung: Eine empirische Analyse der Anbieterstruktur. Ordnungspolitische Perspektiven No. 85. P. 1. Available at: http://www.dice.hhu.de/fileadmin/redaktion/Fakultaeten/Wirtschaftswissenschaftliche_Fakultaet/DICE/Ordnungspolitische_Perspektiven/85_OP_Boeckers_Hardorp_Haucap_Heimeshoff_Goesser_Thorwarth.pdf 43 Friederiszick, H., Reinhold, S. et al. (2016) Rekommunalisierung und Wettbewerb in der Entsorgungswirtschaft: Trends, Erklärungen und wettbewerbspolitische Implikationen. ESMT White Paper No. WP–16–01. P. 44. Available at: https://www.daserste.de/information/wirtschaft-boerse/plusminus/sendung/hr/rekommunalisierung-muellentsorger-100.pdf 44 European Commission (2016) Legal Assistance on the application of public procurement rules in the waste sector. P. 25. Available at: https://www.bde.de/assets/public/Dokumente/Europa/MP/Legal-Assistance-on-the-application-of-public-procurement-rules-in-the-waste-sector.pdf? 45 European Commission (2016) Legal Assistance on the application of public procurement rules in the waste sector. P. 26. Available at: https://www.bde.de/assets/public/Dokumente/Europa/MP/Legal-Assistance-on-the-application-of-public-procurement-rules-in-the-waste-sector.pdf? 46 Friederiszick, H. and Reinhold, S. (2016) Rekommunalisierung und Wettbewerb in der Entsorgungswirtschaft: Trends, Erklärungen und wettbewerbspolitische Implikationen. ESMT White Paper No. WP–16–01. P. 19. Available at: https://www.daserste.de/information/wirtschaft-boerse/plusminus/sendung/hr/rekommunalisierung-muellentsorger-100.pdf 47 Friederiszick, H. and Reinhold, S. (2016) Rekommunalisierung und Wettbewerb in der Entsorgungswirtschaft: Trends, Erklärungen und wettbewerbspolitische Implikationen. ESMT White Paper No. WP–16–01. P. 19. Available at: https://www.daserste.de/information/wirtschaft-boerse/plusminus/sendung/hr/rekommunalisierung-muellentsorger-100.pdf 48 Kramer, G. and Weingarten, J. et al. (2017) Branchen Analyse Abfallwirtschaft. Hans Bockler Stiftung. No. 354. P. 140. Available at: https://www.boeckler.de/pdf/p_study_hbs_354.pdf 49 Terzic, L. (2017) Remunicipalisation in Germany and Austria: What does it mean for employees? In: Reclaiming Public Services.How cities and citizens are turning back privatisaiton. P. 89. Available at: https://www.tni.org/files/publication-downloads/chapter_5_reclaiming_public_services_11_09_0.pdf 50
http://www.wrap.org.uk/about-us/about/wrap-and-circular-economy 51 https://www.foeeurope.org/sites/default/files/materials_and_waste/2015/walking_the_circle.pdf 52 Kramer, G. and Weingarten, J. et al. (2017) Branchen Analyse Abfallwirtschaft. Hans Bockler Stiftung. No. 354. P. 40. Available at: https://www.boeckler.de/pdf/p_study_hbs_354.pdf 53 https://www.suez.com/en/Who-we-are/A-worldwide-leader/Our-strategy

PUBLIC SERVICES INTERNATIONAL RESEARCH UNIT (PSIRU) https://www.gre.ac.uk/business/research/centres/public-services/home
36
54 https://www.theguardian.com/suez-circular-economy-zone 55 European Commission (2014) Towards a circular economy: A zero waste programme for Europe. P. 6.
56 Euractiv (15 January 2015) Commission push against red tape scores points in Parliament. Available at:
http://www.euractiv.com/section/science-policymaking/news/commission-push-against-red-tape-scores-points-in-parliament/ 57 European Commission (2015) Closing the loop - An EU action plan for the Circular Economy. Available at: http://eur-lex.europa.eu/resource.html?uri=cellar:8a8ef5e8-99a0-11e5-b3b7-01aa75ed71a1.0012.02/DOC_1&format=PDF
58 Euractiv (2 December 2015) New Circular Economy Package to create fewer jobs than axed bill it replaced. Available at: http://www.euractiv.com/section/science-policymaking/news/new-circular-economy-package-to-create-fewer-jobs-than-axed-bill-it-replaced/
59 European Commission (2015) ‘Closing the loop – an action plan for the Circular Economy’. P. 10. Available at: http://eur-lex.europa.eu/resource.html?uri=cellar:8a8ef5e8-99a0-11e5-b3b7-01aa75ed71a1.0012.02/DOC_1&format=PDF 60 European Commission (2015) ‘Closing the loop – an action plan for the Circular Economy’. P. 20. Available at: http://eur-lex.europa.eu/resource.html?uri=cellar:8a8ef5e8-99a0-11e5-b3b7-01aa75ed71a1.0012.02/DOC_1&format=PDF. 61 European Commission (2014) Towards a circular economy: A zero waste programme for Europe. P. 6. Available at: http://cor.europa.eu/en/activities/stakeholders/Documents/COM(2014)%20398%20final.pdf. 62 European Commission (2015) ‘Closing the loop – an action plan for the Circular Economy’. P. 20. Available at: http://eur-lex.europa.eu/resource.html?uri=cellar:8a8ef5e8-99a0-11e5-b3b7-01aa75ed71a1.0012.02/DOC_1&format=PDF. 63 http://ec.europa.eu/eurostat/statistics-explained/index.php/Environmental_economy_-_employment_and_growth 64 https://www.econdb.com/series/SBS_SC_IND_R2.00A92170EF35828.Y.EU27/ 65 https://www.econdb.com/series/SBS_SC_IND_R2.00A92170EF35828.Y.EU28/ 66 Fischer, C. et al. (2011) Green Economy and Recycling in Europe. ETC/SCP. P. 34. Available at: http://scp.eionet.europa.eu/publications/2011_wp5/wp/2011_wp5/wp/WP2011_5 67 WRAP (2015) Economic Growth Potential of More Circular Economies. P. 7. Available at: http://www.wrap.org.uk/content/economic-growth-potential-more-circular-economies 68 European Parliament (2017) Towards a circular economy –Waste management in the EU. P. 82. Available at: Towards a circular economy –Waste management in the EU 69 http://ec.europa.eu/eurostat/statistics-explained/index.php/Waste_management_indicators 70European Commission (2016) Legal Assistance on the application of public procurement rules in the waste sector. P. 22. Available at: https://www.bde.de/assets/public/Dokumente/Europa/MP/Legal-Assistance-on-the-application-of-public-procurement-rules-in-the-waste-sector.pdf? 71 http://ec.europa.eu/eurostat/statistics-explained/index.php/Environmental_economy_-_employment_and_growth 72 https://www.econdb.com/series/SBS_SC_IND_R2.00A92170EE35828.Y.EU28/ 73 WRAP (2015) Economic Growth Potential of More Circular Economies. P. 7. Available at: http://www.wrap.org.uk/content/economic-growth-potential-more-circular-economies 74 Michel, P. and James, K. (2015) Economic Growth Potential of More Circular Economies. WRAP. Available at: https://www.ciwm-journal.co.uk/wordpress/wp-content/uploads/2015/09/ECONOMIC-GROWTH-POTENTIAL-OF-MORE-CIRCULAR-ECONOMIES-FINAL-v04.09.20151.pdf 75 https://ec.europa.eu/info/business-economy-euro/economic-and-fiscal-policy-coordination/eu-economic-governance-monitoring-prevention-correction/european-semester/framework/drafteurope-2020-strategy/europe-2020-targets-statistics-and-indicators-eu-level_en 76 WRAP (2015) Economic Growth Potential of More Circular Economies. P. 21-22. Available at: http://www.wrap.org.uk/content/economic-growth-potential-more-circular-economies 77 European Parliament (2017) Towards a circular economy –Waste management in the EU. P. 82. Available at: Towards a circular economy –Waste management in the EU 78 WRAP (2015) Economic Growth Potential of More Circular Economies. P. 31. Available at: http://www.wrap.org.uk/content/economic-growth-potential-more-circular-economies 79 Green alliance (2016) Job quality in a circular economy. Available at: http://www.green-alliance.org.uk/resources/Job%20quality%20in%20a%20circular%20economy.pdf 80 Green alliance (2016) Job quality in a circular economy. Available at: http://www.green-alliance.org.uk/resources/Job%20quality%20in%20a%20circular%20economy.pdf 81 Green alliance (2016) Job quality in a circular economy. Available at: http://www.green-alliance.org.uk/resources/Employment%20and%20the%20circular%20economy.pdf, p. 11 82 Resolution Foundation (2016) Low Pay in Britain. P. 5. Available at: http://www.resolutionfoundation.org/app/uploads/2016/10/Low-Pay-Britain-2016.pdf 83 Syed, A. et al. ( 2016) Analysis of the distribution of earnings across the UK using Annual Survey of Hours and Earnings (ASHE) data 2016: 2016. P. 11. Available at: https://www.ons.gov.uk/employmentandlabourmarket/peopleinwork/earningsandworkinghours/articles/analysisofthedistributionofearningsacrosstheukusingashedata/2016 84 Botticello, Calestani, Crang et al. (2016) Doing the ‘dirty work’ of the green economy: Resource recovery and migrant labour in the EU. European Urban and Reginal Studies. Available at: http://journals.sagepub.com/doi/abs/10.1177/0969776414554489 85Botticello, Calestani, Crang et al. (2016) Doing the ‘dirty work’ of the green economy: Resource recovery and migrant labour in the EU. European Urban and Reginal Studies. Available at: http://journals.sagepub.com/doi/abs/10.1177/0969776414554489 86 Lethbride, J. (2017) Municipal Solid Waste Management Services in Latin America. Public Services International (PSI). P. 27. 87 Lethbride, J. (2017) Municipal Solid Waste Management Services in Latin America. Public Services International (PSI). P. 27. 88 Scheinberg, A. (2016) From collision to collaboration – Integrating informal recyclers and re-use operators in Europe: A review. Available at: http://journals.sagepub.com/doi/abs/10.1177/0734242X16657608 89 Scheinberg, A. (2016) From collision to collaboration – Integrating informal recyclers and re-use operators in Europe: A review. P. 820. Available at: http://journals.sagepub.com/doi/abs/10.1177/0734242X16657608
PUBLIC SERVICES INTERNATIONAL RESEARCH UNIT (PSIRU) https://www.gre.ac.uk/business/research/centres/public-services/home
37
90 Scheinberg, A. (2016) From collision to collaboration – Integrating informal recyclers and re-use operators in Europe: A review. P. 820. Available at: http://journals.sagepub.com/doi/abs/10.1177/0734242X16657608 91 European Aluminum (2016) Assessing the Informal Diversion of Aluminium Beverage Cans in Selected Eastern European Cities. Available at: https://www.european-aluminium.eu/media/1728/boku-informal-can-collection-study_summary-23sep16.pdf 92 Scheinberg, A. (2016) From collision to collaboration – Integrating informal recyclers and re-use operators in Europe: A review. P. 833. Available at: http://journals.sagepub.com/doi/abs/10.1177/0734242X16657608 93 ILO (2014) Tackling informality in e-waste management: The potential of cooperative enterprises. P.37. Available at: http://www.ilo.org/wcmsp5/groups/public/---ed_dialogue/---sector/documents/publication/wcms_315228.pdf 94 ILO (2014) Tackling informality in e-waste management: The potential of cooperative enterprises. P. 41, 42. Available at: http://www.ilo.org/wcmsp5/groups/public/---ed_dialogue/---sector/documents/publication/wcms_315228.pdf 95 Scheinberg, A. (2016) From collision to collaboration – Integrating informal recyclers and re-use operators in Europe: A review http://journals.sagepub.com/doi/abs/10.1177/0734242X16657608 96 ILO (2014) Tackling informality in e-waste management: The potential of cooperative enterprises. P. 41, 42. Available at: http://www.ilo.org/wcmsp5/groups/public/---ed_dialogue/---sector/documents/publication/wcms_315228.pdf 97 WHO (2015) Waste and human health: Evidence and needs. Available at: http://www.euro.who.int/__data/assets/pdf_file/0003/317226/Waste-human-health-Evidence-needs-mtg-report.pdf?ua=1 98 WHO (2015) Waste and human health: Evidence and needs. Available at: http://www.euro.who.int/__data/assets/pdf_file/0003/317226/Waste-human-health-Evidence-needs-mtg-report.pdf?ua=1 99 https://osha.europa.eu/en/wiki-page/exposure-dangerous-substances-waste-management-sector 100 https://oshwiki.eu/wiki/Accidents_and_injuries_in_t he_waste_management_sector 101 https://oshwiki.eu/wiki/Accidents_and_injuries_in_the_waste_management_sector 102 https://oshwiki.eu/wiki/Accidents_and_injuries_in_the_waste_management_sector 103 Chief Fire Officer Association. Waste Management and Recylcing Fires. Available at: http://www.cfoa.org.uk/17512
104 Blenkharn, I. (22 January 2011) Sharps Injuries in the Recycling Industries Available at: http://www.ianblenkharn.com/?p=1171 105 Veolia. Annual Financial Report. 2016. P. 2 Available at: https://www.veolia.com/sites/g/files/dvc181/f/assets/documents/2017/04/2016-Registration-Document-and-Annual-Financial-Report-HD.pdf 106Veolia. 2017 First Half Results. Available at: https://www.veolia.com/sites/g/files/dvc181/f/assets/documents/2017/07/Veolia-English-1H17-Results-Slides.pdf 107 https://www.veolia.com/sites/g/files/dvc181/f/assets/documents/2017/04/2016-Registration-Document-and-Annual-Financial-Report-HD.pdf, p. 34 108 Veolia. Annual Financial Report. 2016. P. 36 Available at: https://www.veolia.com/sites/g/files/dvc181/f/assets/documents/2017/04/2016-Registration-Document-and-Annual-Financial-Report-HD.pdf 109Veolia. Annual Financial Report. 2016. P. 17. Available at: https://www.veolia.com/sites/g/files/dvc181/f/assets/documents/2017/04/2016-Registration-Document-and-Annual-Financial-Report-HD.pdf 110 Suez. Consolidated Financial Statements of Suez for the Fiscal years ended December 31, 2016 and 2015. P. 29. 111 Suez. Consolidated Financial Statements of Suez for the Fiscal years ended December 31, 2016 and 2015. P. 146 112 Suez. Consolidated Financial Statements of Suez for the Fiscal years ended December 31, 2016 and 2015. P. 254 113 Suez. Consolidated Financial Statements of Suez for the Fiscal years ended December 31, 2016 and 2015. p. 42. 114 Suez. Consolidated Financial Statements of Suez for the Fiscal years ended December 31, 2016 and 2015. p. 53 115 Suez. Consolidated Financial Statements of Suez for the Fiscal years ended December 31, 2016 and 2015. p. 52 116 Suez. Consolidated Financial Statements of Suez for the Fiscal years ended December 31, 2016 and 2015. p 43. 117 Suez. Consolidated Financial Statements of Suez for the Fiscal years ended December 31, 2016 and 2015. P. 209 118 Manager Magazin (10 October 2011) Die erste Liga der deutschen Megareichen. Available at: http://www.manager-magazin.de/fotostrecke/fotostrecke-73751.html 119 Umweltruf. REMONDIS: fortschreitende Rekommunalisierung von kreiswirtschaftlichen Aktivitaeten bereitet Sorgen. Availa-ble at: http://www.umweltruf.de/2017_PROGRAMM/news/111/news3.php3?nummer=1151 120 https://www.remondis.de/startseite/ 121 Bockers, V. and Hardorp, L. et al. (2016) Wettbewerb in der Restmüllerfassung: Eine empirische Analyse der Anbieterstruktur. Ordnungspolitische Perspektiven No. 85. P. 17. Available at: http://www.dice.hhu.de/fileadmin/redaktion/Fakultaeten/Wirtschaftswissenschaftliche_Fakultaet/DICE/Ordnungspolitische_Perspektiven/85_OP_Boeckers_Hardorp_Haucap_Heimeshoff_Goesser_Thorwarth.pdf
122 Businesson (1 June 2015) AWM übernehmen Betrieb der Abfallbehandlungsanlage. Available at: http://www.business-on.de/muenster/abfallwirtschaft-muenster-awm-uebernehmen-betrieb-der-abfallbehandlungsanlage-_id7358.html 123 Technologies Region (29 January 2015) Kommunalisierung der Abfallwirtschaft im Ilm-Kreis ist perfekt. Available at:
http://www.tria-online.eu/Newseintrag.17.0.html?&tx_news_pi1%5Bnews%5D=3584&tx_news_pi1%5Bcontrol-
ler%5D=News&tx_news_pi1%5Baction%5D=detail&cHash=fa24b8f4bdaf2cfc76df86a7d4d098a4
124 FCC (31 October 2017) FCC Group reports €153.5 million net profit in the first nine months. Available at: http://www.fcc.es/en_US/web/portalwebfcc/-/fcc-reporta-un-beneficio-neto-por-153-5-millones-de-euros-en-los-nueve-primeros-nueve-meses-del-ano 125 FCC (31 October 2017) FCC Group reports €153.5 million net profit in the first nine months. Available at: http://www.fcc.es/en_US/web/portalwebfcc/-/fcc-reporta-un-beneficio-neto-por-153-5-millones-de-euros-en-los-nueve-primeros-nueve-meses-del-ano

PUBLIC SERVICES INTERNATIONAL RESEARCH UNIT (PSIRU) https://www.gre.ac.uk/business/research/centres/public-services/home
38
126 FCC (31 October 2017) FCC Group reports €153.5 million net profit in the first nine months. Available at: http://www.fcc.es/en_US/web/portalwebfcc/-/fcc-reporta-un-beneficio-neto-por-153-5-millones-de-euros-en-los-nueve-primeros-nueve-meses-del-ano 127 FCC (31 October 2017) FCC Group reports €153.5 million net profit in the first nine months. Available at: http://www.fcc.es/en_US/web/portalwebfcc/-/fcc-reporta-un-beneficio-neto-por-153-5-millones-de-euros-en-los-nueve-primeros-nueve-meses-del-ano 128 FCC. Annual Report 2016. P. 209. Available at: http://www.fcc.es/documents/21301/1511827/Complete+Annual+Report++2016.pdf/8b80ecce-271a-4867-2bc4-44f7131e46ce. 129FCC. Annual Report 2016. P. 407. Available at: http://www.fcc.es/documents/21301/1511827/Complete+Annual+Report++2016.pdf/8b80ecce-271a-4867-2bc4-44f7131e46ce.
130 Practical Law (01 August 2017) Transferring employees on an outsourcing in Spain: overview. Available at: https://uk.practicallaw.thomsonreuters.com/1-578-7145?transitionType=Default&contextData=(sc.Default) 131 Eurofound (24 October 2017) Spain: Employment Protection in relation to Business transfers. Available at: https://www.eurofound.europa.eu/observatories/emcc/erm/legislation/spain-employment-protection-in-relation-to-business-transfers 132 FCC. Annual Report 2016. P. 321. Available at: http://www.fcc.es/documents/21301/1511827/Complete+Annual+Report++2016.pdf/8b80ecce-271a-4867-2bc4-44f7131e46ce, p. 321. 133 Alba. Geschaeftsbericht 2016. P. 9, 10. Available at: http://www.alba.info/fileadmin/PDF/Geschaeftsberichte/2017/ALBA_GB_2016_web.pdf 134 Alba. Geschaeftsbericht 2016. P. 171. Available at: http://www.alba.info/fileadmin/PDF/Geschaeftsberichte/2017/ALBA_GB_2016_web.pdf 135 Alba. Geschaeftsbericht 2016. P. 88. Available at: http://www.alba.info/fileadmin/PDF/Geschaeftsberichte/2017/ALBA_GB_2016_web.pdf 136 FEAD. Driving the Circular Economy A FEAD Strategy for 2014-2020. Available at: https://www.fead.be/images/PDF/home/FEAD_Strategy_20142020_final.pdf 137 FEAD (2017) FEAD recommendations for plenary vote on Circular Economy Package. https://www.fead.be/images/PDF/position_papers/2017/FEAD-position-Vote-in-Plenary-CEP_March-2017.pdf 138 https://www.municipalwasteeurope.eu/about-us 139 https://www.municipalwasteeurope.eu/newsitem/press-release-circular-economy-package-withdrawal-commission-work-programme-2015 140 https://www.municipalwasteeurope.eu/position/position-statement-amendments-proposal-directive-public-procurement-20110438cod 141 http://www.ceep.eu/our_organisation/ 142 http://www.ceep.eu/opinion-on-the-commissions-proposal-for-a-circular-economy-strategy-and-reviewed-waste-legislation/ 143 http://www.ccre.org/activites/view/6 144 https://www.worker-participation.eu/European-Works-Councils/Facts-Figures 145 Hans Boeckler Stiftung (2015) Der deutschen Mitbestimmung entzogen: Unternehmen mit ausländischer Rechtsform nehmen zu. Available at: https://www.boeckler.de/pdf/p_mbf_report_2015_8.pdf, p. 8 146 EPSU (2 December 2014) EPSU confirmed as most representative trade union organization for local and regional governments sectoral social dialogue. Available at: http://www.epsu.org/article/epsu-confirmed-most-representative-trade-union-organization-local-and-regional-governments-0


