Waste Heat Recovery for the Cement Sector · Waste Heat Recovery for the Cement Sector 1 Waste Heat...
90
Waste Heat Recovery for the Cement Sector: MARKET AND SUPPLIER ANALYSIS JUNE 2014
Transcript of Waste Heat Recovery for the Cement Sector · Waste Heat Recovery for the Cement Sector 1 Waste Heat...
Waste Heat Recovery for the Cement Sector: MARKET AND SUPPLIER ANALYSIS
JUNE 2014

Disclaimer and Copyright:
This report was commissioned by IFC, a member of the World Bank Group. The conclusions and judgments contained in this report should not be attributed to, and do not necessarily represent the views of, IFC or its Board of Directors or the World Bank or its Executive Directors, or the countries they represent. IFC and the World Bank do not guarantee the accuracy of the data in this publication and accept no responsibility for any consequences of their use.

JUNE 2014
Waste Heat Recovery for the Cement Sector: MARKET AND SUPPLIER ANALYSIS
Waste Heat Recovery for the Cement Sector IV
Table of Contents
Report abstract . . . . . . . . . . . . . . . . . . . . . . . . . . . . . . . . . . . . . . . . . . . . . . . . . . . . . . . . . . . . . . . . . . . . . . . . . . . . . . . . . . . viii
Acknowledgments . . . . . . . . . . . . . . . . . . . . . . . . . . . . . . . . . . . . . . . . . . . . . . . . . . . . . . . . . . . . . . . . . . . . . . . . . . . . . . . . viii
Executive Summary . . . . . . . . . . . . . . . . . . . . . . . . . . . . . . . . . . . . . . . . . . . . . . . . . . . . . . . . . . . . . . . . . . . . . . . . . . . . . . . . 1
Introduction . . . . . . . . . . . . . . . . . . . . . . . . . . . . . . . . . . . . . . . . . . . . . . . . . . . . . . . . . . . . . . . . . . . . . . . . . . . . . . . . . . . . . . 4
World Cement Consumption and Production . . . . . . . . . . . . . . . . . . . . . . . . . . . . . . . . . . . . . . . . . . . . . . . . . . . . . . . . . . . 6
Consumption . . . . . . . . . . . . . . . . . . . . . . . . . . . . . . . . . . . . . . . . . . . . . . . . . . . . . . . . . . . . . . . . . . . . . . . . . . . . . . . . . . 6
Production . . . . . . . . . . . . . . . . . . . . . . . . . . . . . . . . . . . . . . . . . . . . . . . . . . . . . . . . . . . . . . . . . . . . . . . . . . . . . . . . . . . . 6
Cement Manufacturing Process . . . . . . . . . . . . . . . . . . . . . . . . . . . . . . . . . . . . . . . . . . . . . . . . . . . . . . . . . . . . . . . . . . . . . . 8
Waste Heat Recovery in the Cement Process . . . . . . . . . . . . . . . . . . . . . . . . . . . . . . . . . . . . . . . . . . . . . . . . . . . . . . . . . . . 11
Waste Heat Recovery Power Systems . . . . . . . . . . . . . . . . . . . . . . . . . . . . . . . . . . . . . . . . . . . . . . . . . . . . . . . . . . . . . . . . 11
Application of Waste Heat Recovery Power Systems in the Cement Process . . . . . . . . . . . . . . . . . . . . . . . . . . . . . . . . . . . 14
Recoverable Waste Heat and the Potential for Power Generation . . . . . . . . . . . . . . . . . . . . . . . . . . . . . . . . . . . . . . . . . . 14
Project Economics of Waste Heat Recovery Power Generation . . . . . . . . . . . . . . . . . . . . . . . . . . . . . . . . . . . . . . . . . . . . . 19Capital and Installation Costs . . . . . . . . . . . . . . . . . . . . . . . . . . . . . . . . . . . . . . . . . . . . . . . . . . . . . . . . . . . . . . . . . . 19Project Payback . . . . . . . . . . . . . . . . . . . . . . . . . . . . . . . . . . . . . . . . . . . . . . . . . . . . . . . . . . . . . . . . . . . . . . . . . . . . 21
Market Status of WHR in the Cement Industry . . . . . . . . . . . . . . . . . . . . . . . . . . . . . . . . . . . . . . . . . . . . . . . . . . . . . . . . . 22
Global summary . . . . . . . . . . . . . . . . . . . . . . . . . . . . . . . . . . . . . . . . . . . . . . . . . . . . . . . . . . . . . . . . . . . . . . . . . . . . . . . 22
The China Experience . . . . . . . . . . . . . . . . . . . . . . . . . . . . . . . . . . . . . . . . . . . . . . . . . . . . . . . . . . . . . . . . . . . . . . . . . . . 23Overview of China’s Cement Industry . . . . . . . . . . . . . . . . . . . . . . . . . . . . . . . . . . . . . . . . . . . . . . . . . . . . . . . . . . . 23WHR Development in China’s Cement Industry . . . . . . . . . . . . . . . . . . . . . . . . . . . . . . . . . . . . . . . . . . . . . . . . . . . . 24Key Regulatory Drivers for WHR Development In China . . . . . . . . . . . . . . . . . . . . . . . . . . . . . . . . . . . . . . . . . . . . . . 25Business Models for WHR Deployment in the Chinese Cement Industry . . . . . . . . . . . . . . . . . . . . . . . . . . . . . . . . . . 25
WHR System suppliers . . . . . . . . . . . . . . . . . . . . . . . . . . . . . . . . . . . . . . . . . . . . . . . . . . . . . . . . . . . . . . . . . . . . . . . . . . . 26Steam Systems. . . . . . . . . . . . . . . . . . . . . . . . . . . . . . . . . . . . . . . . . . . . . . . . . . . . . . . . . . . . . . . . . . . . . . . . . . . . . 26Organic Rankine Cycle Systems . . . . . . . . . . . . . . . . . . . . . . . . . . . . . . . . . . . . . . . . . . . . . . . . . . . . . . . . . . . . . . . . 29Kalina Cycle Systems . . . . . . . . . . . . . . . . . . . . . . . . . . . . . . . . . . . . . . . . . . . . . . . . . . . . . . . . . . . . . . . . . . . . . . . . 29
Target Market Analysis . . . . . . . . . . . . . . . . . . . . . . . . . . . . . . . . . . . . . . . . . . . . . . . . . . . . . . . . . . . . . . . . . . . . . . . . . . . . 30
Brazil . . . . . . . . . . . . . . . . . . . . . . . . . . . . . . . . . . . . . . . . . . . . . . . . . . . . . . . . . . . . . . . . . . . . . . . . . . . . . . . . . . . . . . . . 31Current Status of Cement Industry . . . . . . . . . . . . . . . . . . . . . . . . . . . . . . . . . . . . . . . . . . . . . . . . . . . . . . . . . . . . . . 31Current Status of WHR . . . . . . . . . . . . . . . . . . . . . . . . . . . . . . . . . . . . . . . . . . . . . . . . . . . . . . . . . . . . . . . . . . . . . . 33
Egypt . . . . . . . . . . . . . . . . . . . . . . . . . . . . . . . . . . . . . . . . . . . . . . . . . . . . . . . . . . . . . . . . . . . . . . . . . . . . . . . . . . . . . . . 34Current Status Of Cement Industry . . . . . . . . . . . . . . . . . . . . . . . . . . . . . . . . . . . . . . . . . . . . . . . . . . . . . . . . . . . . . 34Current Status of WHR . . . . . . . . . . . . . . . . . . . . . . . . . . . . . . . . . . . . . . . . . . . . . . . . . . . . . . . . . . . . . . . . . . . . . . 37
India . . . . . . . . . . . . . . . . . . . . . . . . . . . . . . . . . . . . . . . . . . . . . . . . . . . . . . . . . . . . . . . . . . . . . . . . . . . . . . . . . . . . . . . . 38Current Status of Cement Industry . . . . . . . . . . . . . . . . . . . . . . . . . . . . . . . . . . . . . . . . . . . . . . . . . . . . . . . . . . . . . . 38Current Status of WHR . . . . . . . . . . . . . . . . . . . . . . . . . . . . . . . . . . . . . . . . . . . . . . . . . . . . . . . . . . . . . . . . . . . . . . 41
Waste Heat Recovery for the Cement Sector V
Mexico . . . . . . . . . . . . . . . . . . . . . . . . . . . . . . . . . . . . . . . . . . . . . . . . . . . . . . . . . . . . . . . . . . . . . . . . . . . . . . . . . . . . . . 44Current Status of Cement Industry . . . . . . . . . . . . . . . . . . . . . . . . . . . . . . . . . . . . . . . . . . . . . . . . . . . . . . . . . . . . . . 44Current Status of WHR . . . . . . . . . . . . . . . . . . . . . . . . . . . . . . . . . . . . . . . . . . . . . . . . . . . . . . . . . . . . . . . . . . . . . . 45
Nigeria . . . . . . . . . . . . . . . . . . . . . . . . . . . . . . . . . . . . . . . . . . . . . . . . . . . . . . . . . . . . . . . . . . . . . . . . . . . . . . . . . . . . . . 46Current Status of Cement Industry . . . . . . . . . . . . . . . . . . . . . . . . . . . . . . . . . . . . . . . . . . . . . . . . . . . . . . . . . . . . . . 46Current Status of WHR . . . . . . . . . . . . . . . . . . . . . . . . . . . . . . . . . . . . . . . . . . . . . . . . . . . . . . . . . . . . . . . . . . . . . . 48
Pakistan . . . . . . . . . . . . . . . . . . . . . . . . . . . . . . . . . . . . . . . . . . . . . . . . . . . . . . . . . . . . . . . . . . . . . . . . . . . . . . . . . . . . . 49Current Status of Cement Industry . . . . . . . . . . . . . . . . . . . . . . . . . . . . . . . . . . . . . . . . . . . . . . . . . . . . . . . . . . . . . . 49Current Status of WHR . . . . . . . . . . . . . . . . . . . . . . . . . . . . . . . . . . . . . . . . . . . . . . . . . . . . . . . . . . . . . . . . . . . . . . 51
Philippines . . . . . . . . . . . . . . . . . . . . . . . . . . . . . . . . . . . . . . . . . . . . . . . . . . . . . . . . . . . . . . . . . . . . . . . . . . . . . . . . . . . . 53Current Status of Cement Industry . . . . . . . . . . . . . . . . . . . . . . . . . . . . . . . . . . . . . . . . . . . . . . . . . . . . . . . . . . . . . . 53Current Status of WHR . . . . . . . . . . . . . . . . . . . . . . . . . . . . . . . . . . . . . . . . . . . . . . . . . . . . . . . . . . . . . . . . . . . . . . 55
South Africa . . . . . . . . . . . . . . . . . . . . . . . . . . . . . . . . . . . . . . . . . . . . . . . . . . . . . . . . . . . . . . . . . . . . . . . . . . . . . . . . . . 56Current Status of Cement Industry . . . . . . . . . . . . . . . . . . . . . . . . . . . . . . . . . . . . . . . . . . . . . . . . . . . . . . . . . . . . . . 56Current Status of WHR . . . . . . . . . . . . . . . . . . . . . . . . . . . . . . . . . . . . . . . . . . . . . . . . . . . . . . . . . . . . . . . . . . . . . . 58
Thailand . . . . . . . . . . . . . . . . . . . . . . . . . . . . . . . . . . . . . . . . . . . . . . . . . . . . . . . . . . . . . . . . . . . . . . . . . . . . . . . . . . . . . 59Current Status of Cement Industry . . . . . . . . . . . . . . . . . . . . . . . . . . . . . . . . . . . . . . . . . . . . . . . . . . . . . . . . . . . . . . 59Current Status of WHR . . . . . . . . . . . . . . . . . . . . . . . . . . . . . . . . . . . . . . . . . . . . . . . . . . . . . . . . . . . . . . . . . . . . . . 61
Turkey . . . . . . . . . . . . . . . . . . . . . . . . . . . . . . . . . . . . . . . . . . . . . . . . . . . . . . . . . . . . . . . . . . . . . . . . . . . . . . . . . . . . . . . 63Current Status of Cement Industry . . . . . . . . . . . . . . . . . . . . . . . . . . . . . . . . . . . . . . . . . . . . . . . . . . . . . . . . . . . . . . 63Current Status of WHR . . . . . . . . . . . . . . . . . . . . . . . . . . . . . . . . . . . . . . . . . . . . . . . . . . . . . . . . . . . . . . . . . . . . . . 66
Vietnam . . . . . . . . . . . . . . . . . . . . . . . . . . . . . . . . . . . . . . . . . . . . . . . . . . . . . . . . . . . . . . . . . . . . . . . . . . . . . . . . . . . . . 68Current Status of Cement Industry . . . . . . . . . . . . . . . . . . . . . . . . . . . . . . . . . . . . . . . . . . . . . . . . . . . . . . . . . . . . . . 68Current Status of WHR . . . . . . . . . . . . . . . . . . . . . . . . . . . . . . . . . . . . . . . . . . . . . . . . . . . . . . . . . . . . . . . . . . . . . . 70
Sub-Saharan Africa . . . . . . . . . . . . . . . . . . . . . . . . . . . . . . . . . . . . . . . . . . . . . . . . . . . . . . . . . . . . . . . . . . . . . . . . . . . . . . . . 71
Angola . . . . . . . . . . . . . . . . . . . . . . . . . . . . . . . . . . . . . . . . . . . . . . . . . . . . . . . . . . . . . . . . . . . . . . . . . . . . . . . . . . . . . . 71
Ethiopia. . . . . . . . . . . . . . . . . . . . . . . . . . . . . . . . . . . . . . . . . . . . . . . . . . . . . . . . . . . . . . . . . . . . . . . . . . . . . . . . . . . . . . 72
Kenya . . . . . . . . . . . . . . . . . . . . . . . . . . . . . . . . . . . . . . . . . . . . . . . . . . . . . . . . . . . . . . . . . . . . . . . . . . . . . . . . . . . . . . . 72
Tanzania . . . . . . . . . . . . . . . . . . . . . . . . . . . . . . . . . . . . . . . . . . . . . . . . . . . . . . . . . . . . . . . . . . . . . . . . . . . . . . . . . . . . . 73
Sudan . . . . . . . . . . . . . . . . . . . . . . . . . . . . . . . . . . . . . . . . . . . . . . . . . . . . . . . . . . . . . . . . . . . . . . . . . . . . . . . . . . . . . . . 73
WHR Market Prioritization . . . . . . . . . . . . . . . . . . . . . . . . . . . . . . . . . . . . . . . . . . . . . . . . . . . . . . . . . . . . . . . . . . . . . . . . . 74
References . . . . . . . . . . . . . . . . . . . . . . . . . . . . . . . . . . . . . . . . . . . . . . . . . . . . . . . . . . . . . . . . . . . . . . . . . . . . . . . . . . . . . . 76
Waste Heat Recovery for the Cement Sector VI
Figure ES-1. Current Installations of Cement Industry WHR . . . . . . . . . . . . . . . . . . . . . . . . . . . . . . . . . . . . . . . . . . . . . . . . . . . . 1
Figure ES-2. Chinese-manufactured WHR Equipment Installation Costs . . . . . . . . . . . . . . . . . . . . . . . . . . . . . . . . . . . . . . . . . . . 1
Figure ES-3. Estimated Realized and Remaining Technical Potential and Investment in WHR Deployment . . . . . . . . . . . . . . . . . 2
Figure 1. Global Cement Demand. . . . . . . . . . . . . . . . . . . . . . . . . . . . . . . . . . . . . . . . . . . . . . . . . . . . . . . . . . . . . . . . . . . . . . . 6
Figure 2. Rotary Cement Kiln . . . . . . . . . . . . . . . . . . . . . . . . . . . . . . . . . . . . . . . . . . . . . . . . . . . . . . . . . . . . . . . . . . . . . . . . . . 8
Figure 3. Clinker Volumes by Kiln Type . . . . . . . . . . . . . . . . . . . . . . . . . . . . . . . . . . . . . . . . . . . . . . . . . . . . . . . . . . . . . . . . . . 10
Figure 4. Waste Heat Recovery on NSP Cement Kiln . . . . . . . . . . . . . . . . . . . . . . . . . . . . . . . . . . . . . . . . . . . . . . . . . . . . . . . . 12
Figure 5. Preheater Waste Heat Boiler . . . . . . . . . . . . . . . . . . . . . . . . . . . . . . . . . . . . . . . . . . . . . . . . . . . . . . . . . . . . . . . . . . . 15
Figure 6. Air Cooler Waste Heat Boiler. . . . . . . . . . . . . . . . . . . . . . . . . . . . . . . . . . . . . . . . . . . . . . . . . . . . . . . . . . . . . . . . . . . 15
Figure 7. Power Generation Potential as a Function of Preheater Exhaust Temperature . . . . . . . . . . . . . . . . . . . . . . . . . . . . . . 16
Figure 8. Waste Heat Power Generation Capacities as a Function of Kiln Capacity . . . . . . . . . . . . . . . . . . . . . . . . . . . . . . . . . . 17
Figure 9. WHR System Installed Costs . . . . . . . . . . . . . . . . . . . . . . . . . . . . . . . . . . . . . . . . . . . . . . . . . . . . . . . . . . . . . . . . . . . 20
Figure 10. Installed Costs for Chinese WHR Systems . . . . . . . . . . . . . . . . . . . . . . . . . . . . . . . . . . . . . . . . . . . . . . . . . . . . . . . . 20
Figure 11. Potential Annual Operating Savings from WHR . . . . . . . . . . . . . . . . . . . . . . . . . . . . . . . . . . . . . . . . . . . . . . . . . . . . 21
Figure 12. Potential Simple Paybacks for a 10 MW WHR System . . . . . . . . . . . . . . . . . . . . . . . . . . . . . . . . . . . . . . . . . . . . . . 21
Figure 13. Current Installations of Cement Industry WHR . . . . . . . . . . . . . . . . . . . . . . . . . . . . . . . . . . . . . . . . . . . . . . . . . . . . 22
Figure 14. Installations of Cement Industry WHR in China . . . . . . . . . . . . . . . . . . . . . . . . . . . . . . . . . . . . . . . . . . . . . . . . . . . . 25
Figure 15. Consequences of Power Disruptions on Production in Turkey . . . . . . . . . . . . . . . . . . . . . . . . . . . . . . . . . . . . . . . . . 61
List of Figures

Waste Heat Recovery for the Cement Sector VII
Table ES-1 – WHR Market Opportunities . . . . . . . . . . . . . . . . . . . . . . . . . . . . . . . . . . . . . . . . . . . . . . . . . . . . . . . . . . . . . . . . . . 3
Table 1. Top Cement Consuming Countries . . . . . . . . . . . . . . . . . . . . . . . . . . . . . . . . . . . . . . . . . . . . . . . . . . . . . . . . . . . . . . . 6
Table 2. World Cement Production and Clinker Capacity . . . . . . . . . . . . . . . . . . . . . . . . . . . . . . . . . . . . . . . . . . . . . . . . . . . . . 7
Table 3. Top Global Cement Companies – 2013 . . . . . . . . . . . . . . . . . . . . . . . . . . . . . . . . . . . . . . . . . . . . . . . . . . . . . . . . . . . 7
Table 4. Specific Thermal Energy Consumption by Rotary Kiln Type . . . . . . . . . . . . . . . . . . . . . . . . . . . . . . . . . . . . . . . . . . . . . . 9
Table 5. Typical Available Heat for Dry Process NSP Kilns . . . . . . . . . . . . . . . . . . . . . . . . . . . . . . . . . . . . . . . . . . . . . . . . . . . . . 16
Table 6. Typical Available Heat for Grate Clinker Coolers. . . . . . . . . . . . . . . . . . . . . . . . . . . . . . . . . . . . . . . . . . . . . . . . . . . . . 16
Table 7. Typical Available Heat and Power Generation from Preheater/Grate Clinker Cooler. . . . . . . . . . . . . . . . . . . . . . . . . . . 17
Table 8. Heat Required for Raw Material Drying . . . . . . . . . . . . . . . . . . . . . . . . . . . . . . . . . . . . . . . . . . . . . . . . . . . . . . . . . . . 18
Table 9. WHR Steam System Options . . . . . . . . . . . . . . . . . . . . . . . . . . . . . . . . . . . . . . . . . . . . . . . . . . . . . . . . . . . . . . . . . . . 18
Table 10. Typical Payback Calculation for Chinese WHR System . . . . . . . . . . . . . . . . . . . . . . . . . . . . . . . . . . . . . . . . . . . . . . . 21
Table 11. Annual Chinese Cement Production by Kiln Type . . . . . . . . . . . . . . . . . . . . . . . . . . . . . . . . . . . . . . . . . . . . . . . . . . . 23
Table 12. NSP Production Line Capacity Distribution in China – 2012 . . . . . . . . . . . . . . . . . . . . . . . . . . . . . . . . . . . . . . . . . . . 24
Table 13. Top Cement Producers in China . . . . . . . . . . . . . . . . . . . . . . . . . . . . . . . . . . . . . . . . . . . . . . . . . . . . . . . . . . . . . . . . 24
Table 14. Target Market Prioritization . . . . . . . . . . . . . . . . . . . . . . . . . . . . . . . . . . . . . . . . . . . . . . . . . . . . . . . . . . . . . . . . . . . 76
List of Tables
Waste Heat Recovery for the Cement Sector VIII
This report analyzes the current status of Waste Heat Recovery (WHR) technology deployment in developing countries and investigates the success factors in countries where WHR has become widely spread. The report then focuses on the in-depth analysis of WHR potential and enabling factors in eleven country markets in Africa (Nigeria, South Africa), South Asia (India, Pakistan), Middle East (Egypt, Turkey), Latin America (Brazil, Mexico) and East Asia (Philippines, Thailand, Vietnam). The report maps out major WHR equipment suppliers. In addition, the report includes a brief analysis of business and project models used internationally to support WHR deployment.
Report Abstract
Acknowledgments
This report was produced in partnership between International Finance Corporation (IFC) and Institute for Industrial Productivity (IIP). The IFC team was led by Yana Gorbatenko and Alexander Sharabaroff. The IIP team was led by Bruce Hedman and Jigar Shah.
The team would like to thank Takuro Kimura, Michel Folliet, Sanjay Puri, Henri Rachid Sfeir, Bryanne Tait, Dalia Sakr, Sivaram Krishnamoorthy, Luis Alberto Salomon and Jeremy Levin for their recognized expertise, valuable advice and useful contributions to this report.
Waste Heat Recovery for the Cement Sector 1
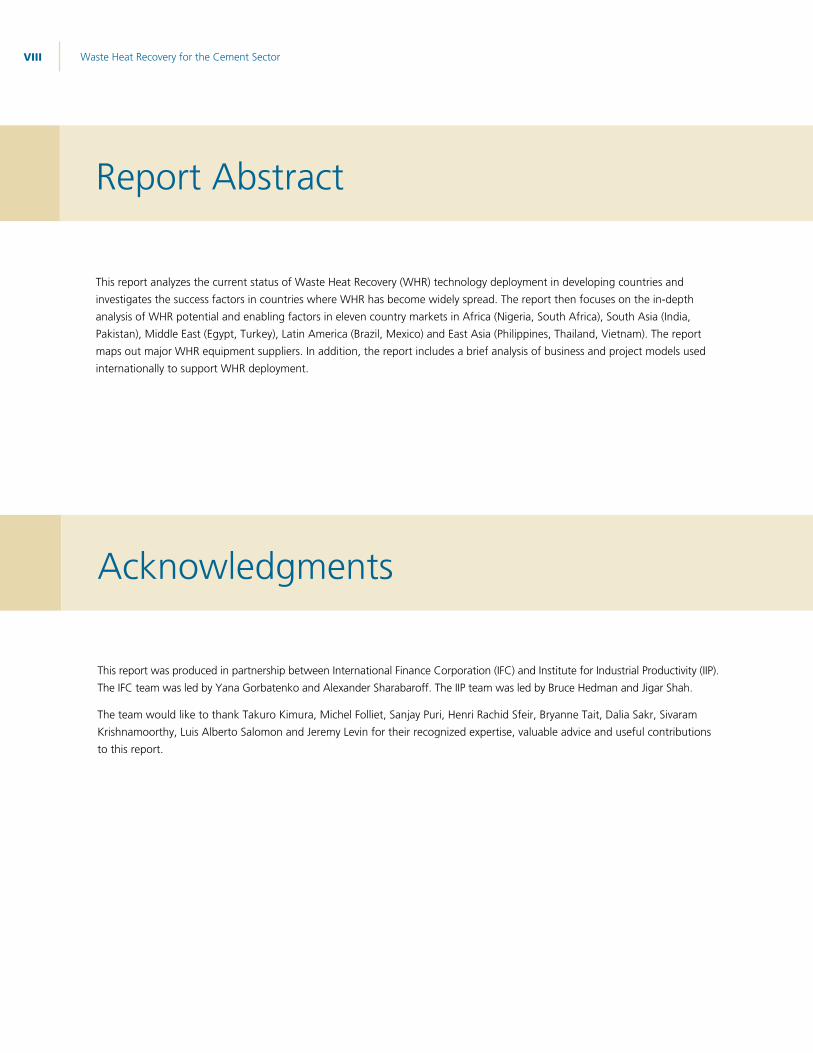
Waste Heat Recovery (WHR) is a proven technology, but until now WHR uptake has been limited except in China. As early as the 1980s, Japanese companies spear-headed the introduction of WHR power systems in the cement industry. Currently, there are a range of commercially-proven and mature WHR power systems ranging from classic Rankine-cycle steam-based installations to Organic Rankine Cycle (ORC) and Kalina cycle WHR power systems. There are over 850 WHR power installations in the world. China leads in the number of WHR installations—739, followed by India (26 WHR installations) and Japan (24 installations). (See figure ES-1).
Figure ES-1. Current Installations of Cement Industry WHR
0 100 200 300 400 500 600 700 800Rest of World
Americas
Europe
Mid East
Other Asia
Pakistan
Thailand
Japan
India
China 739
26
24
12
9
24
15
7
5
4
Source: “Latest Waste Heat Utilization Trends,” OneStone Research; CemPower 2013
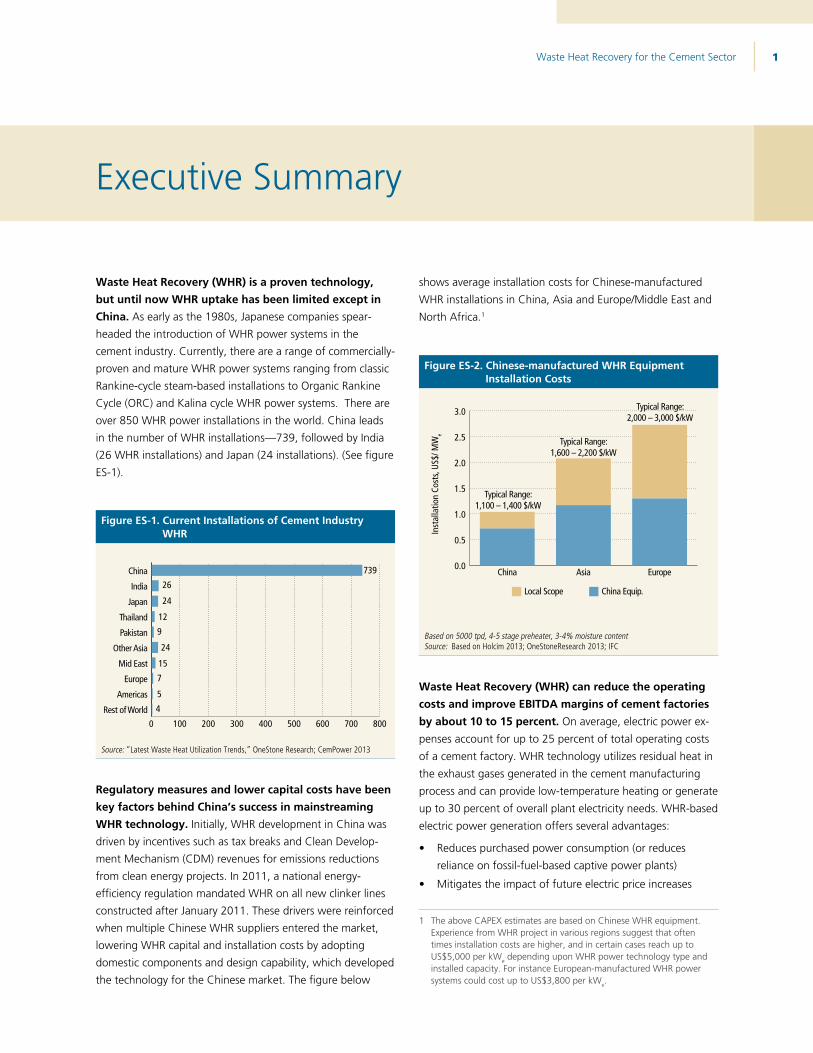
Regulatory measures and lower capital costs have been key factors behind China’s success in mainstreaming WHR technology. Initially, WHR development in China was driven by incentives such as tax breaks and Clean Develop-ment Mechanism (CDM) revenues for emissions reductions from clean energy projects. In 2011, a national energy-efficiency regulation mandated WHR on all new clinker lines constructed after January 2011. These drivers were reinforced when multiple Chinese WHR suppliers entered the market, lowering WHR capital and installation costs by adopting domestic components and design capability, which developed the technology for the Chinese market. The figure below
shows average installation costs for Chinese-manufactured
WHR installations in China, Asia and Europe/Middle East and
North Africa.1
Figure ES-2. Chinese-manufactured WHR Equipment Installation Costs
0.0
0.5
1.0
1.5
2.0
2.5
3.0
EuropeAsiaChina
Inst
alla
tion
Cost
s, US
$/ M
We
Typical Range:1,100 – 1,400 $/kW
Typical Range:1,600 – 2,200 $/kW
Typical Range:2,000 – 3,000 $/kW
Local Scope China Equip.
Based on 5000 tpd, 4-5 stage preheater, 3-4% moisture contentSource: Based on Holcim 2013; OneStoneResearch 2013; IFC
Waste Heat Recovery (WHR) can reduce the operating costs and improve EBITDA margins of cement factories by about 10 to 15 percent. On average, electric power ex-
penses account for up to 25 percent of total operating costs
of a cement factory. WHR technology utilizes residual heat in
the exhaust gases generated in the cement manufacturing
process and can provide low-temperature heating or generate
up to 30 percent of overall plant electricity needs. WHR-based
electric power generation offers several advantages:
Reduces purchased power consumption (or reduces
reliance on fossil-fuel-based captive power plants)
Mitigates the impact of future electric price increases
1 The above CAPEX estimates are based on Chinese WHR equipment. Experience from WHR project in various regions suggest that often times installation costs are higher, and in certain cases reach up to US$5,000 per kWe depending upon WHR power technology type and installed capacity. For instance European-manufactured WHR power systems could cost up to US$3,800 per kW e.
Executive Summary
Waste Heat Recovery for the Cement Sector 2
Enhances plant power reliability
Improves plant competitive position in the market
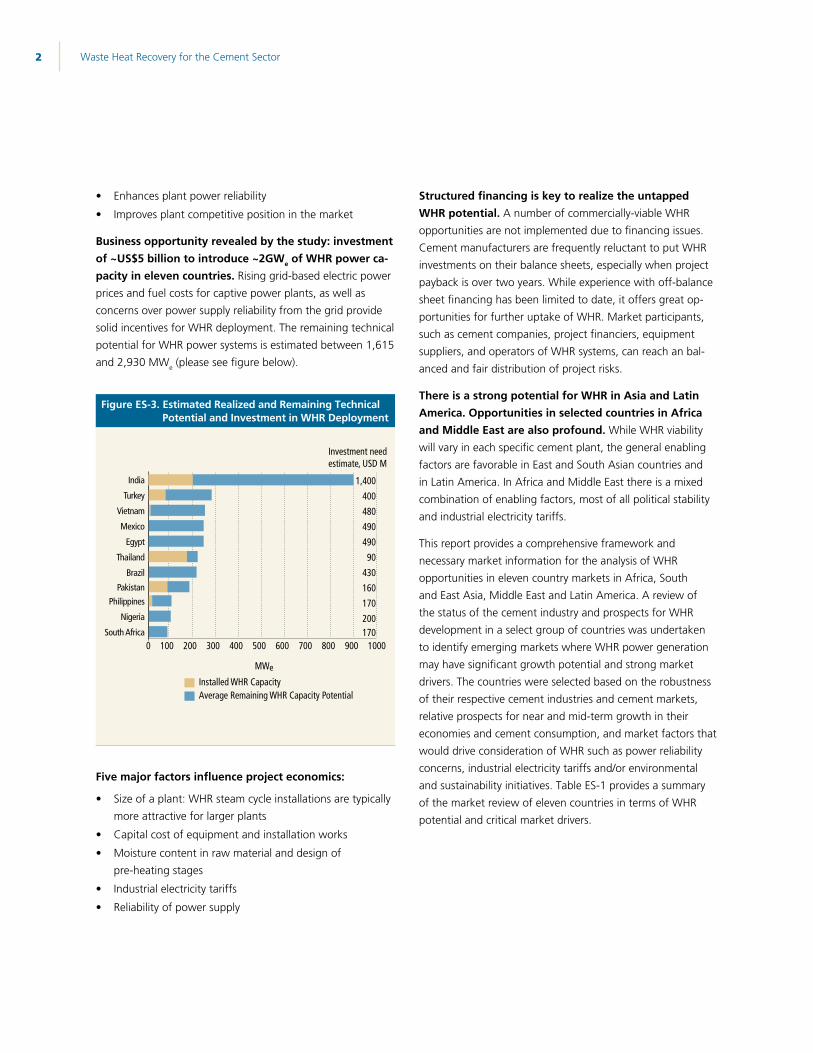
Business opportunity revealed by the study: investment of ~US$5 billion to introduce ~2GWe of WHR power ca-pacity in eleven countries. Rising grid-based electric power prices and fuel costs for captive power plants, as well as concerns over power supply reliability from the grid provide solid incentives for WHR deployment. The remaining technical potential for WHR power systems is estimated between 1,615 and 2,930 MW e (please see figure below).
Figure ES-3. Estimated Realized and Remaining Technical Potential and Investment in WHR Deployment
0 100 200 300 400 500 600 700 800South Africa
Nigeria
Philippines
Brazil
Pakistan
Thailand
Egypt
Mexico
Vietnam
Turkey
India
900 1000
MWe
Installed WHR CapacityAverage Remaining WHR Capacity Potential
1,40040048049049090
430160170200170
Investment needestimate, USD M
Five major factors influence project economics:
Size of a plant: WHR steam cycle installations are typically more attractive for larger plants
Capital cost of equipment and installation works
Moisture content in raw material and design of pre-heating stages
Industrial electricity tariffs
Reliability of power supply
Structured financing is key to realize the untapped WHR potential. A number of commercially-viable WHR opportunities are not implemented due to financing issues. Cement manufacturers are frequently reluctant to put WHR investments on their balance sheets, especially when project payback is over two years. While experience with off-balance sheet financing has been limited to date, it offers great op-portunities for further uptake of WHR. Market participants, such as cement companies, project financiers, equipment suppliers, and operators of WHR systems, can reach an bal-anced and fair distribution of project risks.
There is a strong potential for WHR in Asia and Latin America. Opportunities in selected countries in Africa and Middle East are also profound. While WHR viability will vary in each specific cement plant, the general enabling factors are favorable in East and South Asian countries and in Latin America. In Africa and Middle East there is a mixed combination of enabling factors, most of all political stability and industrial electricity tariffs.
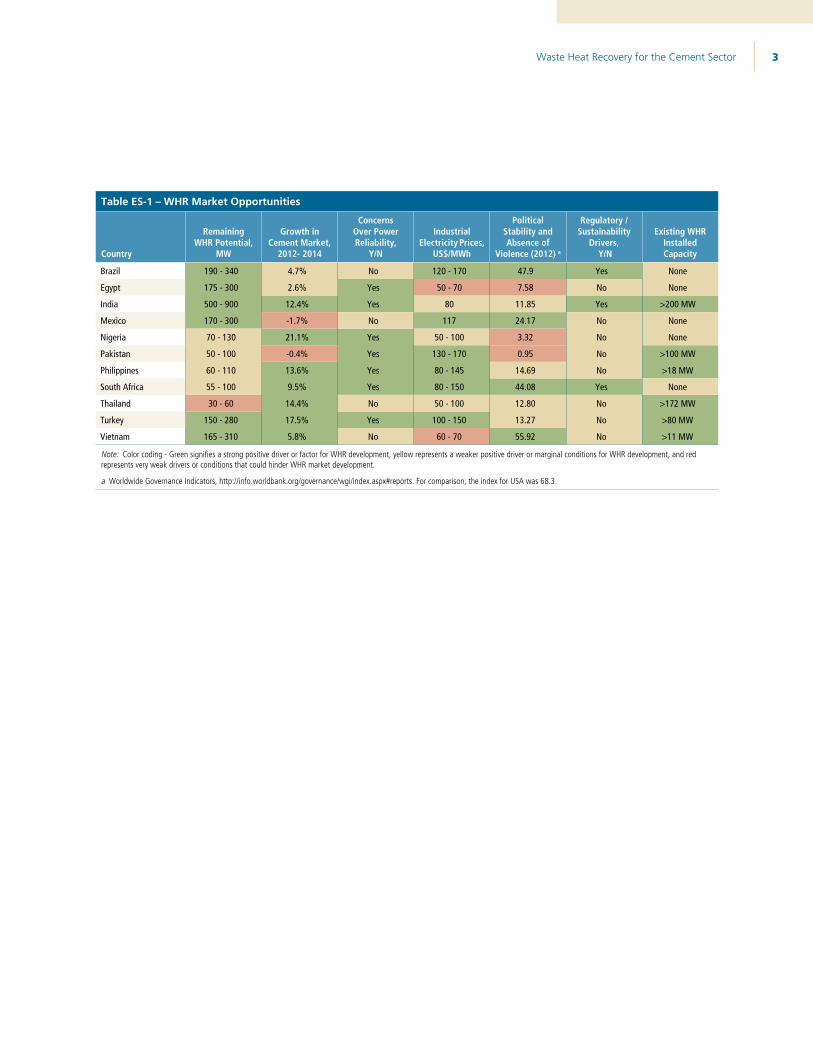
This report provides a comprehensive framework and necessary market information for the analysis of WHR opportunities in eleven country markets in Africa, South and East Asia, Middle East and Latin America. A review of the status of the cement industry and prospects for WHR development in a select group of countries was undertaken to identify emerging markets where WHR power generation may have significant growth potential and strong market drivers. The countries were selected based on the robustness of their respective cement industries and cement markets, relative prospects for near and mid-term growth in their economies and cement consumption, and market factors that would drive consideration of WHR such as power reliability concerns, industrial electricity tariffs and/or environmental and sustainability initiatives. Table ES-1 provides a summary of the market review of eleven countries in terms of WHR potential and critical market drivers.
Waste Heat Recovery for the Cement Sector 3
Table ES-1 – WHR Market Opportunities
Country
Remaining WHR Potential,
MW
Growth in Cement Market,
2012- 2014
Concerns Over Power Reliability,
Y/N
Industrial Electricity Prices,
US$/MWh
Political Stability and Absence of
Violence (2012) a
Regulatory / Sustainability
Drivers, Y/N
Existing WHR Installed Capacity
Brazil 190 - 340 4.7% No 120 - 170 47.9 Yes None
Egypt 175 - 300 2.6% Yes 50 - 70 7.58 No None
India 500 - 900 12.4% Yes 80 11.85 Yes >200 MW
Mexico 170 - 300 -1.7% No 117 24.17 No None
Nigeria 70 - 130 21.1% Yes 50 - 100 3.32 No None
Pakistan 50 - 100 -0.4% Yes 130 - 170 0.95 No >100 MW
Philippines 60 - 110 13.6% Yes 80 - 145 14.69 No >18 MW
South Africa 55 - 100 9.5% Yes 80 - 150 44.08 Yes None
Thailand 30 - 60 14.4% No 50 - 100 12.80 No >172 MW
Turkey 150 - 280 17.5% Yes 100 - 150 13.27 No >80 MW
Vietnam 165 - 310 5.8% No 60 - 70 55.92 No >11 MW
Note: Color coding - Green signifies a strong positive driver or factor for WHR development, yellow represents a weaker positive driver or marginal conditions for WHR development, and red represents very weak drivers or conditions that could hinder WHR market development.
a Worldwide Governance Indicators, http://info.worldbank.org/governance/wgi/index.aspx#reports. For comparison, the index for USA was 68.3.
Waste Heat Recovery for the Cement Sector 4
Cement is the world’s most widely used construction material. Cement is the binding material that is mixed with an aggre-gate such as sand or gravel and water to form concrete. Over three tons of concrete are produced each year per person for the entire global population, making it the most widely used manufactured product in the world. Twice as much concrete is used around the globe than the total of all other building materials combined, including wood, steel, plastic and alumi-num, and for most purposes, none of these other materials can replace concrete in terms of effectiveness, price or per-formance. The preference for concrete as a building material stems from low manufacturing cost, and the fact that it can be produced locally from widely available raw materials; it is moldable; it has high compressive strength. Cement provides cohesion and strength to the concrete mix as well as low permeability and high durability.2
Clinker is an intermediate product in the cement manufactur-ing process, which is produced by sintering finely ground raw materials (mainly limestone and clay or shale). Raw materials are selected in proportions that create the right combination of oxides—CaO, SiO2, Al2O3 and Fe2O3. These minerals are fused into new mineralogical phases when heated to around 1450° C (2640° F) in a rotary kiln. This fused product is called clinker. Calcium oxide (CaO) is the primary oxide in clinker
2 Ordinary Portland Cement is a basic ingredient in concrete, mortar, stucco, and most non-specialty grout. It consists of ground Portland cement clinker (more than 90 percent), a limited amount of calcium sulfate (which controls the set time) and up to five percent minor constituents as allowed by various standards such as the European Standard EN 197-1. Blended cements are similar to Portland cement with one or more supplemental cementitious materials (SCMs) such as blastfurnace slag from iron production, pulverized fly ash from coal-fired electricity power stations, and volcanic ash or pozzolana added at the cement grinding stage. The production of blended cements is growing worldwide because of their lower clinker content and cost, and the fact that they can improve concrete performance in terms of permeability, strength and workability depending on the type and proportion of SCM included in the blend. For this report, unless otherwise noted, the broad term “cement” includes all hydraulic binders, including all types of Portland and blended cements.
and since limestone is the most abundant and lowest-cost source of CaO, clinker plants are often built alongside or close to limestone quarries. Clinker is ground into a fine powder with small quantities of gypsum and other components to become cement. Ordinary Portland Cement (OPC) generally contains at least 90 percent clinker. By modifying the raw material mix, slight compositional variations can be achieved to produce cements with different properties.3
The cement industry has a significant environmental footprint due to the extensive amounts of energy and raw materials used in the process. Cement manufacturing is energy intensive—the WBCSD Cement Sustainability Initiative (CSI) indicates that in 2011 the average thermal energy and electricity consumed to produce one tonne of clinker among its reporting companies was 3,610 MJ (3.42 MMBtu) and 106 kWh respectively, although these values can vary greatly depending on the age and configuration of clinker kilns (GNR Database 2013, CSI). Consequently, cement manufacture releases a great deal of carbon dioxide (CO2). In fact, cement production is responsible for about five percent of total global CO2 emissions (IEA 2009). The CO2 emissions result from fuel consumption in the kiln and the de-carbonation of limestone to produce CaO (CaCO3 + Heat => CaO + CO2). Typically, 40 percent of direct CO2 emissions for OPC comes from combusting fuel required to drive the reactions necessary to make clinker; 60 percent comes from the de-carbonation reaction itself. Cement plants can be flexible in the fuel used, however today in most countries the primary fuel in use is coal because it is relatively low cost and the coal ash can add necessary minerals to the cement product. Indirect emissions from electric power consumption and internal transport contribute another 10 percent to overall CO2 emissions (WBCSD/IEA 2009).
3 In the U.S.A., different cement varieties are denoted by the American Society for Testing and Materials (ASTM) Specification C-150.
Introduction

Waste Heat Recovery for the Cement Sector 5
Cement industry CO2 reduction strategies are focused on reducing the emissions intensity of cement production (emissions per ton of cement product). Approaches include installing more fuel-efficient kilns, using less carbon-intensive fuels in the kiln, partial substitution of noncarbonated sources of CaO in the kiln raw materials, and partial substitution of supplementary cementitious materials (SCM) such as blast furnace slag, fly ash and limestone for OPC in finished cement products. Because SCMs do not require the energy-intensive clinker production (kiln) phase of cement production, their use, or the use of inert additive or extenders, reduces CO2 intensity of the final product. The use of SCM and other materials for blended cement is growing worldwide (Crow 2008). For example, in the United States, the ASTM C-595 standard for blended cement was amended in 2012 to allow the addition of up to 15 percent limestone in certain blends. Research continues on developing cements that require less energy to manufacture than OPC and/or to use more benign raw materials.

Waste Heat Recovery for the Cement Sector 6
ConsumptionTotal worldwide cement consumption reached 3,312 Mt
in 2010, up 10.4 percent over the previous year (Figure 1).
Global consumption continued to climb, rising to 3,585 Mt
in 2011 and an estimated 3,738 Mt in 2012 (increases of 8.3
percent and 4.2 percent respectively) (ICR 2013). Estimated
consumption for 2013 is over 3,900 Mt.
Figure 1: Global Cement Demand
0
500
1,000
1,500
2,000
2,500
3,000
3,500
4,000
2013E20122011201020092008200720062005200420032002
Cem
ent D
eman
d, M
T pe
r yea
r
E = EstimatedSource: ARMSTRONG 2012; ICR 2013
As shown in Table 1, the increase in global cement demand
has been driven by economic expansion in emerging econo-
mies, where demand has risen sharply as these countries
undergo urbanization and industrialization. Emerging econo-
mies now consume 90 percent of the world’s cement output.
China has been the primary engine for global demand
growth; it is estimated to account for 58 percent of global
demand in 2012. However, annual growth rates for China,
which reached 16 percent in 2010, have softened somewhat,
slowing to 5.0 to 6.0 percent over 2011 and 2012 as China’s
economy approaches a more sustainable growth rate. Exclud-
ing China, worldwide consumption climbed by 4.4 percent to
1,462 Mt in 2010, 5.0 percent to 1,535 Mt in 2011, and 2.7
percent to 1,576 Mt in 2012. National cement consumption is
influenced by socio-economic development level, demograph-
ic characteristics, building material preferences, earthquake
zones, and the relative cost of alternative building materials.
In 2012, cement consumption per capita ranged from less
than 100 kg in Sub-Saharan African countries to over 1,500
kg in China (ICR 2013).
Table 1: Top Cement Consuming Countries
Country
Cement Consumption, Mta
2006 2007 2008 2010 2012E
China 1,200.0 1,320.0 1,372.0 1,850.0 2,160.0
India 152.1 165.7 174.0 221.0 241.8
United States 122.0 110.6 93.5 71.2 80.9
Brazil 40.7 45.1 51.6 60.0 69.2
Russia 52.0 61.0 60.8 49.4 63.0
Iran 35.6 41.2 44.5 54.8 58.5
Turkey 41.7 42.5 42.6 50.0 57.8
Indonesia 32.1 34.2 38.1 40.8 55.0
Egypt 30.0 34.5 38.4 49.5 51.1
Vietnam 31.7 35.9 40.2 50.2 45.5
Republic of Korea 48.4 50.8 53.6 45.5 44.3
Japan 58.6 55.9 51.0 41.8 43.0
Saudi Arabia 24.7 26.8 29.9 41.3 42.7
Mexico 35.9 36.6 35.1 33.9 35.6
Germany 28.9 27.2 27.6 24.7 27.4
Thailand 26.6 24.9 25.8 24.5 26.8
Italy 46.9 46.3 41.8 33.9 26.0
Pakistan 16.9 21.0 21.1 22.6 24.8
Algeria 15.2 16.1 17.5 19.0 20.6
France 24.1 24.8 24.2 19.8 20.0
Note: China consumption includes all recorded cement types, not all to international standardsE = EstimatedSource: ICR 2013; USGS 2013
ProductionAt year-end 2012, the global cement industry comprised
5,673 cement production facilities, including both integrated
and grinding capacity, of which 3,700 were in China. Esti-
mated total cement capacity for 2012 is 5,245 Mt—2,950 Mt
in China (ICR 2013). Estimated global cement production for
2012 is between 3,700 Mt (USGS 2013) and 3,831 Mt (ICR
World Cement Consumption and Production
Waste Heat Recovery for the Cement Sector 7
Table 2: World Cement Production and Clinker Capacity
Country
Cement Production, Mt
Clinker Capacity, Mt
2012 2013E 2012E 2013E
China 2,210.0 2,300.0 1,800.0 1,900.0
India 270.0 280.0 280.0 280.0
United States 74.9 77.8 106.0 105.0
Iran 70.0 75.0 75.0 80.0
Brazil 68.8 70.0 57.0 60.0
Turkey 63.9 70.0 66.9 70.0
Vietnam 60.0 65.0 68.0 70.0
Russia 61.5 65.0 80.0 80.0
Japan 51.3 53.0 55.0 55.0
Saudi Arabia 50.0 50.0 55.0 55.0
Republic of Korea 48.0 49.0 50.0 50.0
Egypt 46.1 46.0 46.0 46.0
Mexico 35.4 36.0 42.0 42.0
Indonesia 32.0 35.0 47.5 50.0
Thailand 37.0 35.0 50.0 50.0
Germany 32.4 34.0 31.0 31.0
Pakistan 32.0 32.0 42.5 42.5
Italy 33.0 29.0 46.0 46.0
Other Countries (rounded)
524.0 597.0 312.0 291.0
Total (rounded) 3,800 4,000 3,300.0 3,400.0
E = EstimatedSource: USGS 2014
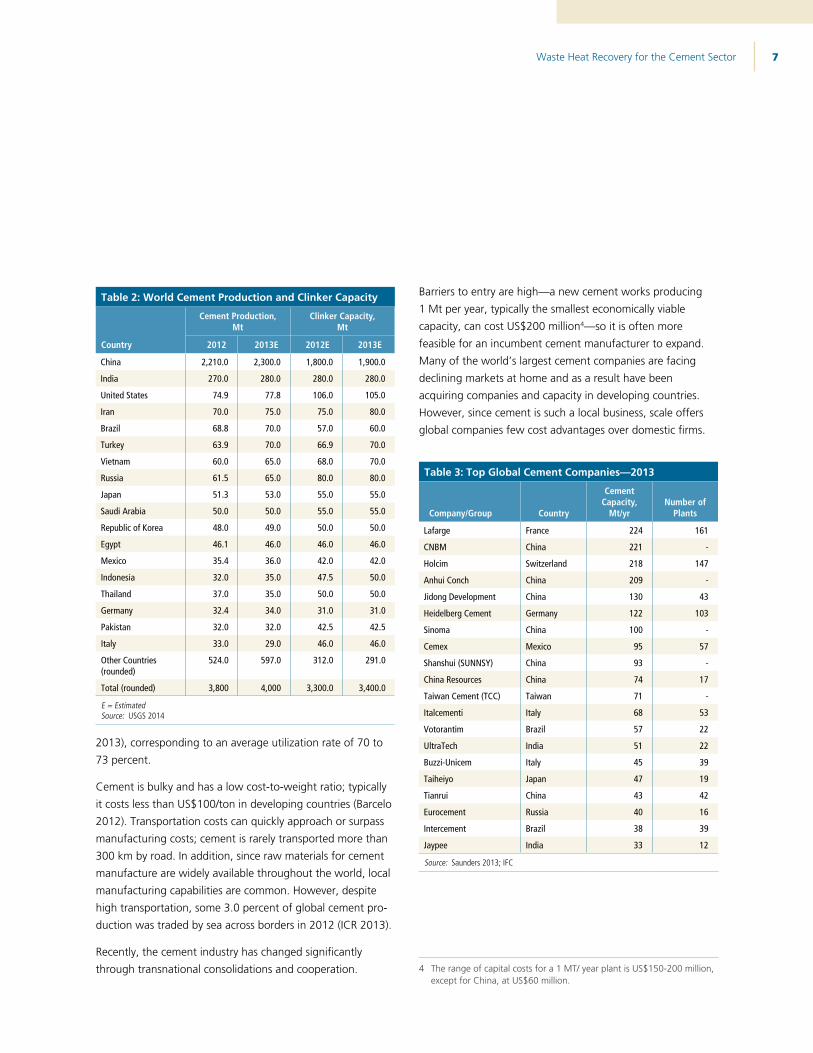
2013), corresponding to an average utilization rate of 70 to 73 percent.
Cement is bulky and has a low cost-to-weight ratio; typically it costs less than US$100/ton in developing countries (Barcelo 2012). Transportation costs can quickly approach or surpass manufacturing costs; cement is rarely transported more than 300 km by road. In addition, since raw materials for cement manufacture are widely available throughout the world, local manufacturing capabilities are common. However, despite high transportation, some 3.0 percent of global cement pro-duction was traded by sea across borders in 2012 (ICR 2013).
Recently, the cement industry has changed significantly through transnational consolidations and cooperation.
Barriers to entry are high—a new cement works producing 1 Mt per year, typically the smallest economically viable capacity, can cost US$200 million4—so it is often more feasible for an incumbent cement manufacturer to expand. Many of the world’s largest cement companies are facing declining markets at home and as a result have been acquiring companies and capacity in developing countries. However, since cement is such a local business, scale offers global companies few cost advantages over domestic firms.
Table 3: Top Global Cement Companies —2013
Company/Group Country
Cement Capacity,
Mt/yrNumber of
Plants
Lafarge France 224 161
CNBM China 221 -
Holcim Switzerland 218 147
Anhui Conch China 209 -
Jidong Development China 130 43
Heidelberg Cement Germany 122 103
Sinoma China 100 -
Cemex Mexico 95 57
Shanshui (SUNNSY) China 93 -
China Resources China 74 17
Taiwan Cement (TCC) Taiwan 71 -
Italcementi Italy 68 53
Votorantim Brazil 57 22
UltraTech India 51 22
Buzzi-Unicem Italy 45 39
Taiheiyo Japan 47 19
Tianrui China 43 42
Eurocement Russia 40 16
Intercement Brazil 38 39
Jaypee India 33 12
Source: Saunders 2013; IFC
4 The range of capital costs for a 1 MT/ year plant is US$150-200 million, except for China, at US$60 million.
Waste Heat Recovery for the Cement Sector 8
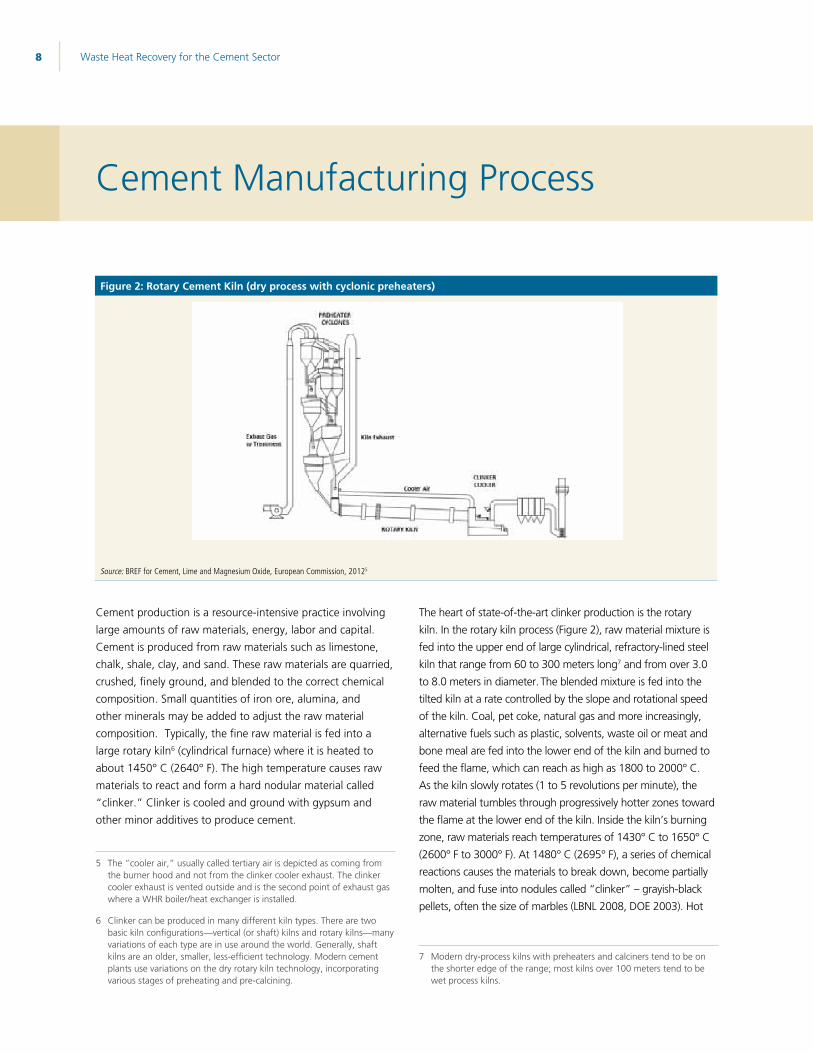
Cement production is a resource-intensive practice involving large amounts of raw materials, energy, labor and capital. Cement is produced from raw materials such as limestone, chalk, shale, clay, and sand. These raw materials are quarried, crushed, finely ground, and blended to the correct chemical composition. Small quantities of iron ore, alumina, and other minerals may be added to adjust the raw material composition. Typically, the fine raw material is fed into a large rotary kiln6 (cylindrical furnace) where it is heated to about 1450° C (2640° F). The high temperature causes raw materials to react and form a hard nodular material called “clinker.” Clinker is cooled and ground with gypsum and other minor additives to produce cement.
5 The ”cooler air,” usually called tertiary air is depicted as coming from the burner hood and not from the clinker cooler exhaust. The clinker cooler exhaust is vented outside and is the second point of exhaust gas where a WHR boiler/heat exchanger is installed.
6 Clinker can be produced in many different kiln types. There are two basic kiln configurations—vertical (or shaft) kilns and rotary kilns—many variations of each type are in use around the world. Generally, shaft kilns are an older, smaller, less-efficient technology. Modern cement plants use variations on the dry rotary kiln technology, incorporating various stages of preheating and pre-calcining.
The heart of state-of-the-art clinker production is the rotary kiln. In the rotary kiln process (Figure 2), raw material mixture is fed into the upper end of large cylindrical, refractory-lined steel kiln that range from 60 to 300 meters long7 and from over 3.0 to 8.0 meters in diameter. The blended mixture is fed into the tilted kiln at a rate controlled by the slope and rotational speed of the kiln. Coal, pet coke, natural gas and more increasingly, alternative fuels such as plastic, solvents, waste oil or meat and bone meal are fed into the lower end of the kiln and burned to feed the flame, which can reach as high as 1800 to 2000° C. As the kiln slowly rotates (1 to 5 revolutions per minute), the raw material tumbles through progressively hotter zones toward the flame at the lower end of the kiln. Inside the kiln’s burning zone, raw materials reach temperatures of 1430° C to 1650° C (2600° F to 3000° F). At 1480° C (2695° F), a series of chemical reactions causes the materials to break down, become partially molten, and fuse into nodules called “clinker” – grayish-black pellets, often the size of marbles (LBNL 2008, DOE 2003). Hot
7 Modern dry-process kilns with preheaters and calciners tend to be on the shorter edge of the range; most kilns over 100 meters tend to be wet process kilns.
Cement Manufacturing Process
Figure 2: Rotary Cement Kiln (dry process with cyclonic preheaters)
Source: BREF for Cement, Lime and Magnesium Oxide, European Commission, 20125
Waste Heat Recovery for the Cement Sector 9
exhaust gases exiting through the kiln are used to preheat and calcine the raw material feed before it enters the kiln’s burning zone.Clinker is discharged red-hot from the lower end of the kiln into air coolers to lower it to handling temperatures. Cooled clinker is combined with gypsum and other additives and ground into a fine gray powder called cement. Many cement plants include the final cement grinding and mixing operation at the site. Others ship some or all of their clinker production to stand-alone cement-grinding plants situated close to markets.
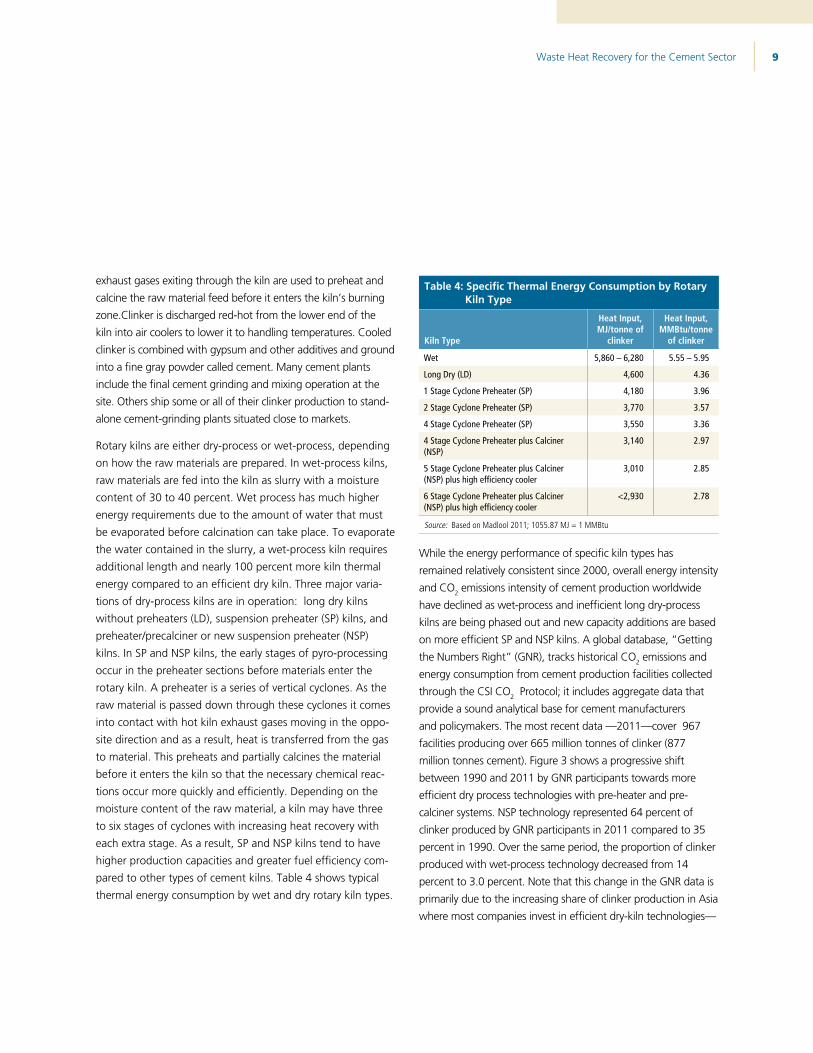
Rotary kilns are either dry-process or wet-process, depending on how the raw materials are prepared. In wet-process kilns, raw materials are fed into the kiln as slurry with a moisture content of 30 to 40 percent. Wet process has much higher energy requirements due to the amount of water that must be evaporated before calcination can take place. To evaporate the water contained in the slurry, a wet-process kiln requires additional length and nearly 100 percent more kiln thermal energy compared to an efficient dry kiln. Three major varia-tions of dry-process kilns are in operation: long dry kilns without preheaters (LD), suspension preheater (SP) kilns, and preheater/precalciner or new suspension preheater (NSP) kilns. In SP and NSP kilns, the early stages of pyro-processing occur in the preheater sections before materials enter the rotary kiln. A preheater is a series of vertical cyclones. As the raw material is passed down through these cyclones it comes into contact with hot kiln exhaust gases moving in the oppo-site direction and as a result, heat is transferred from the gas to material. This preheats and partially calcines the material before it enters the kiln so that the necessary chemical reac-tions occur more quickly and efficiently. Depending on the moisture content of the raw material, a kiln may have three to six stages of cyclones with increasing heat recovery with each extra stage. As a result, SP and NSP kilns tend to have higher production capacities and greater fuel efficiency com-pared to other types of cement kilns. Table 4 shows typical thermal energy consumption by wet and dry rotary kiln types.
Table 4: Specific Thermal Energy Consumption by Rotary Kiln Type
Kiln Type
Heat Input, MJ/tonne of
clinker
Heat Input, MMBtu/tonne
of clinker
Wet 5,860 – 6,280 5.55 – 5.95
Long Dry (LD) 4,600 4.36
1 Stage Cyclone Preheater (SP) 4,180 3.96
2 Stage Cyclone Preheater (SP) 3,770 3.57
4 Stage Cyclone Preheater (SP) 3,550 3.36
4 Stage Cyclone Preheater plus Calciner (NSP)
3,140 2.97
5 Stage Cyclone Preheater plus Calciner (NSP) plus high efficiency cooler
3,010 2.85
6 Stage Cyclone Preheater plus Calciner (NSP) plus high efficiency cooler
<2,930 2.78
Source: Based on Madlool 2011; 1055.87 MJ = 1 MMBtu
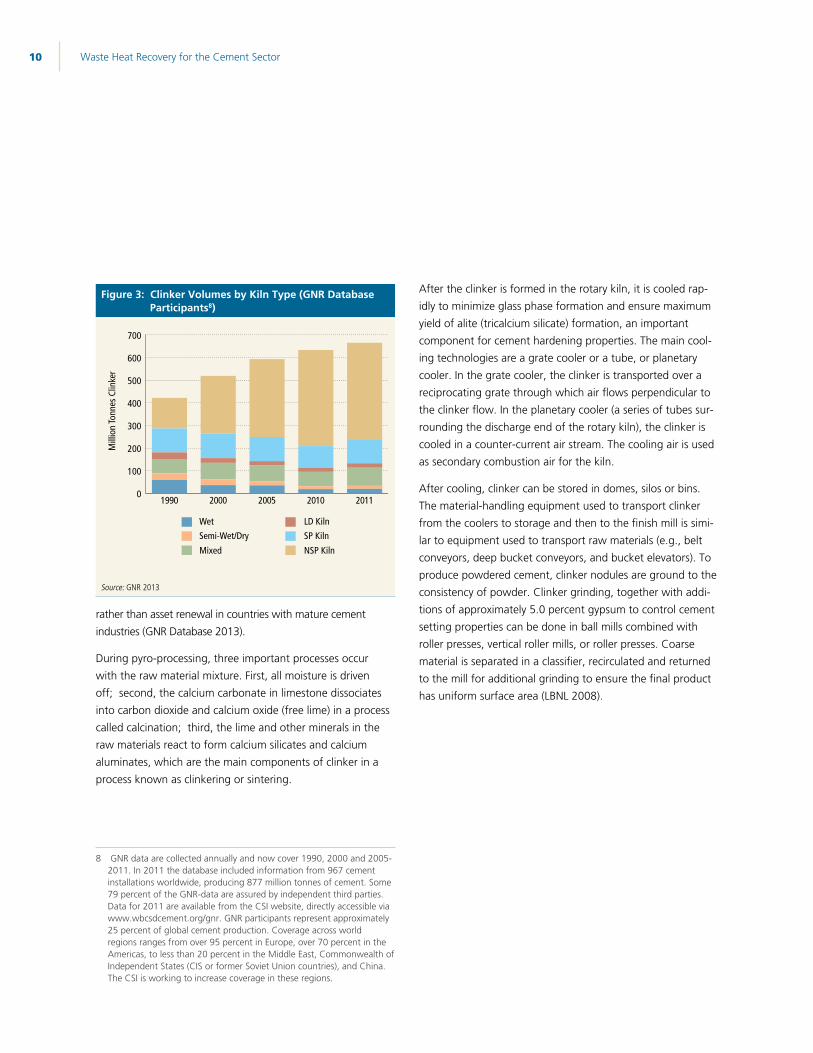
While the energy performance of specific kiln types has remained relatively consistent since 2000, overall energy intensity and CO2 emissions intensity of cement production worldwide have declined as wet-process and inefficient long dry-process kilns are being phased out and new capacity additions are based on more efficient SP and NSP kilns. A global database, “Getting the Numbers Right” (GNR), tracks historical CO2 emissions and energy consumption from cement production facilities collected through the CSI CO2 Protocol; it includes aggregate data that provide a sound analytical base for cement manufacturers and policymakers. The most recent data —2011—cover 967 facilities producing over 665 million tonnes of clinker (877 million tonnes cement). Figure 3 shows a progressive shift between 1990 and 2011 by GNR participants towards more efficient dry process technologies with pre-heater and pre-calciner systems. NSP technology represented 64 percent of clinker produced by GNR participants in 2011 compared to 35 percent in 1990. Over the same period, the proportion of clinker produced with wet-process technology decreased from 14 percent to 3.0 percent. Note that this change in the GNR data is primarily due to the increasing share of clinker production in Asia where most companies invest in efficient dry-kiln technologies—
Waste Heat Recovery for the Cement Sector 10
Figure 3: Clinker Volumes by Kiln Type (GNR Database Participants8)
0
100
200
300
400
500
600
700
20112010200520001990
Mill
ion
Tonn
es C
linke
r
NSP KilnSP KilnLD Kiln
MixedSemi-Wet/DryWet
Source: GNR 2013
rather than asset renewal in countries with mature cement industries (GNR Database 2013).
During pyro-processing, three important processes occurwith the raw material mixture. First, all moisture is driven off; second, the calcium carbonate in limestone dissociates into carbon dioxide and calcium oxide (free lime) in a process called calcination; third, the lime and other minerals in the raw materials react to form calcium silicates and calcium aluminates, which are the main components of clinker in a process known as clinkering or sintering.
8 GNR data are collected annually and now cover 1990, 2000 and 2005-2011. In 2011 the database included information from 967 cement installations worldwide, producing 877 million tonnes of cement. Some 79 percent of the GNR-data are assured by independent third parties. Data for 2011 are available from the CSI website, directly accessible via www.wbcsdcement.org/gnr. GNR participants represent approximately 25 percent of global cement production. Coverage across world regions ranges from over 95 percent in Europe, over 70 percent in the Americas, to less than 20 percent in the Middle East, Commonwealth of Independent States (CIS or former Soviet Union countries), and China. The CSI is working to increase coverage in these regions.
After the clinker is formed in the rotary kiln, it is cooled rap-idly to minimize glass phase formation and ensure maximum yield of alite (tricalcium silicate) formation, an important component for cement hardening properties. The main cool-ing technologies are a grate cooler or a tube, or planetary cooler. In the grate cooler, the clinker is transported over a reciprocating grate through which air flows perpendicular to the clinker flow. In the planetary cooler (a series of tubes sur-rounding the discharge end of the rotary kiln), the clinker is cooled in a counter-current air stream. The cooling air is used as secondary combustion air for the kiln.
After cooling, clinker can be stored in domes, silos or bins. The material-handling equipment used to transport clinker from the coolers to storage and then to the finish mill is simi-lar to equipment used to transport raw materials (e.g., belt conveyors, deep bucket conveyors, and bucket elevators). To produce powdered cement, clinker nodules are ground to the consistency of powder. Clinker grinding, together with addi-tions of approximately 5.0 percent gypsum to control cement setting properties can be done in ball mills combined with roller presses, vertical roller mills, or roller presses. Coarse material is separated in a classifier, recirculated and returned to the mill for additional grinding to ensure the final product has uniform surface area (LBNL 2008).
Waste Heat Recovery for the Cement Sector 11
State-of-the-art new suspension process (NSP) kilns include
multi-stage preheaters and pre-calciners to preprocess raw
materials before they enter the kiln, and an air-quench system
to cool the clinker product. Kiln exhaust streams, from the
clinker cooler and the kiln preheater system, contain useful
thermal energy that can be converted into power. Typically,
the clinker coolers release large amounts of heated air at 250
to 340° C (480 to 645° F) directly into the atmosphere. At the
kiln charging side, the 300 to 400° C (570 to 750° F) kiln gas
coming off the preheaters is typically used to dry material in
the raw mill and/or the coal mill and then sent to electrostatic
precipitators or bag filter houses to remove dust before finally
being vented to the atmosphere. If the raw mill is down, the
exhaust gas would be cooled with a water spray or cold air
before it entered the dust collectors. Maximizing overall kiln
process efficiency is paramount for efficient plant operation,
but remaining waste heat from the preheater exhausts and
clinker coolers can be recovered and used to provide low tem-
perature heating needs in the plant, or used to generate power
to offset a portion of power purchased from the grid, or cap-
tive power generated by fuel consumption at the site. Typically,
cement plants do not have significant low-temperature heating
requirements, so most waste heat recovery projects have been
for power generation. The amount of waste heat available for
recovery depends on kiln system design and production, the
moisture content of the raw materials, and the amount of heat
required for drying in the raw mill system, solid fuel system and
cement mill. Waste heat recovery can provide up to 30 percent
of a cement plant’s overall electricity needs and offers the fol-
lowing advantages (LBNL 2008, EPA 2010):
Reduces purchased power consumption (or reduces
reliance on captive power plants), which in turn reduces
operating costs
Mitigates the impact of future electric price increases
Enhances plant power reliability
Improves plant competitive position in the market
Lowers plant specific energy consumption, reducing
greenhouse gas emissions (based on credit for reduced
central station power generation or reduced fossil-fired
captive power generation at the cement plant)
Waste Heat Recovery Power SystemsWaste heat recovery power systems used for cement kilns
operate on the Rankine Cycle.9 This thermodynamic cycle is the
basis for conventional thermal power generating stations and
consists of a heat source (boiler) that converts a liquid working
fluid to high-pressure vapor (steam, in a power station) that is
then expanded through a turbogenerator producing power.
Low-pressure vapor exhausted from the turbogenerator is con-
densed back to a liquid state, with condensate from the con-
denser returned to the boiler feedwater pump to continue the
cycle. Waste heat recovery systems consist of heat exchangers
or heat recovery steam generators (HRSGs) that transfer heat
from the exhaust gases to the working fluid inside, turbines,
electric generators, condensers, and a working fluid cooling
system. Three primary waste heat recovery power generation
systems are available, differentiated by the type of working
fluid (Gibbon 2013, EPA 2012, CII 2009), as follows:
Steam Rankine Cycle (SRC) – The most commonly used
Rankine cycle system for waste heat recovery power genera-
tion uses water as the working fluid and involves generating
steam in a waste heat boiler, which then drives a steam tur-
bine. Steam turbines are one of the oldest and most versatile
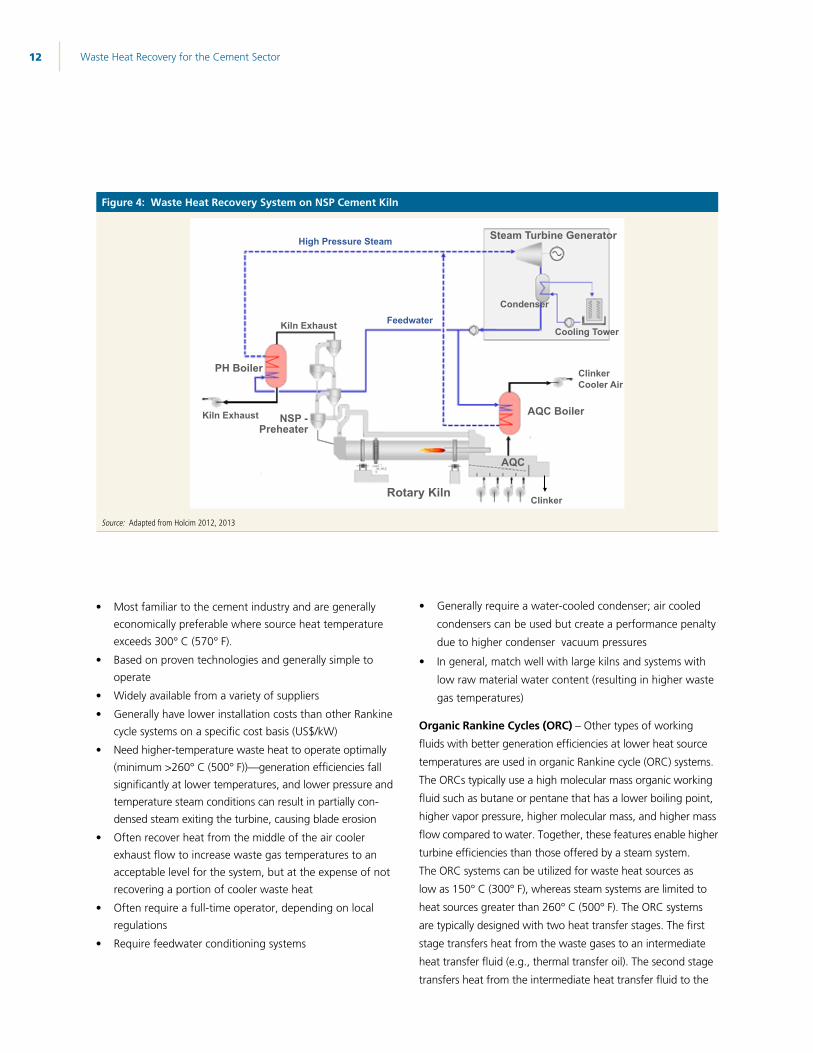
power generation technologies in use. As shown in Figure 4,
in the steam waste heat recovery steam cycle, the working
fluid—water—is first pumped to elevated pressure before
entering a waste heat recovery boiler. The water is vaporized
into high-pressure steam by the hot exhaust from the process
and then expanded to lower temperature and pressure in a
turbine, generating mechanical power that drives an electric
generator. The low-pressure steam is then exhausted to a
condenser at vacuum conditions, where the expanded vapor
is condensed to low-pressure liquid and returned to the feed-
water pump and boiler.
Steam cycles are by far the most common waste heat re-
covery systems in operation in cement plants, and generally
reflect the following:
9 The Rankine cycle is a thermodynamic cycle that converts heat into work. Central station power plants that generate electricity through a high-pressure steam turbine are based on the Rankine cycle.
Waste Heat Recovery in the Cement Process
Waste Heat Recovery for the Cement Sector 12
Most familiar to the cement industry and are generally economically preferable where source heat temperature exceeds 300° C (570° F).
Based on proven technologies and generally simple to operate
Widely available from a variety of suppliers
Generally have lower installation costs than other Rankine cycle systems on a specific cost basis (US$/kW)
Need higher-temperature waste heat to operate optimally (minimum >260° C (500° F))—generation efficiencies fall significantly at lower temperatures, and lower pressure and temperature steam conditions can result in partially con-densed steam exiting the turbine, causing blade erosion
Often recover heat from the middle of the air cooler exhaust flow to increase waste gas temperatures to an acceptable level for the system, but at the expense of not recovering a portion of cooler waste heat
Often require a full-time operator, depending on local regulations
Require feedwater conditioning systems
Generally require a water-cooled condenser; air cooled
condensers can be used but create a performance penalty
due to higher condenser vacuum pressures
In general, match well with large kilns and systems with
low raw material water content (resulting in higher waste
gas temperatures)
Organic Rankine Cycles (ORC) – Other types of working
fluids with better generation efficiencies at lower heat source
temperatures are used in organic Rankine cycle (ORC) systems.
The ORCs typically use a high molecular mass organic working
fluid such as butane or pentane that has a lower boiling point,
higher vapor pressure, higher molecular mass, and higher mass
flow compared to water. Together, these features enable higher
turbine efficiencies than those offered by a steam system.
The ORC systems can be utilized for waste heat sources as
low as 150° C (300° F), whereas steam systems are limited to
heat sources greater than 260° C (500° F). The ORC systems
are typically designed with two heat transfer stages. The first
stage transfers heat from the waste gases to an intermediate
heat transfer fluid (e.g., thermal transfer oil). The second stage
transfers heat from the intermediate heat transfer fluid to the
Figure 4: Waste Heat Recovery System on NSP Cement Kiln
Rotary Kiln
PH Boiler
AQC Boiler
Steam Turbine Generator
Condenser
NSP - Preheater
High Pressure Steam
Feedwater Kiln Exhaust
Clinker Cooler Air
AQC
Clinker
Kiln Exhaust
Cooling Tower
Source: Adapted from Holcim 2012, 2013
Waste Heat Recovery for the Cement Sector 13
organic working fluid. The ORCs have commonly been used
to generate power in geothermal power plants, and more
recently, in pipeline compressor heat recovery applications in
the United States. The ORC systems have been widely used
to generate power from biomass systems in Europe. A few
ORC systems have been installed on cement kilns.10 The ORC’s
specific features include the following (Turboden 2012, Holcim
2011, Ormat 2012, Gibbon 2013):
Can recover heat from gases at lower temperatures than
is possible with conventional steam systems, enabling
ORCs to utilize all recoverable heat from the air cooler
Operate with condensing systems above atmospheric
pressure, reducing risk of air leakage into the system and
eliminating the need for a de-aerator
Not susceptible to freezing
Because ORCs operate at relatively low pressure, they
can operate unattended and fully automated in many
locations depending on local regulations
The organic fluid properties result in the working fluid
remaining dry (no partial condensation) throughout the
turbine, avoiding blade erosion
Can utilize air-cooled condensers without negatively
impacting performance
Lower-speed (rpm) ORC turbine allows generator direct
drive without the need for and inefficiency of a reduction
gear
ORC equipment (turbines, piping, condensers, heat
exchanger surface) is typically smaller than that required
for steam systems, and the turbine generally consists of
fewer stages
10 Ormat Incorporated, a leading ORC supplier for geothermal applications, has two ORC systems operating in cement plants: a 1.2 MW system installed in 1999 at the Heidelberg Cement plant at Lengfurt, Germany, recovers heat from the clinker cooler vent air; the second ORC system is a 4.8 MW unit located at AP Cement (now Ultra Tech Cement), Tadipatri, Andhra Pradesh, India. Turboden (acquired by Mitsubishi in 2012) installed its first cement industry ORC system (2 MW) at Italcementi’s Ait Baha plant in Morocco in 2010 (5,000 tpd clinker line). In 2012,Turboden installed a 4 MW unit at a Holcim Romani plant in Alesd (4,000 tpd clinker line); Turboden also has systems under construction at Holcim Slovakia (5 MW at 3,600 tpd line at the Rohoznik plant) and an undisclosed North American plant (7 MW). Holcim is installing another 4.7 MW ORC system at its Mississauga, Canada, plant from an undisclosed provider. ABB installed a 1.9 MW ORC system at Holcim’s Untervaz, Switzerland, plant utilizing heat from the preheater, and ABB and Jura cement signed an agreement in October 2012 to install a 2.0 MW ORC system at the Wildegg AG plant in Switzerland.
Although ORCs can provide generation efficiencies
comparable to a steam Rankine system, ORCs are typically
applied to lower temperature exhaust streams, and
limited in sizing and scalability, and generally are smaller
in capacity that steam systems.
Depending on the application, ORC systems often have a
higher specific cost (US$/kW) than steam systems
The two-stage heat transfer process creates some system
inefficiencies
The heat transfer fluids and organic fluids normally used
in ORCs are combustible, requiring fire protection mea-
sures and periodic replacement over time. Also, there may
be environmental concerns over potential system leaks.
In general, ORC systems are well-matched with small- to
medium-size, high-efficiency kilns or kilns with elevated
raw material moisture content
The Kalina Cycle is another Rankine cycle that uses a
binary mixture of water and ammonia as the working fluid,
which allows for a more efficient energy extraction from
the heat source. The Kalina cycle takes advantage of the
ability of ammonia-water mixtures to utilize variable and
lower temperature heat sources. The Kalina cycle has an
operating temperature range that can accept waste heat at
temperatures of 95° C (200° F) to 535° C (1,000° F) and is
claimed to be 15 to 25 percent more efficient than ORCs
at the same temperature level. The Kalina cycle is in market
introduction, with a total of nine operating systems in diverse
industries such as steel and refining, and in geothermal power
plants where the hot fluid is very often a liquid below 150 °C
(300 °F).11 Kalina cycle systems are now being piloted in the
cement industry.12 Key features of the Kalina cycle include the
following (Gibbon 2013, Mirolli 2012):
Can be used in lower temperature applications than
conventional steam Rankine cycle systems
11 An ORC or Kalina cycle operating with a liquid waste heat source can be designed around lower temperatures than one based on a gaseous heat source, such as industrial process flue gases. The minimum liquid waste temperature for economically feasible operation is 95o C (200o F).
12 FLSmidth has an exclusive global license for the Kalina cycle in the cement and lime industries (excluding China) and has two installations completed or under construction in cement plants: a 4.75 MW unit on a 7,500 tpd clinker line at Star Cement’s Ras Al-Khaimah plant in UAE (utilizing air cooler vent only) that was commissioned in 2013, and a 8.5 MW unit on a 7,000 tpd clinker line at D.G. Khan Cement’s Khaipur plant in Pakistan (utilizing preheater and air cooler exhaust).
Waste Heat Recovery for the Cement Sector 14
Highly flexible; the system has a high turn-down ratio and
fast response to changes in heat source temperature and
flow
The ammonia-water mixture can be controlled to achieve
improved heat transfer and higher efficiency by matching
waste heat temperatures and flows
The binary working fluid is non-flammable
The technology is in the early stage of market introduc-
tion with limited suppliers and experience
Application of Waste Heat Recovery Power Systems in the Cement ProcessJapanese companies spearheaded the introduction of steam
cycle waste heat recovery power systems in the cement
industry. In 1980, Kawasaki Heavy Industries (KHI) put the
first waste heat recovery system into operation at Sumitomo
Osaka Cement. The first major commercial system, with a
capacity of 15 MW, has been in operation since 1982 at
Taiheiyo Cement’s Kumagaya plant. China installed its first
system in 1998 in partnership with a Japanese supplier. Gov-
ernment policies and Clean Development Mechanism (CDM)
incentives began to drive the market in China, and by 2012
over 700 units were operating in that country (OneStone
Research 2013). The bulk of market activity today is in Asia;
Chinese companies or joint ventures are the primary suppliers.
The leading manufacturers of waste heat recovery systems
using conventional steam circuit technology are now market-
ing second generation systems with higher supercritical steam
parameters and improved efficiencies that reach output levels
as high as 45 kWh/t of clinker.
In a typical waste heat recovery system installation on an NSP
kiln (Figure 4), waste heat boilers are installed on the hot
exhaust streams exiting the preheaters (NSP-Preheater) and air
quench clinker cooler (AQC) to produce medium/low pressure
steam. The steam is fed into a condensing steam turbine
that drives a generator to produce power. Hot condensate
from the condenser is fed back to the waste heat boilers. The
entire system consists of the PH and AQC waste heat boilers,
the steam turbine generator, and ancillary equipment such
as condenser, water treatment system, boiler feed pump and
recooling system.
Depending on the number of preheater stages (two to six),
the exhaust temperatures from an NSP kiln system typically
range from 280 to 450° C (540 to 840° F), while the waste
air temperatures from the clinker cooler are typically 250
to 330° C (480 to 625° F), depending on the cooling air
volume and recuperation efficiency. In the case of a 3,000 tpd
clinker production line, approximately 170,000 Nm3/h of kiln
exhaust and 150,000 Nm3/h of cooler air are produced (CII
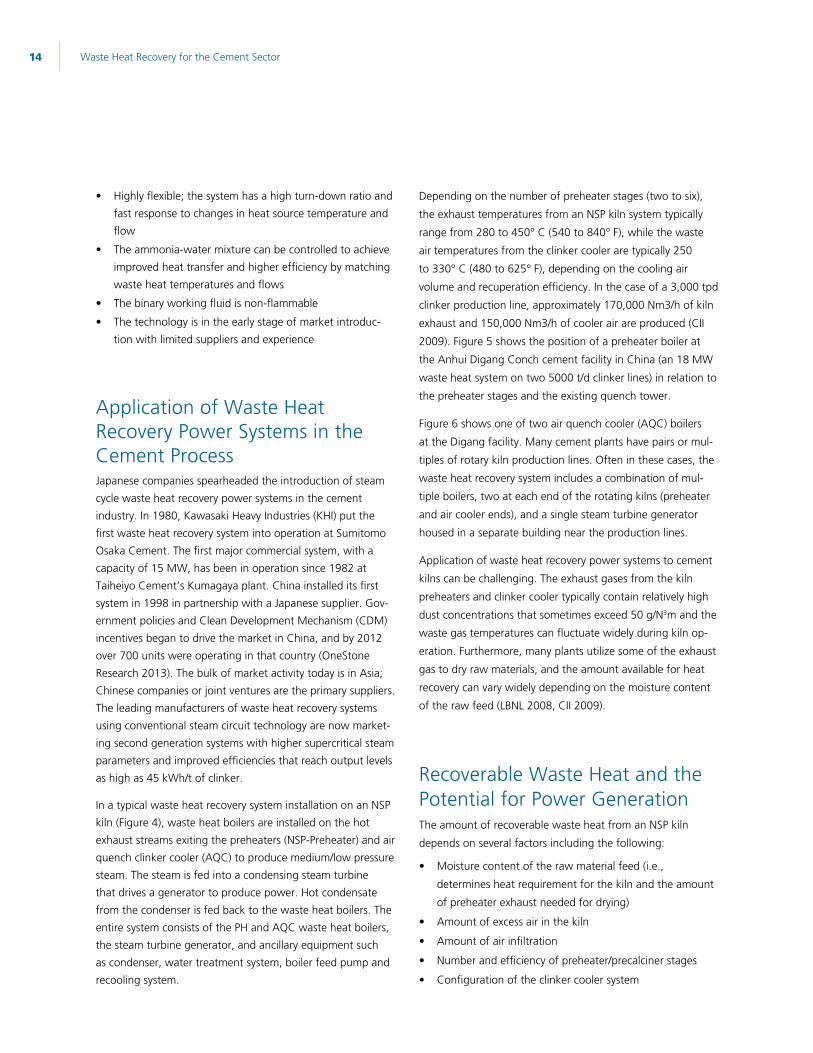
2009). Figure 5 shows the position of a preheater boiler at
the Anhui Digang Conch cement facility in China (an 18 MW
waste heat system on two 5000 t/d clinker lines) in relation to
the preheater stages and the existing quench tower.
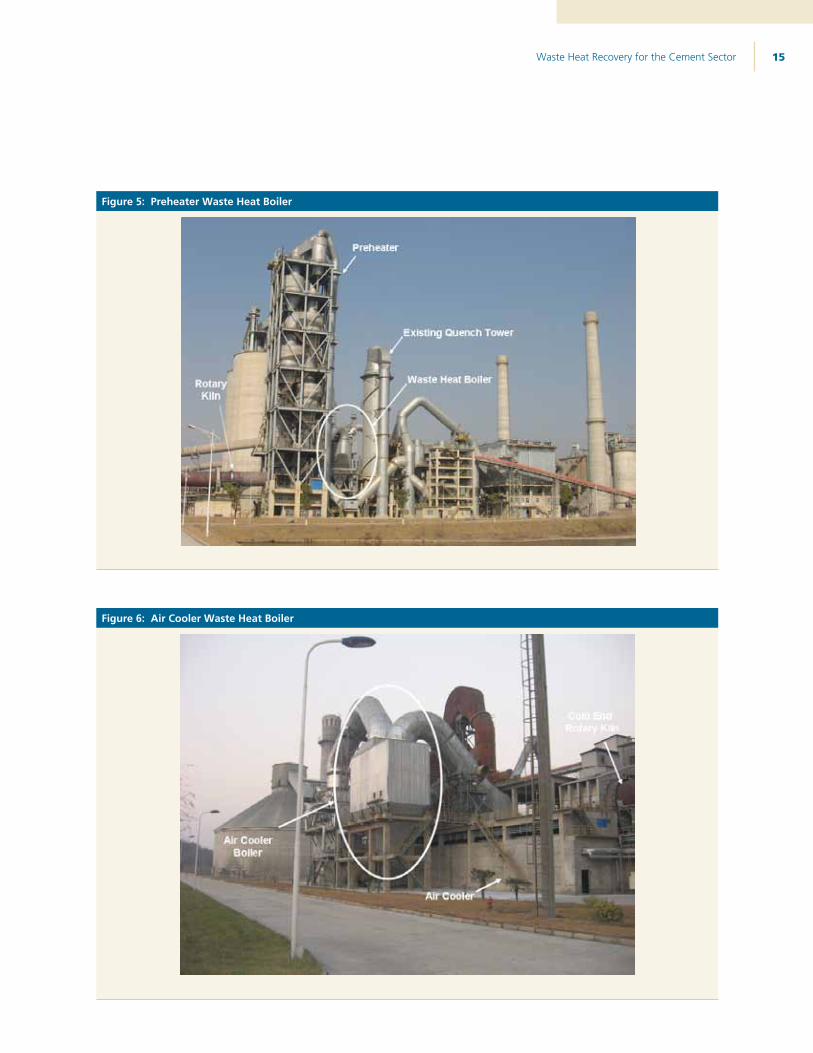
Figure 6 shows one of two air quench cooler (AQC) boilers
at the Digang facility. Many cement plants have pairs or mul-
tiples of rotary kiln production lines. Often in these cases, the
waste heat recovery system includes a combination of mul-
tiple boilers, two at each end of the rotating kilns (preheater
and air cooler ends), and a single steam turbine generator
housed in a separate building near the production lines.
Application of waste heat recovery power systems to cement
kilns can be challenging. The exhaust gases from the kiln
preheaters and clinker cooler typically contain relatively high
dust concentrations that sometimes exceed 50 g/N3m and the
waste gas temperatures can fluctuate widely during kiln op-
eration. Furthermore, many plants utilize some of the exhaust
gas to dry raw materials, and the amount available for heat
recovery can vary widely depending on the moisture content
of the raw feed (LBNL 2008, CII 2009).
Recoverable Waste Heat and the Potential for Power GenerationThe amount of recoverable waste heat from an NSP kiln
depends on several factors including the following:
Moisture content of the raw material feed (i.e.,
determines heat requirement for the kiln and the amount
of preheater exhaust needed for drying)
Amount of excess air in the kiln
Amount of air infiltration
Number and efficiency of preheater/precalciner stages
Configuration of the clinker cooler system
Waste Heat Recovery for the Cement Sector 15
Figure 5: Preheater Waste Heat Boiler
Figure 6: Air Cooler Waste Heat Boiler
Waste Heat Recovery for the Cement Sector 16
The number of preheater stages in a cement plant has sig-nificant bearing on the overall thermal energy consumption and waste heat recovery potential. The higher the number of stages, the higher the overall thermal energy efficiency of the kiln and the lower the potential for waste heat recovery. Selection of the number of preheater stages is based several factors such as cooler efficiency, restrictions on preheater tower height, or heat requirements for the mill itself. Table 5 summarizes the quantity of waste heat recoverable from state-of-the-art NSP kilns. Preheater exhaust temperatures range from 390° C (735° F) for small kilns with four pre-heater stages, to below 300° C (570° F) for large kilns with six preheater stages.
Table 5: Typical Available Heat for Dry Process NSP Kilns
Parameter UnitPreheater
kilnsPreheater with precalciner
(Number of Stages)
Number of cyclone stages 4 4 5 6
Kiln capacity range TPD 1000 - 2500 2000 – 8000
Top stage exit temperature Deg C 390 360 316 282
Heat available in preheater exhaust
GJ / tonne clinker (kcal/
kg)
0.904 (216)
0.754 (180)
0.649 (155)
0.586 (140)
Heat available in preheater exhaust
GJ / hr for 1 MTPA* (Mkcal/hr)
113.0 (27.0)
94.3 (22.5)
81.1 (19.4)
73.3 (17.5)
Specific heat consumption
GJ / tonne clinker (kcal/
kg)3.55 (850) 3.14
(750)3.01
(720)2.93
(700)
*MTPA – Million Metric Tonnes per AnnumSource: Based on “Desk Study on Waste Heat Recovery in the Indian Cement Industry,” Confederation of Indian Industry, Final Report, April 2009 (CII 2009)
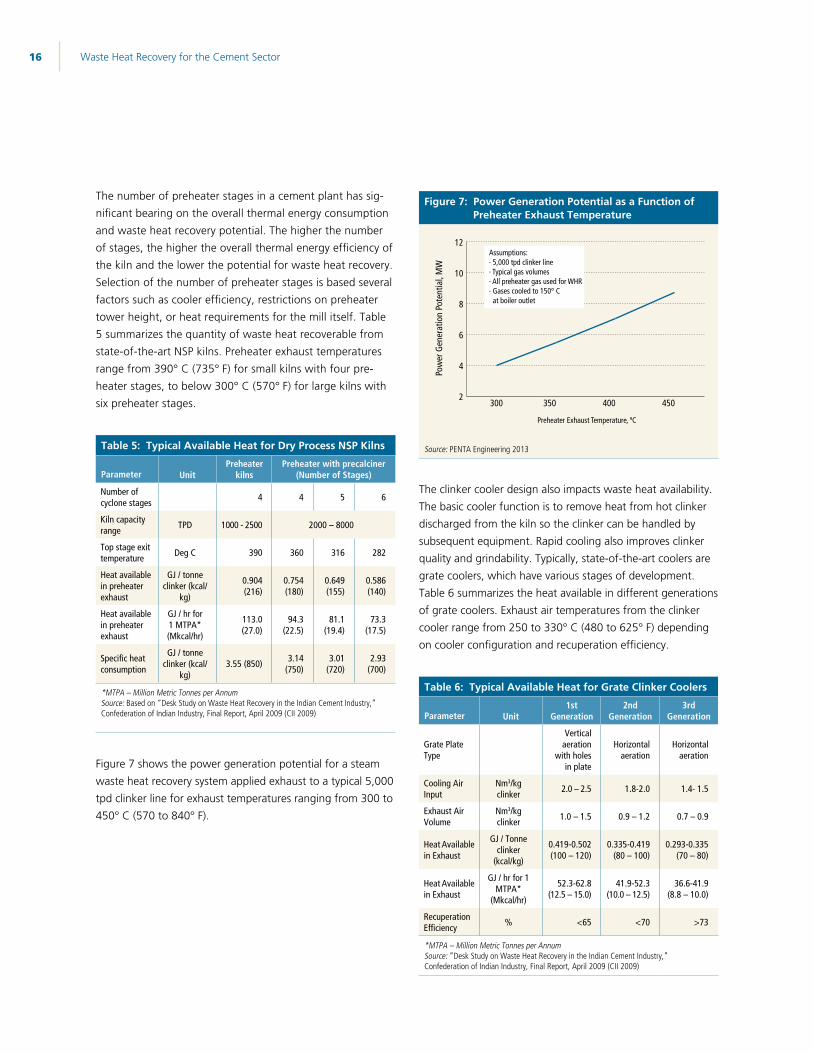
Figure 7 shows the power generation potential for a steam waste heat recovery system applied exhaust to a typical 5,000 tpd clinker line for exhaust temperatures ranging from 300 to 450° C (570 to 840° F).
Figure 7: Power Generation Potential as a Function of Preheater Exhaust Temperature
2
4
6
8
10
12
450400350300
Pow
er G
ener
atio
n Po
tent
ial,
MW
Assumptions:· 5,000 tpd clinker line· Typical gas volumes· All preheater gas used for WHR · Gases cooled to 150° C at boiler outlet
Preheater Exhaust Temperature, ºC
Source: PENTA Engineering 2013
The clinker cooler design also impacts waste heat availability. The basic cooler function is to remove heat from hot clinker discharged from the kiln so the clinker can be handled by subsequent equipment. Rapid cooling also improves clinker quality and grindability. Typically, state-of-the-art coolers are grate coolers, which have various stages of development. Table 6 summarizes the heat available in different generations of grate coolers. Exhaust air temperatures from the clinker cooler range from 250 to 330° C (480 to 625° F) depending on cooler configuration and recuperation efficiency.
Table 6: Typical Available Heat for Grate Clinker Coolers
Parameter Unit1st
Generation2nd
Generation3rd
Generation
Grate Plate Type
Vertical aeration
with holes in plate
Horizontal aeration
Horizontal aeration
Cooling Air Input
Nm3/kg clinker 2.0 – 2.5 1.8-2.0 1.4- 1.5
Exhaust Air Volume
Nm3/kg clinker 1.0 – 1.5 0.9 – 1.2 0.7 – 0.9
Heat Available in Exhaust
GJ / Tonne clinker
(kcal/kg)
0.419-0.502 (100 – 120)
0.335-0.419 (80 – 100)
0.293-0.335 (70 – 80)
Heat Available in Exhaust
GJ / hr for 1 MTPA*
(Mkcal/hr)
52.3-62.8 (12.5 – 15.0)
41.9-52.3 (10.0 – 12.5)
36.6-41.9 (8.8 – 10.0)
Recuperation Efficiency % <65 <70 >73
*MTPA – Million Metric Tonnes per AnnumSource: “Desk Study on Waste Heat Recovery in the Indian Cement Industry,” Confederation of Indian Industry, Final Report, April 2009 (CII 2009)
Waste Heat Recovery for the Cement Sector 17
Table 7: Typical Available Heat and Power Generation from Preheater/Grate Clinker Cooler
5000 tpd clinker line, 100% utilization of available waste heat
Input Heat to PH and AQC Boilers 0.963 GJ / Tonne clinker (230 kcal/kg)
Output Heat in Boiler Exhaust Gas 0.379 GJ / Tonne clinker (90 kcal/kg)
Heat Available for Power (Input – Output)
0.583 GJ / Tonne clinker (1400 kcal/kg)
Power Conversion Efficiency 18 – 25%
Potential Power Generation 6 – 9 MW
Source: Adapted from PENTA Engineering, 2013
Table 7 shows the total heat available from both the preheat-
er exhaust and clinker cooler air for a typical 5,000 tpd clinker
plant. Power conversion efficiencies range from 18 to 25
percent resulting in potential power capacities of 6 to 9 MW.
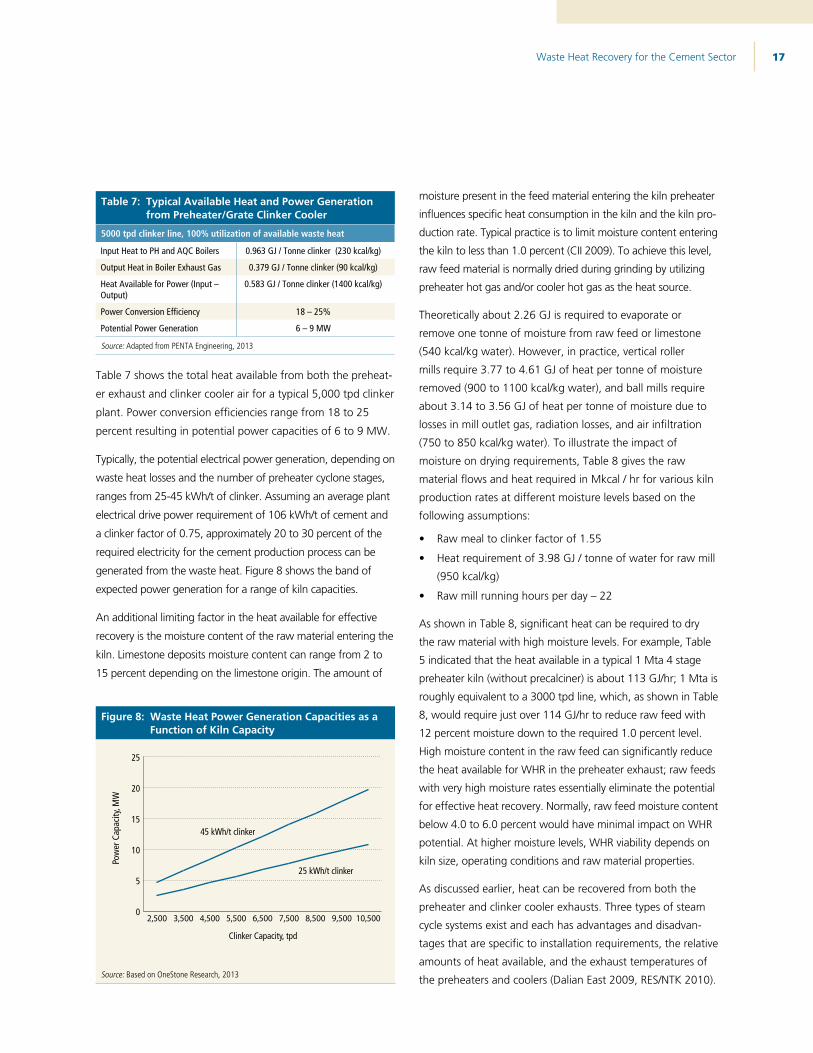
Typically, the potential electrical power generation, depending on
waste heat losses and the number of preheater cyclone stages,
ranges from 25-45 kWh/t of clinker. Assuming an average plant
electrical drive power requirement of 106 kWh/t of cement and
a clinker factor of 0.75, approximately 20 to 30 percent of the
required electricity for the cement production process can be
generated from the waste heat. Figure 8 shows the band of
expected power generation for a range of kiln capacities.
An additional limiting factor in the heat available for effective
recovery is the moisture content of the raw material entering the
kiln. Limestone deposits moisture content can range from 2 to
15 percent depending on the limestone origin. The amount of
Figure 8: Waste Heat Power Generation Capacities as a Function of Kiln Capacity
0
5
10
15
20
25
10,5009,5008,5007,5006,5005,5004,5003,5002,500
Pow
er C
apac
ity, M
W
Clinker Capacity, tpd
45 kWh/t clinker
25 kWh/t clinker
Source: Based on OneStone Research, 2013
moisture present in the feed material entering the kiln preheater
influences specific heat consumption in the kiln and the kiln pro-
duction rate. Typical practice is to limit moisture content entering
the kiln to less than 1.0 percent (CII 2009). To achieve this level,
raw feed material is normally dried during grinding by utilizing
preheater hot gas and/or cooler hot gas as the heat source.
Theoretically about 2.26 GJ is required to evaporate or
remove one tonne of moisture from raw feed or limestone
(540 kcal/kg water). However, in practice, vertical roller
mills require 3.77 to 4.61 GJ of heat per tonne of moisture
removed (900 to 1100 kcal/kg water), and ball mills require
about 3.14 to 3.56 GJ of heat per tonne of moisture due to
losses in mill outlet gas, radiation losses, and air infiltration
(750 to 850 kcal/kg water). To illustrate the impact of
moisture on drying requirements, Table 8 gives the raw
material flows and heat required in Mkcal / hr for various kiln
production rates at different moisture levels based on the
following assumptions:
Raw meal to clinker factor of 1.55
Heat requirement of 3.98 GJ / tonne of water for raw mill
(950 kcal/kg)
Raw mill running hours per day – 22
As shown in Table 8, significant heat can be required to dry
the raw material with high moisture levels. For example, Table
5 indicated that the heat available in a typical 1 Mta 4 stage
preheater kiln (without precalciner) is about 113 GJ/hr; 1 Mta is
roughly equivalent to a 3000 tpd line, which, as shown in Table
8, would require just over 114 GJ/hr to reduce raw feed with
12 percent moisture down to the required 1.0 percent level.
High moisture content in the raw feed can significantly reduce
the heat available for WHR in the preheater exhaust; raw feeds
with very high moisture rates essentially eliminate the potential
for effective heat recovery. Normally, raw feed moisture content
below 4.0 to 6.0 percent would have minimal impact on WHR
potential. At higher moisture levels, WHR viability depends on
kiln size, operating conditions and raw material properties.
As discussed earlier, heat can be recovered from both the
preheater and clinker cooler exhausts. Three types of steam
cycle systems exist and each has advantages and disadvan-
tages that are specific to installation requirements, the relative
amounts of heat available, and the exhaust temperatures of
the preheaters and coolers (Dalian East 2009, RES/NTK 2010).
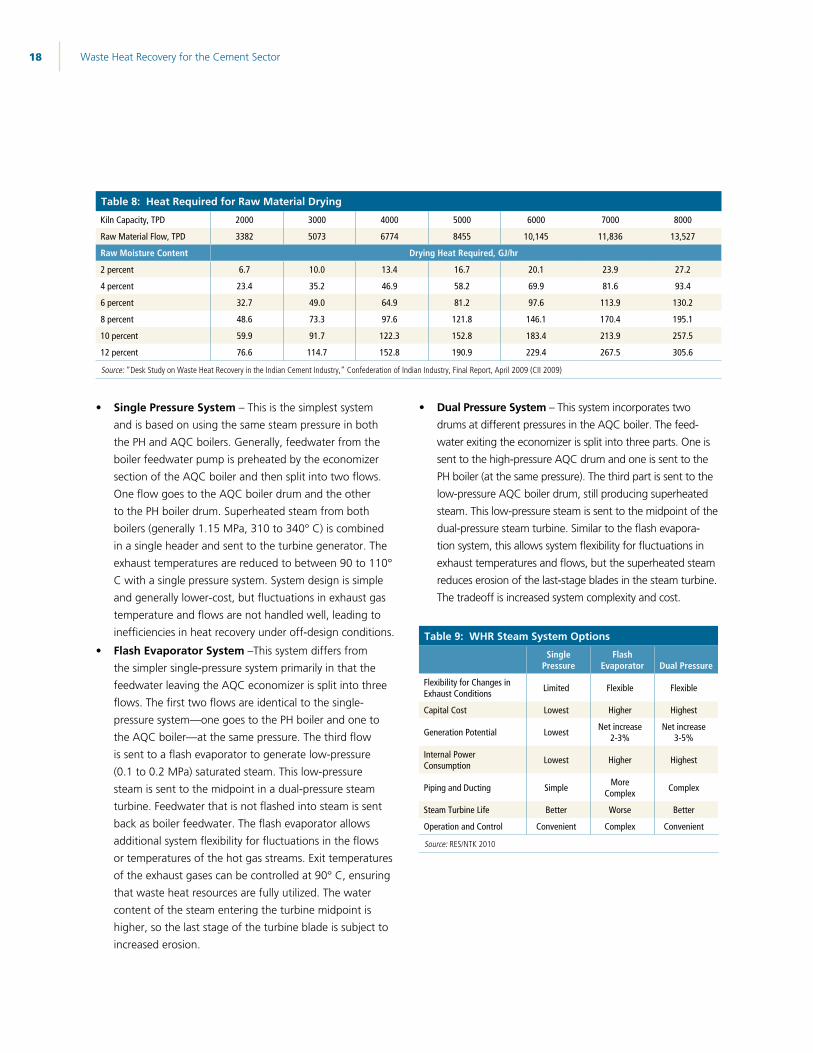
Waste Heat Recovery for the Cement Sector 18
Single Pressure System – This is the simplest system and is based on using the same steam pressure in both the PH and AQC boilers. Generally, feedwater from the boiler feedwater pump is preheated by the economizer section of the AQC boiler and then split into two flows. One flow goes to the AQC boiler drum and the other to the PH boiler drum. Superheated steam from both boilers (generally 1.15 MPa, 310 to 340° C) is combined in a single header and sent to the turbine generator. The exhaust temperatures are reduced to between 90 to 110° C with a single pressure system. System design is simple and generally lower-cost, but fluctuations in exhaust gas temperature and flows are not handled well, leading to inefficiencies in heat recovery under off-design conditions.
Flash Evaporator System –This system differs from the simpler single-pressure system primarily in that the feedwater leaving the AQC economizer is split into three flows. The first two flows are identical to the single-pressure system—one goes to the PH boiler and one to the AQC boiler—at the same pressure. The third flow is sent to a flash evaporator to generate low-pressure (0.1 to 0.2 MPa) saturated steam. This low-pressure steam is sent to the midpoint in a dual-pressure steam turbine. Feedwater that is not flashed into steam is sent back as boiler feedwater. The flash evaporator allows additional system flexibility for fluctuations in the flows or temperatures of the hot gas streams. Exit temperatures of the exhaust gases can be controlled at 90° C, ensuring that waste heat resources are fully utilized. The water content of the steam entering the turbine midpoint is higher, so the last stage of the turbine blade is subject to increased erosion.
Dual Pressure System – This system incorporates two drums at different pressures in the AQC boiler. The feed-water exiting the economizer is split into three parts. One is sent to the high-pressure AQC drum and one is sent to the PH boiler (at the same pressure). The third part is sent to the low-pressure AQC boiler drum, still producing superheated steam. This low-pressure steam is sent to the midpoint of the dual-pressure steam turbine. Similar to the flash evapora-tion system, this allows system flexibility for fluctuations in exhaust temperatures and flows, but the superheated steam reduces erosion of the last-stage blades in the steam turbine. The tradeoff is increased system complexity and cost.
Table 9: WHR Steam System Options
Single Pressure
Flash Evaporator Dual Pressure
Flexibility for Changes in Exhaust Conditions Limited Flexible Flexible
Capital Cost Lowest Higher Highest
Generation Potential Lowest Net increase 2-3%
Net increase 3-5%
Internal Power Consumption Lowest Higher Highest
Piping and Ducting Simple More Complex Complex
Steam Turbine Life Better Worse Better
Operation and Control Convenient Complex Convenient
Source: RES/NTK 2010
Table 8: Heat Required for Raw Material Drying
Kiln Capacity, TPD 2000 3000 4000 5000 6000 7000 8000
Raw Material Flow, TPD 3382 5073 6774 8455 10,145 11,836 13,527
Raw Moisture Content Drying Heat Required, GJ/hr
2 percent 6.7 10.0 13.4 16.7 20.1 23.9 27.2
4 percent 23.4 35.2 46.9 58.2 69.9 81.6 93.4
6 percent 32.7 49.0 64.9 81.2 97.6 113.9 130.2
8 percent 48.6 73.3 97.6 121.8 146.1 170.4 195.1
10 percent 59.9 91.7 122.3 152.8 183.4 213.9 257.5
12 percent 76.6 114.7 152.8 190.9 229.4 267.5 305.6
Source: “Desk Study on Waste Heat Recovery in the Indian Cement Industry,” Confederation of Indian Industry, Final Report, April 2009 (CII 2009)
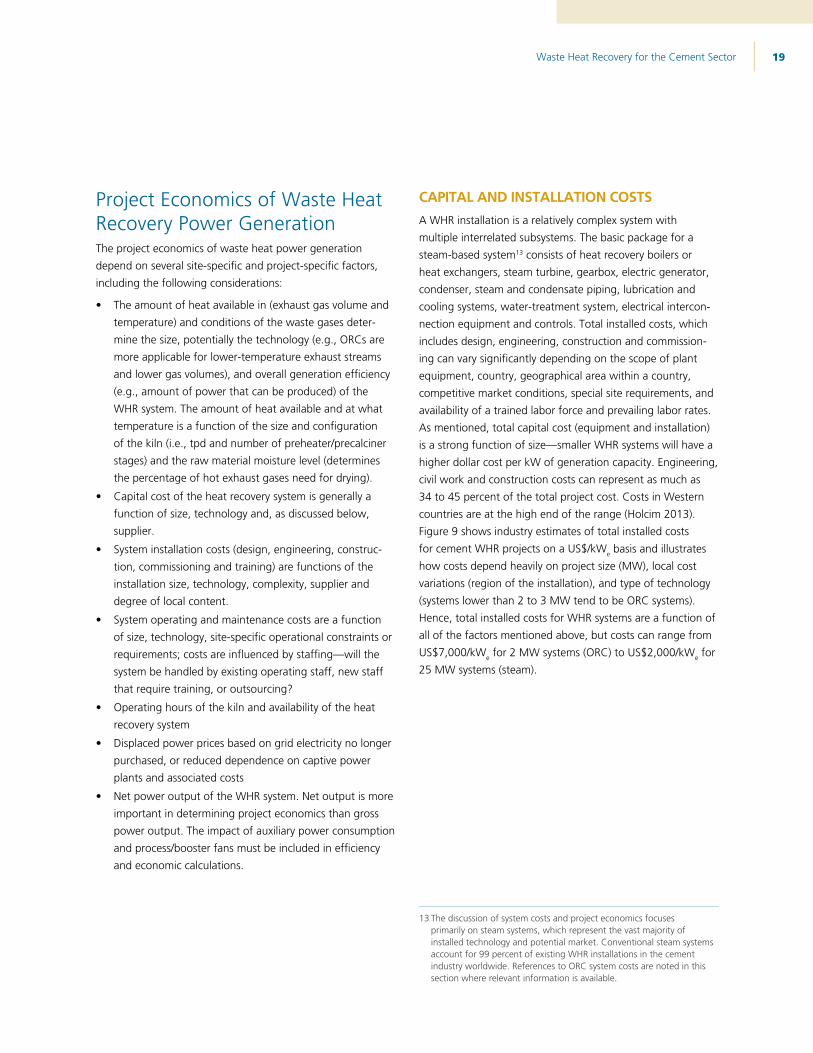
Waste Heat Recovery for the Cement Sector 19
Project Economics of Waste Heat Recovery Power GenerationThe project economics of waste heat power generation depend on several site-specific and project-specific factors, including the following considerations:
The amount of heat available in (exhaust gas volume and temperature) and conditions of the waste gases deter-mine the size, potentially the technology (e.g., ORCs are more applicable for lower-temperature exhaust streams and lower gas volumes), and overall generation efficiency (e.g., amount of power that can be produced) of the WHR system. The amount of heat available and at what temperature is a function of the size and configuration of the kiln (i.e., tpd and number of preheater/precalciner stages) and the raw material moisture level (determines the percentage of hot exhaust gases need for drying).
Capital cost of the heat recovery system is generally a function of size, technology and, as discussed below, supplier.
System installation costs (design, engineering, construc-tion, commissioning and training) are functions of the installation size, technology, complexity, supplier and degree of local content.
System operating and maintenance costs are a function of size, technology, site-specific operational constraints or requirements; costs are influenced by staffing—will the system be handled by existing operating staff, new staff that require training, or outsourcing?
Operating hours of the kiln and availability of the heat recovery system
Displaced power prices based on grid electricity no longer purchased, or reduced dependence on captive power plants and associated costs
Net power output of the WHR system. Net output is more important in determining project economics than gross power output. The impact of auxiliary power consumption and process/booster fans must be included in efficiency and economic calculations.
CAPITAL AND INSTALLATION COSTSA WHR installation is a relatively complex system with multiple interrelated subsystems. The basic package for a steam-based system13 consists of heat recovery boilers or heat exchangers, steam turbine, gearbox, electric generator, condenser, steam and condensate piping, lubrication and cooling systems, water-treatment system, electrical intercon-nection equipment and controls. Total installed costs, which includes design, engineering, construction and commission-ing can vary significantly depending on the scope of plant equipment, country, geographical area within a country, competitive market conditions, special site requirements, and availability of a trained labor force and prevailing labor rates. As mentioned, total capital cost (equipment and installation) is a strong function of size—smaller WHR systems will have a higher dollar cost per kW of generation capacity. Engineering, civil work and construction costs can represent as much as 34 to 45 percent of the total project cost. Costs in Western countries are at the high end of the range (Holcim 2013). Figure 9 shows industry estimates of total installed costs for cement WHR projects on a US$/kWe basis and illustrates how costs depend heavily on project size (MW), local cost variations (region of the installation), and type of technology (systems lower than 2 to 3 MW tend to be ORC systems). Hence, total installed costs for WHR systems are a function of all of the factors mentioned above, but costs can range from US$7,000/kWe for 2 MW systems (ORC) to US$2,000/kWe for 25 MW systems (steam).
13 The discussion of system costs and project economics focuses primarily on steam systems, which represent the vast majority of installed technology and potential market. Conventional steam systems account for 99 percent of existing WHR installations in the cement industry worldwide. References to ORC system costs are noted in this section where relevant information is available.
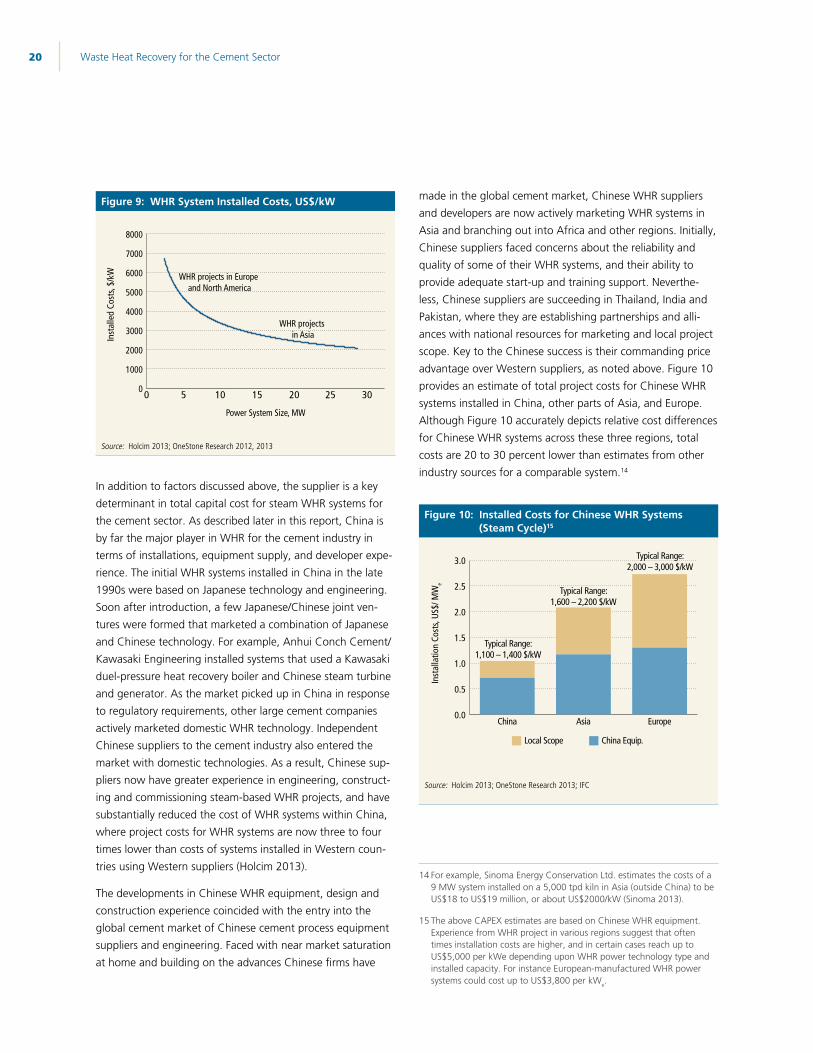
Waste Heat Recovery for the Cement Sector 20
Figure 9: WHR System Installed Costs, US$/kW
0
1000
2000
3000
4000
5000
6000
7000
8000
302520151050
Inst
alle
d Co
sts,
$/kW
Power System Size, MW
WHR projects in Europe and North America
WHR projects in Asia
Source: Holcim 2013; OneStone Research 2012, 2013
In addition to factors discussed above, the supplier is a key determinant in total capital cost for steam WHR systems for the cement sector. As described later in this report, China is by far the major player in WHR for the cement industry in terms of installations, equipment supply, and developer expe-rience. The initial WHR systems installed in China in the late 1990s were based on Japanese technology and engineering. Soon after introduction, a few Japanese/Chinese joint ven-tures were formed that marketed a combination of Japanese and Chinese technology. For example, Anhui Conch Cement/Kawasaki Engineering installed systems that used a Kawasaki duel-pressure heat recovery boiler and Chinese steam turbine and generator. As the market picked up in China in response to regulatory requirements, other large cement companies actively marketed domestic WHR technology. Independent Chinese suppliers to the cement industry also entered the market with domestic technologies. As a result, Chinese sup-pliers now have greater experience in engineering, construct-ing and commissioning steam-based WHR projects, and have substantially reduced the cost of WHR systems within China, where project costs for WHR systems are now three to four times lower than costs of systems installed in Western coun-tries using Western suppliers (Holcim 2013).
The developments in Chinese WHR equipment, design and construction experience coincided with the entry into the global cement market of Chinese cement process equipment suppliers and engineering. Faced with near market saturation at home and building on the advances Chinese firms have
made in the global cement market, Chinese WHR suppliers and developers are now actively marketing WHR systems in Asia and branching out into Africa and other regions. Initially, Chinese suppliers faced concerns about the reliability and quality of some of their WHR systems, and their ability to provide adequate start-up and training support. Neverthe-less, Chinese suppliers are succeeding in Thailand, India and Pakistan, where they are establishing partnerships and alli-ances with national resources for marketing and local project scope. Key to the Chinese success is their commanding price advantage over Western suppliers, as noted above. Figure 10 provides an estimate of total project costs for Chinese WHR systems installed in China, other parts of Asia, and Europe. Although Figure 10 accurately depicts relative cost differences for Chinese WHR systems across these three regions, total costs are 20 to 30 percent lower than estimates from other industry sources for a comparable system.14
Figure 10: Installed Costs for Chinese WHR Systems (Steam Cycle)15
0.0
0.5
1.0
1.5
2.0
2.5
3.0
EuropeAsiaChina
Inst
alla
tion
Cost
s, US
$/ M
We
Typical Range:1,100 – 1,400 $/kW
Typical Range:1,600 – 2,200 $/kW
Typical Range:2,000 – 3,000 $/kW
Local Scope China Equip.
Source: Holcim 2013; OneStone Research 2013; IFC
14 For example, Sinoma Energy Conservation Ltd. estimates the costs of a 9 MW system installed on a 5,000 tpd kiln in Asia (outside China) to be US$18 to US$19 million, or about US$2000/kW (Sinoma 2013).
15 The above CAPEX estimates are based on Chinese WHR equipment. Experience from WHR project in various regions suggest that often times installation costs are higher, and in certain cases reach up to US$5,000 per kWe depending upon WHR power technology type and installed capacity. For instance European-manufactured WHR power systems could cost up to US$3,800 per kWe.
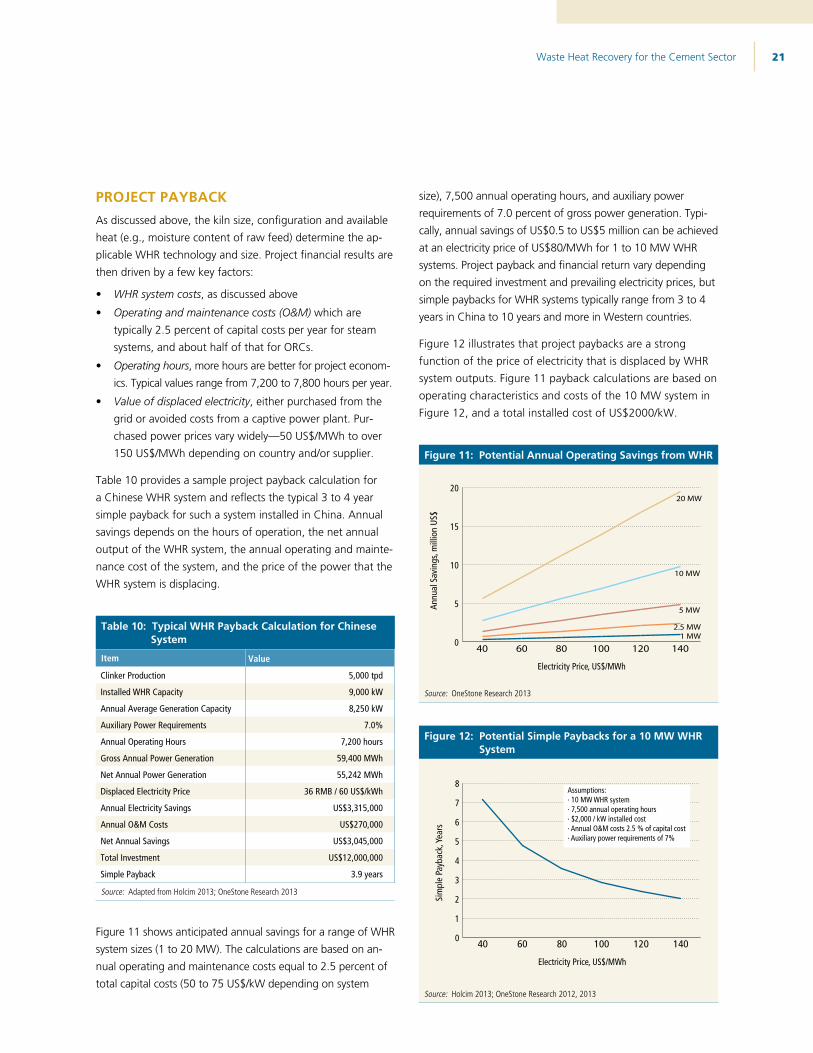
Waste Heat Recovery for the Cement Sector 21
PROJECT PAYBACKAs discussed above, the kiln size, configuration and available heat (e.g., moisture content of raw feed) determine the ap-plicable WHR technology and size. Project financial results are then driven by a few key factors:
WHR system costs, as discussed above
Operating and maintenance costs (O&M) which are typically 2.5 percent of capital costs per year for steam systems, and about half of that for ORCs.
Operating hours, more hours are better for project econom-ics. Typical values range from 7,200 to 7,800 hours per year.
Value of displaced electricity, either purchased from the grid or avoided costs from a captive power plant. Pur-chased power prices vary widely—50 US$/MWh to over 150 US$/MWh depending on country and/or supplier.
Table 10 provides a sample project payback calculation for a Chinese WHR system and reflects the typical 3 to 4 year simple payback for such a system installed in China. Annual savings depends on the hours of operation, the net annual output of the WHR system, the annual operating and mainte-nance cost of the system, and the price of the power that the WHR system is displacing.
Table 10: Typical WHR Payback Calculation for Chinese System
Item Value
Clinker Production 5,000 tpd
Installed WHR Capacity 9,000 kW
Annual Average Generation Capacity 8,250 kW
Auxiliary Power Requirements 7.0%
Annual Operating Hours 7,200 hours
Gross Annual Power Generation 59,400 MWh
Net Annual Power Generation 55,242 MWh
Displaced Electricity Price 36 RMB / 60 US$/kWh
Annual Electricity Savings US$3,315,000
Annual O&M Costs US$270,000
Net Annual Savings US$3,045,000
Total Investment US$12,000,000
Simple Payback 3.9 years
Source: Adapted from Holcim 2013; OneStone Research 2013
Figure 11 shows anticipated annual savings for a range of WHR system sizes (1 to 20 MW). The calculations are based on an-nual operating and maintenance costs equal to 2.5 percent of total capital costs (50 to 75 US$/kW depending on system
size), 7,500 annual operating hours, and auxiliary power requirements of 7.0 percent of gross power generation. Typi-cally, annual savings of US$0.5 to US$5 million can be achieved at an electricity price of US$80/MWh for 1 to 10 MW WHR systems. Project payback and financial return vary depending on the required investment and prevailing electricity prices, but simple paybacks for WHR systems typically range from 3 to 4 years in China to 10 years and more in Western countries.
Figure 12 illustrates that project paybacks are a strong function of the price of electricity that is displaced by WHR system outputs. Figure 11 payback calculations are based on operating characteristics and costs of the 10 MW system in Figure 12, and a total installed cost of US$2000/kW.
Figure 11: Potential Annual Operating Savings from WHR
0
5
10
15
2020 MW
10 MW
5 MW
2.5 MW1 MW
140120100806040
Annu
al S
avin
gs, m
illio
n US
$
Electricity Price, US$/MWh
Source: OneStone Research 2013
Figure 12: Potential Simple Paybacks for a 10 MW WHR System
0
1
2
3
4
5
6
7
8
140120100806040
Sim
ple
Payb
ack,
Yea
rs
Electricity Price, US$/MWh
Assumptions:· 10 MW WHR system· 7,500 annual operating hours· $2,000 / kW installed cost· Annual O&M costs 2.5 % of capital cost· Auxiliary power requirements of 7%
Source: Holcim 2013; OneStone Research 2012, 2013
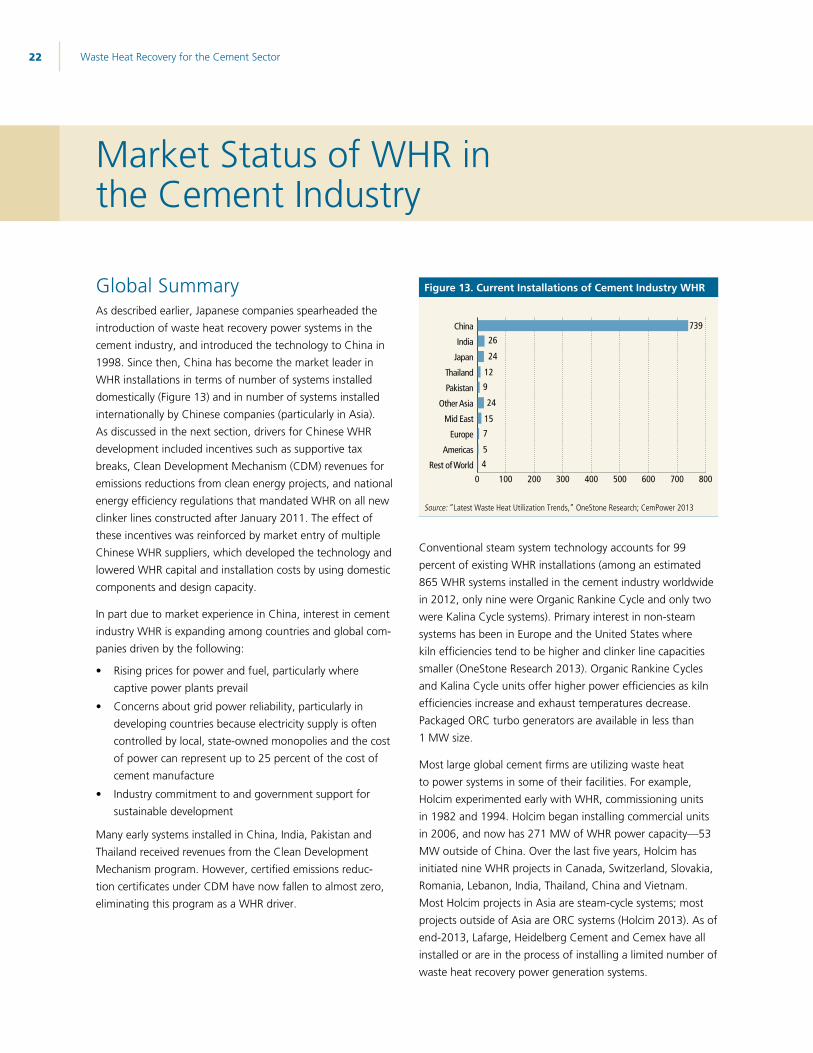
Waste Heat Recovery for the Cement Sector 22
Global SummaryAs described earlier, Japanese companies spearheaded the introduction of waste heat recovery power systems in the cement industry, and introduced the technology to China in 1998. Since then, China has become the market leader in WHR installations in terms of number of systems installed domestically (Figure 13) and in number of systems installed internationally by Chinese companies (particularly in Asia). As discussed in the next section, drivers for Chinese WHR development included incentives such as supportive tax breaks, Clean Development Mechanism (CDM) revenues for emissions reductions from clean energy projects, and national energy efficiency regulations that mandated WHR on all new clinker lines constructed after January 2011. The effect of these incentives was reinforced by market entry of multiple Chinese WHR suppliers, which developed the technology and lowered WHR capital and installation costs by using domestic components and design capacity.
In part due to market experience in China, interest in cement industry WHR is expanding among countries and global com-panies driven by the following:
Rising prices for power and fuel, particularly where captive power plants prevail
Concerns about grid power reliability, particularly in developing countries because electricity supply is often controlled by local, state-owned monopolies and the cost of power can represent up to 25 percent of the cost of cement manufacture
Industry commitment to and government support for sustainable development
Many early systems installed in China, India, Pakistan and Thailand received revenues from the Clean Development Mechanism program. However, certified emissions reduc-tion certificates under CDM have now fallen to almost zero, eliminating this program as a WHR driver.
Figure 13. Current Installations of Cement Industry WHR
0 100 200 300 400 500 600 700 800Rest of World
Americas
Europe
Mid East
Other Asia
Pakistan
Thailand
Japan
India
China 739
26
24
12
9
24
15
7
5
4
Source: “Latest Waste Heat Utilization Trends,” OneStone Research; CemPower 2013
Conventional steam system technology accounts for 99 percent of existing WHR installations (among an estimated 865 WHR systems installed in the cement industry worldwide in 2012, only nine were Organic Rankine Cycle and only two were Kalina Cycle systems). Primary interest in non-steam systems has been in Europe and the United States where kiln efficiencies tend to be higher and clinker line capacities smaller (OneStone Research 2013). Organic Rankine Cycles and Kalina Cycle units offer higher power efficiencies as kiln efficiencies increase and exhaust temperatures decrease. Packaged ORC turbo generators are available in less than 1 MW size.
Most large global cement firms are utilizing waste heat to power systems in some of their facilities. For example, Holcim experimented early with WHR, commissioning units in 1982 and 1994. Holcim began installing commercial units in 2006, and now has 271 MW of WHR power capacity—53 MW outside of China. Over the last five years, Holcim has initiated nine WHR projects in Canada, Switzerland, Slovakia, Romania, Lebanon, India, Thailand, China and Vietnam. Most Holcim projects in Asia are steam-cycle systems; most projects outside of Asia are ORC systems (Holcim 2013). As of end-2013, Lafarge, Heidelberg Cement and Cemex have all installed or are in the process of installing a limited number of waste heat recovery power generation systems.
Market Status of WHR in the Cement Industry
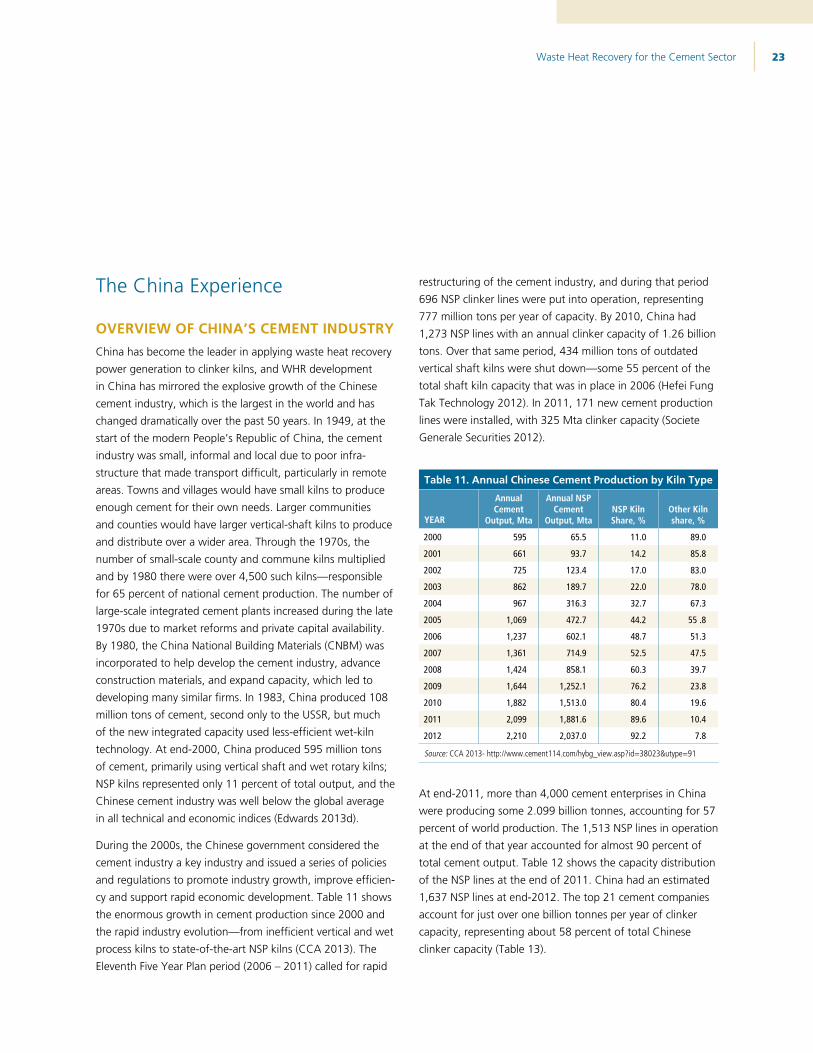
Waste Heat Recovery for the Cement Sector 23
The China Experience
OVERVIEW OF CHINA’S CEMENT INDUSTRYChina has become the leader in applying waste heat recovery power generation to clinker kilns, and WHR development in China has mirrored the explosive growth of the Chinese cement industry, which is the largest in the world and has changed dramatically over the past 50 years. In 1949, at the start of the modern People’s Republic of China, the cement industry was small, informal and local due to poor infra-structure that made transport difficult, particularly in remote areas. Towns and villages would have small kilns to produce enough cement for their own needs. Larger communities and counties would have larger vertical-shaft kilns to produce and distribute over a wider area. Through the 1970s, the number of small-scale county and commune kilns multiplied and by 1980 there were over 4,500 such kilns—responsible for 65 percent of national cement production. The number of large-scale integrated cement plants increased during the late 1970s due to market reforms and private capital availability. By 1980, the China National Building Materials (CNBM) was incorporated to help develop the cement industry, advance construction materials, and expand capacity, which led to developing many similar firms. In 1983, China produced 108 million tons of cement, second only to the USSR, but much of the new integrated capacity used less-efficient wet-kiln technology. At end-2000, China produced 595 million tons of cement, primarily using vertical shaft and wet rotary kilns; NSP kilns represented only 11 percent of total output, and the Chinese cement industry was well below the global average in all technical and economic indices (Edwards 2013d).
During the 2000s, the Chinese government considered the cement industry a key industry and issued a series of policies and regulations to promote industry growth, improve efficien-cy and support rapid economic development. Table 11 shows the enormous growth in cement production since 2000 and the rapid industry evolution—from inefficient vertical and wet process kilns to state-of-the-art NSP kilns (CCA 2013). The Eleventh Five Year Plan period (2006 – 2011) called for rapid
restructuring of the cement industry, and during that period 696 NSP clinker lines were put into operation, representing 777 million tons per year of capacity. By 2010, China had 1,273 NSP lines with an annual clinker capacity of 1.26 billion tons. Over that same period, 434 million tons of outdated vertical shaft kilns were shut down—some 55 percent of the total shaft kiln capacity that was in place in 2006 (Hefei Fung Tak Technology 2012). In 2011, 171 new cement production lines were installed, with 325 Mta clinker capacity (Societe Generale Securities 2012).
Table 11. Annual Chinese Cement Production by Kiln Type
YEAR
Annual Cement
Output, Mta
Annual NSP Cement
Output, MtaNSP Kiln Share, %
Other Kiln share, %
2000 595 65.5 11.0 89.0
2001 661 93.7 14.2 85.8
2002 725 123.4 17.0 83.0
2003 862 189.7 22.0 78.0
2004 967 316.3 32.7 67.3
2005 1,069 472.7 44.2 55 .8
2006 1,237 602.1 48.7 51.3
2007 1,361 714.9 52.5 47.5
2008 1,424 858.1 60.3 39.7
2009 1,644 1,252.1 76.2 23.8
2010 1,882 1,513.0 80.4 19.6
2011 2,099 1,881.6 89.6 10.4
2012 2,210 2,037.0 92.2 7.8
Source: CCA 2013- http://www.cement114.com/hybg_view.asp?id=38023&utype=91
At end-2011, more than 4,000 cement enterprises in China were producing some 2.099 billion tonnes, accounting for 57 percent of world production. The 1,513 NSP lines in operation at the end of that year accounted for almost 90 percent of total cement output. Table 12 shows the capacity distribution of the NSP lines at the end of 2011. China had an estimated 1,637 NSP lines at end-2012. The top 21 cement companies account for just over one billion tonnes per year of clinker capacity, representing about 58 percent of total Chinese clinker capacity (Table 13).

Waste Heat Recovery for the Cement Sector 24
Table 12. NSP Production Line Capacity Distribution, 2011
NSP Line Capacity, tpd
Total < 1000 1000-2000
2000-4000
4000-4500
5000-10,000 > 10,000
Number of Lines 30 309 649 66 452 7 1,513
Source: http://www.ccement.com/zhuanti/2012paihang/#esq
Table 13. Top Twenty-One Cement Producers in China in 2012
Company
Annual Clinker
Production Capacity,
Mta
Number of Clinker
Plants
Number of Clinker
Lines
Clinker Capacity, 1,000 tpd
1. CNBM 296.0 16 199 259 955
2. Anhui Conch 151.0 45 90 487
3. Sinoma 72.8 58 72 235
4. Jidong 67.5 35 51 218
5. China Resources 54.2 24 36 175
6. Taiwan Cement (TCC) 49.6 20 33 160
7. Huaxin 38.3 27 34 124
8. Sunssy 37.9 23 35 122
9. Red Lion 33.8 16 25 109
10. Beijing Jinyo 32.3 24 34 104
11. Tianrui Group 29.0 11 18 94
12. Lafarge 22.3 19 23 72
13. Asia Cement 21.6 7 15 70
14. Yatai Group 19.8 9 19 64
15. Yaobai Cement 14.6 14 16 47
16. Henan Tongli 12.4 6 9 40
17. Jiangxi Evergreen 11.5 5 12 37
18. Gexhouba 10.7 9 9 35
19. Mengxi Cement 10.7 6 9 35
20. Gold Circle 10.5 6 8 34
21. On the Peak 10.5 4 8 34
1,006.8 567 815 3,248
Source: http://www.ccement.com/zhuanti/2012paihang/#esq
WHR DEVELOPMENT IN CHINA’S CEMENT INDUSTRY The first waste heat recovery power generation system in the Chinese cement industry was installed in 1998 at an Anhui Conch cement plant in Ningguo. The 4 MW system
16 Needs to be confirmed
was installed by Kawasaki Heavy Industries (KHI) with funding support from Japan’s New Energy and Industrial Development Organization (NEDO) on a 7,200 tpd clinker line, and recovered heat from the preheaters and clinker cooler. Kawasaki installed several additional systems in collaboration with Anhui Conch, but momentum in the market picked up in the early 2000s when several factors converged, including climate change issues, rising energy prices and the market entry of new Chinese vendors.17 KHI formed a joint venture with Anhui Conch (Anhui Conch/Kawasaki Engineering) which marketed a combination of Japanese technology (waste heat boilers) and domestic technology (steam turbines and generators), and the engineering arms of other large cement companies such as CNBM and Sinoma actively marketed domestic technology. Independent Chinese suppliers to the cement industry such as CITIC Heavy Industries, Dalian East and Nanjing Kesen Kenen Environment and Energy also entered the market with domestic technologies.
As shown in Figure 14, development of waste heat power generation in China leaped forward during the Eleventh Five-Year Plan period in step with rapid cement industry development. As of 2008, 263 NSP clinker production lines were equipped with waste heat utilization power plants (193 WHR units), with installed capacity of over 1,600 MW (China Cement Net 2009). By end-2010, over 700 produc-tion lines were equipped with approximately 650 waste heat power plants, representing 55 percent of the dry-process kiln capacity in China. Total installed capacity was about 4,800 MW, and the annual generating capacity was 36.8 billion kWh, equivalent to saving more than 9.0 million tons of standard coal (China Cement Net 2011). By end-2012, 739 waste heat power systems were operating, with a total installed capacity of 6,575 MW (OneStone Research 2013). The Twelfth Five-Year Plan for the cement industry has targeted a WHR penetration of 65 percent for dry-process NSP production lines by 2015. Installations in China peaked in 2009—new units decreased due to a declining number of new cement plants, a nearly fully retrofitted fleet of exist-ing plants, and a reduction in CDM credits. Many Chinese
17 The first domestic WHR system was a 3 MW unit installed in 1999 by Shanghai Triumph Kaineng and Nanjing Cement Design Institute on a 2,000 tpd line at Jiangxi Wannian Cement; it utilized 100 percent domestic equipment and at the time had lower efficiency and reliability than the Japanese system.
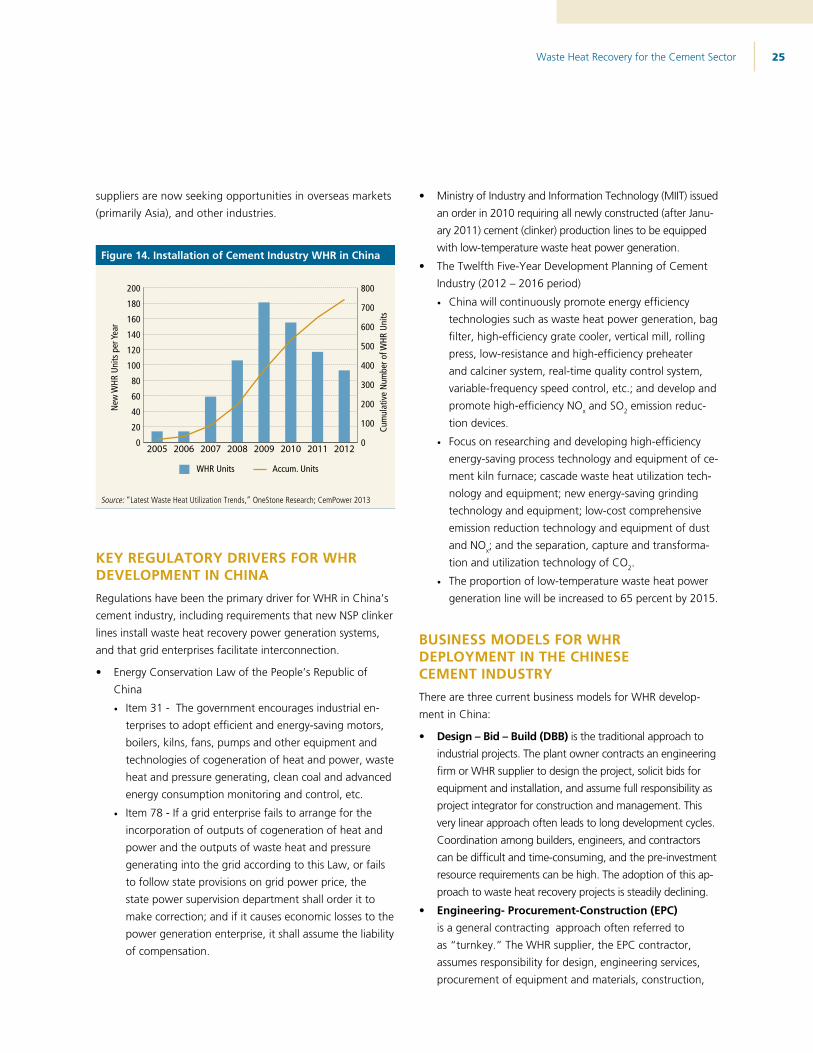
Waste Heat Recovery for the Cement Sector 25
suppliers are now seeking opportunities in overseas markets (primarily Asia), and other industries.
Figure 14. Installation of Cement Industry WHR in China
0
20
40
60
80
100
120
140
160
180
200
20122011201020092008200720062005
New
WHR
Uni
ts p
er Y
ear
0
100
200
300
400
500
600
700
800
WHR Units Accum. Units
Cum
ulat
ive
Num
ber o
f WHR
Uni
ts
Source: “Latest Waste Heat Utilization Trends,” OneStone Research; CemPower 2013
KEY REGULATORY DRIVERS FOR WHR DEVELOPMENT IN CHINA Regulations have been the primary driver for WHR in China’s cement industry, including requirements that new NSP clinker lines install waste heat recovery power generation systems, and that grid enterprises facilitate interconnection.
Energy Conservation Law of the People’s Republic of China
· Item 31 - The government encourages industrial en-terprises to adopt efficient and energy-saving motors, boilers, kilns, fans, pumps and other equipment and technologies of cogeneration of heat and power, waste heat and pressure generating, clean coal and advanced energy consumption monitoring and control, etc.
· Item 78 - If a grid enterprise fails to arrange for the incorporation of outputs of cogeneration of heat and power and the outputs of waste heat and pressure generating into the grid according to this Law, or fails to follow state provisions on grid power price, the state power supervision department shall order it to make correction; and if it causes economic losses to the power generation enterprise, it shall assume the liability of compensation.
Ministry of Industry and Information Technology (MIIT) issued an order in 2010 requiring all newly constructed (after Janu-ary 2011) cement (clinker) production lines to be equipped with low-temperature waste heat power generation.
The Twelfth Five-Year Development Planning of Cement Industry (2012 – 2016 period)
· China will continuously promote energy efficiency technologies such as waste heat power generation, bag filter, high-efficiency grate cooler, vertical mill, rolling press, low-resistance and high-efficiency preheater and calciner system, real-time quality control system, variable-frequency speed control, etc.; and develop and promote high-efficiency NOx and SO2 emission reduc-tion devices.
· Focus on researching and developing high-efficiency energy-saving process technology and equipment of ce-ment kiln furnace; cascade waste heat utilization tech-nology and equipment; new energy-saving grinding technology and equipment; low-cost comprehensive emission reduction technology and equipment of dust and NOx; and the separation, capture and transforma-tion and utilization technology of CO2.
· The proportion of low-temperature waste heat power generation line will be increased to 65 percent by 2015.
BUSINESS MODELS FOR WHR DEPLOYMENT IN THE CHINESE CEMENT INDUSTRYThere are three current business models for WHR develop-ment in China:
Design – Bid – Build (DBB) is the traditional approach to industrial projects. The plant owner contracts an engineering firm or WHR supplier to design the project, solicit bids for equipment and installation, and assume full responsibility as project integrator for construction and management. This very linear approach often leads to long development cycles. Coordination among builders, engineers, and contractors can be difficult and time-consuming, and the pre-investment resource requirements can be high. The adoption of this ap-proach to waste heat recovery projects is steadily declining.
Engineering- Procurement-Construction (EPC) is a general contracting approach often referred to as “turnkey.” The WHR supplier, the EPC contractor, assumes responsibility for design, engineering services, procurement of equipment and materials, construction,
Waste Heat Recovery for the Cement Sector 26
commissioning, and trial operation. “Turnkey” means that the system is delivered to the client ready for operations and the key feature of EPC is that project price and schedule have a high degree of certainty. The project is largely contractor-managed and the cost risk and control are weighted towards the contractor and away from the owner. Because the EPC contractor assumes greater responsibility, it is critical to award the contract to a firm with the right qualifications and management skills. Today the EPC business model is common in waste heat power generation in the China cement industry, accounting for more than 60 percent of market share.
Build Operate Transfer (BOT) has extensive application in infrastructure projects and in public–private partnerships. In the BOT framework for WHR projects, the plant owner delegates responsibility to the WHR supplier or a group of investors with ties to the supplier of the design, construc-tion, operation and maintenance of the WHR facility for a specified period. During this period, the WHR supplier or investor group must raise project financing, and is entitled to retain all or a portion of project-generated revenues (a range of revenue-sharing arrangements exist) and owns the project facilities. At the end of the concession agree-ment the WHR facility is transferred to the plant owner. This model allows the WHR system to be installed without up-front investment by the plant. The plant gains immedi-ate benefit during the concession period through some form of payment for the heat driving the WHR power production or by purchase of reduced-cost power from the system. Eventually, the plant retains all the savings benefits from the system when it is transferred after the concession period. This model accounts for about 10 percent of WHR systems, but interest in it is growing.
WHR System Suppliers
STEAM SYSTEMS
Japan
Kawasaki Plant Systems Ltd. (JPN) (Dual Pressure Steam System)
Kawasaki Plant Systems is a division of Kawasaki Heavy Industries, and Kawasaki Plant Systems’ key offering is high-
performance gas turbines. Kawasaki develops and builds a vast array of industrial plants and equipment, including large cement, chemical and nonferrous metal plants, prime movers, and compact precision machinery. Also, it offers industrial plant engineering from design to sales and the company is involved in developing new energy sources as an alternative to fossil fuels, such as wind power generation, biomass power generation, photovoltaic systems and rechargeable batteries. Kawasaki was an early developer of WHR technology for cement, including a dual-pressure heat recovery steam boiler system. The company has over 110 WHR projects in Japan, Brazil, Taiwan, China,* Vietnam,* India,* Korea, and Thailand.*
*Systems installed by Anhui Conch/Kawasaki joint venture.
China
Anhui Conch/Kawasaki Engineering Co., Ltd. (CHN/JPN) (Dual Pressure Steam System)
This joint venture was established in December 2006 with investments from Anhui Conch Venture Investment Co., Ltd. (subsidiary of Anhui Conch Cement) and Japanese Kawasaki Plant Systems Ltd. (developer of dual-phase steam systems). The venture designs, packages, and services cement waste heat power generation projects; designs, develops, packages, and sells key equipment; and installs and operates equipment. Anhui Conch/Kawasaki is a primary WHR developer in China, and as of February 2012, had 159 engineering/procurement (EP) or EPC waste heat power generation projects which were under construction or completed domestically and abroad, including systems at Anhui Conch Cement Group; Tianrui Group; Jidong Group; Bestway, Maple Leaf and D.G. Khan cement companies in Pakistan; Siam Cement Group in Thailand; Turkey CIMSA Cement, Burma MEC and Vietnam Congthanh Cement (VICEM). These projects total 1,930 MW, and involve 45 domestic and overseas cement groups.
Sinoma Energy Conservation Ltd. (CHN) (Single Pressure Steam System)
The company has registered capital of RMB 327 million and specializes in the utilization of waste heat and residual pressure under China National Materials Group Corporation Limited (Sinoma), and is a leading provider of overall waste heat power generation services in China. China National Materials Group Corporation Ltd. is a central government administered

Waste Heat Recovery for the Cement Sector 27
enterprise directly under the State-owned Assets Supervision
and Administration Commission of the State Council (SASAC).
Sinoma focuses on three major industries: non-metallic material
manufacturing industry (Sinoma Cement); non-metallic materi-
als technological equipment and engineering industry; non-
metallic mining industry. Sinoma holds both directly controlled
and proprietarily controlled equities in 69 enterprises; including
1 H-Share and 5 A-Share listed companies, and 13 national re-
search and design institutes. Branches are sited all over China,
and in the United States, Europe, Japan, Middle-eastern and
African countries. Sinoma uses waste heat boilers from its own
Nantong Wanda Boiler Company subsidiary.
Sinoma Energy Conservation Ltd. supports technological
development, comprehensive utilization and industrializa-
tion of industrial waste heat and residual pressure, and has
various qualifications for design, foreign trade operation, and
foreign engineering and general contracting in WHR. Sinoma
EC favours BOT business models as their investment mode;
Sinoma is evaluating various multi-form and multi-channel
investment models with energy-consuming enterprises and
has installed about 200 WHR systems, primarily in China. In
addition to engineering, design and equipment procurement,
by end-June 2011, the company completed 43 EPC instal-
lations in China with total generating capacity of 314 MW,
and 14 BOT projects with total generating capacity of 120
MW. Sinoma has installed 17 systems abroad using EP and
EPC models with a total generating capacity of 228 MW in
Angola, Thailand, Philippines, Vietnam, Pakistan, United Arab
Emirates, Turkey and India.
Nanjing Triumph Kenen Environment & Energy Co., Ltd. (CHN) Nanjing Triumph (Kesen)
Kenen Environment & Energy Co. (NTK), or Nanjing Kesen
Kenen Environment & Energy Co., started relatively early in
WHR, and specializes in energy conservation and environ-
mental protection; new energy technology development;
engineering consulting; design and contracting; and waste
heat power plant investment, operation and management.
The company was listed as “East” in the startup board market
of Shenzhen Stock Exchange in 2010. By April 2012, the
company had undertaken the construction of more than 180
medium- and low-temperature waste heat power generation
projects in cement, iron and steel, and chemicals, accounting
for 1,720 MW. NTK has over 150 systems in cement facili-
ties representing 1,500 MW of capacity in China (about a 30
percent market share), and has undertaken construction of
more than 10 foreign projects (India, Turkey, Saudi Arabia,
and Madagascar). NTK uses EPC and BOT business models for
WHR development. NTK entered into a collaborative agree-
ment in February 2011 with Tecpro Systems Limited, an Indian
engineering, procurement and construction (EPC) contractor
in the power sector. The joint venture is developing projects
in the Indian market, based on the NTK technology (PH waste
heat boiler and steam turbine) and has announced five WHR
projects since forming the partnership.
Dalian East New Energy Development Co., Ltd. (CHN) (Dual pressure steam system)
Established in 2005, Dalian East provides engineering design,
equipment supply and procurement, project management,
technical services and commissioning services for WHR projects
in the iron and steel, coking, chemicals and cement industries.
The company was listed as “EAST” on the Shenzhen stock
exchange in 2010. As of March 2013, the company has
installed 165 WHR systems on 192 NSP clinker lines (1,500
to 7,200 tpd) representing 1,319 MW. The company offers a
range of project approaches from EP to BOT; of the installed
WHR systems, 89 were EPC projects and 24 were EP projects.
Dalian East has also installed 24 WHR projects in the steel and
coking industries. While primarily focused on China to-date,
the company has installed WHR on cement plants in the
Philippines and India. Polysius A.G., a division of Thyssen Krupp
(GER), and a global engineering supply firm for the cement
industry entered into an exclusive cooperative agreement with
Dalian East for cement kiln WHR technology in 2010. Dalian
East offers a proprietary preheater bypass system WHR boiler
that has been installed on nine plants.
CITIC Heavy Industries Co., Ltd. (CHN) (Dual-pressure
steam system)
A leading domestic and international heavy machinery manu-
facturer, a national innovation and high-tech enterprise, and
a leading enterprise in domestic cement equipment manufac-
turing. The company was listed in the A-share market of the
Shanghai Stock Exchange in 2012 (stock code: CITIC Heavy
Industries 601608). It supplies mainframe equipment for
cement lines, including large-scale rotary kiln, raw material
vertical mill, high-efficiency cement mill, rolling machine, and
powder selecting machines; has dealt with general contract-
ing of complete projects for long term; and offers full-process
services for both cement line and complete-set waste heat

Waste Heat Recovery for the Cement Sector 28
power generation projects, including project consulting,
engineering design, equipment supply and purchasing, civil
construction, installation and commissioning and personnel
training. Company does EPC, BOT and energy management
/ shared savings contracts (EMC) contracts for the design,
manufacture and installation of low-temperature waste heat
systems for the iron and steel industry, cement industry, and
petroleum and chemical industry. As of end-2012, CITIC
Heavy Industries had constructed more than 130 waste heat
power projects with large-scale cement groups like China
United Cement Corporation, Tianrui Group, Tapai Group,
Sunnsy Group, and Tongli Group, as well as companies in
India, Thailand, Turkey and Vietnam.
China National Building Materials Group (CNBM) (CHN)
(Single-pressure steam system)
China National Building Materials Group Corporation (CNBM)
was established in 1984 with approval from the Chinese State
Council; it became a Central Enterprise under direct supervi-
sion of the State-owned Assets Supervision and Administration
Commission of the State Council in 2003. CNBM is the largest
comprehensive building materials industry group in China;
it integrates scientific research, manufacturing and logistics,
and comprises four business platforms focused on domestic
and international building materials and businesses—industry
(cement, glass and glass fiber, light-weight building materi-
als, refractory materials and composite materials), technology
development and testing, engineering design and construc-
tion, and trading/logistics. As of end-2009, CNBM’s total assets
exceeded RMB 110 billion, with 100,000 employees, and 20
companies under direct management with 100 percent share
control or majority control, among which six were listed com-
panies, including two listed overseas. CNBM is active in WHR
applications through two engineering subsidiaries:
Hefei Cement Research Design Institute (HCRDI) (CHN)
Established in 2006 as a subsidiary of CNBM, HCRDI
provides engineering design and construction of cement
industry plants and plant systems. HCRDI has various op-
erating certificates including Certificate of Turnkey Project
Contracting, Certificate of Overseas Project Contracting,
and Certificate of Import and Export. The company has
installed over 25 WHR systems on cements plants in China
with a total capacity of approximately 165 MW, and two
systems in Pakistan (22 MW). HCRDI has undertaken over
twenty EP, EC and EPC cement plants and other projects
in more than ten countries or areas as Pakistan, Vietnam,
Ethiopia, Chile, Saudi Arabia, Sudan and Russia with a total
contract value exceeding RMB ten billion.
Shanghai Triumph (Kesen) Energy Conservation (STEC) – Joint venture between China Triumph Inter-national Eng. (CTIEC) and Mitsubishi (CHN/JPN)
Shanghai Triumph is a high-tech enterprise established
with the joint investments of China Triumph International
Engineering Co., Ltd. (CTIEC) and Mitsubishi Corporation.
CTIEC is a national Class-A scientific research and design
entity and international engineering group, and one of
the engineering platforms of CNBM. Shanghai Triumph
specializes in medium- and low-temperature flue gas waste
heat recovery for power generation from glass and cement
kilns. As of May 2013, the Company had 28 EPC projects
in production, primarily in China; the company has three
active WHR cement projects in Turkey.
India
Transparent Energy Systems Private Limited (IND)
Transparent Energy Systems Private Limited (TESPL) is an
Indian engineering and construction firm that has developed
and patented an in-house technology for waste heat recovery
systems for the cement industry. TESPL also installs other
WHR technologies such as the Ormat organic Rankine cycle
system. It has WHR systems installed with KCP Limited and
Ultratech Cement in India.
Tecpro Systems Limited/NTK (IND/CHN)
Tecpro Systems Limited (Tecpro) is an Indian engineering,
procurement and construction (EPC) contractor active in the
power sector including captive power plants for the Indian
cement industry. In February 2011 Tecpro entered into a
collaborative agreement with Nanjing Triumph Kaineng
Environment and Energy Company (NTK) to develop waste
heat power projects based on the NTK technology (waste
heat boiler and steam turbine) for the Indian market. The
joint venture has announced five WHR projects in India since
forming the partnership.
Thermax/Taiheyo Engineering (IND/JPN)
Thermax is an Indian supplier and engineering/constructor of
energy systems including boilers and steam systems. Thermax
entered into an agreement with Taiheiyo Engineering Corp of
Waste Heat Recovery for the Cement Sector 29
Japan (a subsidiary of Taiheiyo Cement) to offer waste heat recovery power generation systems in India. The collaborative has two systems at JK Cement, Nimbahera and at JK Lakshmi. Thermax offers both EPC and build, own and transfer (BOT) contracts for WHR systems.
Other
FLSmidth (DEN)
FLSmidth is a global engineering company from Denmark with cement industry engineering, equipment, and construc-tion expertise. FLSmidth has an exclusive global license from Wasabi Energy for the Kalina cycle in the cement and lime industries (with the exclusion of China) and has two installa-tions under construction in cement plants: a 8.5 MW unit on a 7,000 tpd clinker line at D.G. Khan Cement’s Khaipur plant in Pakistan (utilizing preheater and air cooler exhaust) and a 4.75 MW unit on a 7,500 tpd clinker line at Star Cement’s Ras Al-Khaimah plant in UAE (utilizing air cooler vent only). It has also installed a conventional steam cycle system at a Vicat Sagar Cement plant in India in 2012 and is actively bidding on projects in India.
ORGANIC RANKINE CYCLE SYSTEMSORMAT (USA)
Ormat has over 3,500 MW of ORC generation assets, primarily in geothermal power applications, and increasingly in natural gas pipeline compressor stations. Ormat oper-ates as an equipment supplier, turnkey EPC, and third-party build/own/operate developer. There are two Ormat ORCs in cement plants—1.2 MW system installed in 1999 at the Heidelberg Cement plant at Lengfurt, Germany, recovers heat from the clinker cooler vent air; the second ORC system is a 4.8 MW unit located at AP Cement (now Ultra Tech Cement), Tadipatri, Andhra Pradesh, India. The Ultratech unit was installed by TESPL.
Turboden / Mitsubishi (JPN)
Turboden (acquired by Mitsubishi in 2012) manufactures and sells a broad range of ORC units ranging in size from 500 kW to 2+ MW. They have over 30 years of experience with over 100 systems in operation primarily in biomass recovery systems, and mainly in Europe. In 2012, Turboden installed a 4 MW unit at a Holcim Romani cement plant in Alesd (4,000 tpd clinker line); Turboden also has systems under construction at Holcim Slovakia (5 MW at 3,600 tpd line at the Rohoznik plant) and an undisclosed North American plant (7 MW).
ABB (CHE)
ABB, a global power and automation technologies and engineering/construction company, offers an ORC system for cement kilns. ABB has installed a 1.9 MW ORC system at Holcim’s Untervaz, Switzerland plant utilizing heat from the preheater, and ABB and Jura cement signed an agreement in 2012 to install a 2.0 MW ORC system at Jua’s Wildegg AG plant in Switzerland.
KALINA CYCLE SYSTEMSWasabi Energy (Australia)
Wasabi Energy and its subsidiaries, Global Geothermal Lim-ited and Recurrent Engineering LLC, are the current develop-ers and suppliers of Kalina cycle technology. Wasabi has given FLSmidth an exclusive global license for the Kalina cycle in the cement and lime industries (with the exclusion of China). FLSmidth has two installations under construction or installed in cement plants: a 4.75 MW unit on a 7,500 tpd clinker line at Star Cement’s Ras Al-Khaimah plant in UAE (utilizing air cooler vent only) that was commissioned in 2013, and a 8.5 MW unit under construction on a 7,000 tpd clinker line at D.G. Khan Cement’s Khaipur plant in Pakistan (utilizing preheater and air cooler exhaust). FLSmidth is responsible for overall project engineering and management in both projects, and has subcontracted the Kalina system design and procure-ment to Wasabi.
Waste Heat Recovery for the Cement Sector 30
Target Market Analysis
The following sections highlight the status of the cement industry and prospects for WHR development in a select group of countries and regions where waste heat recov-ery power generation may have strong market drivers. The countries were selected based on their robust cement industries and markets, prospects for near- and mid-term economic growth and expanding cement consumption, and market factors that encourage WHR adoption, such as power reliability concerns, rising electricity prices and/or environmental and sustainability initiatives.
Each country summary in this section includes the following:
Relevant demographics that drive cement demand such as current per capita cement consumption and degree of urbanization
Status profile of national cement industry and markets
Listing of major cement manufacturers operating in the country and information on the number of integrated cement plants and annual capacities of cement and clinker production
Summary of industrial electric prices/ thermal fuel prices based on publically available data
Discussion of key energy or environmental factors that could drive WHR development
Detailed listing of existing WHR systems and major WHR suppliers
Estimates of remaining WHR potential are provided as a range and estimated by applying the potential WHR power generation output of 25 to 45 kWh/t of clinker production on the annual clinker capacity for kilns greater than 1 Mta and assuming 320 days of operation/year. It should be noted that there could be WHR recovery potential in older, less-efficient kilns below 1 Mta.
The country-specific profiles are followed by higher-level sum-maries of cement market demographics for selected countries in Sub-Saharan Africa that have expanding cement industries and potential market drivers conducive to WHR development.
The summaries of cement industry status and the energy and environmental landscape affecting the cement industry in the country-specific profiles are based on multiple sources including U.S. DOE’s International Energy Outlook Country Profiles (DOE 2013a), International Cement Research’s Global Cement Review 10th Edition (ICR 2013), CW Research Global Cement Volume Forecast Report (GCVFR) (CW Research 2014), the Central Intelligence Agency’s World Factbook (CIA 2013), the World Bank Country Data (World Bank 2014) and articles from Global Cement Magazine (Edwards, etc.). In-formation on current electricity and fuel prices was gathered from international energy agency databases (DOE 2013b, IEA 2012) and country-specific tariffs and other public sources.
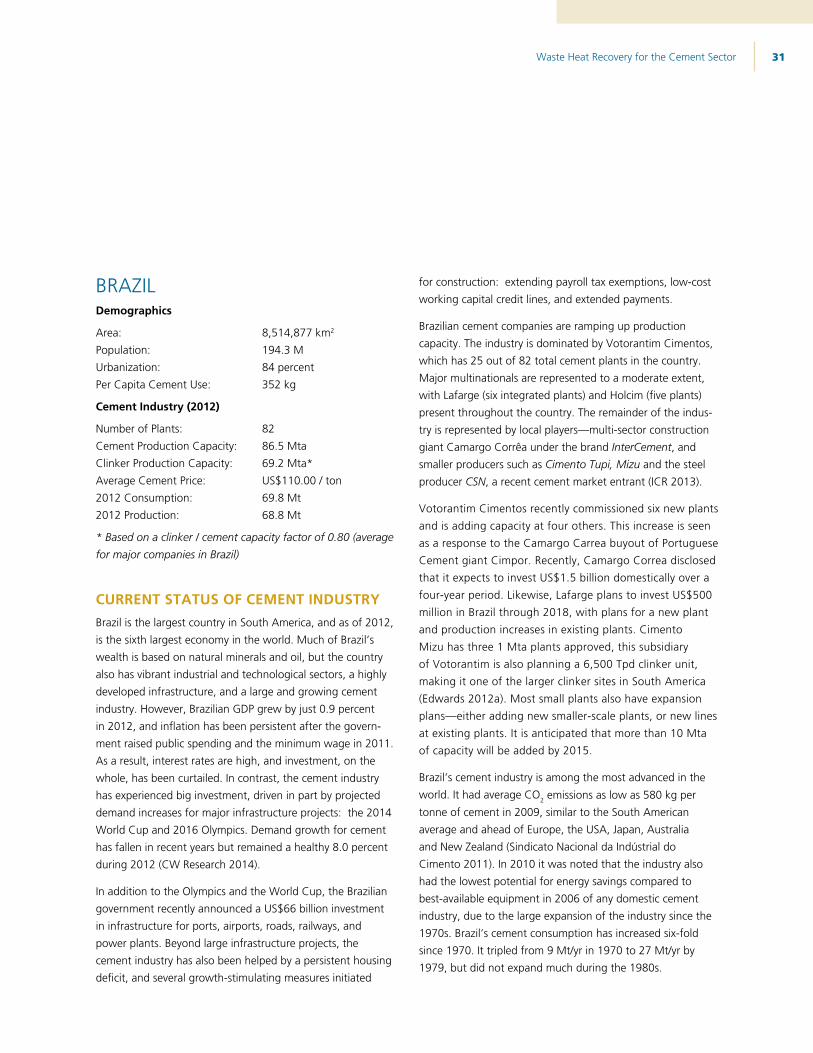
Waste Heat Recovery for the Cement Sector 31
BRAZILDemographics
Area: 8,514,877 km2
Population: 194.3 MUrbanization: 84 percentPer Capita Cement Use: 352 kg
Cement Industry (2012)
Number of Plants: 82Cement Production Capacity: 86.5 MtaClinker Production Capacity: 69.2 Mta*Average Cement Price: US$110.00 / ton2012 Consumption: 69.8 Mt2012 Production: 68.8 Mt
* Based on a clinker / cement capacity factor of 0.80 (average for major companies in Brazil)
CURRENT STATUS OF CEMENT INDUSTRYBrazil is the largest country in South America, and as of 2012, is the sixth largest economy in the world. Much of Brazil’s wealth is based on natural minerals and oil, but the country also has vibrant industrial and technological sectors, a highly developed infrastructure, and a large and growing cement industry. However, Brazilian GDP grew by just 0.9 percent in 2012, and inflation has been persistent after the govern-ment raised public spending and the minimum wage in 2011. As a result, interest rates are high, and investment, on the whole, has been curtailed. In contrast, the cement industry has experienced big investment, driven in part by projected demand increases for major infrastructure projects: the 2014 World Cup and 2016 Olympics. Demand growth for cement has fallen in recent years but remained a healthy 8.0 percent during 2012 (CW Research 2014).
In addition to the Olympics and the World Cup, the Brazilian government recently announced a US$66 billion investment in infrastructure for ports, airports, roads, railways, and power plants. Beyond large infrastructure projects, the cement industry has also been helped by a persistent housing deficit, and several growth-stimulating measures initiated
for construction: extending payroll tax exemptions, low-cost working capital credit lines, and extended payments.
Brazilian cement companies are ramping up production capacity. The industry is dominated by Votorantim Cimentos, which has 25 out of 82 total cement plants in the country. Major multinationals are represented to a moderate extent, with Lafarge (six integrated plants) and Holcim (five plants) present throughout the country. The remainder of the indus-try is represented by local players—multi-sector construction giant Camargo Corrêa under the brand InterCement, and smaller producers such as Cimento Tupi, Mizu and the steel producer CSN, a recent cement market entrant (ICR 2013).
Votorantim Cimentos recently commissioned six new plants and is adding capacity at four others. This increase is seen as a response to the Camargo Carrea buyout of Portuguese Cement giant Cimpor. Recently, Camargo Correa disclosed that it expects to invest US$1.5 billion domestically over a four-year period. Likewise, Lafarge plans to invest US$500 million in Brazil through 2018, with plans for a new plant and production increases in existing plants. Cimento Mizu has three 1 Mta plants approved, this subsidiary of Votorantim is also planning a 6,500 Tpd clinker unit, making it one of the larger clinker sites in South America (Edwards 2012a). Most small plants also have expansion plans—either adding new smaller-scale plants, or new lines at existing plants. It is anticipated that more than 10 Mta of capacity will be added by 2015.
Brazil’s cement industry is among the most advanced in the world. It had average CO2 emissions as low as 580 kg per tonne of cement in 2009, similar to the South American average and ahead of Europe, the USA, Japan, Australia and New Zealand (Sindicato Nacional da Indústrial do Cimento 2011). In 2010 it was noted that the industry also had the lowest potential for energy savings compared to best-available equipment in 2006 of any domestic cement industry, due to the large expansion of the industry since the 1970s. Brazil’s cement consumption has increased six-fold since 1970. It tripled from 9 Mt/yr in 1970 to 27 Mt/yr by 1979, but did not expand much during the 1980s.
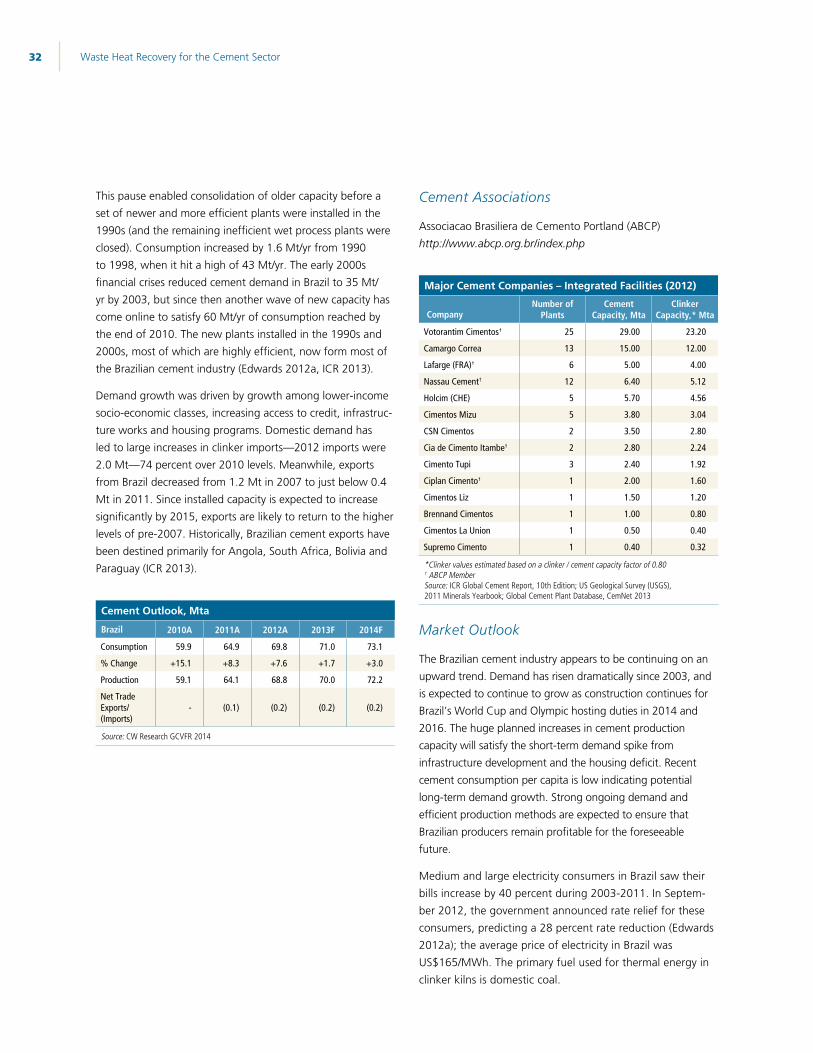
Waste Heat Recovery for the Cement Sector 32
This pause enabled consolidation of older capacity before a set of newer and more efficient plants were installed in the 1990s (and the remaining inefficient wet process plants were closed). Consumption increased by 1.6 Mt/yr from 1990 to 1998, when it hit a high of 43 Mt/yr. The early 2000s financial crises reduced cement demand in Brazil to 35 Mt/yr by 2003, but since then another wave of new capacity has come online to satisfy 60 Mt/yr of consumption reached by the end of 2010. The new plants installed in the 1990s and 2000s, most of which are highly efficient, now form most of the Brazilian cement industry (Edwards 2012a, ICR 2013).
Demand growth was driven by growth among lower-income socio-economic classes, increasing access to credit, infrastruc-ture works and housing programs. Domestic demand has led to large increases in clinker imports—2012 imports were 2.0 Mt—74 percent over 2010 levels. Meanwhile, exports from Brazil decreased from 1.2 Mt in 2007 to just below 0.4 Mt in 2011. Since installed capacity is expected to increase significantly by 2015, exports are likely to return to the higher levels of pre-2007. Historically, Brazilian cement exports have been destined primarily for Angola, South Africa, Bolivia and Paraguay (ICR 2013).
Cement Outlook, Mta
Brazil 2010A 2011A 2012A 2013F 2014F
Consumption 59.9 64.9 69.8 71.0 73.1
% Change +15.1 +8.3 +7.6 +1.7 +3.0
Production 59.1 64.1 68.8 70.0 72.2
Net Trade Exports/ (Imports)
- (0.1) (0.2) (0.2) (0.2)
Source: CW Research GCVFR 2014
Cement Associations
Associacao Brasiliera de Cemento Portland (ABCP) http://www.abcp.org.br/index.php
Major Cement Companies – Integrated Facilities (2012)
CompanyNumber of
PlantsCement
Capacity, MtaClinker
Capacity,* Mta
Votorantim Cimentos† 25 29.00 23.20
Camargo Correa 13 15.00 12.00
Lafarge (FRA)† 6 5.00 4.00
Nassau Cement† 12 6.40 5.12
Holcim (CHE) 5 5.70 4.56
Cimentos Mizu 5 3.80 3.04
CSN Cimentos 2 3.50 2.80
Cia de Cimento Itambe† 2 2.80 2.24
Cimento Tupi 3 2.40 1.92
Ciplan Cimento† 1 2.00 1.60
Cimentos Liz 1 1.50 1.20
Brennand Cimentos 1 1.00 0.80
Cimentos La Union 1 0.50 0.40
Supremo Cimento 1 0.40 0.32
*Clinker values estimated based on a clinker / cement capacity factor of 0.80 † ABCP MemberSource: ICR Global Cement Report, 10th Edition; US Geological Survey (USGS), 2011 Minerals Yearbook; Global Cement Plant Database, CemNet 2013
Market Outlook
The Brazilian cement industry appears to be continuing on an upward trend. Demand has risen dramatically since 2003, and is expected to continue to grow as construction continues for Brazil’s World Cup and Olympic hosting duties in 2014 and 2016. The huge planned increases in cement production capacity will satisfy the short-term demand spike from infrastructure development and the housing deficit. Recent cement consumption per capita is low indicating potential long-term demand growth. Strong ongoing demand and efficient production methods are expected to ensure that Brazilian producers remain profitable for the foreseeable future.
Medium and large electricity consumers in Brazil saw their bills increase by 40 percent during 2003-2011. In Septem-ber 2012, the government announced rate relief for these consumers, predicting a 28 percent rate reduction (Edwards 2012a); the average price of electricity in Brazil was US$165/MWh. The primary fuel used for thermal energy in clinker kilns is domestic coal.
Energy Prices for Industry
Brazil 2005 2006 2007 2008 2009 2010 2011
Electricity, US$/MWh - - - - 159.0 175.1 -
Steam Coal,* US$/GJ 2.41 2.75 - - - - -
Natural gas, US$/GJ - - - - 15.77 - -
Source: U.S. DOE Energy Information Administration 2013b; “Energy Prices and Taxes,” IEA 2012; DNPM (Brazil National Department of Mineral Production) 2007
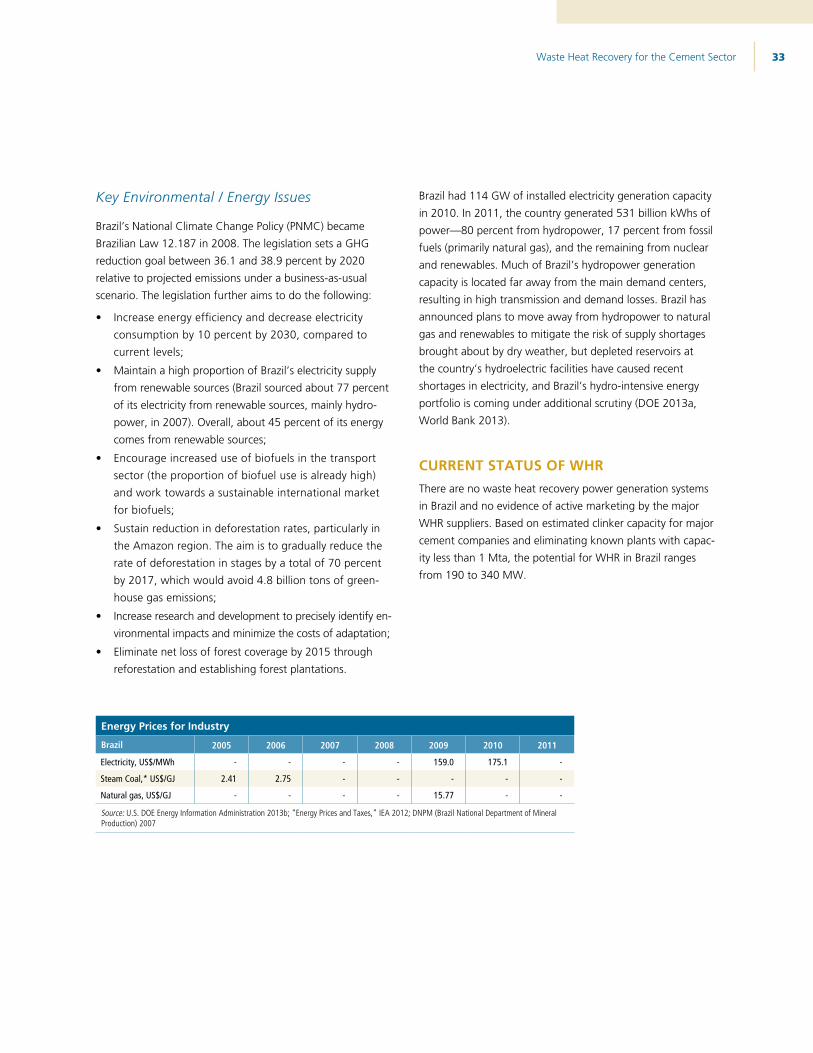
Waste Heat Recovery for the Cement Sector 33
Cement Associations
Associacao Brasiliera de Cemento Portland (ABCP) http://www.abcp.org.br/index.php
Major Cement Companies – Integrated Facilities (2012)
CompanyNumber of
PlantsCement
Capacity, MtaClinker
Capacity,* Mta
Votorantim Cimentos† 25 29.00 23.20
Camargo Correa 13 15.00 12.00
Lafarge (FRA)† 6 5.00 4.00
Nassau Cement† 12 6.40 5.12
Holcim (CHE) 5 5.70 4.56
Cimentos Mizu 5 3.80 3.04
CSN Cimentos 2 3.50 2.80
Cia de Cimento Itambe† 2 2.80 2.24
Cimento Tupi 3 2.40 1.92
Ciplan Cimento† 1 2.00 1.60
Cimentos Liz 1 1.50 1.20
Brennand Cimentos 1 1.00 0.80
Cimentos La Union 1 0.50 0.40
Supremo Cimento 1 0.40 0.32
*Clinker values estimated based on a clinker / cement capacity factor of 0.80 † ABCP MemberSource: ICR Global Cement Report, 10th Edition; US Geological Survey (USGS), 2011 Minerals Yearbook; Global Cement Plant Database, CemNet 2013
Market Outlook
The Brazilian cement industry appears to be continuing on an upward trend. Demand has risen dramatically since 2003, and is expected to continue to grow as construction continues for Brazil’s World Cup and Olympic hosting duties in 2014 and 2016. The huge planned increases in cement production capacity will satisfy the short-term demand spike from infrastructure development and the housing deficit. Recent cement consumption per capita is low indicating potential long-term demand growth. Strong ongoing demand and efficient production methods are expected to ensure that Brazilian producers remain profitable for the foreseeable future.
Medium and large electricity consumers in Brazil saw their bills increase by 40 percent during 2003-2011. In Septem-ber 2012, the government announced rate relief for these consumers, predicting a 28 percent rate reduction (Edwards 2012a); the average price of electricity in Brazil was US$165/MWh. The primary fuel used for thermal energy in clinker kilns is domestic coal.
Energy Prices for Industry
Brazil 2005 2006 2007 2008 2009 2010 2011
Electricity, US$/MWh - - - - 159.0 175.1 -
Steam Coal,* US$/GJ 2.41 2.75 - - - - -
Natural gas, US$/GJ - - - - 15.77 - -
Source: U.S. DOE Energy Information Administration 2013b; “Energy Prices and Taxes,” IEA 2012; DNPM (Brazil National Department of Mineral Production) 2007
Key Environmental / Energy Issues
Brazil’s National Climate Change Policy (PNMC) became Brazilian Law 12.187 in 2008. The legislation sets a GHG reduction goal between 36.1 and 38.9 percent by 2020 relative to projected emissions under a business-as-usual scenario. The legislation further aims to do the following:
Increase energy efficiency and decrease electricity consumption by 10 percent by 2030, compared to current levels;
Maintain a high proportion of Brazil’s electricity supply from renewable sources (Brazil sourced about 77 percent of its electricity from renewable sources, mainly hydro-power, in 2007). Overall, about 45 percent of its energy comes from renewable sources;
Encourage increased use of biofuels in the transport sector (the proportion of biofuel use is already high) and work towards a sustainable international market for biofuels;
Sustain reduction in deforestation rates, particularly in the Amazon region. The aim is to gradually reduce the rate of deforestation in stages by a total of 70 percent by 2017, which would avoid 4.8 billion tons of green-house gas emissions;
Increase research and development to precisely identify en-vironmental impacts and minimize the costs of adaptation;
Eliminate net loss of forest coverage by 2015 through reforestation and establishing forest plantations.
Brazil had 114 GW of installed electricity generation capacity in 2010. In 2011, the country generated 531 billion kWhs of power—80 percent from hydropower, 17 percent from fossil fuels (primarily natural gas), and the remaining from nuclear and renewables. Much of Brazil’s hydropower generation capacity is located far away from the main demand centers, resulting in high transmission and demand losses. Brazil has announced plans to move away from hydropower to natural gas and renewables to mitigate the risk of supply shortages brought about by dry weather, but depleted reservoirs at the country’s hydroelectric facilities have caused recent shortages in electricity, and Brazil’s hydro-intensive energy portfolio is coming under additional scrutiny (DOE 2013a, World Bank 2013).
CURRENT STATUS OF WHRThere are no waste heat recovery power generation systems in Brazil and no evidence of active marketing by the major WHR suppliers. Based on estimated clinker capacity for major cement companies and eliminating known plants with capac-ity less than 1 Mta, the potential for WHR in Brazil ranges from 190 to 340 MW.
Waste Heat Recovery for the Cement Sector 34
EGYPTDemographics
Area: 1,001,449 km2
Population: 82.3 M
Urbanization: 72 percent
Per Capita Cement Use: 570 kg
Cement Industry (2012)
Number of Plants: 25
2012 Cement Production Capacity: 59.4 Mta
Clinker Production Capacity: 50.5 Mta*
Average Cement Price: US$80.00 / ton
(highly variable)
2012 Consumption: 47.0 Mt
2012 Production: 48.8 Mt
* Based on a clinker / cement capacity factor of 0.85 (average for major companies in Egypt)
CURRENT STATUS OF CEMENT INDUSTRYEgypt’s political climate provides an unstable backdrop for
a number of industries following three decades of heavily
enforced stability under Mubarak. After the 2011 revolution,
the Egyptian economy plummeted and real GDP has been
slow to rebound. The value of the Egyptian pound declined
and an unclear future and fiscal policy dampened confidence
in the financial system; foreign investment contracted (IMF).
Many construction projects are delayed, suspended, or can-
celled outright as funding dried up or as businesses wait for
stability. But conditions remain volatile. In December 2012,
Ezzeldin Abu Awad, head of the Cement Traders Society,
indicated that strikes and protests had cut production by 50
percent (Edwards 2012c). Residential building accounts for
most cement sales; only 20 percent of cement output goes to
infrastructure projects (ICR 2013). The 2011 consumption was
1.1 percent below 2010, and demand slipped again in 2012
by 2.9 percent over 2011 (CW Research 2014). A growing
population suggests future growth in housing construction
and infrastructure, yet continual political unrest dampens
investment and development.
Egypt has long history of cement manufacture; the first plants
were commissioned in the early 20th century and plants at
Alexandria, Torah and Helwan were established under British
colonial rule. In 1956, the National Company for Cement
was formed to consolidate Egyptian cement assets and it
produced 0.3 Mta of cement from 1960 onwards. In the
1980s, new companies commissioned further plants but in
the 1990s, the Mubarak regime opted to privatize the sector.
Sales and partial sales were carried out during 1995-2000 of
Helwan Cement, Assiut Cement, Beni Suef Cement, Ameriya
Cement and Torah Cement (Edwards 2012c).
Today, multinationals with interests in Egypt include Mexico’s
Cemex, which owns Assiut Cement; Portugal’s Cimpor, which
operates Ameriya Cement; Italcementi which owns Suez
Cement, and Greece’s Titan, which has interests in Alexandria
Portland Cement and Beni Suef Cement. France’s Lafarge
acquired the entire cement portfolio of the Egyptian group
Orascom in December 2007 and is known as Lafarge Cement
Egypt (LCE). The 10.6 Mta El Ain El Sokhna plant operated
by LCE is one of the largest in the world and has undergone
major expansion in its short production life. It was established
in 1998 as the first Egyptian-owned private cement plant
(Edwards 2012c).
Recently, Italcementi and Lafarge alluded to financial prob-
lems in their Egyptian operations. Italcementi reported a
loss in sales in its first half results for 2012 partly due to the
Egyptian market; Lafarge saw volumes fall by 11 percent in
its second quarter in Egypt due to limited gas supplies. Such
concerns are cited by many in the cement industry after
fuel subsidies were cut in January 2012 (ICR). In 2013 Titan,
Italcementi and Lafarge insisted that their situations have
marginally improved in Egypt, whereas Cemex has reported
a 10 percent decline in sales for the first half of the year
(Edwards 2013e).
Cemex is also in a state of flux in Egypt when it learned in
September 2012 that its 1999 purchase of Assiut Cement
was invalid and would be annulled. This was due to the 90
percent stake in the state-owned company being sold for less
than its “fair value” at US$580 million. Cemex plans to ap-
peal the decision, which would make Cemex responsible for
all of the financial obligations that its Egyptian business has
incurred since 1999 (ICR 2013).
During 2013, a series of negative events plagued the Egyptian
cement industry: fuel shortages occurred at Suez Cement, a
hostage was taken at Alexandria Cement; Arabian Cement
called for the government to assist with the switch to non-
traditional fuel sources; production was disrupted at Misr Beni
Suef Cement, and in Sinai three cement plant workers were
kidnapped and murdered.

Waste Heat Recovery for the Cement Sector 35
Despite the uncertainty, several greenfield and upgrade
projects were completed during the past three years, often
with foreign involvement. Wadi El Nile (Beni Suef Cement)
began production in June 2011 with FLSmidth responsible
for operation and maintenance. Arabian Cement doubled its
capacity in 2012 at its single Ain Sokhna plant. The company
is 68 percent owned by Spain’s Cementos La Union. Several
new plants and expansions are expected to come on line in
2013/2014. ASEC Minya commissioned its 2 Mta plant at
Minya in May 2013, which produced cement in September
2013. Arabian Cement intends to increase its Egyptian capac-
ity through a contract to operate and maintain two plants for
Egyptian National Cement. Published capacity was greater
than 60 Mta at end-2012, and is expected to exceed 70 Mta
by early 2014. This total includes several outdated kilns that
were scheduled to be shut down between 2011 and 2015.
The current political environment has made these plans un-
certain (Edwards 2013e, ICR 2013).
The political unrest deeply affected the energy sector; fuel
and electric power are unreliable in many areas. Industry
fuel subsidies available under Mubarak have disappeared
and many cement manufacturers must now acquire energy
autonomously. As a result, there have been numerous
efficiency and captive power plant upgrades since 2011,
focusing on integrating alternative fuel systems to burn
agricultural, municipal and other refuse-derived waste. For
example, the Suez Cement Group has begun switching to
integrated alternative fuel systems to burn agricultural and
municipal waste, and Arabian Cement Company added an
alternative fuel equipped line in June of 2012 to burn refuse-
derived fuel instead of gas (Edwards 2012c). Italcementi is
planning a 120 MW wind farm installation in the El Zeit Gulf
through its subsidiary Italgen (Italcementi).
Cement Outlook, Mta
Egypt 2010A 2011A 2012A 2013F 2014F
Consumption 48.9 48.4 51.3 50.1 52.1
% Change +6.5 -1.1 +6.0 -2.3 +4.0
Production 48.3 48.7 51.9 51.1 53.1
Net Trade Exports/ (Imports)
(0.6) 0.3 0.6 1.0 1.0
Source: CW Research GCVFR 2014; Egypt Ministry of Industry and Trade; IFC
Cement Associations
Cement Egypt Society
http://cementegypt.com/
Major Cement Companies – Integrated Facilities (2012)
CompanyNumber of
PlantsCement
Capacity, MtaClinker
Capacity,* Mta
Arabian Cement Co. 1 5.00 2.2
Assiut - Cemex (MEX) 1 4.90 4.2
Amirya - Cimpor (POR) 1 4.45 4.0
El Sewedy 2 3.00 2.8
Suez Cement Group - Italcementi (ITA) 5 13.32 12.0
Lafarge Cement Egypt (FRA) 1 10.60 8.62
Misr-Beni Suef 1 3.00 2.8
Misr-Qena (ASEC) 1 1.90 1.5
ANC Minya (ASEC) 1 2.30 1.7
National Cement 4 3.75 3.4
Sinai White Portland 1 1.81 1.3
South –Valley Cement 2 2.50 2.5
Titan Cement Co. 2 5.00 4.4
Wadi El Nile Cement 1 1.80 1.7
El Arish Military 2 3.00 2.8
* Clinker values estimated based on clinker/cement capacity factor of 0.85 Source: ICR Global Cement Report, 10th Edition; US Geological Survey (USGS), 2011 Minerals Yearbook; Global Cement Plant Database, CemNet 2013
Market Outlook
Egypt’s current social and political upheaval creates large-scale
uncertainty. The International Monetary Fund (IMF) indicated
that after the 2011 revolution Egypt experienced capital
outflows and a sharp drop in tourism revenue and foreign
investment. Annual GDP growth dropped to 1.8 percent in
2011 from 5.1 percent in 2010, disrupting the construction
sector and lowering cement demand. The post-Mubarak
realities are that cement producers will pay far more for fuel
amid uncertain demand, resulting in squeezed margins.
Consequently the outlook is mixed for the Egyptian cement
industry. Little near-term growth is expected in the face of
continuing political unrest, but the fundamental indicators for
long-term growth remain—population expansion, increased
urbanization, and pressing needs for infrastructure develop-
ment.
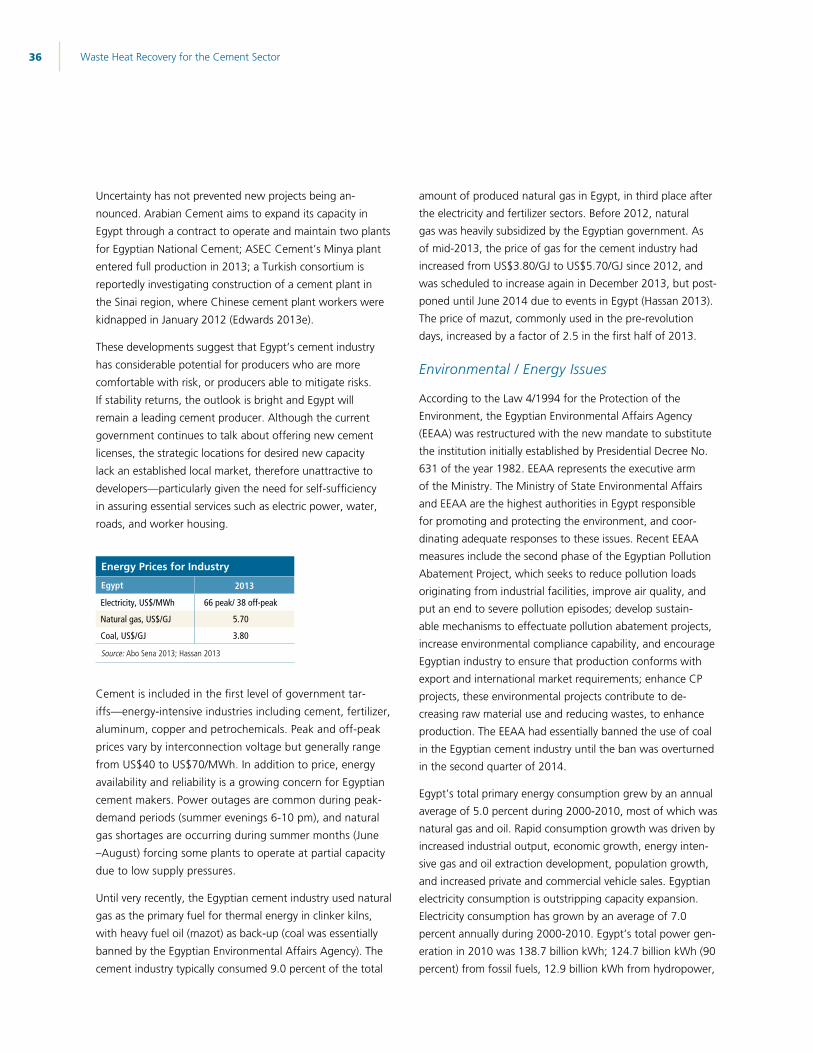
Waste Heat Recovery for the Cement Sector 36
Uncertainty has not prevented new projects being an-
nounced. Arabian Cement aims to expand its capacity in
Egypt through a contract to operate and maintain two plants
for Egyptian National Cement; ASEC Cement’s Minya plant
entered full production in 2013; a Turkish consortium is
reportedly investigating construction of a cement plant in
the Sinai region, where Chinese cement plant workers were
kidnapped in January 2012 (Edwards 2013e).
These developments suggest that Egypt’s cement industry
has considerable potential for producers who are more
comfortable with risk, or producers able to mitigate risks.
If stability returns, the outlook is bright and Egypt will
remain a leading cement producer. Although the current
government continues to talk about offering new cement
licenses, the strategic locations for desired new capacity
lack an established local market, therefore unattractive to
developers—particularly given the need for self-sufficiency
in assuring essential services such as electric power, water,
roads, and worker housing.
Energy Prices for Industry
Egypt 2013
Electricity, US$/MWh 66 peak/ 38 off-peak
Natural gas, US$/GJ 5.70
Coal, US$/GJ 3.80
Source: Abo Sena 2013; Hassan 2013
Cement is included in the first level of government tar-
iffs—energy-intensive industries including cement, fertilizer,
aluminum, copper and petrochemicals. Peak and off-peak
prices vary by interconnection voltage but generally range
from US$40 to US$70/MWh. In addition to price, energy
availability and reliability is a growing concern for Egyptian
cement makers. Power outages are common during peak-
demand periods (summer evenings 6-10 pm), and natural
gas shortages are occurring during summer months (June
–August) forcing some plants to operate at partial capacity
due to low supply pressures.
Until very recently, the Egyptian cement industry used natural
gas as the primary fuel for thermal energy in clinker kilns,
with heavy fuel oil (mazot) as back-up (coal was essentially
banned by the Egyptian Environmental Affairs Agency). The
cement industry typically consumed 9.0 percent of the total
amount of produced natural gas in Egypt, in third place after
the electricity and fertilizer sectors. Before 2012, natural
gas was heavily subsidized by the Egyptian government. As
of mid-2013, the price of gas for the cement industry had
increased from US$3.80/GJ to US$5.70/GJ since 2012, and
was scheduled to increase again in December 2013, but post-
poned until June 2014 due to events in Egypt (Hassan 2013).
The price of mazut, commonly used in the pre-revolution
days, increased by a factor of 2.5 in the first half of 2013.
Environmental / Energy Issues
According to the Law 4/1994 for the Protection of the
Environment, the Egyptian Environmental Affairs Agency
(EEAA) was restructured with the new mandate to substitute
the institution initially established by Presidential Decree No.
631 of the year 1982. EEAA represents the executive arm
of the Ministry. The Ministry of State Environmental Affairs
and EEAA are the highest authorities in Egypt responsible
for promoting and protecting the environment, and coor-
dinating adequate responses to these issues. Recent EEAA
measures include the second phase of the Egyptian Pollution
Abatement Project, which seeks to reduce pollution loads
originating from industrial facilities, improve air quality, and
put an end to severe pollution episodes; develop sustain-
able mechanisms to effectuate pollution abatement projects,
increase environmental compliance capability, and encourage
Egyptian industry to ensure that production conforms with
export and international market requirements; enhance CP
projects, these environmental projects contribute to de-
creasing raw material use and reducing wastes, to enhance
production. The EEAA had essentially banned the use of coal
in the Egyptian cement industry until the ban was overturned
in the second quarter of 2014.
Egypt’s total primary energy consumption grew by an annual
average of 5.0 percent during 2000-2010, most of which was
natural gas and oil. Rapid consumption growth was driven by
increased industrial output, economic growth, energy inten-
sive gas and oil extraction development, population growth,
and increased private and commercial vehicle sales. Egyptian
electricity consumption is outstripping capacity expansion.
Electricity consumption has grown by an average of 7.0
percent annually during 2000-2010. Egypt’s total power gen-
eration in 2010 was 138.7 billion kWh; 124.7 billion kWh (90
percent) from fossil fuels, 12.9 billion kWh from hydropower,

Waste Heat Recovery for the Cement Sector 37
and 1.5 billion kWh from wind. An aging power structure and rising demand have led to intermittent blackouts (DOE 2013a).
Power outages and natural gas shortages have been particu-larly troublesome for the cement industry. A history of subsi-dies for oil and gas, and the recent political uncertainty have constrained investment in oil and gas production; Egypt was a natural gas exporter, now a net importer. At the same time, growing demand for power is consuming more gas, limiting the supplies available for industry. Some cement plants shut down this past summer due to an inability to get adequate gas supplies while others operated at reduced capacity. After years of heavily subsidizing industry’s natural gas consump-tion, the government is now encouraging industry to switch to alternative fuels, but would not permit the use of coal due to environmental concerns. The cement industry successfully pushed for restrictions on coal use to be lifted, and many of the larger companies will be retrofitting their kilns to co-fire or completely fire with coal (Hassan 2013).
CURRENT STATUS OF WHRNo waste heat recovery power generation systems exist in the Egyptian cement industry. Cemex registered a proposed system for the Assiut plant under the CDM program in 2012, but the current uncertainty with Cemex’s continued ownership of the plant has apparently put this project on hold. Sinoma International, a global supplier of engineering, construction and equipment for cement production, is active in the Egyptian cement market. Its sister company, Sinoma Energy Conservation, is a major global developer of waste heat recovery projects in the cement industry and has been actively marketing the concept in Egypt. The potential for WHR in Egypt ranges from 175 to 300 MW, based on estimated clinker capacity for major cement companies at plants with capacity greater than 1 Mta. The moisture content of raw materials is typically in the 2.0 to 5.0 percent range (Abo Sena 2013), which should not negatively impact WHR potential.
Political instability, declining natural gas production and a foreign currency crisis have led to widespread energy short-ages in Egypt that are expected to continue in the foreseeable future. Increasing concerns about power reliability and rising prices may provide a strong driver for WHR in the Egyptian cement industry.
Waste Heat Recovery for the Cement Sector 38
INDIADemographics
Area: 3,287,263 km2
Population: 1259.7 MUrbanization: 31 percentPer Capita Cement Use: 191 kg
Cement Industry (2012)
Number of Plants: 146Cement Production Capacity: 346.2 MtaClinker Production Capacity: 252.7 Mta*Average Cement Price: US$80.00 / ton2012 Consumption: 234.7 Mt2012 Production: 235.9 Mt
* Based on assumed clinker / cement factor of 0.73 (GNR Database 2013)
CURRENT STATUS OF CEMENT INDUSTRYIndia’s economy is the third largest by GDP in terms of purchas-ing power parity but, with a very large population, it ranks only 165th in GDP per capita terms. India is the second most popu-lous country in the world after China, and also second to China in cement production. Gradual economic decentralization since the early 1990s has allowed a more diverse market economy to develop, one that is increasingly driven by an educated and business-minded middle class. Increased variation has reduced India’s dependency on agriculture, now about 50 percent of na-tional income. Manufacturing represents more than 25 percent of output.
Housing accounts for 64 percent of Indian cement consumption; infrastructure, 17 percent; commercial, 13 percent; and industrial 6.0 percent (ICR 2013). Today, the Indian cement industry is enormous, second only to China in terms of installed capacity; the industry has grown rapidly over the past 20 years—cement production has more than quadrupled from around 50 Mt per year in 1992 to over 240 Mt per year in 2012.
Although the Indian cement industry includes some multi-national cement giants like Holcim, Heidelberg and Lafarge, which have interests in Indian companies, the industry is broad-ly indigenous. In 2011, Ultratech Cement, the country’s largest firm in terms of cement capacity, held around 16 percent of the domestic market; ACC (50 percent-owned by Holcim) and
Ambuja (50 percent-owned by Holcim) have 11 percent and 9.0 percent shares respectively. Many of the remaining dozen top players are Indian and are (in order of diminishing market share); Jaiprakash Associates (7.0 percent), India Cements Ltd (5.0 percent), Shree Cements (4.0 percent), Century Textiles and Industries (3.5 percent), Madras Cements (3.5 percent), Lafarge (3.5 percent), Birla Cement (2.8 percent), Kesoram In-dustries (2.8 percent) and Binani Cement (2.8 percent). Among these companies, the top 12 cement firms have around 70 percent of the domestic market. Around 100 smaller play-ers produce and grind cement on a wide range of scales but are often confined to small areas. As of the end of 2012, the Indian cement industry consisted of 146 integrated plants and 55 grinding plants (Edwards 2013a, ICR 2013).
The Indian cement industry is inherently prone to low compe-tition because it has relatively high barriers to entry, a captive clientele, relatively little product differentiation and no other materials that can substitute for cement. These conditions can lead to cartel-like practices or full-blown collusion among so-called competitors. Ernst and Young noted that, “though the demand growth remained subdued, the cement manu-facturers have observed supply discipline involving curtailment of production by companies in order to narrow the demand-supply gap”. In June 2012, the Competition Commission of India (CCI) fined 11 cement companies and implicated the Cement Manufacturers Association (CMA) for participation in a cartel. The commission found that the 11 major produc-ers did not utilize their available capacity, reducing supplies and raising prices in times of higher demand. The CCI stated that the companies’ actions, limiting supplies to the market through an ‘anti-competitive agreement’, was detrimental not only to consumers but also to the economy, as the build-ing material is a critical input for infrastructure projects.
Despite the recent economic slowdown and evidence of exist-ing overcapacity, many Indian cement companies have recently increased production capacity creating an even greater over-capacity relative to demand; it is forecast to persist in the near term. The CCI ruling did not deter cement companies from continuing to announce development plans for new capacity in India, because cement company boards want to maintain market share in a market with increasing demand. This overca-pacity contributed to recent drops in cement prices. Exports to Africa and neighboring countries in the northeast are expected to increase as demand rises in these markets.
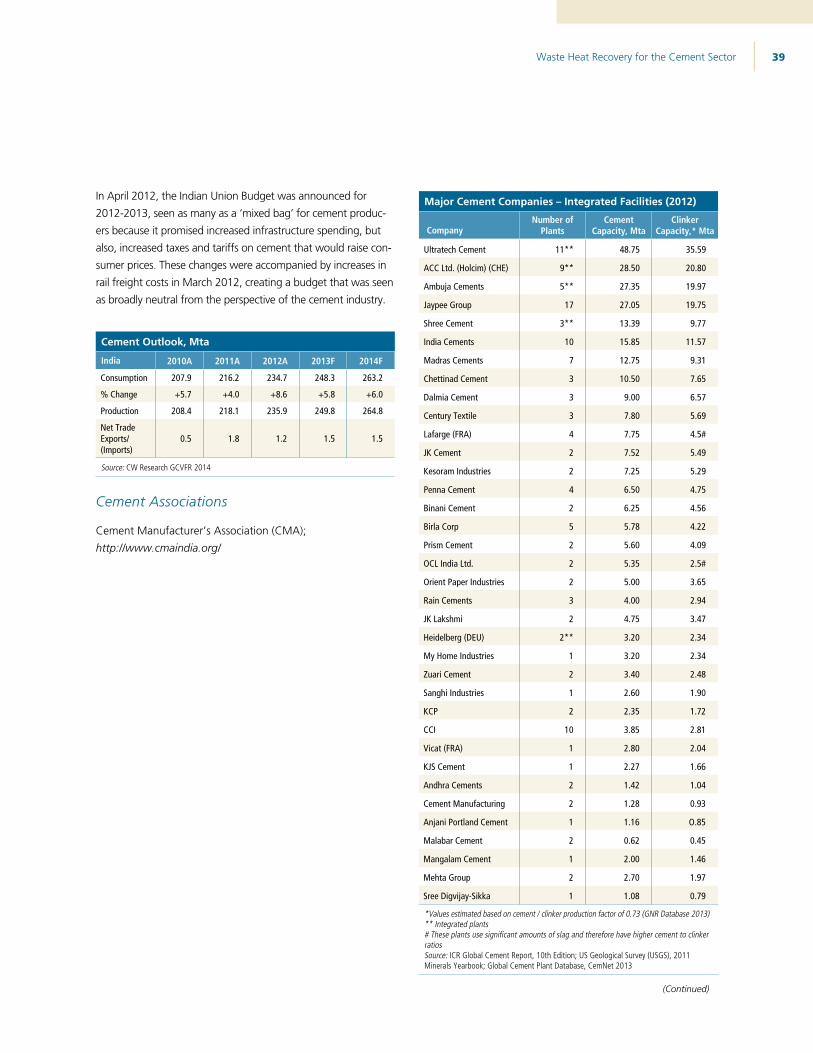
Waste Heat Recovery for the Cement Sector 39
In April 2012, the Indian Union Budget was announced for 2012-2013, seen as many as a ‘mixed bag’ for cement produc-ers because it promised increased infrastructure spending, but also, increased taxes and tariffs on cement that would raise con-sumer prices. These changes were accompanied by increases in rail freight costs in March 2012, creating a budget that was seen as broadly neutral from the perspective of the cement industry.
Cement Outlook, Mta
India 2010A 2011A 2012A 2013F 2014F
Consumption 207.9 216.2 234.7 248.3 263.2
% Change +5.7 +4.0 +8.6 +5.8 +6.0
Production 208.4 218.1 235.9 249.8 264.8
Net Trade Exports/ (Imports)
0.5 1.8 1.2 1.5 1.5
Source: CW Research GCVFR 2014
Cement Associations
Cement Manufacturer’s Association (CMA); http://www.cmaindia.org/
Major Cement Companies – Integrated Facilities (2012)
CompanyNumber of
PlantsCement
Capacity, MtaClinker
Capacity,* Mta
Ultratech Cement 11** 48.75 35.59
ACC Ltd. (Holcim) (CHE) 9** 28.50 20.80
Ambuja Cements 5** 27.35 19.97
Jaypee Group 17 27.05 19.75
Shree Cement 3** 13.39 9.77
India Cements 10 15.85 11.57
Madras Cements 7 12.75 9.31
Chettinad Cement 3 10.50 7.65
Dalmia Cement 3 9.00 6.57
Century Textile 3 7.80 5.69
Lafarge (FRA) 4 7.75 4.5#
JK Cement 2 7.52 5.49
Kesoram Industries 2 7.25 5.29
Penna Cement 4 6.50 4.75
Binani Cement 2 6.25 4.56
Birla Corp 5 5.78 4.22
Prism Cement 2 5.60 4.09
OCL India Ltd. 2 5.35 2.5#
Orient Paper Industries 2 5.00 3.65
Rain Cements 3 4.00 2.94
JK Lakshmi 2 4.75 3.47
Heidelberg (DEU) 2** 3.20 2.34
My Home Industries 1 3.20 2.34
Zuari Cement 2 3.40 2.48
Sanghi Industries 1 2.60 1.90
KCP 2 2.35 1.72
CCI 10 3.85 2.81
Vicat (FRA) 1 2.80 2.04
KJS Cement 1 2.27 1.66
Andhra Cements 2 1.42 1.04
Cement Manufacturing 2 1.28 0.93
Anjani Portland Cement 1 1.16 O.85
Malabar Cement 2 0.62 0.45
Mangalam Cement 1 2.00 1.46
Mehta Group 2 2.70 1.97
Sree Digvijay-Sikka 1 1.08 0.79
*Values estimated based on cement / clinker production factor of 0.73 (GNR Database 2013)** Integrated plants # These plants use significant amounts of slag and therefore have higher cement to clinker ratiosSource: ICR Global Cement Report, 10th Edition; US Geological Survey (USGS), 2011 Minerals Yearbook; Global Cement Plant Database, CemNet 2013
(Continued)
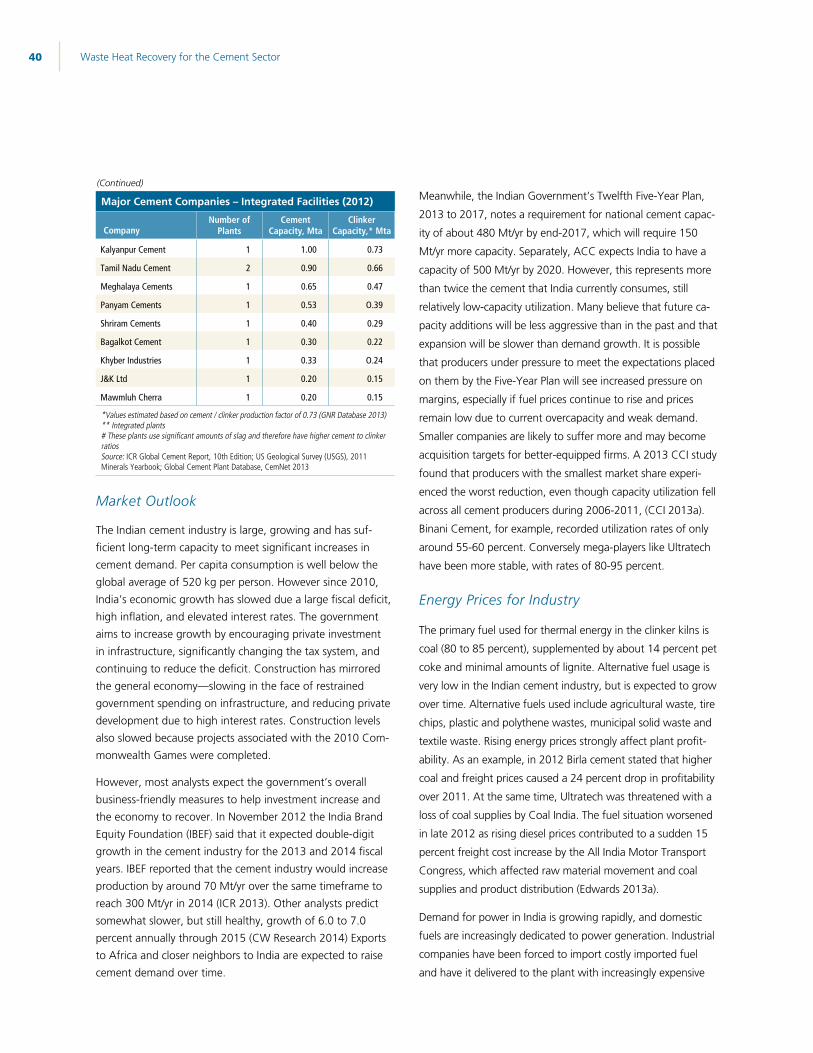
Waste Heat Recovery for the Cement Sector 40
Major Cement Companies – Integrated Facilities (2012)
CompanyNumber of
PlantsCement
Capacity, MtaClinker
Capacity,* Mta
Kalyanpur Cement 1 1.00 0.73
Tamil Nadu Cement 2 0.90 0.66
Meghalaya Cements 1 0.65 0.47
Panyam Cements 1 0.53 O.39
Shriram Cements 1 0.40 0.29
Bagalkot Cement 1 0.30 0.22
Khyber Industries 1 0.33 O.24
J&K Ltd 1 0.20 0.15
Mawmluh Cherra 1 0.20 0.15
*Values estimated based on cement / clinker production factor of 0.73 (GNR Database 2013)** Integrated plants # These plants use significant amounts of slag and therefore have higher cement to clinker ratiosSource: ICR Global Cement Report, 10th Edition; US Geological Survey (USGS), 2011 Minerals Yearbook; Global Cement Plant Database, CemNet 2013
Market Outlook
The Indian cement industry is large, growing and has suf-
ficient long-term capacity to meet significant increases in
cement demand. Per capita consumption is well below the
global average of 520 kg per person. However since 2010,
India’s economic growth has slowed due a large fiscal deficit,
high inflation, and elevated interest rates. The government
aims to increase growth by encouraging private investment
in infrastructure, significantly changing the tax system, and
continuing to reduce the deficit. Construction has mirrored
the general economy—slowing in the face of restrained
government spending on infrastructure, and reducing private
development due to high interest rates. Construction levels
also slowed because projects associated with the 2010 Com-
monwealth Games were completed.
However, most analysts expect the government’s overall
business-friendly measures to help investment increase and
the economy to recover. In November 2012 the India Brand
Equity Foundation (IBEF) said that it expected double-digit
growth in the cement industry for the 2013 and 2014 fiscal
years. IBEF reported that the cement industry would increase
production by around 70 Mt/yr over the same timeframe to
reach 300 Mt/yr in 2014 (ICR 2013). Other analysts predict
somewhat slower, but still healthy, growth of 6.0 to 7.0
percent annually through 2015 (CW Research 2014) Exports
to Africa and closer neighbors to India are expected to raise
cement demand over time.
Meanwhile, the Indian Government’s Twelfth Five-Year Plan,
2013 to 2017, notes a requirement for national cement capac-
ity of about 480 Mt/yr by end-2017, which will require 150
Mt/yr more capacity. Separately, ACC expects India to have a
capacity of 500 Mt/yr by 2020. However, this represents more
than twice the cement that India currently consumes, still
relatively low-capacity utilization. Many believe that future ca-
pacity additions will be less aggressive than in the past and that
expansion will be slower than demand growth. It is possible
that producers under pressure to meet the expectations placed
on them by the Five-Year Plan will see increased pressure on
margins, especially if fuel prices continue to rise and prices
remain low due to current overcapacity and weak demand.
Smaller companies are likely to suffer more and may become
acquisition targets for better-equipped firms. A 2013 CCI study
found that producers with the smallest market share experi-
enced the worst reduction, even though capacity utilization fell
across all cement producers during 2006-2011, (CCI 2013a).
Binani Cement, for example, recorded utilization rates of only
around 55-60 percent. Conversely mega-players like Ultratech
have been more stable, with rates of 80-95 percent.
Energy Prices for Industry
The primary fuel used for thermal energy in the clinker kilns is
coal (80 to 85 percent), supplemented by about 14 percent pet
coke and minimal amounts of lignite. Alternative fuel usage is
very low in the Indian cement industry, but is expected to grow
over time. Alternative fuels used include agricultural waste, tire
chips, plastic and polythene wastes, municipal solid waste and
textile waste. Rising energy prices strongly affect plant profit-
ability. As an example, in 2012 Birla cement stated that higher
coal and freight prices caused a 24 percent drop in profitability
over 2011. At the same time, Ultratech was threatened with a
loss of coal supplies by Coal India. The fuel situation worsened
in late 2012 as rising diesel prices contributed to a sudden 15
percent freight cost increase by the All India Motor Transport
Congress, which affected raw material movement and coal
supplies and product distribution (Edwards 2013a).
Demand for power in India is growing rapidly, and domestic
fuels are increasingly dedicated to power generation. Industrial
companies have been forced to import costly imported fuel
and have it delivered to the plant with increasingly expensive
(Continued)
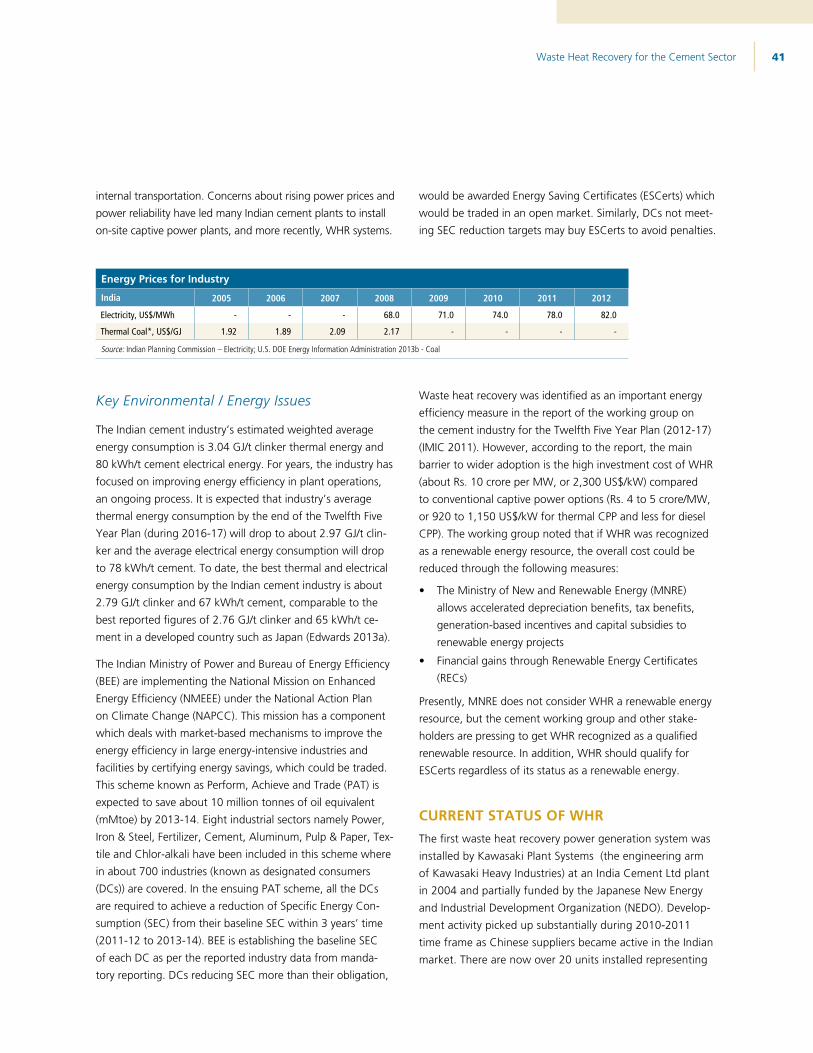
Waste Heat Recovery for the Cement Sector 41
internal transportation. Concerns about rising power prices and power reliability have led many Indian cement plants to install on-site captive power plants, and more recently, WHR systems.
Key Environmental / Energy Issues
The Indian cement industry’s estimated weighted average energy consumption is 3.04 GJ/t clinker thermal energy and 80 kWh/t cement electrical energy. For years, the industry has focused on improving energy efficiency in plant operations, an ongoing process. It is expected that industry’s average thermal energy consumption by the end of the Twelfth Five Year Plan (during 2016-17) will drop to about 2.97 GJ/t clin-ker and the average electrical energy consumption will drop to 78 kWh/t cement. To date, the best thermal and electrical energy consumption by the Indian cement industry is about 2.79 GJ/t clinker and 67 kWh/t cement, comparable to the best reported figures of 2.76 GJ/t clinker and 65 kWh/t ce-ment in a developed country such as Japan (Edwards 2013a).
The Indian Ministry of Power and Bureau of Energy Efficiency (BEE) are implementing the National Mission on Enhanced Energy Efficiency (NMEEE) under the National Action Plan on Climate Change (NAPCC). This mission has a component which deals with market-based mechanisms to improve the energy efficiency in large energy-intensive industries and facilities by certifying energy savings, which could be traded. This scheme known as Perform, Achieve and Trade (PAT) is expected to save about 10 million tonnes of oil equivalent (mMtoe) by 2013-14. Eight industrial sectors namely Power, Iron & Steel, Fertilizer, Cement, Aluminum, Pulp & Paper, Tex-tile and Chlor-alkali have been included in this scheme where in about 700 industries (known as designated consumers (DCs)) are covered. In the ensuing PAT scheme, all the DCs are required to achieve a reduction of Specific Energy Con-sumption (SEC) from their baseline SEC within 3 years’ time (2011-12 to 2013-14). BEE is establishing the baseline SEC of each DC as per the reported industry data from manda-tory reporting. DCs reducing SEC more than their obligation,
would be awarded Energy Saving Certificates (ESCerts) which would be traded in an open market. Similarly, DCs not meet-ing SEC reduction targets may buy ESCerts to avoid penalties.
Waste heat recovery was identified as an important energy efficiency measure in the report of the working group on the cement industry for the Twelfth Five Year Plan (2012-17) (IMIC 2011). However, according to the report, the main barrier to wider adoption is the high investment cost of WHR (about Rs. 10 crore per MW, or 2,300 US$/kW) compared to conventional captive power options (Rs. 4 to 5 crore/MW, or 920 to 1,150 US$/kW for thermal CPP and less for diesel CPP). The working group noted that if WHR was recognized as a renewable energy resource, the overall cost could be reduced through the following measures:
The Ministry of New and Renewable Energy (MNRE) allows accelerated depreciation benefits, tax benefits, generation-based incentives and capital subsidies to renewable energy projects
Financial gains through Renewable Energy Certificates (RECs)
Presently, MNRE does not consider WHR a renewable energy resource, but the cement working group and other stake-holders are pressing to get WHR recognized as a qualified renewable resource. In addition, WHR should qualify for ESCerts regardless of its status as a renewable energy.
CURRENT STATUS OF WHRThe first waste heat recovery power generation system was installed by Kawasaki Plant Systems (the engineering arm of Kawasaki Heavy Industries) at an India Cement Ltd plant in 2004 and partially funded by the Japanese New Energy and Industrial Development Organization (NEDO). Develop-ment activity picked up substantially during 2010-2011 time frame as Chinese suppliers became active in the Indian market. There are now over 20 units installed representing
Energy Prices for Industry
India 2005 2006 2007 2008 2009 2010 2011 2012
Electricity, US$/MWh - - - 68.0 71.0 74.0 78.0 82.0
Thermal Coal*, US$/GJ 1.92 1.89 2.09 2.17 - - - -
Source: Indian Planning Commission – Electricity; U.S. DOE Energy Information Administration 2013b - Coal
Waste Heat Recovery for the Cement Sector 42
> 200 MW of capacity.18 The remaining potential for WHR in India ranges from 500 to 900 MW19 based on estimated clinker capacity at plants with capacity greater than 1 Mta. The Cement Manufacturers’ Association has been pressing the government to give renewable energy status to waste heat recovery in India.
The waste heat recovery power generation market for the Indian cement industry is served by domestic and foreign suppliers, and joint ventures between domestic and foreign suppliers:
Transparent Energy Systems Private Limited (TESPL) is a do-mestic engineering and construction firm that has developed and patented an in-house technology for waste heat recovery systems for the cement industry. TESPL also installs other technologies such as the Ormat organic Rankine cycle system it constructed at the Ultratech Tadipatri plant (at the time an Andhra Pradesh Cement Works facility).
Tecpro Systems Limited (Tecpro) is a domestic engineering, procurement and construction (EPC) contractor in the power sector. In February 2011, Tecpro entered into a collaborative agreement with Nanjing Triumph Kaineng Environment and Energy Company (NTK) to develop waste heat power projects based on the NTK technology (waste heat boiler and steam turbine) for the Indian market. The joint venture has an-nounced five WHR projects since forming the joint venture.
Thermax is a domestic supplier and engineering/constructor of energy systems including boilers and steam systems. Ther-max entered into an agreement with Taiheiyo Engineering Corp of Japan to offer waste heat recovery power genera-tion systems in India. The collaborative has two systems at JK Cement, Nimbahera and at JK Lakshmi. Thermax offers both EPC and build, own, operate and transfer (BOOT) contracts for WHR systems.
Dalian East New Energy Development Co. (Dalian) is a lead-ing Chinese developer and supplier of waste heat recovery power generation systems. Dalian entered the Indian market in 2008/2009 and has at least five systems installed and/or under construction.
18 OneStone Research states that there are 26 WHR systems installed at Indian cement plants.
19 Shakti estimated the overall market potential in the Indian cement industry to be in the 500 to 600 MW range (Shakti 2013).
Sinoma Energy Conservation Co. (Sinoma EC) is a leading Chinese supplier and recently entered the Indian market through WHR projects with ACC/Holcim.
Kawasaki Plant Systems (Kawasaki) is a Japanese company that pioneered the development of waste heat recovery systems for cement plants in the 1980s. Although Kawasaki installed the initial WHR system in the Indian cement industry in 2004 with support from NEDO, it does not appear to be active in the Indian market either as Kawasaki Plant Systems or through its Chinese joint venture with Anhui Conch Ce-ment, Anhui Conch Kawasaki Engineering.
FLSmidth is a global engineering company from Denmark with cement industry engineering, equipment, and construc-tion expertise. It installed a single unit at Vicat Sagar Cement’s Gulbargo plant in 2012 and is actively bidding on projects in India. The Gulbargo unit is a conventional steam Rankine cycle system, but FLSmidth holds an exclusive global license (excluding China) for the Kalina cycle system in the cement and lime industries.
TESPL filed a complaint against the Tecpro/NTK joint venture in May 2013 alleging the Chinese company NTK was indulg-ing in predatory pricing to buy entry into the market by quot-ing bid prices that were far below market rates. TESPL noted that the Tecpro/NTK joint venture had won five of six bids since the joint venture became active. The CCI ruled against the complaint in June 2013, finding that the pricing was not a case of predatory pricing but seemed instead to be a case of reasonable competitive bidding. The CCI ruling included in-formation on five recent bids; repeat bidders included Tecpro/NTK, TESPL, Sinoma EC, Dalian, Thermax and FLSmidth. Two additional bidders were also evident—Thyssen Krupp, a German company with a division, Polysius, that is one of the leading engineering companies equipping the cement and minerals industries on a global basis; and Cethar Vessels, a domestic company that supplies boilers and engineering services to the power sector (CCI 2013b).
Installed WHR Projects
PlantKiln Type/Capacity/
Number of Lines Year Started Technology ProviderWHR
Capacity Total Installed Cost Comments
1 ACC/Holcim - Gagal 2013 Sinoma EC 4.3
2 ACC/Holcim - Rabriyawas 2013 Sinoma EC 6.0
3 Ambuja Cement - Rabriyawas dry / 6560 tpd 2013 NTK/Tecpro 6.5 EPC Contract
4 Birla - Chanderia Cement Works dry / 2x 2000, 4400 tpd / 3 lines 2010 Dalian East 9.0 Also 27 MW CPP
5 Birla - Vikas Cement 1, Satna dry / 4500 tpd 2010 Dalian East 7.5 Also 30 MW CPP
6 Birla - Vikas Cement 2, Satna dry / 4500 tpd 2011 Dalian East 7.5
7 Birla - New Chanderia CW dry / 6000 tpd In Constr Dalian East
8 Dalmia Cement - Bharat In Tender 2/2013 solicitation
9 Heidelberg – Narsingarh Dahmo dry / 5000+ tpd / 3 lines 2015 12.5 US$27.8 million 12.15 MW net
10 India Cement Ltd dry / 4000 tpd 2004 Kawasaki Plant Systems 7.7 NEDO funding
11 JK Cement - Nimbahera plant dry / 100, 1800, 4800 tpd 2007 Thermax / Taiheiyo (JPN) 13.2 US$17.25 million 12.1 MW Net; 3
year payback
12 JK Lakshmi - Sirohi plant Thermax / Taiheiyo (JPN) 12.0
13 KCP Limited - Andhra Pradesh Plant dry / 1600 tpd 2007 Transparent Energy
Systems 2.5 US$1.9 million CDM project; 2.25 MW net
14 Shree Cement - Ras dry / 5 lines < 2012 43.0Multiple units
since 2009; > 200 MW CPP
15 Shree Cement - Beawar < 2012 2.5
16 Shree Cement - Ras dry / 3300 tpd 2012 NTK/Tecpro 4.6 EPC contract
17 Siddhi Vinayak dry / 4500 tpd NTK/Tecpro 4.7 EPC contract
18 Sri Lalita dry / 6000 tpd Dalian East 11.5 25 MW CCP; only PH boiler
19 Ultratech - Rawan Cement Works, Chhattisgarh dry / 6000, 11000 tpd 2013 NTK/Tecpro 15.2 EPC contract;
13.85 MW net
20 Ultratech - Rajashree Cement Works, Karnatika dry / 11500 tpd / 3 lines 2013 NTK/Tecpro 10.8 US$15.6 million EPC contract; 9.8
MW net
21 Ultratech - Tadipatri dry / 8000 tpd 2007 Transparent Energy Systems 4.8
Organic Rankine Cycle (Ormat); 4.5
MW net
22 Vicat Sagar - Gulbarga plant 2012 FLSmidth 8.4 Steam cycle
Source: Indian Planning Commission – Electricity; U.S. DOE Energy Information Administration 2013b - Coal

Waste Heat Recovery for the Cement Sector 43
Sinoma Energy Conservation Co. (Sinoma EC) is a leading Chinese supplier and recently entered the Indian market through WHR projects with ACC/Holcim.
Kawasaki Plant Systems (Kawasaki) is a Japanese company that pioneered the development of waste heat recovery systems for cement plants in the 1980s. Although Kawasaki installed the initial WHR system in the Indian cement industry in 2004 with support from NEDO, it does not appear to be active in the Indian market either as Kawasaki Plant Systems or through its Chinese joint venture with Anhui Conch Ce-ment, Anhui Conch Kawasaki Engineering.
FLSmidth is a global engineering company from Denmark with cement industry engineering, equipment, and construc-tion expertise. It installed a single unit at Vicat Sagar Cement’s Gulbargo plant in 2012 and is actively bidding on projects in India. The Gulbargo unit is a conventional steam Rankine cycle system, but FLSmidth holds an exclusive global license (excluding China) for the Kalina cycle system in the cement and lime industries.
TESPL filed a complaint against the Tecpro/NTK joint venture in May 2013 alleging the Chinese company NTK was indulg-ing in predatory pricing to buy entry into the market by quot-ing bid prices that were far below market rates. TESPL noted that the Tecpro/NTK joint venture had won five of six bids since the joint venture became active. The CCI ruled against the complaint in June 2013, finding that the pricing was not a case of predatory pricing but seemed instead to be a case of reasonable competitive bidding. The CCI ruling included in-formation on five recent bids; repeat bidders included Tecpro/NTK, TESPL, Sinoma EC, Dalian, Thermax and FLSmidth. Two additional bidders were also evident—Thyssen Krupp, a German company with a division, Polysius, that is one of the leading engineering companies equipping the cement and minerals industries on a global basis; and Cethar Vessels, a domestic company that supplies boilers and engineering services to the power sector (CCI 2013b).
Installed WHR Projects
PlantKiln Type/Capacity/
Number of Lines Year Started Technology ProviderWHR
Capacity Total Installed Cost Comments
1 ACC/Holcim - Gagal 2013 Sinoma EC 4.3
2 ACC/Holcim - Rabriyawas 2013 Sinoma EC 6.0
3 Ambuja Cement - Rabriyawas dry / 6560 tpd 2013 NTK/Tecpro 6.5 EPC Contract
4 Birla - Chanderia Cement Works dry / 2x 2000, 4400 tpd / 3 lines 2010 Dalian East 9.0 Also 27 MW CPP
5 Birla - Vikas Cement 1, Satna dry / 4500 tpd 2010 Dalian East 7.5 Also 30 MW CPP
6 Birla - Vikas Cement 2, Satna dry / 4500 tpd 2011 Dalian East 7.5
7 Birla - New Chanderia CW dry / 6000 tpd In Constr Dalian East
8 Dalmia Cement - Bharat In Tender 2/2013 solicitation
9 Heidelberg – Narsingarh Dahmo dry / 5000+ tpd / 3 lines 2015 12.5 US$27.8 million 12.15 MW net
10 India Cement Ltd dry / 4000 tpd 2004 Kawasaki Plant Systems 7.7 NEDO funding
11 JK Cement - Nimbahera plant dry / 100, 1800, 4800 tpd 2007 Thermax / Taiheiyo (JPN) 13.2 US$17.25 million 12.1 MW Net; 3
year payback
12 JK Lakshmi - Sirohi plant Thermax / Taiheiyo (JPN) 12.0
13 KCP Limited - Andhra Pradesh Plant dry / 1600 tpd 2007 Transparent Energy
Systems 2.5 US$1.9 million CDM project; 2.25 MW net
14 Shree Cement - Ras dry / 5 lines < 2012 43.0Multiple units
since 2009; > 200 MW CPP
15 Shree Cement - Beawar < 2012 2.5
16 Shree Cement - Ras dry / 3300 tpd 2012 NTK/Tecpro 4.6 EPC contract
17 Siddhi Vinayak dry / 4500 tpd NTK/Tecpro 4.7 EPC contract
18 Sri Lalita dry / 6000 tpd Dalian East 11.5 25 MW CCP; only PH boiler
19 Ultratech - Rawan Cement Works, Chhattisgarh dry / 6000, 11000 tpd 2013 NTK/Tecpro 15.2 EPC contract;
13.85 MW net
20 Ultratech - Rajashree Cement Works, Karnatika dry / 11500 tpd / 3 lines 2013 NTK/Tecpro 10.8 US$15.6 million EPC contract; 9.8
MW net
21 Ultratech - Tadipatri dry / 8000 tpd 2007 Transparent Energy Systems 4.8
Organic Rankine Cycle (Ormat); 4.5
MW net
22 Vicat Sagar - Gulbarga plant 2012 FLSmidth 8.4 Steam cycle
Source: Indian Planning Commission – Electricity; U.S. DOE Energy Information Administration 2013b - Coal
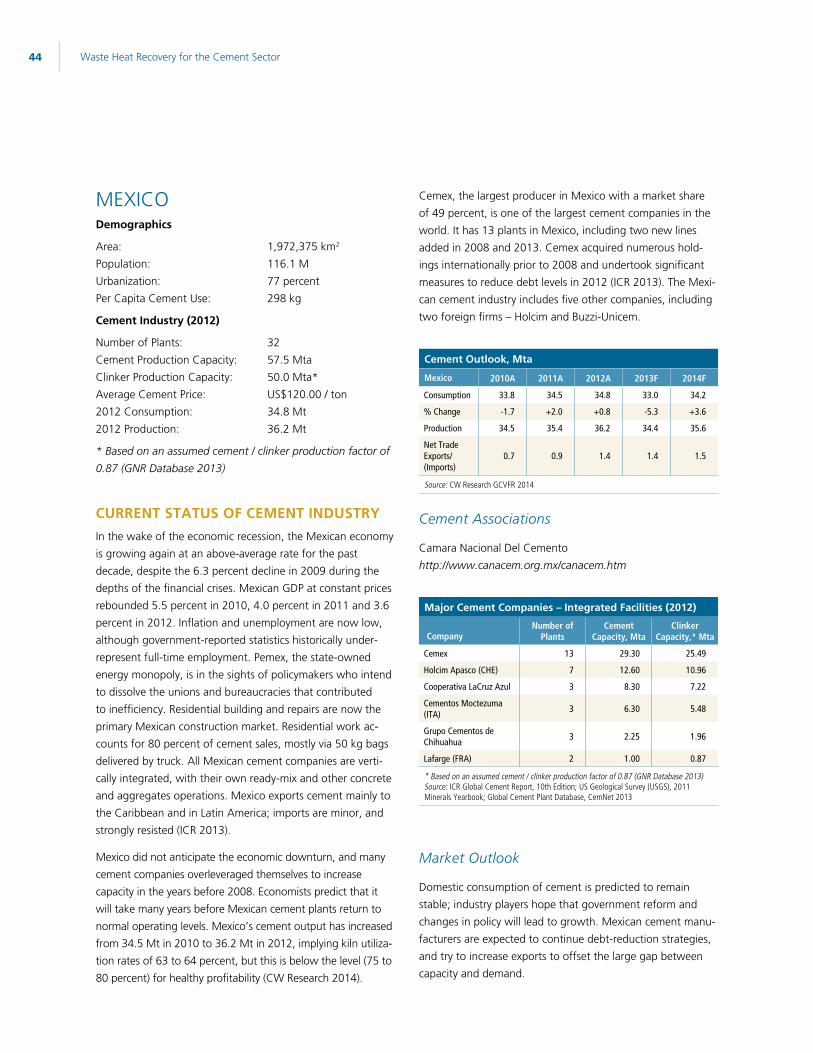
Waste Heat Recovery for the Cement Sector 44
MEXICODemographics
Area: 1,972,375 km2
Population: 116.1 MUrbanization: 77 percentPer Capita Cement Use: 298 kg
Cement Industry (2012)
Number of Plants: 32 Cement Production Capacity: 57.5 MtaClinker Production Capacity: 50.0 Mta*Average Cement Price: US$120.00 / ton2012 Consumption: 34.8 Mt2012 Production: 36.2 Mt
* Based on an assumed cement / clinker production factor of 0.87 (GNR Database 2013)
CURRENT STATUS OF CEMENT INDUSTRYIn the wake of the economic recession, the Mexican economy is growing again at an above-average rate for the past decade, despite the 6.3 percent decline in 2009 during the depths of the financial crises. Mexican GDP at constant prices rebounded 5.5 percent in 2010, 4.0 percent in 2011 and 3.6 percent in 2012. Inflation and unemployment are now low, although government-reported statistics historically under-represent full-time employment. Pemex, the state-owned energy monopoly, is in the sights of policymakers who intend to dissolve the unions and bureaucracies that contributed to inefficiency. Residential building and repairs are now the primary Mexican construction market. Residential work ac-counts for 80 percent of cement sales, mostly via 50 kg bags delivered by truck. All Mexican cement companies are verti-cally integrated, with their own ready-mix and other concrete and aggregates operations. Mexico exports cement mainly to the Caribbean and in Latin America; imports are minor, and strongly resisted (ICR 2013).
Mexico did not anticipate the economic downturn, and many cement companies overleveraged themselves to increase capacity in the years before 2008. Economists predict that it will take many years before Mexican cement plants return to normal operating levels. Mexico’s cement output has increased from 34.5 Mt in 2010 to 36.2 Mt in 2012, implying kiln utiliza-tion rates of 63 to 64 percent, but this is below the level (75 to 80 percent) for healthy profitability (CW Research 2014).
Cemex, the largest producer in Mexico with a market share of 49 percent, is one of the largest cement companies in the world. It has 13 plants in Mexico, including two new lines added in 2008 and 2013. Cemex acquired numerous hold-ings internationally prior to 2008 and undertook significant measures to reduce debt levels in 2012 (ICR 2013). The Mexi-can cement industry includes five other companies, including two foreign firms – Holcim and Buzzi-Unicem.
Cement Outlook, Mta
Mexico 2010A 2011A 2012A 2013F 2014F
Consumption 33.8 34.5 34.8 33.0 34.2
% Change -1.7 +2.0 +0.8 -5.3 +3.6
Production 34.5 35.4 36.2 34.4 35.6
Net Trade Exports/ (Imports)
0.7 0.9 1.4 1.4 1.5
Source: CW Research GCVFR 2014
Cement Associations
Camara Nacional Del Cemento http://www.canacem.org.mx/canacem.htm
Major Cement Companies – Integrated Facilities (2012)
CompanyNumber of
PlantsCement
Capacity, MtaClinker
Capacity,* Mta
Cemex 13 29.30 25.49
Holcim Apasco (CHE) 7 12.60 10.96
Cooperativa LaCruz Azul 3 8.30 7.22
Cementos Moctezuma (ITA) 3 6.30 5.48
Grupo Cementos de Chihuahua 3 2.25 1.96
Lafarge (FRA) 2 1.00 0.87
* Based on an assumed cement / clinker production factor of 0.87 (GNR Database 2013)Source: ICR Global Cement Report, 10th Edition; US Geological Survey (USGS), 2011 Minerals Yearbook; Global Cement Plant Database, CemNet 2013
Market Outlook
Domestic consumption of cement is predicted to remain stable; industry players hope that government reform and changes in policy will lead to growth. Mexican cement manu-facturers are expected to continue debt-reduction strategies, and try to increase exports to offset the large gap between capacity and demand.
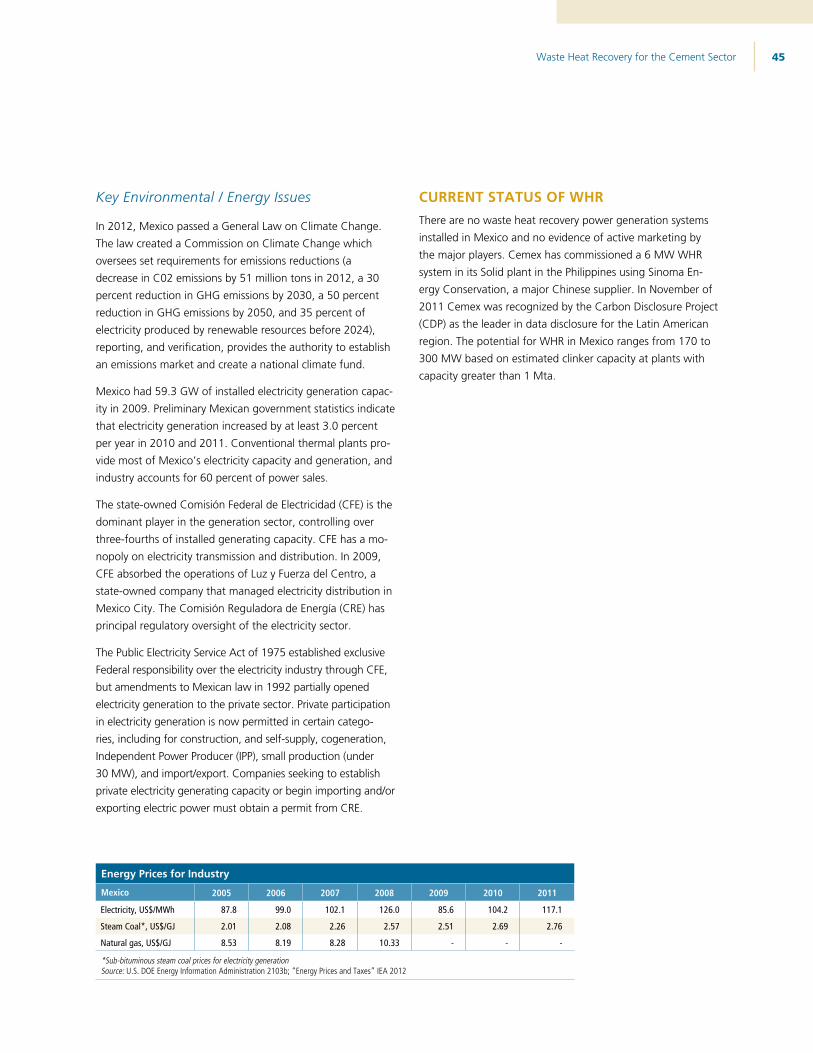
Waste Heat Recovery for the Cement Sector 45
Key Environmental / Energy Issues
In 2012, Mexico passed a General Law on Climate Change. The law created a Commission on Climate Change which oversees set requirements for emissions reductions (a decrease in C02 emissions by 51 million tons in 2012, a 30 percent reduction in GHG emissions by 2030, a 50 percent reduction in GHG emissions by 2050, and 35 percent of electricity produced by renewable resources before 2024), reporting, and verification, provides the authority to establish an emissions market and create a national climate fund.
Mexico had 59.3 GW of installed electricity generation capac-ity in 2009. Preliminary Mexican government statistics indicate that electricity generation increased by at least 3.0 percent per year in 2010 and 2011. Conventional thermal plants pro-vide most of Mexico’s electricity capacity and generation, and industry accounts for 60 percent of power sales.
The state-owned Comisión Federal de Electricidad (CFE) is the dominant player in the generation sector, controlling over three-fourths of installed generating capacity. CFE has a mo-nopoly on electricity transmission and distribution. In 2009, CFE absorbed the operations of Luz y Fuerza del Centro, a state-owned company that managed electricity distribution in Mexico City. The Comisión Reguladora de Energía (CRE) has principal regulatory oversight of the electricity sector.
The Public Electricity Service Act of 1975 established exclusive Federal responsibility over the electricity industry through CFE, but amendments to Mexican law in 1992 partially opened electricity generation to the private sector. Private participation in electricity generation is now permitted in certain catego-ries, including for construction, and self-supply, cogeneration, Independent Power Producer (IPP), small production (under 30 MW), and import/export. Companies seeking to establish private electricity generating capacity or begin importing and/or exporting electric power must obtain a permit from CRE.
CURRENT STATUS OF WHRThere are no waste heat recovery power generation systems installed in Mexico and no evidence of active marketing by the major players. Cemex has commissioned a 6 MW WHR system in its Solid plant in the Philippines using Sinoma En-ergy Conservation, a major Chinese supplier. In November of 2011 Cemex was recognized by the Carbon Disclosure Project (CDP) as the leader in data disclosure for the Latin American region. The potential for WHR in Mexico ranges from 170 to 300 MW based on estimated clinker capacity at plants with capacity greater than 1 Mta.
Energy Prices for Industry
Mexico 2005 2006 2007 2008 2009 2010 2011
Electricity, US$/MWh 87.8 99.0 102.1 126.0 85.6 104.2 117.1
Steam Coal*, US$/GJ 2.01 2.08 2.26 2.57 2.51 2.69 2.76
Natural gas, US$/GJ 8.53 8.19 8.28 10.33 - - -
*Sub-bituminous steam coal prices for electricity generationSource: U.S. DOE Energy Information Administration 2103b; “Energy Prices and Taxes” IEA 2012

Waste Heat Recovery for the Cement Sector 46
NIGERIADemographics
Area: 923,768 km2
Population: 170.1 MUrbanization: 51 percentPer Capita Cement Use: 109 kg
Cement Industry (2012)
Number of Plants: 10Cement Production Capacity: 21.3 MtaClinker Production Capacity: 18.1 Mta*Average Cement Price: US$190 / ton2012 Consumption: 18.0 Mt2012 Production: 16.5 Mt
* Based on an assumed overall cement / clinker production factor of 0.85
CURRENT STATUS OF CEMENT INDUSTRYCement consumption in Nigeria grew by 21.6 percent from 14.8 Mta in 2009 to 18.0 Mta in 2012. Considerable unfilled demand exists due to extremely high cement prices, lack of funding for construction, and until 2013, an overall shortage of cement. Nigeria suffers from extreme income inequality—most people are poor despite massive oil revenues. In addi-tion, local states lack ready access to sufficient tax revenues to undertake much-needed infrastructure development. Per capita cement consumption in Nigeria at 109 kg is below that of neighboring West African countries that have oil no revenues (ICR 2013, CW Research 2014).
Nigeria has abundant and widespread limestone deposits; the government took steps to protect the industry from imports, creating a major increase in cement production capacity from 8.0 Mta in 2009 to 16.5 Mta in 2012 (CW Research). Planned expansion and announced new plants could increase stated nominal capacity to over 30 Mta in 2015 (ICR 2103).
The dominant domestic producer is Dangote Cement (part of the wider Dangote Group), which has changed the Nigerian ce-ment landscape beyond recognition. Encouraged by the Nigerian government and assisted by privatization of the cement sector, Dangote has two large cement plants in Nigeria that give it an unrivalled position in West Africa. It has 10.25 Mta of capacity at
Obajana, 6 Mta at Ibese, and 3 Mta at Gboko, a total of almost 20 Mta or about 70 percent of total Nigerian capacity. Dangote has another 3 Mta line at Obajana, due to take its capacity to 13 Mta by end-2014. The Ibese plant is to double in size, from 6 Mta to 12 Mta over the same timeframe, and a 1 Mta extension to the Gboko facility is ongoing (Edwards 2012d).
WAPCO Lafarge (Lafarge has a 60 percent share) operates two plants at Ewekoro (a total of 4 Mta) and one at Sagamu (0.6 Mta). Ashaka Cement (59 percent interest from Lafarge) is at 0.85 Mta, but is increasing to 1.2 Mta with kiln improvements. United Cement of Nigeria (Unicem) is operated by Holcim and Lafarge and has a capacity of 2.5 Mta at its plant in the east of the country. It is now undergoing expansion to 5 Mta. The Cement Company of Northern Nigeria (CCNN) has a plant at Sokoto in the far north of the country, near the border with Niger. A new entrant, Edo Cement, has a 3 Mta plant under construction in Edo State in the central south of the country (Edwards 2012d).
Effective capacity can be significantly lower than stated nomi-nal capacity due to fuel and power issues in Nigeria. Many plants operate on high-priced low-pour fuel oil (LPFO) or less costly natural gas (Ashaka cement owns coal mines and uses that for the clinker fuel), and both fuels have been unreli-able due to lack of capacity and intermittent production from refineries. Electricity supply is also unreliable and most plants have on-site generating capacity sufficient for full production. Much of recent new capacity has had start-up issues.
Despite the capacity increase in 2012, cement prices have not fallen as predicted because capacity has been slow to become effective, and prices remain high for most of the country due to transportation costs and difficulties. Transport costs average 30 percent of total delivered cost due to lack of infrastructure.
Cement Outlook, Mta
Nigeria 2010A 2011A 2012A 2013F 2014F
Consumption 15.9 17.8 18.8 21.2 23.3
% Change +7.4 +11.9 +5.6 +12.8 +9.9
Production 10.1 11.9 16.5 20.0 22.3
Net Trade Exports/ (Imports)
(5.8) (5.9) (2.3) (1.2) (1.0)
Source: CW Research GCVFR 2014; IFC
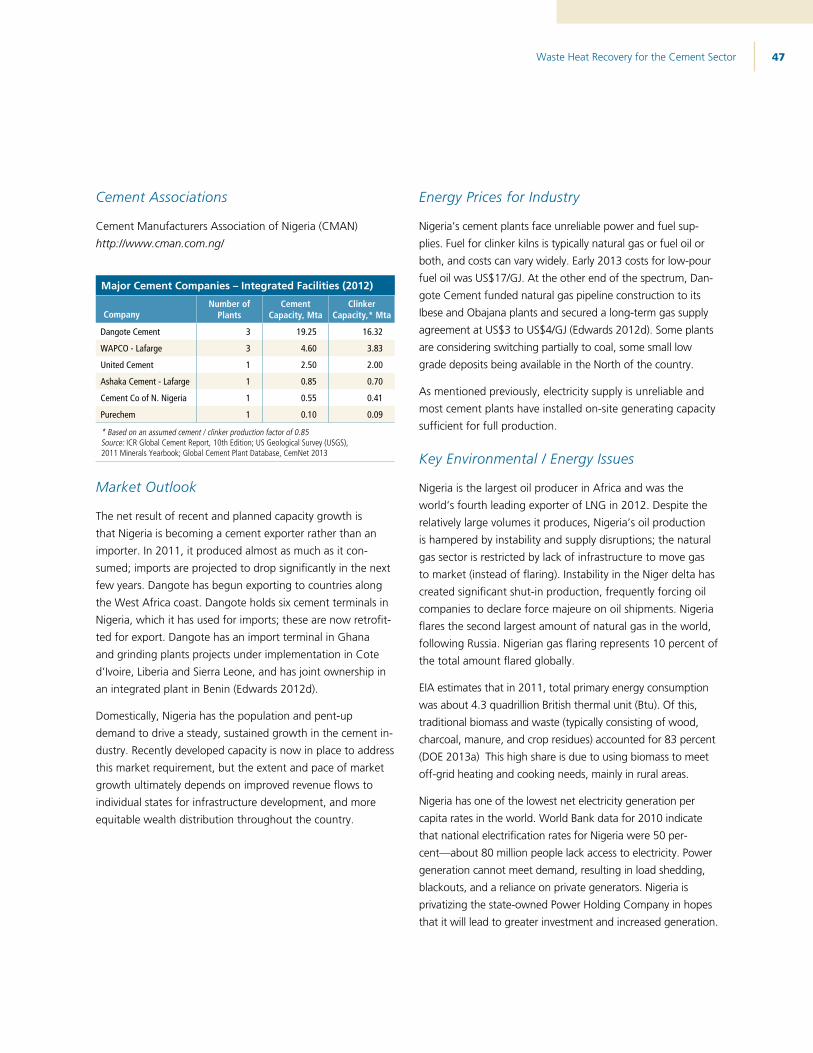
Waste Heat Recovery for the Cement Sector 47
Cement Associations
Cement Manufacturers Association of Nigeria (CMAN) http://www.cman.com.ng/
Major Cement Companies – Integrated Facilities (2012)
CompanyNumber of
PlantsCement
Capacity, MtaClinker
Capacity,* Mta
Dangote Cement 3 19.25 16.32
WAPCO - Lafarge 3 4.60 3.83
United Cement 1 2.50 2.00
Ashaka Cement - Lafarge 1 0.85 0.70
Cement Co of N. Nigeria 1 0.55 0.41
Purechem 1 0.10 0.09
* Based on an assumed cement / clinker production factor of 0.85Source: ICR Global Cement Report, 10th Edition; US Geological Survey (USGS), 2011 Minerals Yearbook; Global Cement Plant Database, CemNet 2013
Market Outlook
The net result of recent and planned capacity growth is that Nigeria is becoming a cement exporter rather than an importer. In 2011, it produced almost as much as it con-sumed; imports are projected to drop significantly in the next few years. Dangote has begun exporting to countries along the West Africa coast. Dangote holds six cement terminals in Nigeria, which it has used for imports; these are now retrofit-ted for export. Dangote has an import terminal in Ghana and grinding plants projects under implementation in Cote d’Ivoire, Liberia and Sierra Leone, and has joint ownership in an integrated plant in Benin (Edwards 2012d).
Domestically, Nigeria has the population and pent-up demand to drive a steady, sustained growth in the cement in-dustry. Recently developed capacity is now in place to address this market requirement, but the extent and pace of market growth ultimately depends on improved revenue flows to individual states for infrastructure development, and more equitable wealth distribution throughout the country.
Energy Prices for Industry
Nigeria’s cement plants face unreliable power and fuel sup-plies. Fuel for clinker kilns is typically natural gas or fuel oil or both, and costs can vary widely. Early 2013 costs for low-pour fuel oil was US$17/GJ. At the other end of the spectrum, Dan-gote Cement funded natural gas pipeline construction to its Ibese and Obajana plants and secured a long-term gas supply agreement at US$3 to US$4/GJ (Edwards 2012d). Some plants are considering switching partially to coal, some small low grade deposits being available in the North of the country.
As mentioned previously, electricity supply is unreliable and most cement plants have installed on-site generating capacity sufficient for full production.
Key Environmental / Energy Issues
Nigeria is the largest oil producer in Africa and was the world’s fourth leading exporter of LNG in 2012. Despite the relatively large volumes it produces, Nigeria’s oil production is hampered by instability and supply disruptions; the natural gas sector is restricted by lack of infrastructure to move gas to market (instead of flaring). Instability in the Niger delta has created significant shut-in production, frequently forcing oil companies to declare force majeure on oil shipments. Nigeria flares the second largest amount of natural gas in the world, following Russia. Nigerian gas flaring represents 10 percent of the total amount flared globally.
EIA estimates that in 2011, total primary energy consumption was about 4.3 quadrillion British thermal unit (Btu). Of this, traditional biomass and waste (typically consisting of wood, charcoal, manure, and crop residues) accounted for 83 percent (DOE 2013a) This high share is due to using biomass to meet off-grid heating and cooking needs, mainly in rural areas.
Nigeria has one of the lowest net electricity generation per capita rates in the world. World Bank data for 2010 indicate that national electrification rates for Nigeria were 50 per-cent—about 80 million people lack access to electricity. Power generation cannot meet demand, resulting in load shedding, blackouts, and a reliance on private generators. Nigeria is privatizing the state-owned Power Holding Company in hopes that it will lead to greater investment and increased generation.
Waste Heat Recovery for the Cement Sector 48
According to Nigeria’s August 2013 Roadmap for Power Sector Reform, Nigeria’s generation capacity was around 6,000 Mega-watts (MW) in 2012, of which 4,730 MW (79 percent) was from fossil fuel sources and 1,270 MW (21 percent) was from hydro sources. Generation capacity is projected to have increased to 6,579 MW by the end of 2013, according to the August 2013 Roadmap. Net electricity generation was almost 26 billion kWh in 2011, according to EIA’s latest estimates (DOE 2013a).
The chronic electricity shortages are attributed to lack of invest-ment in new power infrastructure and gas supply infrastructure to capture the natural gas that is being flared. According to a World Bank report, Nigeria experienced power outages on average for 46 days per year from 2007-2008, and outages lasted almost six hours on average. Population growth and un-derinvestment in the electricity sector has increased power de-mand without any significant increases in capacity. Inadequate maintenance, insufficient fuel, and an inadequate transmission network also contribute to electricity sector problems.
CURRENT STATUS OF WHRThere are no waste heat recovery power generation systems installed in Nigeria and no evidence of active marketing by the major players. Based on estimated clinker capacity for major cement companies and eliminating known plants with capacity less than 1 Mta, the potential for WHR in Nigeria ranges from 70 to 130 MW. This number could be lower as raw materials are very wet in the cement plants near the coast.

Waste Heat Recovery for the Cement Sector 49
PAKISTANDemographics
Area: 796.095 km2
Population: 190.3 MUrbanization: 36 percentPer Capita Cement Use: 145 kg
Cement Industry (2012)
Number of Plants: 24Cement Production Capacity: 44.8 MtaClinker Production Capacity: 39.0 Mta*Average Cement Price: US$70 / ton2012 Consumption: 25.9 Mt2012 Production: 34.2 Mt
*Based on an assumed cement / clinker production factor of 0.87
CURRENT STATUS OF CEMENT INDUSTRYPakistan has been experiencing slow yet steady GDP growth since 2010, yet economists caution that comprehensive eco-nomic reforms will need to be implemented in the very near future to sustain this growth. Semi-industrialized Pakistan’s key economic sectors are textiles, chemicals, agriculture and food processing. The budget deficit forecast for 2012-2013 was an alarming 8.8 percent of GDP and inflation is a concern (IMF). The status of the energy sector is also problematic be-cause energy production and distribution are insufficient and supported by costly government subsidies. The entire PKR185 billion allocation for power subsidies during 2012-2013 fiscal period was used in six months, and an IMF bailout package to help address the energy crisis was discussed (IMF).
A housing backlog and a growing population have been a boon for the construction industry. Although recent govern-ment spending on development and infrastructure has waned under fiscal constraints, the per capita expenditure on cement is very low, signaling long-term growth potential. Pakistan is rapidly urbanizing and urban demand for cement is predicted to rise as new residences are built. Reconstruction in the wake of the 2011 floods also continues to provide demand for cement, although many projects are stalled due to lack
of funding. Larger Pakistani cement manufacturers continue to expand exports into growing regional markets, specifically Iraq, Afghanistan, and the UAE.
Energy distribution and prices are unpredictable so cement manufacturers are focusing on energy efficiency, and the use of alternative fuels is growing. Also, waste heat recov-ery power generation is significant at some of Pakistan’s largest plants.
Although Pakistan’s cement industry contains over 20 produc-ers, it is dominated by four major players—Lucky Cement, Best Way Cement, D.G. Khan and Maple Leaf—which hold nearly half of national cement production capacity. In 2009 the Competition Commission of Pakistan issued fines to 20 cement producers found guilty of acting as a cartel and coor-dinating rises in cement prices. Following the action, cement prices fell by 30 percent. But since then prices have steadily risen again and as recently as April 2013, the industry publicly denies the existence of a cartel.
In September 2013, reacting to a growing dispute over en-ergy prices for cement producers in Pakistan, Lucky Cement reportedly resigned from the All Pakistan Cement Manu-facturers Association. The government increased electricity taxes for industrial consumers by 55 percent but increased gas prices only by 17.5 percent, creating an uneven rise production costs between smaller cement producers who access the national electricity grid and larger cement pro-ducers using captive power plants. Smaller cement produc-ers now find it much more expensive to make cement than their larger competitors.
Cement Outlook, Mta
Pakistan 2010A 2011A 2012A 2013F 2014F
Consumption 22.8 22.8 25.9 25.3 25.8
% Change +3.2 +0.0 +23.6 -2.3 +2.0
Production 32.3 31.9 34.2 33.6 34.3
Net Trade Exports/ (Imports)
9.6 9.1 8.3 8.3 7.8
Source: CW Research GCVFR 2014
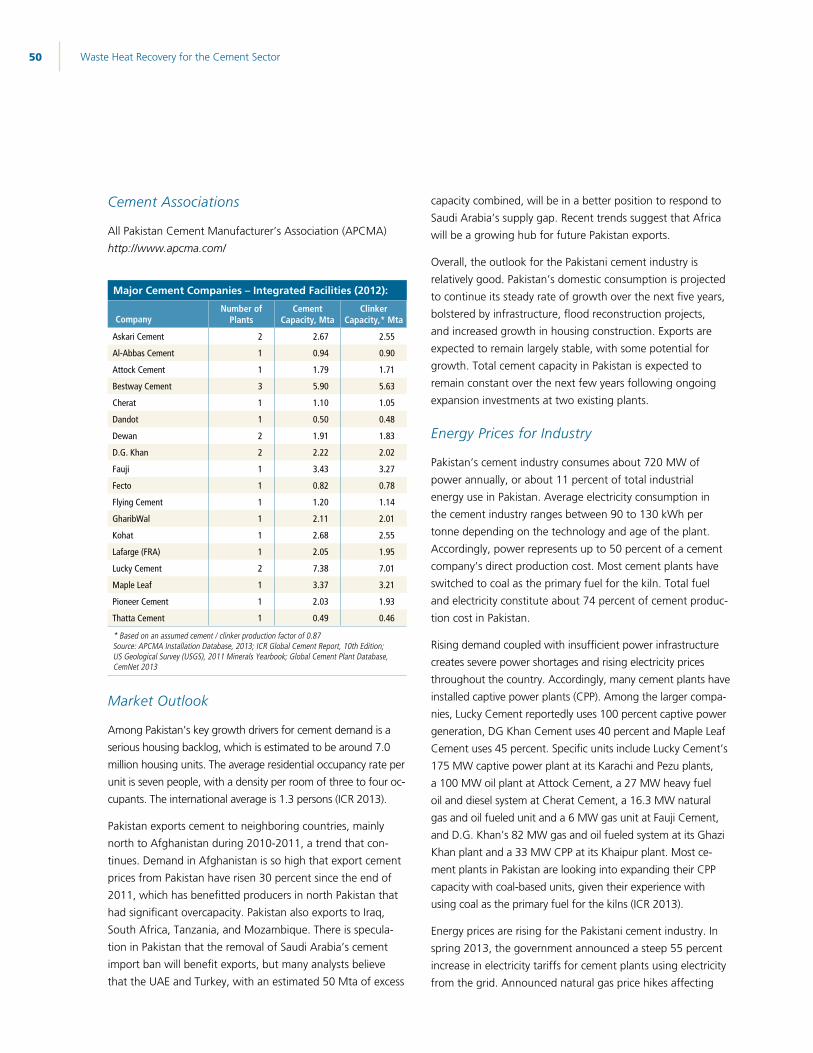
Waste Heat Recovery for the Cement Sector 50
Cement Associations
All Pakistan Cement Manufacturer’s Association (APCMA) http://www.apcma.com/
Major Cement Companies – Integrated Facilities (2012):
CompanyNumber of
PlantsCement
Capacity, MtaClinker
Capacity,* Mta
Askari Cement 2 2.67 2.55
Al-Abbas Cement 1 0.94 0.90
Attock Cement 1 1.79 1.71
Bestway Cement 3 5.90 5.63
Cherat 1 1.10 1.05
Dandot 1 0.50 0.48
Dewan 2 1.91 1.83
D.G. Khan 2 2.22 2.02
Fauji 1 3.43 3.27
Fecto 1 0.82 0.78
Flying Cement 1 1.20 1.14
GharibWal 1 2.11 2.01
Kohat 1 2.68 2.55
Lafarge (FRA) 1 2.05 1.95
Lucky Cement 2 7.38 7.01
Maple Leaf 1 3.37 3.21
Pioneer Cement 1 2.03 1.93
Thatta Cement 1 0.49 0.46
* Based on an assumed cement / clinker production factor of 0.87Source: APCMA Installation Database, 2013; ICR Global Cement Report, 10th Edition; US Geological Survey (USGS), 2011 Minerals Yearbook; Global Cement Plant Database, CemNet 2013
Market Outlook
Among Pakistan’s key growth drivers for cement demand is a serious housing backlog, which is estimated to be around 7.0 million housing units. The average residential occupancy rate per unit is seven people, with a density per room of three to four oc-cupants. The international average is 1.3 persons (ICR 2013).
Pakistan exports cement to neighboring countries, mainly north to Afghanistan during 2010-2011, a trend that con-tinues. Demand in Afghanistan is so high that export cement prices from Pakistan have risen 30 percent since the end of 2011, which has benefitted producers in north Pakistan that had significant overcapacity. Pakistan also exports to Iraq, South Africa, Tanzania, and Mozambique. There is specula-tion in Pakistan that the removal of Saudi Arabia’s cement import ban will benefit exports, but many analysts believe that the UAE and Turkey, with an estimated 50 Mta of excess
capacity combined, will be in a better position to respond to Saudi Arabia’s supply gap. Recent trends suggest that Africa will be a growing hub for future Pakistan exports.
Overall, the outlook for the Pakistani cement industry is relatively good. Pakistan’s domestic consumption is projected to continue its steady rate of growth over the next five years, bolstered by infrastructure, flood reconstruction projects, and increased growth in housing construction. Exports are expected to remain largely stable, with some potential for growth. Total cement capacity in Pakistan is expected to remain constant over the next few years following ongoing expansion investments at two existing plants.
Energy Prices for Industry
Pakistan’s cement industry consumes about 720 MW of power annually, or about 11 percent of total industrial energy use in Pakistan. Average electricity consumption in the cement industry ranges between 90 to 130 kWh per tonne depending on the technology and age of the plant. Accordingly, power represents up to 50 percent of a cement company’s direct production cost. Most cement plants have switched to coal as the primary fuel for the kiln. Total fuel and electricity constitute about 74 percent of cement produc-tion cost in Pakistan.
Rising demand coupled with insufficient power infrastructure creates severe power shortages and rising electricity prices throughout the country. Accordingly, many cement plants have installed captive power plants (CPP). Among the larger compa-nies, Lucky Cement reportedly uses 100 percent captive power generation, DG Khan Cement uses 40 percent and Maple Leaf Cement uses 45 percent. Specific units include Lucky Cement’s 175 MW captive power plant at its Karachi and Pezu plants, a 100 MW oil plant at Attock Cement, a 27 MW heavy fuel oil and diesel system at Cherat Cement, a 16.3 MW natural gas and oil fueled unit and a 6 MW gas unit at Fauji Cement, and D.G. Khan’s 82 MW gas and oil fueled system at its Ghazi Khan plant and a 33 MW CPP at its Khaipur plant. Most ce-ment plants in Pakistan are looking into expanding their CPP capacity with coal-based units, given their experience with using coal as the primary fuel for the kilns (ICR 2013).
Energy prices are rising for the Pakistani cement industry. In spring 2013, the government announced a steep 55 percent increase in electricity tariffs for cement plants using electricity from the grid. Announced natural gas price hikes affecting
Waste Heat Recovery for the Cement Sector 51
captive power plants were much lower at just 17.5 percent, advantaging those cement plants with capacity to produce their own power using gas (World Cement 2013, Express Tri-bune 2013a, b). Under an agreement with the International Monetary Fund, the federal government announced it will gradually phase out power sector subsidies. To achieve this target, a four-phase plan was introduced in October 2013 to reduce subsidies from about 1.8 percent of GDP to 0.3-0.4 percent of GDP within the next three years. The government announced the first of a number of broad prices increases in August 2013 that increased industrial and commercial rates by up to 115 percent and put the price of electricity for indus-trial users in the Rs 14 to Rs 18/kWh range (130 to 170 US$/kWh) (Express Tribune 2013b, The Nation 2013).
Key Environmental / Energy Issues
In 1997, Pakistan signed the Pakistan Environmental Protection Act creating the Pakistan Environmental Protection Agency, or Pak-EPA, to oversee environmental protection and regulation. In 2010 the Pakistan National Energy Policy was drafted in response to growing concerns about a possible power crisis. Electricity consumption has increased from 47 billion kWh in 2000 to 74 billion kWh in 2010. Rising demand coupled with insufficient power infrastructure has created severe power shortages throughout the country—a key political and economic issue. The electric industry faces power generation theft, low collection rates, line losses, and the poor financial position of generating companies, issues that have led to load-shedding and the temporary shutdown of electric lines when demand exceeded supply. According to reports in the Wall Street Journal, the power situation costs the economy an estimated US$13 billion per year. Required measures in the legislation were largely focused around power consumption in the commercial and municipal sectors.
Because the agricultural sector is a main economic driver, and the sector most affected by climate change, Pakistan exhibits a strong commitment to including carbon mitigation in the developmental plans of the country.
CURRENT STATUS OF WHRNine of the 24 existing cement plants in Pakistan have installed or are installing waste heat recovery systems representing 100 MW of capacity. Two major players are active, both Chinese suppliers, or Chinese joint ventures. All of the existing WHR systems were developed under the Clean Development Mechanism (CDM) program. Sinoma Energy Conservation was first to enter the market and has installed four systems since 2008. Anhui Conch Kawasaki Engineering, a joint venture between Anhui Conch Cement in China and a major Japanese WHR supplier, Kawasaki Plant Systems, has installed three units. Fecto Cement contracted with Hefei Cement Research and Design Institute, a subsidiary of the China National Building Materials Group Corporation (CNBM). Eight of nine systems are based on conventional steam technology; FLSmidth, which has an exclusive global license for the Kalina cycle in the cement and lime industries (excluding China), is installing an 8.5 MW Kalina unit on a 7,000 tpd clinker line at D.G. Khan Cement’s Khaipur plant. FLSmidth is the overall engineering, procurement and construction (EPC) provider to D.G. Khan Cement for the project. Wasabi Energy, the Kalina technol-ogy licensee, will provide front-end engineering, procurement and commissioning services for the Kalina system specifically.
In November 2012, The U.S. Trade and Development Agency so-licited companies for a feasibility study to assess the technical and economic viability of incorporating a 35 to 50 MW biomass power plant and a 5 to 7 MW waste heat recovery power generation unit to mitigate or reduce dependence on unreliable power for the Pioneer Cement plant located at Chenki in Punjab province.
The remaining potential for WHR in Pakistan ranges from 50 to 150 MW, based on estimated clinker capacity at plants with capacity greater than 1 Mta.

Waste Heat Recovery for the Cement Sector 52
Installed WHR Projects
PlantKiln Type/Capacity/
Number of LinesYear
StartedTechnology
ProviderWHR
CapacityTotal Installed
Cost
Power Generation MWh/y
CO2 Savings t/y Comments
1 Lucky Cement Dry / 9,000 tpd / 3 lines 2008 Sinoma EC 15 MW US$12.54
million 87,437 42,992 CDM; project IRR: 7.39% (pre CER); EPC contract
2 Karachi Plant Rotary/ 6,600 tpd/ 2 lines 2009 Sinoma EC 10 MW US$9.1
million 58,291 33,820 CDM; Project IRR 7.95% (pre CER); EPC contract
3 Lucky Cement Dry/3.6Mta / 2009Anhui Conch/
Kawasaki Engineering
15 MW US$12.6 million 108,000 48,060 CDM; pre-heater and air
coolers
4 Pezu Plant (Unit II) Rotary /1,600 tpd / 2 lines 2010
Anhui Conch/ Kawasaki
Engineering
16.5 MW
US$19.56 million 101,851 49,785
CDM; IRR: 11.47% (pre CER); annual savings
US$3.9 m
5 Attock Cement Hub Chowki Plant
4 x 64 M rotary/5,200 tpd/2
lines2011 Sinoma EC 12 MW US$18.6
million 58,320 37,908
CDM; IRR 9.1% (pre CER); Avg gross 8.7 MW, avg net
8.1 MW, annual savings US$3.6 m
6 Cherat Cement Rotary /3,200 tpd / 1 line 2011 Sinoma EC 7 MW US$9.3
million 41,730 25,761
CDM; 2 HRSGs (3.7 TPH each) on pre-heater end
and one HRSG (19.7 TPH) on AQC
7 D.G. Khan Cement Khaipur Plant
Rotax 2/6,700 tpd / 1 line 2012 FLSmidth/
Wasabi Energy 8.5 MW 61,301 28,542 CDM; Kalina cycle system
8D.G. Khan Cement Dera Ghazi Khan Plant
4/5 stage pre-heater /6,700tpd
/2 lines 2012
Anhui Conch/ Kawasaki
Engineering
10.4 MW
US$15 million 70,088 40,332
CDM; 2 HRSGs installed on each kiln, one at pre-heater
and one on cooler.
9 Fecto Cement Sangjani Plant
Dry/2,600tpd/1 line 2010 CNBM 6 MW US$7.2
million 38,400 19,584 CDM; Project IRR: 11.76%; EPC contract
Source: UNFCCC CDM; industry sources
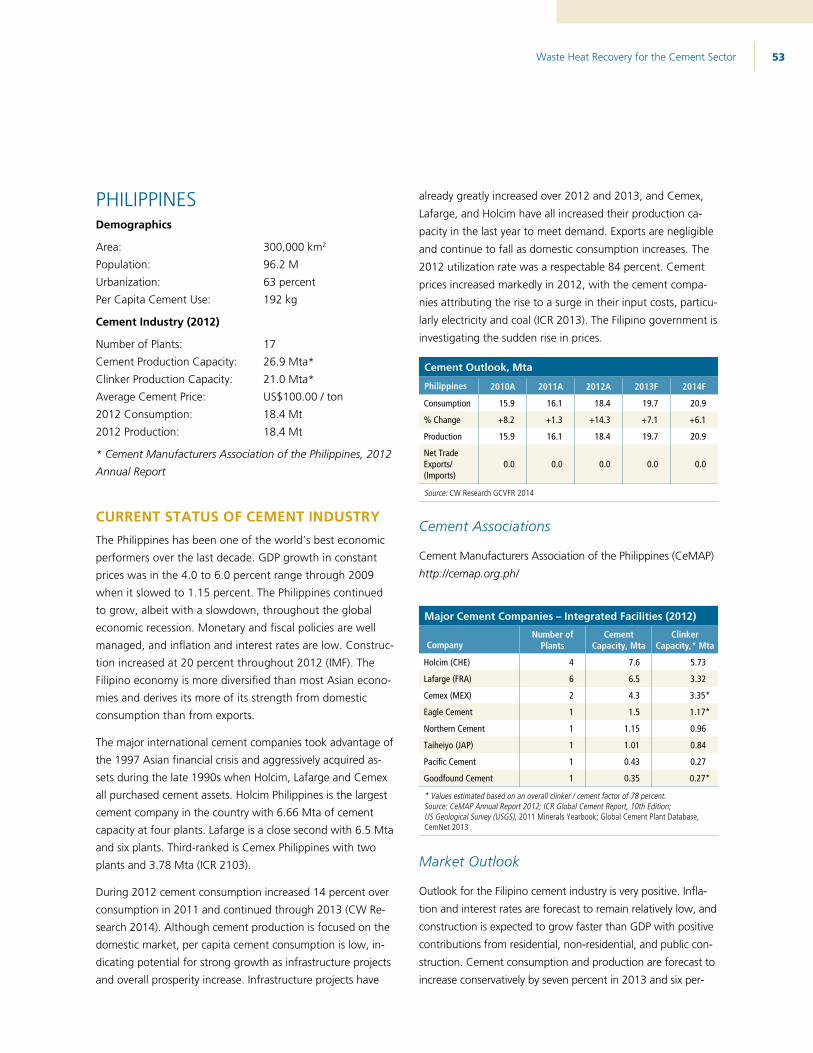
Waste Heat Recovery for the Cement Sector 53
PHILIPPINESDemographics
Area: 300,000 km2
Population: 96.2 M
Urbanization: 63 percent
Per Capita Cement Use: 192 kg
Cement Industry (2012)
Number of Plants: 17
Cement Production Capacity: 26.9 Mta*
Clinker Production Capacity: 21.0 Mta*
Average Cement Price: US$100.00 / ton
2012 Consumption: 18.4 Mt
2012 Production: 18.4 Mt
* Cement Manufacturers Association of the Philippines, 2012
Annual Report
CURRENT STATUS OF CEMENT INDUSTRYThe Philippines has been one of the world’s best economic
performers over the last decade. GDP growth in constant
prices was in the 4.0 to 6.0 percent range through 2009
when it slowed to 1.15 percent. The Philippines continued
to grow, albeit with a slowdown, throughout the global
economic recession. Monetary and fiscal policies are well
managed, and inflation and interest rates are low. Construc-
tion increased at 20 percent throughout 2012 (IMF). The
Filipino economy is more diversified than most Asian econo-
mies and derives its more of its strength from domestic
consumption than from exports.
The major international cement companies took advantage of
the 1997 Asian financial crisis and aggressively acquired as-
sets during the late 1990s when Holcim, Lafarge and Cemex
all purchased cement assets. Holcim Philippines is the largest
cement company in the country with 6.66 Mta of cement
capacity at four plants. Lafarge is a close second with 6.5 Mta
and six plants. Third-ranked is Cemex Philippines with two
plants and 3.78 Mta (ICR 2103).
During 2012 cement consumption increased 14 percent over
consumption in 2011 and continued through 2013 (CW Re-
search 2014). Although cement production is focused on the
domestic market, per capita cement consumption is low, in-
dicating potential for strong growth as infrastructure projects
and overall prosperity increase. Infrastructure projects have
already greatly increased over 2012 and 2013, and Cemex,
Lafarge, and Holcim have all increased their production ca-
pacity in the last year to meet demand. Exports are negligible
and continue to fall as domestic consumption increases. The
2012 utilization rate was a respectable 84 percent. Cement
prices increased markedly in 2012, with the cement compa-
nies attributing the rise to a surge in their input costs, particu-
larly electricity and coal (ICR 2013). The Filipino government is
investigating the sudden rise in prices.
Cement Outlook, Mta
Philippines 2010A 2011A 2012A 2013F 2014F
Consumption 15.9 16.1 18.4 19.7 20.9
% Change +8.2 +1.3 +14.3 +7.1 +6.1
Production 15.9 16.1 18.4 19.7 20.9
Net Trade Exports/ (Imports)
0.0 0.0 0.0 0.0 0.0
Source: CW Research GCVFR 2014
Cement Associations
Cement Manufacturers Association of the Philippines (CeMAP)
http://cemap.org.ph/
Major Cement Companies – Integrated Facilities (2012)
CompanyNumber of
PlantsCement
Capacity, MtaClinker
Capacity,* Mta
Holcim (CHE) 4 7.6 5.73
Lafarge (FRA) 6 6.5 3.32
Cemex (MEX) 2 4.3 3.35*
Eagle Cement 1 1.5 1.17*
Northern Cement 1 1.15 0.96
Taiheiyo (JAP) 1 1.01 0.84
Pacific Cement 1 0.43 0.27
Goodfound Cement 1 0.35 0.27*
* Values estimated based on an overall clinker / cement factor of 78 percent.Source: CeMAP Annual Report 2012; ICR Global Cement Report, 10th Edition; US Geological Survey (USGS), 2011 Minerals Yearbook; Global Cement Plant Database, CemNet 2013
Market Outlook
Outlook for the Filipino cement industry is very positive. Infla-
tion and interest rates are forecast to remain relatively low, and
construction is expected to grow faster than GDP with positive
contributions from residential, non-residential, and public con-
struction. Cement consumption and production are forecast to
increase conservatively by seven percent in 2013 and six per-
Waste Heat Recovery for the Cement Sector 54
cent in 2014. The only apparent risks faced by the Philippines are external. Barriers to entry in the Filipino cement industry are small as evidenced by the near immediate production increases of foreign companies. Therefore, if domestic markets slow and develop excess capacity in China or India, Philippine companies could become vulnerable to rising imports.
Energy Prices for Industry
The Philippine cement industry is affected by a growing en-ergy crisis driven by rising demand for power and inadequate power supplies and infrastructure. Power shortages, rolling blackouts and rising prices have become the norm. During 2013, power prices rose steeply and people demanded that the government provide a solution. Main grid generation prices from the National Power Grid in 2014 range from 2.97 Peso/kWh (65 US$/MWh) in Mindanao to 5.71 Peso/kWh (126 US$/MWh) in Luzon (National Power Corporation 2014). Transmission and distribution costs for large 34.5 kV indus-trial users (>10,000 kW) appear to be in the range of 0.8 to 0.9 Peso/kWh (17.6 to 19.8 US$/MWh) (MeralCo 2014). Total electricity prices for Philippine cement facilities could range from 83 to 145 US$/kWh.
Coal is the primary fuel used for clinker thermal needs. The country imports 50 percent of its coal supplies, creating additional uncertainty for the cement industry energy costs (DOE 2013).
Key Environmental / Energy Issues
The country is deeply affected by the impacts of climate change; risks are pervasive in the agricultural sector, fishing, water supply, food security, human health, forest and coastal ecosystems and resources, biodiversity, and infrastructure. The Climate Change Act of 2009 provides a comprehensive legal foundation through which to address climate change, and supports several pre-existing laws and programs. The country has aggressively developed hydropower and geo-thermal power resources and is continuing to promote the development of biomass and other renewable resources.
The Philippines is a net importer of energy despite low consumption levels relative to its South Asian neighbors. The country produces small volumes of oil, natural gas and coal.
Electricity generation capacity is 16.2 GW; geothermal rep-resents about 15 percent; hydropower, 14 percent; and the remainder comprises primarily coal and natural gas thermal plants. In 2012, the Philippines consumed over 17 million tonnes of coal, half of which was produced domestically and half was imported
The Philippines is in the midst of a growing energy crisis driven by power shortages, rolling blackouts and rising prices. The country has around 30 million more people than Thailand, but has less generating capacity. In terms of geothermal-power capacity, the Philippines is second only to the U.S., but transmission and distribution failures, the lack of domestic energy production and a challenging geography have meant a perennial power problem. The dependence on imported fuel exacerbates the situation. Although many of its neighboring countries provide fuel subsidies, the Philippines does not, which means that electricity tariffs are set by the market and are now among the highest in the region. Include aging power plants and debt-ridden cooperatives into the mix and the near-term outlook is concerning.
The Electric Power Industry Reform Act (EPIRA) of 2001 was meant to provide relief and stabilize the Philippines power sector but its effect has been negligible. The law mandated privatizing state-owned power enterprises to ensure access to affordable electricity and allow “a regime of free and fair competition,” among other things. However, an inadequate legal framework—including weak competition laws—and an ineffective regulatory body has hindered effectiveness.
The current urgency stems from the country’s high rates of growth (the Philippines’ GDP growth rate of 7.8 percent for the first quarter of 2013 was the highest in Asia), which has driven up energy demand. The situation is expected to improve in 2015 when a series of larger power plants come online. The country initiated short-term restorative measures, which were targeted to address supply shortages for the next few months—in July 2013, for instance, US$100 million was earmarked to subsidize modular electric generator sets for regional cooperatives. And despite its pro-market stance, the government may amend EPIRA to allow it to intervene in the sector as need arises (DOE 2013a).
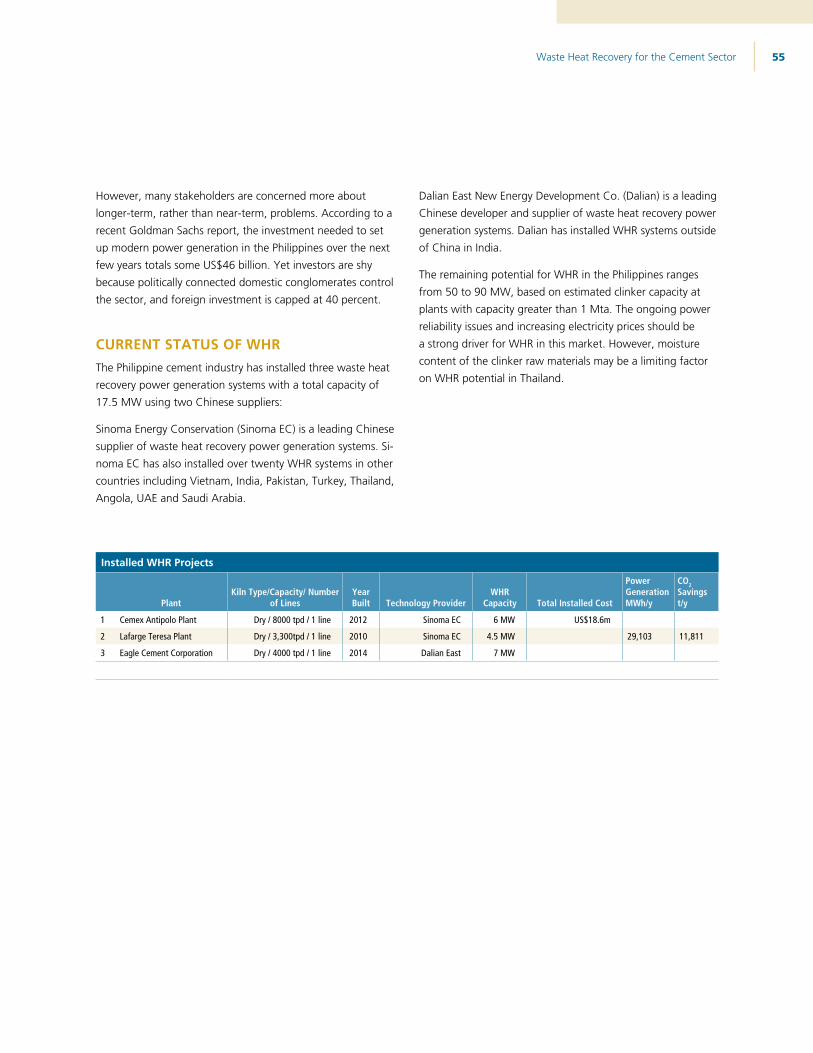
Waste Heat Recovery for the Cement Sector 55
However, many stakeholders are concerned more about longer-term, rather than near-term, problems. According to a recent Goldman Sachs report, the investment needed to set up modern power generation in the Philippines over the next few years totals some US$46 billion. Yet investors are shy because politically connected domestic conglomerates control the sector, and foreign investment is capped at 40 percent.
CURRENT STATUS OF WHRThe Philippine cement industry has installed three waste heat recovery power generation systems with a total capacity of 17.5 MW using two Chinese suppliers:
Sinoma Energy Conservation (Sinoma EC) is a leading Chinese supplier of waste heat recovery power generation systems. Si-noma EC has also installed over twenty WHR systems in other countries including Vietnam, India, Pakistan, Turkey, Thailand, Angola, UAE and Saudi Arabia.
Dalian East New Energy Development Co. (Dalian) is a leading Chinese developer and supplier of waste heat recovery power generation systems. Dalian has installed WHR systems outside of China in India.
The remaining potential for WHR in the Philippines ranges from 50 to 90 MW, based on estimated clinker capacity at plants with capacity greater than 1 Mta. The ongoing power reliability issues and increasing electricity prices should be a strong driver for WHR in this market. However, moisture content of the clinker raw materials may be a limiting factor on WHR potential in Thailand.
Installed WHR Projects
PlantKiln Type/Capacity/ Number
of LinesYear Built Technology Provider
WHR Capacity Total Installed Cost
Power Generation MWh/y
CO2 Savings t/y
1 Cemex Antipolo Plant Dry / 8000 tpd / 1 line 2012 Sinoma EC 6 MW US$18.6m
2 Lafarge Teresa Plant Dry / 3,300tpd / 1 line 2010 Sinoma EC 4.5 MW 29,103 11,811
3 Eagle Cement Corporation Dry / 4000 tpd / 1 line 2014 Dalian East 7 MW

Waste Heat Recovery for the Cement Sector 56
SOUTH AFRICADemographics
Area: 1,219,090 km2
Population: 51.1 M
Urbanization: 62 percent
Per Capita Cement Use: 222 kg
Cement Industry (2012)
Number of Plants: 15
Cement Production Capacity: 17.7 Mta
Clinker Production Capacity: 16.0 Mta*
Average Cement Price: US$120.00 / ton
2012 Consumption: 11.6 Mt
2012 Production: 10.9 Mt
* Based on reported cement / clinker ratios in Global Cement
Database
CURRENT STATUS OF CEMENT INDUSTRYSouth Africa has experienced slow economic growth since
2009. Strikes and labor unrest have dampened foreign invest-
ment, and Europe—South Africa’s primary trading partner—is
also experiencing a period of economic stress, decreasing
demand. In October 2012, South Africa announced plans
to offset stagnant growth with US$462 billion worth of
infrastructure projects over the next 15 years, including ports,
roads, utility access and mining; US$100 billion is due to be
spent in the next three years.
Pretoria Portland Cement (PPC), the largest cement producer
in South Africa (49 percent market share) reported that its
gross profit rose by 9.0 percent to US$289 million in 2012.
Earnings before interest, tax, depreciation and amortization
(EBITDA) rose by 8.0 percent to US$249 million. However,
net profit decreased by 2.0 percent to US$96.1 million from
US$98.5 million. PPC attributed this to an increase in taxes
during the year (ICR 2013). Other South African cement
countries have experienced similar profit patterns.
Despite a stagnant domestic construction market and a slow-
ing economy, South Africa is still importing cement, primarily
cheaper cement from Nigeria and Pakistan. South African ce-
ment companies have tried repeatedly to ban imports of for-
eign cement, citing low quality. However in 2011, four major
South African cement producers were found to have been
participating in a cement cartel and were fined. Increasingly,
South African cement companies are focused on expanding
business beyond their borders, tapping into growing inland
markets largely unreachable by importers. PPC has set a goal
of achieving 40 percent of their revenue outside South Africa.
South Africa will be the site of increased competition as new
companies plan to build plants in the coming years to exploit the
growing demand for cement inland. Dangote (Nigeria), Wiphold
(Jidong, China) and ARM Cement (Kenya) are all exploring
the possibility of expansion into South Africa (ICR 2013). The
Dangote plant (Sephaku) will be commissioned in 2014, with
Wiphold now in the process of constructing its facility.
The growing demand for “green” products in the South
African market has spurred upgrades. PPC has been using
alternative fuels and has commissioned a 60 MW wind en-
ergy system on its Eastern Cape property that will sell power
exclusively to PPC. AfriSam has also established numerous
energy-saving systems in its plants, and was the first construc-
tion materials company to sign the 49 Million Pledge, a joint
government and industry initiative to establish energy savings
as a national culture.
Cement Outlook, Mta
South Africa 2010A 2011A 2012A 2013F 2014F
Consumption 10.9 11.2 11.6 12.3 12.7
% Change -7.6 +2.8 +3.6 +6.0 +3.3
Production 11.0 11.0 10.9 11.6 12.1
Net Trade Exports/ (Imports)
0.1 (0.3) (0.7) (0.7) (0.6)
Source: CW Research GCVFR 2014
Cement Associations
Association of Cementitious Materials Producers (ACMP)
http://www.acmp.co.za/
“The ACMP acts as an umbrella body for six South African
clinker and cementitious material producer companies, spe-
cifically guiding and representing these company’s interests
in the fields of environmental stewardship, health and safety
practices and community and stakeholder interaction”
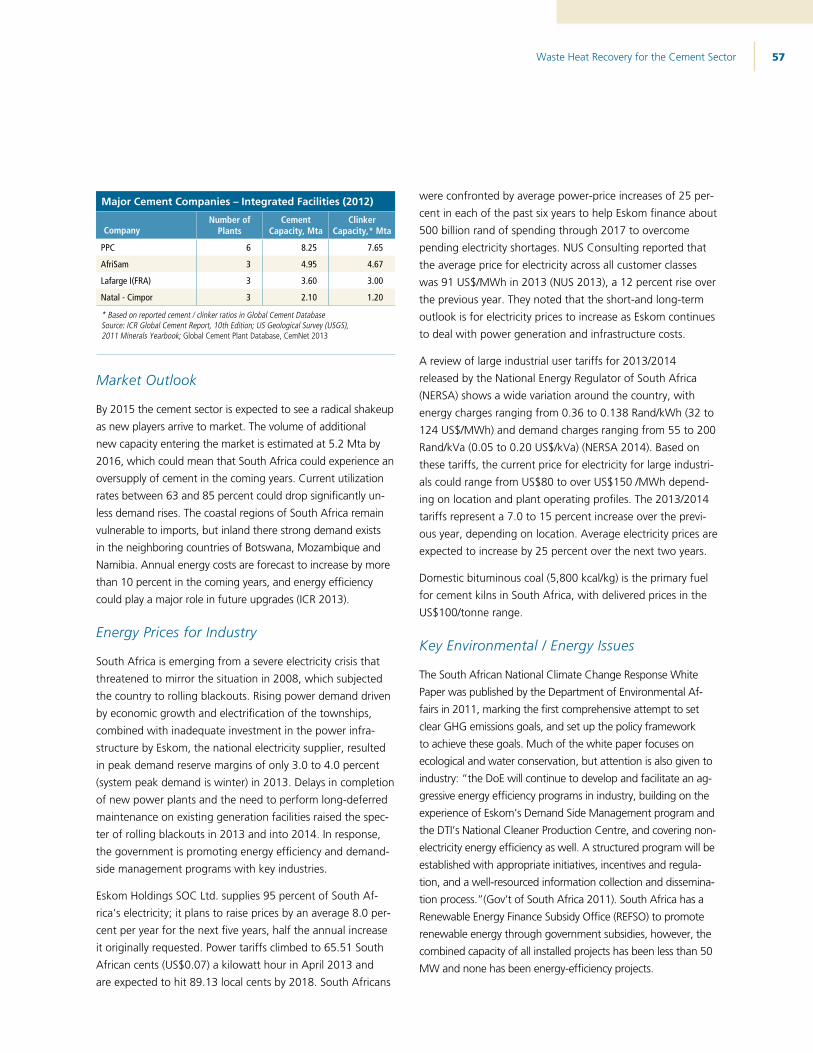
Waste Heat Recovery for the Cement Sector 57
Major Cement Companies – Integrated Facilities (2012)
CompanyNumber of
PlantsCement
Capacity, MtaClinker
Capacity,* Mta
PPC 6 8.25 7.65
AfriSam 3 4.95 4.67
Lafarge I(FRA) 3 3.60 3.00
Natal - Cimpor 3 2.10 1.20
* Based on reported cement / clinker ratios in Global Cement DatabaseSource: ICR Global Cement Report, 10th Edition; US Geological Survey (USGS), 2011 Minerals Yearbook; Global Cement Plant Database, CemNet 2013
Market Outlook
By 2015 the cement sector is expected to see a radical shakeup as new players arrive to market. The volume of additional new capacity entering the market is estimated at 5.2 Mta by 2016, which could mean that South Africa could experience an oversupply of cement in the coming years. Current utilization rates between 63 and 85 percent could drop significantly un-less demand rises. The coastal regions of South Africa remain vulnerable to imports, but inland there strong demand exists in the neighboring countries of Botswana, Mozambique and Namibia. Annual energy costs are forecast to increase by more than 10 percent in the coming years, and energy efficiency could play a major role in future upgrades (ICR 2013).
Energy Prices for Industry
South Africa is emerging from a severe electricity crisis that threatened to mirror the situation in 2008, which subjected the country to rolling blackouts. Rising power demand driven by economic growth and electrification of the townships, combined with inadequate investment in the power infra-structure by Eskom, the national electricity supplier, resulted in peak demand reserve margins of only 3.0 to 4.0 percent (system peak demand is winter) in 2013. Delays in completion of new power plants and the need to perform long-deferred maintenance on existing generation facilities raised the spec-ter of rolling blackouts in 2013 and into 2014. In response, the government is promoting energy efficiency and demand-side management programs with key industries.
Eskom Holdings SOC Ltd. supplies 95 percent of South Af-rica’s electricity; it plans to raise prices by an average 8.0 per-cent per year for the next five years, half the annual increase it originally requested. Power tariffs climbed to 65.51 South African cents (US$0.07) a kilowatt hour in April 2013 and are expected to hit 89.13 local cents by 2018. South Africans
were confronted by average power-price increases of 25 per-cent in each of the past six years to help Eskom finance about 500 billion rand of spending through 2017 to overcome pending electricity shortages. NUS Consulting reported that the average price for electricity across all customer classes was 91 US$/MWh in 2013 (NUS 2013), a 12 percent rise over the previous year. They noted that the short-and long-term outlook is for electricity prices to increase as Eskom continues to deal with power generation and infrastructure costs.
A review of large industrial user tariffs for 2013/2014 released by the National Energy Regulator of South Africa (NERSA) shows a wide variation around the country, with energy charges ranging from 0.36 to 0.138 Rand/kWh (32 to 124 US$/MWh) and demand charges ranging from 55 to 200 Rand/kVa (0.05 to 0.20 US$/kVa) (NERSA 2014). Based on these tariffs, the current price for electricity for large industri-als could range from US$80 to over US$150 /MWh depend-ing on location and plant operating profiles. The 2013/2014 tariffs represent a 7.0 to 15 percent increase over the previ-ous year, depending on location. Average electricity prices are expected to increase by 25 percent over the next two years.
Domestic bituminous coal (5,800 kcal/kg) is the primary fuel for cement kilns in South Africa, with delivered prices in the US$100/tonne range.
Key Environmental / Energy Issues
The South African National Climate Change Response White Paper was published by the Department of Environmental Af-fairs in 2011, marking the first comprehensive attempt to set clear GHG emissions goals, and set up the policy framework to achieve these goals. Much of the white paper focuses on ecological and water conservation, but attention is also given to industry: “the DoE will continue to develop and facilitate an ag-gressive energy efficiency programs in industry, building on the experience of Eskom’s Demand Side Management program and the DTI’s National Cleaner Production Centre, and covering non-electricity energy efficiency as well. A structured program will be established with appropriate initiatives, incentives and regula-tion, and a well-resourced information collection and dissemina-tion process.”(Gov’t of South Africa 2011). South Africa has a Renewable Energy Finance Subsidy Office (REFSO) to promote renewable energy through government subsidies, however, the combined capacity of all installed projects has been less than 50 MW and none has been energy-efficiency projects.

Waste Heat Recovery for the Cement Sector 58
South Africa has only small deposits of conventional oil and natural gas and uses its large coal deposits for most of its energy needs, particularly in the electricity sector. Most oil consumed in the country, mainly in the transportation sector, is imported from large producers in the Middle East and West Africa and is refined locally. South Africa has a highly devel-oped synthetic fuels industry, producing gasoline and diesel fuels from coal and natural gas. The synthetic fuels industry accounts for nearly all domestically produced petroleum.
In 2010, almost 70 percent of South Africa’s total energy supply came from coal, followed by oil (19 percent) and solid biomass and waste (10 percent) (DOE 2013a). South Africa’s energy balance also includes relatively small shares of natural gas, nuclear, and hydro-electricity. South Africa’s dependence on hydrocarbons, particularly coal, has led the country to become the leading carbon dioxide emitter in Africa and the 12th largest in the world (DOE 2013a). About 70 percent of domestic coal consumption (excluding exports) is used for electricity generation, while the remainder is used to sup-ply Sasol’s synthetic fuels plant (20 percent), metallurgical industries (3.0 percent), small merchants and residential areas (2.0 percent), and other industries (5.0 percent), including cement (DOE 2013a).
South Africa has numerous government agencies and com-panies involved in the coal, natural gas, and oil industry, but the National Energy Regulator of South Africa (NERSA) is the industry regulator and is responsible for implementing South Africa’s energy plan, which is centered on diversifying energy sources, securing energy supplies, and advancing new energy projects across sectors.
The electricity sector falls under NERSA regulation. Eskom, (the state electricity company) is responsible for electricity transmission and generates 95 percent of South Africa’s elec-tricity. NERSA regulates electricity prices and promotes private sector participation by encouraging independent power pro-ducers (IPPs) to invest; it also promotes off-grid technologies to meet rural energy needs.
EIA estimates show that South Africa’s total electricity con-sumption grew by 20 percent during 2000-2010; installed capacity grew at only 7.0 percent during the same time period (DOE 2013a). In late 2007 and early 2008, the country experi-enced a power crisis that resulted in blackouts and threatened the power supply to many businesses, including the mining industry as a result of high rates of economic growth, rising electricity demand, combined with a lack of new power plants. Nigeria’s 2010 electricity strategy plans to strengthen the elec-tricity distribution structure and fast-track projects by indepen-
dent power producers. Considerable investment has emerged in new power projects with targeted capacity additions of over 40,000 MW by 2030; these will include mostly coal, and some renewable and nuclear generating capacity. In the short term, the 1,430 MW Camden coal-fired power station was recently returned to service and two other coal-fired power stations (Grootvlei, 950 MW and Komati, 284 MW) were also re-com-missioned and will soon return to service, alleviating some of the most recent concerns about power adequacy.
To meet generation targets, and as a demand-side measure, electricity rates have been gradually increasing for all sectors, causing concern among the more energy-intensive industries as well as poorer households. South Africa has traditionally had low electricity costs; however, Eskom requested a 60 per-cent tariff increase in 2008 to help finance new projects and meet rising equipment costs. NERSA approved a total tariff increase of 27.5percent for 2008/2009 and then approved Eskom’s request to increase tariffs by 20-25 percent annually for the subsequent three years. However, the tariff increase was later revised down to 16 percent (EIA Country Update, 2013).
CURRENT STATUS OF WHRThere are currently no waste heat recovery power generation systems installed in South Africa, but there appears to be some activity by a limited number of WHR suppliers. As an example, in November 2013, the South African Wiphold Mamba Ce-ment project was announced. Jointly funded by China’s Jidong Development Group, and the China-Africa Development Fund with an investment of US$220 million, will be situated in Limpopo Province. The project includes a new cement clinker production line with an output of 1Mt/yr, and a waste heat recovery (WHR) system.
Rapidly rising energy costs, continuing concerns about power availability and a cultural emphasis on sustainability and ef-ficiency signal a promising environment for additional WHR development. In addition, in their desire to limit imports, South African cement domestic companies are pushing for policies that require specific efficiency standards that only they can meet, opening potential opportunities for waste heat recovery power generation if enacted.
Based on estimated clinker capacity at plants with capacity greater than 1 Mta, the potential for WHR at existing cement plants in South Africa ranges from 55 to 100 MW.
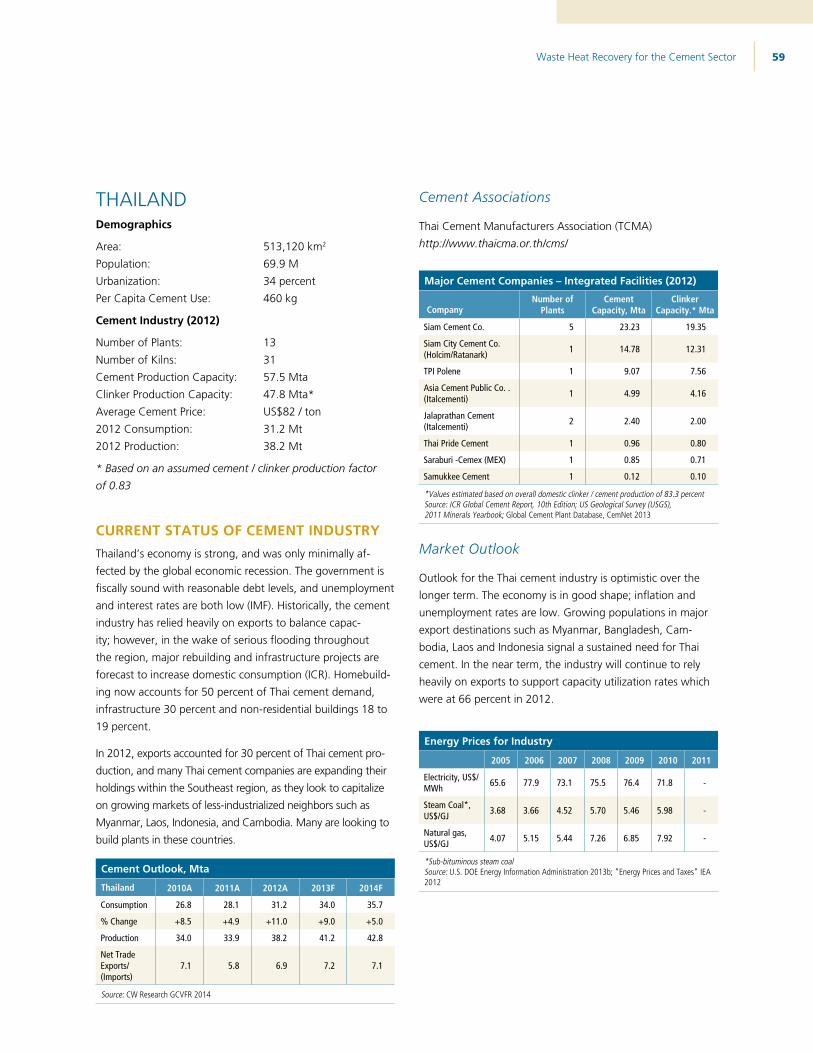
Waste Heat Recovery for the Cement Sector 59
THAILANDDemographics
Area: 513,120 km2
Population: 69.9 MUrbanization: 34 percentPer Capita Cement Use: 460 kg
Cement Industry (2012)
Number of Plants: 13Number of Kilns: 31 Cement Production Capacity: 57.5 MtaClinker Production Capacity: 47.8 Mta*Average Cement Price: US$82 / ton 2012 Consumption: 31.2 Mt2012 Production: 38.2 Mt
* Based on an assumed cement / clinker production factor of 0.83
CURRENT STATUS OF CEMENT INDUSTRYThailand’s economy is strong, and was only minimally af-fected by the global economic recession. The government is fiscally sound with reasonable debt levels, and unemployment and interest rates are both low (IMF). Historically, the cement industry has relied heavily on exports to balance capac-ity; however, in the wake of serious flooding throughout the region, major rebuilding and infrastructure projects are forecast to increase domestic consumption (ICR). Homebuild-ing now accounts for 50 percent of Thai cement demand, infrastructure 30 percent and non-residential buildings 18 to 19 percent.
In 2012, exports accounted for 30 percent of Thai cement pro-duction, and many Thai cement companies are expanding their holdings within the Southeast region, as they look to capitalize on growing markets of less-industrialized neighbors such as Myanmar, Laos, Indonesia, and Cambodia. Many are looking to build plants in these countries.
Cement Outlook, Mta
Thailand 2010A 2011A 2012A 2013F 2014F
Consumption 26.8 28.1 31.2 34.0 35.7
% Change +8.5 +4.9 +11.0 +9.0 +5.0
Production 34.0 33.9 38.2 41.2 42.8
Net Trade Exports/ (Imports)
7.1 5.8 6.9 7.2 7.1
Source: CW Research GCVFR 2014
Cement Associations
Thai Cement Manufacturers Association (TCMA) http://www.thaicma.or.th/cms/
Major Cement Companies – Integrated Facilities (2012)
CompanyNumber of
PlantsCement
Capacity, MtaClinker
Capacity.* Mta
Siam Cement Co. 5 23.23 19.35
Siam City Cement Co. (Holcim/Ratanark) 1 14.78 12.31
TPI Polene 1 9.07 7.56
Asia Cement Public Co. . (Italcementi) 1 4.99 4.16
Jalaprathan Cement (Italcementi) 2 2.40 2.00
Thai Pride Cement 1 0.96 0.80
Saraburi -Cemex (MEX) 1 0.85 0.71
Samukkee Cement 1 0.12 0.10
*Values estimated based on overall domestic clinker / cement production of 83.3 percentSource: ICR Global Cement Report, 10th Edition; US Geological Survey (USGS), 2011 Minerals Yearbook; Global Cement Plant Database, CemNet 2013
Market Outlook
Outlook for the Thai cement industry is optimistic over the longer term. The economy is in good shape; inflation and unemployment rates are low. Growing populations in major export destinations such as Myanmar, Bangladesh, Cam-bodia, Laos and Indonesia signal a sustained need for Thai cement. In the near term, the industry will continue to rely heavily on exports to support capacity utilization rates which were at 66 percent in 2012.
Energy Prices for Industry
2005 2006 2007 2008 2009 2010 2011
Electricity, US$/MWh 65.6 77.9 73.1 75.5 76.4 71.8 -
Steam Coal*, US$/GJ 3.68 3.66 4.52 5.70 5.46 5.98 -
Natural gas, US$/GJ 4.07 5.15 5.44 7.26 6.85 7.92 -
*Sub-bituminous steam coal Source: U.S. DOE Energy Information Administration 2013b; “Energy Prices and Taxes” IEA 2012
Waste Heat Recovery for the Cement Sector 60
Key Environmental / Energy Issues
Over 80 percent of Thailand’s total energy consumption is
from fossil fuels. Thailand is a net importer of oil and natural
gas, and a growing producer of natural gas. In 2010, oil
represented 39 percent of total energy consumption, down
from nearly half in 2000. As the economy expanded and
industrialized, Thailand consumed more oil for transportation
and industrial uses. Natural gas has replaced some oil de-
mand and is the next largest fuel, growing to nearly one-third
of total consumption. Solid biomass and waste are energy
sources in Thailand—roughly 16 percent of energy consump-
tion. Most biomass feedstock is from sugarcane, rice husk,
bagasse, wood waste, and oil palm residue and is used in the
residential and manufacturing sectors. Thailand has promoted
biomass for heat and electricity; growth has been gradual
due to industry inefficiencies and environmental concerns.
Thailand’s new Alternative Energy Development Plan calls
for renewable energy to increase its share to 25 percent of
total energy consumption by 2022 to reduce dependence
on fossil fuels. However, this is an ambitious target requiring
significant resource development and subsidies. As Thailand
continues to expand economically, it is expected to place
greater emphasis on energy supply security by diversifying its
fuel slate and promoting upstream development of hydrocar-
bons including alternatives to conventional fuels.
Over the past two decades, Thailand’s rapidly expanding
economy has spurred the need to build power generation
capacity to keep pace with rising electricity demand. So far,
Thailand’s installed capacity growth has exceeded its rate
of power consumption growth, which averaged about 5.0
percent a year over the past decade. Thailand now has one of
the highest electrification rates in Southeast Asia and delivers
electricity to nearly all of its population. Concern for electric-
ity supply security and grid reliability has prompted the Thai
government to create policies that promote planned capacity
expansion, diversification of fuel sources and increase of alter-
native fuel use, demand-side management, and management
of electricity import dependence. Thailand issues 20-year
power plans to map out the capacity additions and goals to
match the long-term power projections.
The Electricity Generating Authority of Thailand (EGAT),
the state-owned electricity generating company and sole
electricity transmission provider, accounts for nearly half of
the country’s power generation. Thailand awards licenses to
private companies to promote competition and attract more
investment in renewable energy generation and advanced
technology of fossil fuel plants. Independent power producers
(IPPs) make up over 35 percent of the generation mix, with
GDF Suez as one of the main investors. Other small Thai state
power producers or manufacturers that generate less than
300 megawatts account for the remaining portion. EGAT sells
and transmits wholesale electricity to Thailand’s two distribu-
tion authorities, the Metropolitan Electricity Authority and the
Provincial Electricity Authority.
Thailand’s net electricity generation increased from around
90 terawatt-hours (TWh) in 2000 to over 152 TWh in 2011.
The industrial sector is the primary consumer of electricity and
accounts for 46 percent of the market. Thailand projects that
electricity generation will double, reaching 346 TWh by 2030.
The anticipated growth is prompting the government to en-
sure electricity supply by expanding capacity and maintaining
reserve margins to be no less than 15 percent of the system
capacity. Conventional thermal fuels, particularly natural gas,
meet nearly all of Thailand’s power requirements. Natural
gas-fired generation consisted of 108 TWh or 71 percent of
the total electricity supply in 2011, followed by imported coal
and lignite as the second largest feedstock with a 21 percent
share. Thailand plans to reduce dependence on natural gas
for generation in favor of renewable sources and nuclear
power. However, the outlook for ramping up these sources
is uncertain. Following the Fukushima incident in 2011, Thai-
land’s first proposed nuclear facility has been delayed to at
least 2026 and was scaled back from an originally proposed
5 GW to 2 GW (DOE 2013a). Also, the existing infrastructure
and domestic resources make natural gas the most economi-
cal power source. As Thailand ramps up its LNG imports,
older gas-fired stations likely will be replaced by newer com-
bined cycle and cogeneration facilities.
Natural gas production and consumption were on par until
consumption began to outstrip production in 1999. Thailand
produced 1,306 billion cubic feet (Bcf) and consumed 1,645
Bcf of natural gas in 2011, resulting in net imports of nearly
340 Bcf. These imports came from offshore fields in Myan-
mar (formerly Burma) sent via pipeline. Both production and
consumption have doubled since 2000, and each grew more
than 15 percent between 2009 and 2010. Thailand produced
and consumed natural gas at a slower rate in 2011 following
disruptions from an offshore gas pipeline leak and massive
flooding that began in mid-2011. These disruptions affected
Waste Heat Recovery for the Cement Sector 61
primarily the power sector and manufacturing activities, and annual growth slowed to 2.0 percent for gas production and around 3.0 percent for consumption in 2011 (DOE 2013a). As production declines in older fields, Thailand may depend more heavily on imports if no significant discoveries are made over the next decade. Consequently, Thailand is seeking ways to secure gas supplies through greater domestic production, imports via pipeline and new liquefied natural gas (LNG), and overseas upstream investments.
The power sector now accounts for about 60 percent of overall natural gas demand, though its share has gradually declined from above 80 percent before 2000 as other sec-tors have grown rapidly. The power sector is dependent on gas as a fuel, with gas-fired stations supplying 71 percent of Thailand’s domestic generation in 2011, down from 76 percent in 2010. As the power sector’s share of natural gas has declined, other industries have picked up market shares. Gas separation facilities are the second largest gas consumer group rising to about 21 percent of the gas market in 2011. These facilities process gas for petrochemical consumers. The industrial sector, holding about 14 percent of the natural gas market, has increasingly used gas for its operations (DOE 2013a).
In early 2008, the Thai Cabinet acknowledged the National Strategic Plan on Climate Change B.E.2551-2555 (2008-2012) formulated by the National Committee on Climate Change Policy, in which they agreed that the plan be used by relevant agencies as guidelines to develop plans to address climate change. A goal of 15 percent reduction of GHG emis-sions by 2012 was established.
CURRENT STATUS OF WHRThailand has a fairly developed waste heat recovery power generation market. Eleven systems are installed on at least 16 clinker lines at seven cement plants (out of a total of 31 kiln lines at 13 plants).20 The eleven existing WHR systems repre-sent more than 172 MW of electric capacity. The remaining potential for WHR in Thailand ranges from 30 to 60 MW, based on estimated clinker capacity at plants with capacity greater than 1 Mta. Moisture content of the clinker raw ma-terials may be a limiting factor on WHR potential in Thailand.
The waste heat recovery power generation market for the Thai cement industry is currently served primarily by foreign suppliers:
Anhui Conch / Kawasaki Engineering is a joint venture of the Chinese cement company Anhui Conch and the Japanese equipment and engineering company Kawasaki Plant Systems. Anhui Conch / Kawasaki is a leading WHR supplier in China and has installed a number of systems in other countries including India, Pakistan, and Vietnam.
Sinoma Energy Conservation (Sinoma EC) is a leading Chinese supplier of waste heat recovery power generation systems. Sinoma EC has also installed over twenty WHR systems in other countries including Vietnam. Philippines, India, Pakistan, Turkey, Angola, UAE and Saudi Arabia.
20 OneStone Research states that there are 12 WHR systems installed at Thai cement plants
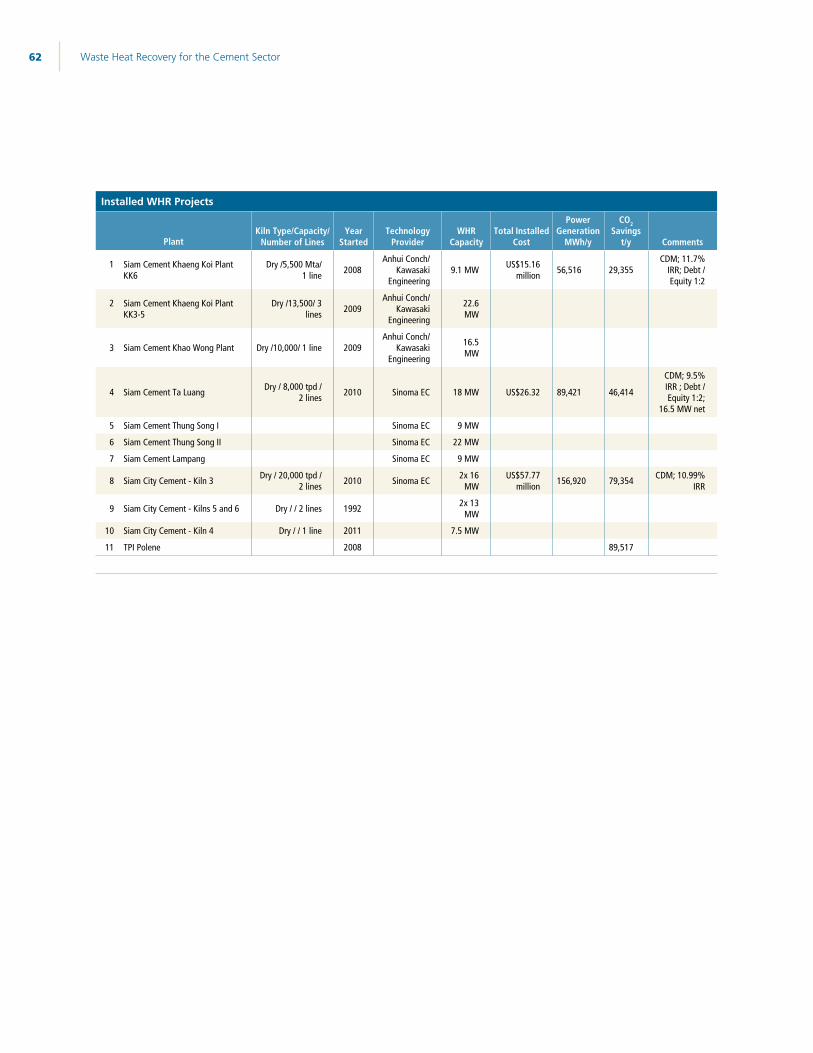
Waste Heat Recovery for the Cement Sector 62
Installed WHR Projects
PlantKiln Type/Capacity/
Number of LinesYear
StartedTechnology
ProviderWHR
CapacityTotal Installed
Cost
Power Generation
MWh/y
CO2 Savings
t/y Comments
1 Siam Cement Khaeng Koi Plant KK6
Dry /5,500 Mta/ 1 line 2008
Anhui Conch/ Kawasaki
Engineering9.1 MW US$15.16
million 56,516 29,355CDM; 11.7%
IRR; Debt / Equity 1:2
2 Siam Cement Khaeng Koi Plant KK3-5
Dry /13,500/ 3 lines 2009
Anhui Conch/ Kawasaki
Engineering
22.6 MW
3 Siam Cement Khao Wong Plant Dry /10,000/ 1 line 2009Anhui Conch/
Kawasaki Engineering
16.5 MW
4 Siam Cement Ta Luang Dry / 8,000 tpd / 2 lines 2010 Sinoma EC 18 MW US$26.32 89,421 46,414
CDM; 9.5% IRR ; Debt / Equity 1:2;
16.5 MW net
5 Siam Cement Thung Song I Sinoma EC 9 MW
6 Siam Cement Thung Song II Sinoma EC 22 MW
7 Siam Cement Lampang Sinoma EC 9 MW
8 Siam City Cement - Kiln 3 Dry / 20,000 tpd / 2 lines 2010 Sinoma EC 2x 16
MW US$57.77
million 156,920 79,354 CDM; 10.99% IRR
9 Siam City Cement - Kilns 5 and 6 Dry / / 2 lines 1992 2x 13 MW
10 Siam City Cement - Kiln 4 Dry / / 1 line 2011 7.5 MW
11 TPI Polene 2008 89,517
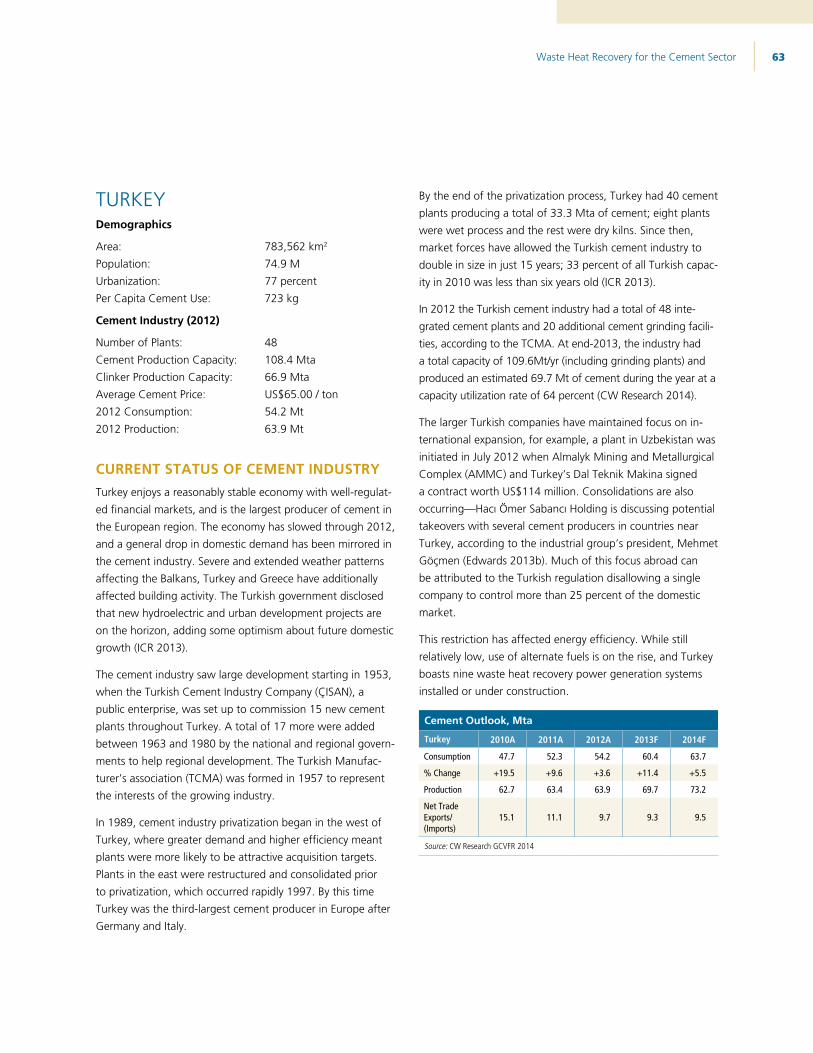
Waste Heat Recovery for the Cement Sector 63
TURKEYDemographics
Area: 783,562 km2
Population: 74.9 MUrbanization: 77 percentPer Capita Cement Use: 723 kg
Cement Industry (2012)
Number of Plants: 48Cement Production Capacity: 108.4 MtaClinker Production Capacity: 66.9 MtaAverage Cement Price: US$65.00 / ton2012 Consumption: 54.2 Mt2012 Production: 63.9 Mt
CURRENT STATUS OF CEMENT INDUSTRYTurkey enjoys a reasonably stable economy with well-regulat-ed financial markets, and is the largest producer of cement in the European region. The economy has slowed through 2012, and a general drop in domestic demand has been mirrored in the cement industry. Severe and extended weather patterns affecting the Balkans, Turkey and Greece have additionally affected building activity. The Turkish government disclosed that new hydroelectric and urban development projects are on the horizon, adding some optimism about future domestic growth (ICR 2013).
The cement industry saw large development starting in 1953, when the Turkish Cement Industry Company (ÇISAN), a public enterprise, was set up to commission 15 new cement plants throughout Turkey. A total of 17 more were added between 1963 and 1980 by the national and regional govern-ments to help regional development. The Turkish Manufac-turer’s association (TCMA) was formed in 1957 to represent the interests of the growing industry.
In 1989, cement industry privatization began in the west of Turkey, where greater demand and higher efficiency meant plants were more likely to be attractive acquisition targets. Plants in the east were restructured and consolidated prior to privatization, which occurred rapidly 1997. By this time Turkey was the third-largest cement producer in Europe after Germany and Italy.
By the end of the privatization process, Turkey had 40 cement plants producing a total of 33.3 Mta of cement; eight plants were wet process and the rest were dry kilns. Since then, market forces have allowed the Turkish cement industry to double in size in just 15 years; 33 percent of all Turkish capac-ity in 2010 was less than six years old (ICR 2013).
In 2012 the Turkish cement industry had a total of 48 inte-grated cement plants and 20 additional cement grinding facili-ties, according to the TCMA. At end-2013, the industry had a total capacity of 109.6Mt/yr (including grinding plants) and produced an estimated 69.7 Mt of cement during the year at a capacity utilization rate of 64 percent (CW Research 2014).
The larger Turkish companies have maintained focus on in-ternational expansion, for example, a plant in Uzbekistan was initiated in July 2012 when Almalyk Mining and Metallurgical Complex (AMMC) and Turkey’s Dal Teknik Makina signed a contract worth US$114 million. Consolidations are also occurring—Hacı Ömer Sabancı Holding is discussing potential takeovers with several cement producers in countries near Turkey, according to the industrial group’s president, Mehmet Göçmen (Edwards 2013b). Much of this focus abroad can be attributed to the Turkish regulation disallowing a single company to control more than 25 percent of the domestic market.
This restriction has affected energy efficiency. While still relatively low, use of alternate fuels is on the rise, and Turkey boasts nine waste heat recovery power generation systems installed or under construction.
Cement Outlook, Mta
Turkey 2010A 2011A 2012A 2013F 2014F
Consumption 47.7 52.3 54.2 60.4 63.7
% Change +19.5 +9.6 +3.6 +11.4 +5.5
Production 62.7 63.4 63.9 69.7 73.2
Net Trade Exports/ (Imports)
15.1 11.1 9.7 9.3 9.5
Source: CW Research GCVFR 2014

Waste Heat Recovery for the Cement Sector 64
Cement Associations
Turkish Cement Manufacturers Association (TCMA) http://www.tcma.org.tr/ENG/
Major Cement Companies – Integrated Facilities (2012)
CompanyNumber of
PlantsCement
Capacity, MtaClinker
Capacity,* Mta
OYAK 8 17.50 10.69
Limak Holdings 10 11.60 7.09
Akçansa 4 9.70 5.93
Sabanci 6 9.70 5.93
AS Cimento 1 6.50 3.97
Nuh Cimento 1 5.82 3.56
Çimentas 4 5.40 3.29
Çimko Cement 2 4.65 2.84
Vicat (FRA) 2 4.60 2.81
Cimpor (PRT) 6 4.20 2.57
Batiçim Bati Anadolu 2 3.18 1.94
Askale 4 3.00 1.83
Göltas Göller Bölgesi 1 2.92 1.78
Bursa 1 2.85 1.74
Traçim Cimento 1 2.25 1.37
Denizli 1 2.50 1.53
Ado Group 3 2.30 1.41
KÇS 1 2.00 1.22
Sançim Bilecik 1 1.40 0.85
Bartin Cimento 1 1.02 0.64
Yurt Cimento 1 0.24 0.15
*Values estimated based on overall domestic clinker / cement production of 84 percentSource: ICR Global Cement Report, 10th Edition; US Geological Survey (USGS), 2011 Minerals Yearbook; Global Cement Plant Database, CemNet 2013; TCMA Capacity 2012
Market Outlook
The strong fundamentals of the Turkish economy provide a generally favorable outlook for the Turkish cement industry. In 2011, the Turkish economy grew by 8.5 percent in terms of GDP and is estimated to have grown by 3.3 percent in 2012. In 2013 this rate was expected to be marginally increased to 3.9 percent. In the 2015-2019 period it is estimated that Turkish GDP will grow by 5.3 percent/yr. Profits are down due to unfavorable exchange rates but the Turkish economy is viewed as stable. The TCMA estimates that Turkish cement capacity will expand by another 25 Mt/yr before the end of 2015, a growth rate of about 8.5 percent/yr (TCMA 2103).
Domestic consumption is forecast to rise with the under-taking of new infrastructure projects. In October 2012 the Turkish government began the first stage of a huge urban regeneration project across all of the country’s major popula-tion centers. It aims to replace around five to six million homes over a 10-20 year horizon. Many of these buildings lie in earthquake zones and are in poor states of repair. In addi-tion, Turkey planned to expand the Bosporus Bridge / Tunnel and build a new suspension bridge over the Marmara Sea, creating an immediate need for cement and opening new regions to development. Changing socio-political climates in North African and Arab countries have raised questions about future business there, but emerging markets in West Africa and Russia could help to offset this decline.
Energy Prices for Industry
The following table provides average electricity, domestic coal (lignite), and natural gas prices for industrial users in Turkey from 2005 to 2011 from the U.S. Energy Information Admin-istration and the International Energy Agency.
Energy Prices for Industry
Turkey 2005 2006 2007 2008 2009 2010 2011
Electricity, US$/MWh 106.4 99.8 108.7 138.8 137.6 150.9 138.6
Steam Coal*, US$/tonne 47.8 48.6 69.8 92.6 84.4 83.7 86.6
Steam Coal*, US$/GJ 4.89 4.98 7.15 9.49 8.65 8.58 8.87
Natural Gas, US$/GJ 7.28 8.42 10.52 13.69 11.17 9.72 9.38
*LigniteSource: U.S. DOE Energy Information Administration 2013b; IEA “Energy Prices and Taxes,” 2012
Electricity prices for the cement industry are about 102.0 US$/MWh (208.58 kr/kWh). During the two years, electricity prices for the cement industry have increased by around 14 percent annually. Although there are infrastructure investments underway that will increase power supply, similar annual increases are expected to continue.
Imported coal, pet-coke and domestic lignite are commonly used fuels in Turkish clinker kilns. The table below shows the share of different fuels other than domestic coal used by the industry.
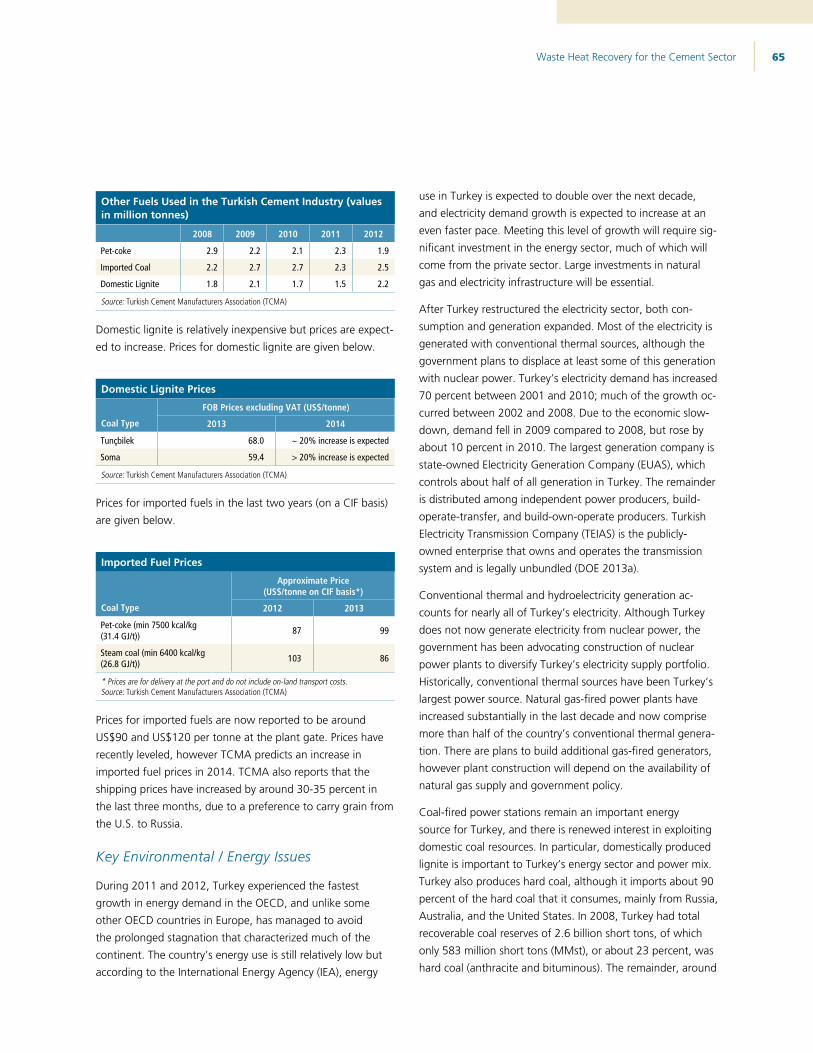
Waste Heat Recovery for the Cement Sector 65
Other Fuels Used in the Turkish Cement Industry (values in million tonnes)
2008 2009 2010 2011 2012
Pet-coke 2.9 2.2 2.1 2.3 1.9
Imported Coal 2.2 2.7 2.7 2.3 2.5
Domestic Lignite 1.8 2.1 1.7 1.5 2.2
Source: Turkish Cement Manufacturers Association (TCMA)
Domestic lignite is relatively inexpensive but prices are expect-ed to increase. Prices for domestic lignite are given below.
Domestic Lignite Prices
Coal Type
FOB Prices excluding VAT (US$/tonne)
2013 2014
Tunçbilek 68.0 ~ 20% increase is expected
Soma 59.4 > 20% increase is expected
Source: Turkish Cement Manufacturers Association (TCMA)
Prices for imported fuels in the last two years (on a CIF basis) are given below.
Imported Fuel Prices
Coal Type
Approximate Price (US$/tonne on CIF basis*)
2012 2013
Pet-coke (min 7500 kcal/kg (31.4 GJ/t)) 87 99
Steam coal (min 6400 kcal/kg (26.8 GJ/t)) 103 86
* Prices are for delivery at the port and do not include on-land transport costs. Source: Turkish Cement Manufacturers Association (TCMA)
Prices for imported fuels are now reported to be around US$90 and US$120 per tonne at the plant gate. Prices have recently leveled, however TCMA predicts an increase in imported fuel prices in 2014. TCMA also reports that the shipping prices have increased by around 30-35 percent in the last three months, due to a preference to carry grain from the U.S. to Russia.
Key Environmental / Energy Issues
During 2011 and 2012, Turkey experienced the fastest growth in energy demand in the OECD, and unlike some other OECD countries in Europe, has managed to avoid the prolonged stagnation that characterized much of the continent. The country’s energy use is still relatively low but according to the International Energy Agency (IEA), energy
use in Turkey is expected to double over the next decade, and electricity demand growth is expected to increase at an even faster pace. Meeting this level of growth will require sig-nificant investment in the energy sector, much of which will come from the private sector. Large investments in natural gas and electricity infrastructure will be essential.
After Turkey restructured the electricity sector, both con-sumption and generation expanded. Most of the electricity is generated with conventional thermal sources, although the government plans to displace at least some of this generation with nuclear power. Turkey’s electricity demand has increased 70 percent between 2001 and 2010; much of the growth oc-curred between 2002 and 2008. Due to the economic slow-down, demand fell in 2009 compared to 2008, but rose by about 10 percent in 2010. The largest generation company is state-owned Electricity Generation Company (EUAS), which controls about half of all generation in Turkey. The remainder is distributed among independent power producers, build-operate-transfer, and build-own-operate producers. Turkish Electricity Transmission Company (TEIAS) is the publicly-owned enterprise that owns and operates the transmission system and is legally unbundled (DOE 2013a).
Conventional thermal and hydroelectricity generation ac-counts for nearly all of Turkey’s electricity. Although Turkey does not now generate electricity from nuclear power, the government has been advocating construction of nuclear power plants to diversify Turkey’s electricity supply portfolio. Historically, conventional thermal sources have been Turkey’s largest power source. Natural gas-fired power plants have increased substantially in the last decade and now comprise more than half of the country’s conventional thermal genera-tion. There are plans to build additional gas-fired generators, however plant construction will depend on the availability of natural gas supply and government policy.
Coal-fired power stations remain an important energy source for Turkey, and there is renewed interest in exploiting domestic coal resources. In particular, domestically produced lignite is important to Turkey’s energy sector and power mix. Turkey also produces hard coal, although it imports about 90 percent of the hard coal that it consumes, mainly from Russia, Australia, and the United States. In 2008, Turkey had total recoverable coal reserves of 2.6 billion short tons, of which only 583 million short tons (MMst), or about 23 percent, was hard coal (anthracite and bituminous). The remainder, around
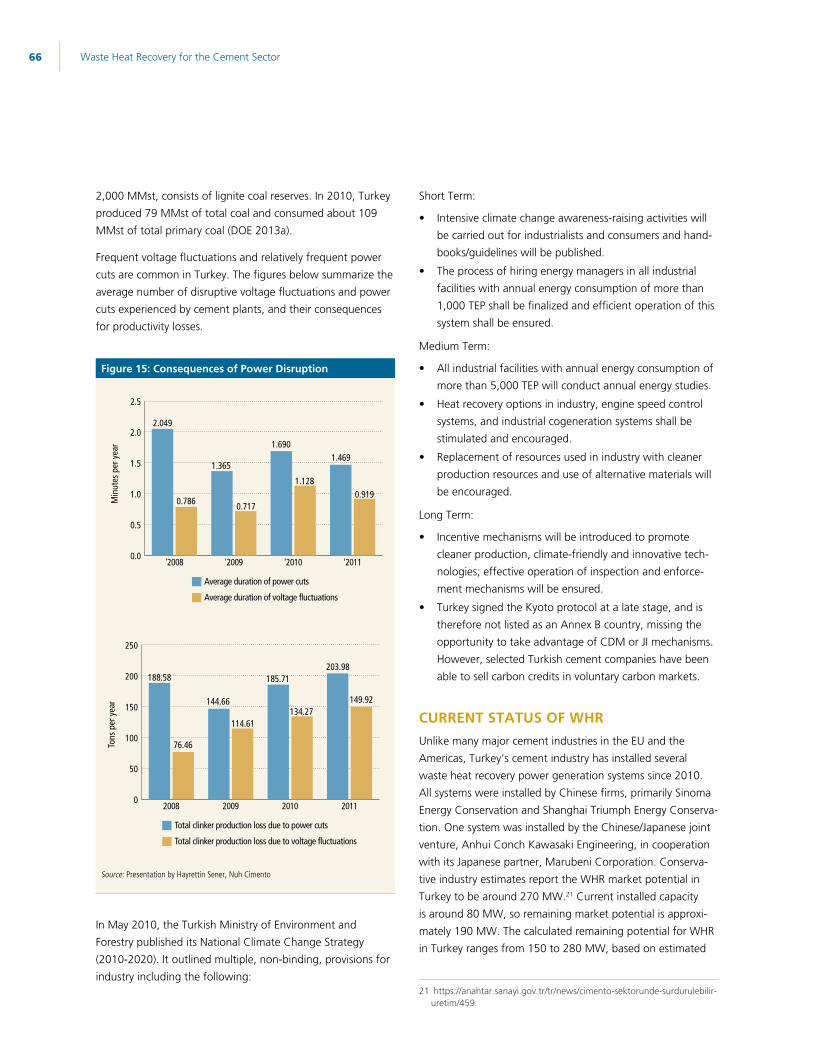
Waste Heat Recovery for the Cement Sector 66
2,000 MMst, consists of lignite coal reserves. In 2010, Turkey produced 79 MMst of total coal and consumed about 109 MMst of total primary coal (DOE 2013a).
Frequent voltage fluctuations and relatively frequent power cuts are common in Turkey. The figures below summarize the average number of disruptive voltage fluctuations and power cuts experienced by cement plants, and their consequences for productivity losses.
Figure 15: Consequences of Power Disruption
0.0
0.5
1.0
1.5
2.0
2.5
'2011'2010'2009'2008
Min
utes
per
yea
r
2.049
0.786
1.365
0.717
1.690
1.128
1.469
0.919
Average duration of power cuts
Average duration of voltage fluctuations
0
50
100
150
200
250
2011201020092008
Tons
per
yea
r
188.58
76.46
144.66
114.61
185.71
134.27
203.98
149.92
Total clinker production loss due to power cuts
Total clinker production loss due to voltage fluctuations
Source: Presentation by Hayrettin Sener, Nuh Cimento
In May 2010, the Turkish Ministry of Environment and Forestry published its National Climate Change Strategy (2010-2020). It outlined multiple, non-binding, provisions for industry including the following:
Short Term:
Intensive climate change awareness-raising activities will be carried out for industrialists and consumers and hand-books/guidelines will be published.
The process of hiring energy managers in all industrial facilities with annual energy consumption of more than 1,000 TEP shall be finalized and efficient operation of this system shall be ensured.
Medium Term:
All industrial facilities with annual energy consumption of more than 5,000 TEP will conduct annual energy studies.
Heat recovery options in industry, engine speed control systems, and industrial cogeneration systems shall be stimulated and encouraged.
Replacement of resources used in industry with cleaner production resources and use of alternative materials will be encouraged.
Long Term:
Incentive mechanisms will be introduced to promote cleaner production, climate-friendly and innovative tech-nologies; effective operation of inspection and enforce-ment mechanisms will be ensured.
Turkey signed the Kyoto protocol at a late stage, and is therefore not listed as an Annex B country, missing the opportunity to take advantage of CDM or JI mechanisms. However, selected Turkish cement companies have been able to sell carbon credits in voluntary carbon markets.
CURRENT STATUS OF WHRUnlike many major cement industries in the EU and the Americas, Turkey’s cement industry has installed several waste heat recovery power generation systems since 2010. All systems were installed by Chinese firms, primarily Sinoma Energy Conservation and Shanghai Triumph Energy Conserva-tion. One system was installed by the Chinese/Japanese joint venture, Anhui Conch Kawasaki Engineering, in cooperation with its Japanese partner, Marubeni Corporation. Conserva-tive industry estimates report the WHR market potential in Turkey to be around 270 MW.21 Current installed capacity is around 80 MW, so remaining market potential is approxi-mately 190 MW. The calculated remaining potential for WHR in Turkey ranges from 150 to 280 MW, based on estimated
21 https://anahtar.sanayi.gov.tr/tr/news/cimento-sektorunde-surdurulebilir-uretim/459
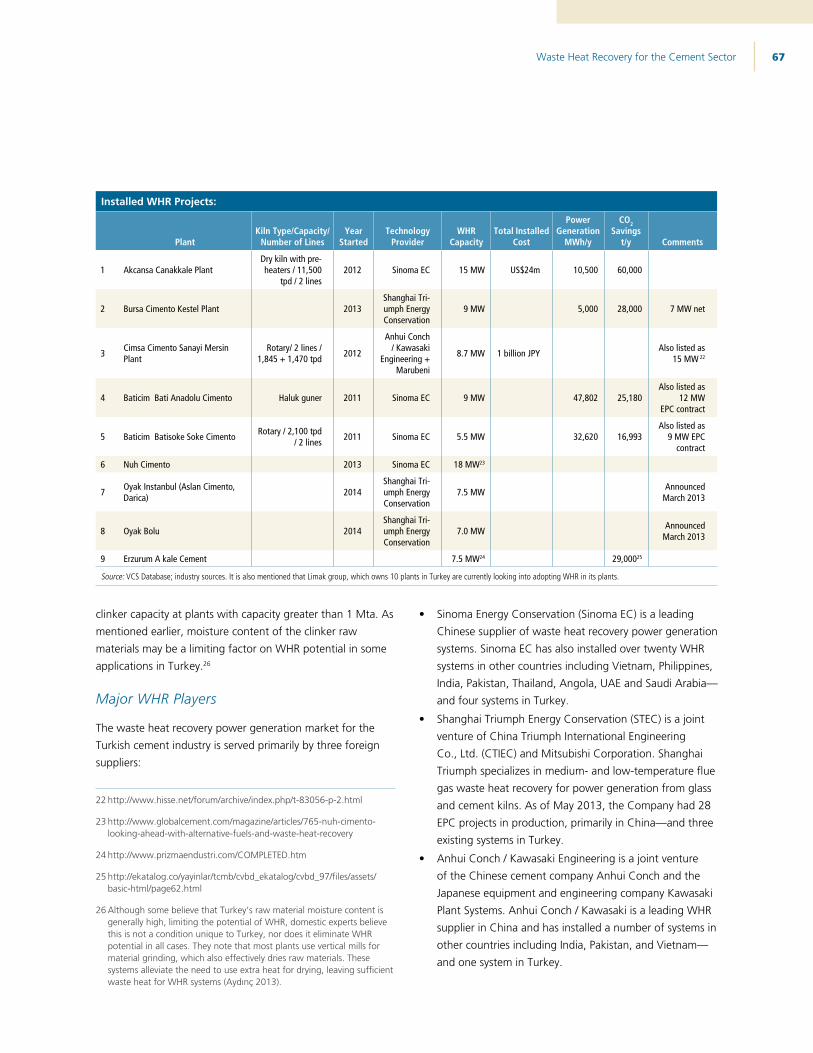
Waste Heat Recovery for the Cement Sector 67
clinker capacity at plants with capacity greater than 1 Mta. As mentioned earlier, moisture content of the clinker raw materials may be a limiting factor on WHR potential in some applications in Turkey.26
Major WHR Players
The waste heat recovery power generation market for the Turkish cement industry is served primarily by three foreign suppliers:
22 http://www.hisse.net/forum/archive/index.php/t-83056-p-2.html
23 http://www.globalcement.com/magazine/articles/765-nuh-cimento-looking-ahead-with-alternative-fuels-and-waste-heat-recovery
24 http://www.prizmaendustri.com/COMPLETED.htm
25 http://ekatalog.co/yayinlar/tcmb/cvbd_ekatalog/cvbd_97/files/assets/basic-html/page62.html
26 Although some believe that Turkey’s raw material moisture content is generally high, limiting the potential of WHR, domestic experts believe this is not a condition unique to Turkey, nor does it eliminate WHR potential in all cases. They note that most plants use vertical mills for material grinding, which also effectively dries raw materials. These systems alleviate the need to use extra heat for drying, leaving sufficient waste heat for WHR systems (Aydınç 2013).
Sinoma Energy Conservation (Sinoma EC) is a leading Chinese supplier of waste heat recovery power generation systems. Sinoma EC has also installed over twenty WHR systems in other countries including Vietnam, Philippines, India, Pakistan, Thailand, Angola, UAE and Saudi Arabia—and four systems in Turkey.
Shanghai Triumph Energy Conservation (STEC) is a joint venture of China Triumph International Engineering Co., Ltd. (CTIEC) and Mitsubishi Corporation. Shanghai Triumph specializes in medium- and low-temperature flue gas waste heat recovery for power generation from glass and cement kilns. As of May 2013, the Company had 28 EPC projects in production, primarily in China—and three existing systems in Turkey.
Anhui Conch / Kawasaki Engineering is a joint venture of the Chinese cement company Anhui Conch and the Japanese equipment and engineering company Kawasaki Plant Systems. Anhui Conch / Kawasaki is a leading WHR supplier in China and has installed a number of systems in other countries including India, Pakistan, and Vietnam—and one system in Turkey.
Installed WHR Projects:
PlantKiln Type/Capacity/
Number of LinesYear
StartedTechnology
ProviderWHR
CapacityTotal Installed
Cost
Power Generation
MWh/y
CO2 Savings
t/y Comments
1 Akcansa Canakkale PlantDry kiln with pre-heaters / 11,500
tpd / 2 lines 2012 Sinoma EC 15 MW US$24m 10,500 60,000
2 Bursa Cimento Kestel Plant 2013Shanghai Tri-umph Energy Conservation
9 MW 5,000 28,000 7 MW net
3 Cimsa Cimento Sanayi Mersin Plant
Rotary/ 2 lines / 1,845 + 1,470 tpd 2012
Anhui Conch / Kawasaki
Engineering + Marubeni
8.7 MW 1 billion JPY Also listed as 15 MW 22
4 Baticim Bati Anadolu Cimento Haluk guner 2011 Sinoma EC 9 MW 47,802 25,180Also listed as
12 MW EPC contract
5 Baticim Batisoke Soke Cimento Rotary / 2,100 tpd / 2 lines 2011 Sinoma EC 5.5 MW 32,620 16,993
Also listed as 9 MW EPC
contract
6 Nuh Cimento 2013 Sinoma EC 18 MW23
7 Oyak Instanbul (Aslan Cimento, Darica) 2014
Shanghai Tri-umph Energy Conservation
7.5 MW Announced March 2013
8 Oyak Bolu 2014Shanghai Tri-umph Energy Conservation
7.0 MW Announced March 2013
9 Erzurum A kale Cement 7.5 MW24 29,00025
Source: VCS Database; industry sources. It is also mentioned that Limak group, which owns 10 plants in Turkey are currently looking into adopting WHR in its plants.
Waste Heat Recovery for the Cement Sector 68
VIETNAMDemographics
Area: 331,210 km2
Population: 91.5 MUrbanization: 30 percentPer Capita Cement Use: 507 kg
Cement Industry (2012)
Number of Plants: 69Cement Production Capacity: 89.8 MtaClinker Production Capacity: 76.3 Mta*Average Cement Price: US$55 - US$70 / ton2012 Consumption: 48.6 Mt2012 Production: 57.4 Mt
* Based on a clinker / cement capacity factor of 0.85
CURRENT STATUS OF CEMENT INDUSTRYImmediately before the collapse of the USSR, Vietnam com-mitted to increased economic liberalization and enacted structural reforms needed to modernize the economy and to produce more competitive, export-driven industries. This cre-ated a shift towards exports such as crude oil and rice, manu-factured goods such as clothes, shoes, electronics, machinery and wood products. Export customers are primarily the U.S. (18 percent), China (11 percent), Japan (11 percent) and Germany (4.0 percent). Vietnam imports processed petroleum products, vehicles, steel products, raw materials for clothing and shoe manufacture, plastics, and electronic items.
Despite Vietnam’s exports being up by 33 percent year-on-year in 2011, the country imports more than it exports. This has brought about a trade deficit that is adversely affecting other parts of the economy. Due to an estimated average in-flation rate of 18 percent in 2011, the Vietnamese Dong was on a downward trend, gradually devalued by 20 percent since 2008. Real GDP growth has experienced substantial fluctua-tions since 1980 and high inflation led to a trade imbalance (IMF). Vietnam’s heavily export-oriented economy slowed beginning in 2011 as the government sought to implement significant economic reforms in restructuring banking, state-owned enterprises, and public investment.
Vietnam is one of the principal cement consumers in Southeast Asia, yet demand has fallen well below production capacity as high interest rates and inflation have slowed construction.
The drop in domestic demand led many companies to focus on exports but these have failed to fully compensate as many of Vietnam’s principal trade partners were also experiencing slowed economic growth. High costs for production and input materials additionally weaken cement manufacturers.
A significant share of the cement industry is controlled by the VICEM, the state-run Vietnamese Cement Industry Corporation. VICEM operates 12 plants, the oldest plant built in 1964 and the newest in 2000. The only major foreign player is Holcim, with a cement plant under a joint venture with VICEM, and some grinding facilities in the south of the country (ICR 2013).
The cement industry is slowly adapting to a market-based structure. The government has kept older, low-efficiency capacity open, and new capacity has come online resulting in significant overcapacity. After calls to overhaul the industry were sent to the Prime Minister in early 2011, the situation came to a head in mid-2011 when the Vietnamese finance minister announced that the national government would have to provide capital to help four cement projects deal with their foreign debts. The four projects were among 16 in the cement sector that had government-guaranteed loans from foreign creditors worth a total of US$1.36 billion (Edwards 2012b).
The situation worsened in February 2012, when Vietnam’s Ministry of Construction announced temporary delays on several approved cement projects. The director of the ministry’s Construction Materials Department noted that many cement producers faced losses due to declining consumption and high interest rates and plant closings began. For example, Thanh Liem Cement Plant in northern Ha Nam Province had to close due to significant losses, although the plant had not declared bankruptcy. Many other plants have cut capacity sharply. Cement producers were urged to boost trade promotion and increase exports to deal with the surplus. National consumption is in the 50 Mta range; government reports a 20 Mt/yr mis-match between supply and demand, with production capacity exceeding 70 Mta in 2012 (ICR 2013, Edwards 2012b).
Cement producers in Vietnam lost at least US$80 million in 2012 in a series of bids to undercut each other, accord-ing to the Chairman of Vietnam Building Material Associa-tion (Edwards 2102b). Local cement producers were asked to cooperate to keep export prices above domestic prices. Prime Minister Nguyen Tan Dung approved a proposal by the Vietnam Building Material Association to cancel nine cement plant projects to keep production capacity in line with market
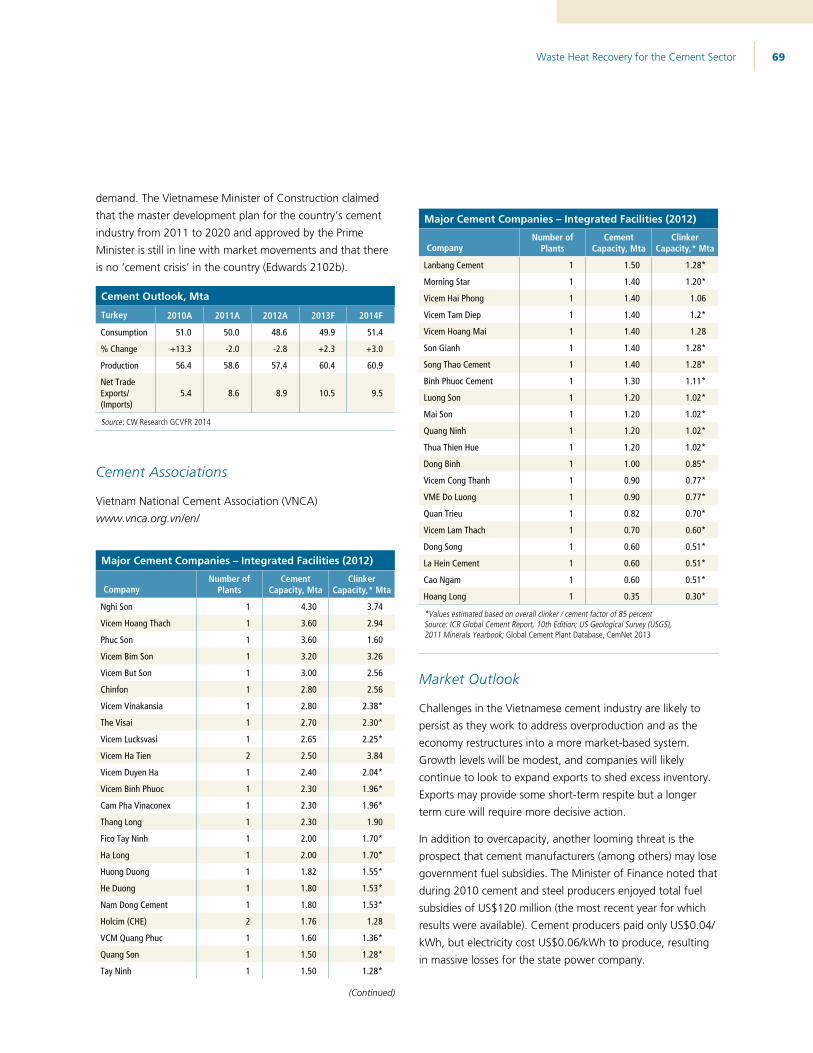
Waste Heat Recovery for the Cement Sector 69
demand. The Vietnamese Minister of Construction claimed that the master development plan for the country’s cement industry from 2011 to 2020 and approved by the Prime Minister is still in line with market movements and that there is no ‘cement crisis’ in the country (Edwards 2102b).
Cement Outlook, Mta
Turkey 2010A 2011A 2012A 2013F 2014F
Consumption 51.0 50.0 48.6 49.9 51.4
% Change +13.3 -2.0 -2.8 +2.3 +3.0
Production 56.4 58.6 57.4 60.4 60.9
Net Trade Exports/ (Imports)
5.4 8.6 8.9 10.5 9.5
Source: CW Research GCVFR 2014
Cement Associations
Vietnam National Cement Association (VNCA) www.vnca.org.vn/en/
Major Cement Companies – Integrated Facilities (2012)
CompanyNumber of
PlantsCement
Capacity, MtaClinker
Capacity,* Mta
Nghi Son 1 4.30 3.74
Vicem Hoang Thach 1 3.60 2.94
Phuc Son 1 3.60 1.60
Vicem Bim Son 1 3.20 3.26
Vicem But Son 1 3.00 2.56
Chinfon 1 2.80 2.56
Vicem Vinakansia 1 2.80 2.38*
The Visai 1 2.70 2.30*
Vicem Lucksvasi 1 2.65 2.25*
Vicem Ha Tien 2 2.50 3.84
Vicem Duyen Ha 1 2.40 2.04*
Vicem Binh Phuoc 1 2.30 1.96*
Cam Pha Vinaconex 1 2.30 1.96*
Thang Long 1 2.30 1.90
Fico Tay Ninh 1 2.00 1.70*
Ha Long 1 2.00 1.70*
Huong Duong 1 1.82 1.55*
He Duong 1 1.80 1.53*
Nam Dong Cement 1 1.80 1.53*
Holcim (CHE) 2 1.76 1.28
VCM Quang Phuc 1 1.60 1.36*
Quang Son 1 1.50 1.28*
Tay Ninh 1 1.50 1.28*
Major Cement Companies – Integrated Facilities (2012)
CompanyNumber of
PlantsCement
Capacity, MtaClinker
Capacity,* Mta
Lanbang Cement 1 1.50 1.28*
Morning Star 1 1.40 1.20*
Vicem Hai Phong 1 1.40 1.06
Vicem Tam Diep 1 1.40 1.2*
Vicem Hoang Mai 1 1.40 1.28
Son Gianh 1 1.40 1.28*
Song Thao Cement 1 1.40 1.28*
Binh Phuoc Cement 1 1.30 1.11*
Luong Son 1 1.20 1.02*
Mai Son 1 1.20 1.02*
Quang Ninh 1 1.20 1.02*
Thua Thien Hue 1 1.20 1.02*
Dong Binh 1 1.00 0.85*
Vicem Cong Thanh 1 0.90 0.77*
VME Do Luong 1 0.90 0.77*
Quan Trieu 1 0.82 0.70*
Vicem Lam Thach 1 0.70 0.60*
Dong Song 1 0.60 0.51*
La Hein Cement 1 0.60 0.51*
Cao Ngam 1 0.60 0.51*
Hoang Long 1 0.35 0.30*
*Values estimated based on overall clinker / cement factor of 85 percentSource: ICR Global Cement Report, 10th Edition; US Geological Survey (USGS), 2011 Minerals Yearbook; Global Cement Plant Database, CemNet 2013
Market Outlook
Challenges in the Vietnamese cement industry are likely to persist as they work to address overproduction and as the economy restructures into a more market-based system. Growth levels will be modest, and companies will likely continue to look to expand exports to shed excess inventory. Exports may provide some short-term respite but a longer term cure will require more decisive action.
In addition to overcapacity, another looming threat is the prospect that cement manufacturers (among others) may lose government fuel subsidies. The Minister of Finance noted that during 2010 cement and steel producers enjoyed total fuel subsidies of US$120 million (the most recent year for which results were available). Cement producers paid only US$0.04/kWh, but electricity cost US$0.06/kWh to produce, resulting in massive losses for the state power company.
(Continued)
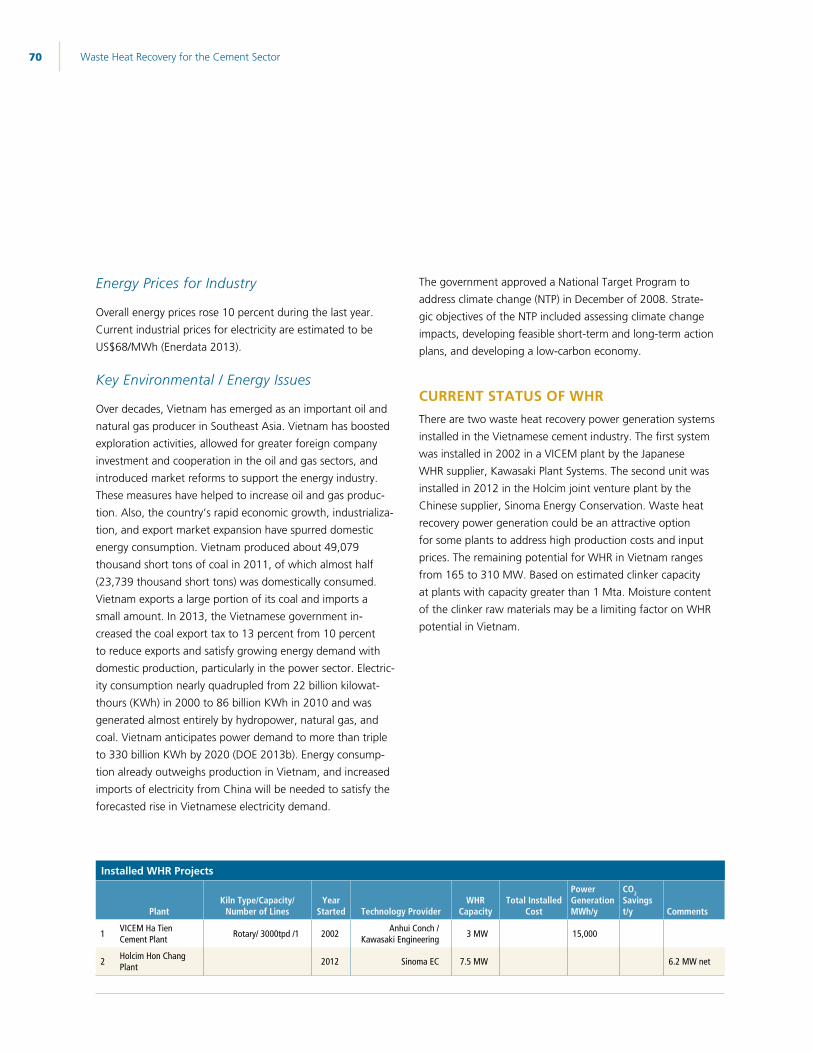
Waste Heat Recovery for the Cement Sector 70
Energy Prices for Industry
Overall energy prices rose 10 percent during the last year. Current industrial prices for electricity are estimated to be US$68/MWh (Enerdata 2013).
Key Environmental / Energy Issues
Over decades, Vietnam has emerged as an important oil and natural gas producer in Southeast Asia. Vietnam has boosted exploration activities, allowed for greater foreign company investment and cooperation in the oil and gas sectors, and introduced market reforms to support the energy industry. These measures have helped to increase oil and gas produc-tion. Also, the country’s rapid economic growth, industrializa-tion, and export market expansion have spurred domestic energy consumption. Vietnam produced about 49,079 thousand short tons of coal in 2011, of which almost half (23,739 thousand short tons) was domestically consumed. Vietnam exports a large portion of its coal and imports a small amount. In 2013, the Vietnamese government in-creased the coal export tax to 13 percent from 10 percent to reduce exports and satisfy growing energy demand with domestic production, particularly in the power sector. Electric-ity consumption nearly quadrupled from 22 billion kilowat-thours (KWh) in 2000 to 86 billion KWh in 2010 and was generated almost entirely by hydropower, natural gas, and coal. Vietnam anticipates power demand to more than triple to 330 billion KWh by 2020 (DOE 2013b). Energy consump-tion already outweighs production in Vietnam, and increased imports of electricity from China will be needed to satisfy the forecasted rise in Vietnamese electricity demand.
The government approved a National Target Program to address climate change (NTP) in December of 2008. Strate-gic objectives of the NTP included assessing climate change impacts, developing feasible short-term and long-term action plans, and developing a low-carbon economy.
CURRENT STATUS OF WHRThere are two waste heat recovery power generation systems installed in the Vietnamese cement industry. The first system was installed in 2002 in a VICEM plant by the Japanese WHR supplier, Kawasaki Plant Systems. The second unit was installed in 2012 in the Holcim joint venture plant by the Chinese supplier, Sinoma Energy Conservation. Waste heat recovery power generation could be an attractive option for some plants to address high production costs and input prices. The remaining potential for WHR in Vietnam ranges from 165 to 310 MW. Based on estimated clinker capacity at plants with capacity greater than 1 Mta. Moisture content of the clinker raw materials may be a limiting factor on WHR potential in Vietnam.
Installed WHR Projects
PlantKiln Type/Capacity/
Number of LinesYear
Started Technology ProviderWHR
CapacityTotal Installed
Cost
Power Generation MWh/y
CO2 Savings t/y Comments
1 VICEM Ha Tien Cement Plant Rotary/ 3000tpd /1 2002 Anhui Conch /
Kawasaki Engineering 3 MW 15,000
2 Holcim Hon Chang Plant 2012 Sinoma EC 7.5 MW 6.2 MW net
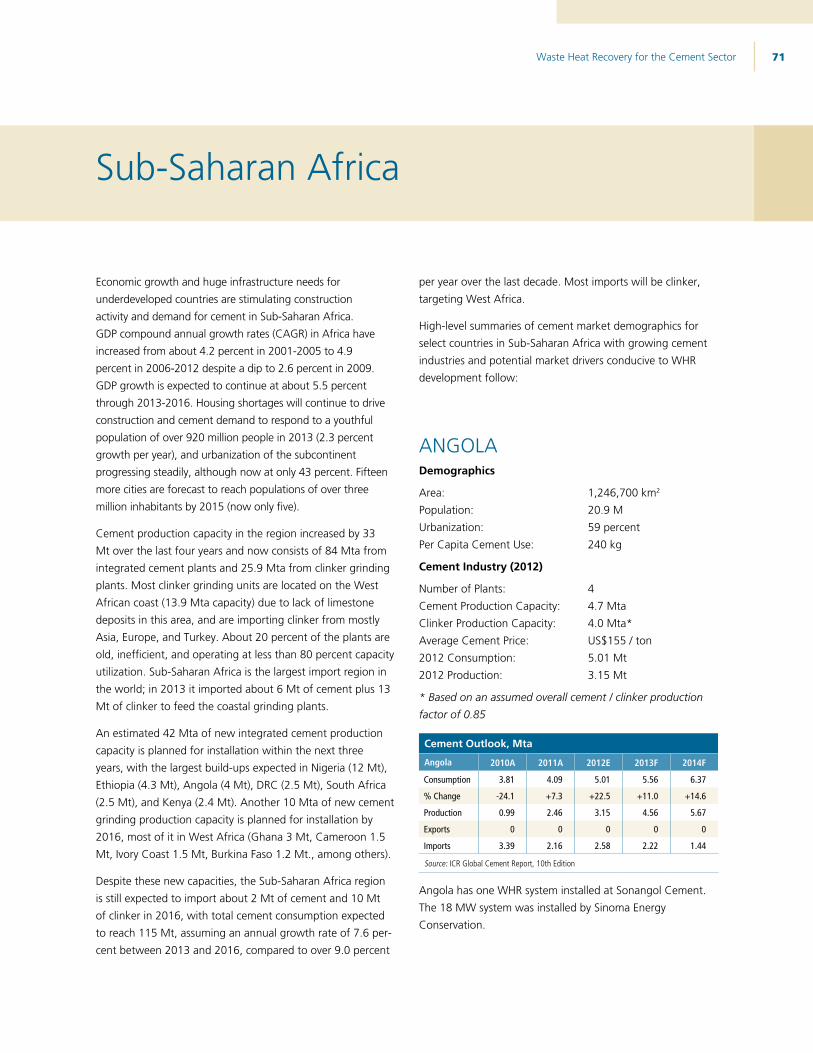
Waste Heat Recovery for the Cement Sector 71
Sub-Saharan Africa
Economic growth and huge infrastructure needs for underdeveloped countries are stimulating construction activity and demand for cement in Sub-Saharan Africa. GDP compound annual growth rates (CAGR) in Africa have increased from about 4.2 percent in 2001-2005 to 4.9 percent in 2006-2012 despite a dip to 2.6 percent in 2009. GDP growth is expected to continue at about 5.5 percent through 2013-2016. Housing shortages will continue to drive construction and cement demand to respond to a youthful population of over 920 million people in 2013 (2.3 percent growth per year), and urbanization of the subcontinent progressing steadily, although now at only 43 percent. Fifteen more cities are forecast to reach populations of over three million inhabitants by 2015 (now only five).
Cement production capacity in the region increased by 33 Mt over the last four years and now consists of 84 Mta from integrated cement plants and 25.9 Mta from clinker grinding plants. Most clinker grinding units are located on the West African coast (13.9 Mta capacity) due to lack of limestone deposits in this area, and are importing clinker from mostly Asia, Europe, and Turkey. About 20 percent of the plants are old, inefficient, and operating at less than 80 percent capacity utilization. Sub-Saharan Africa is the largest import region in the world; in 2013 it imported about 6 Mt of cement plus 13 Mt of clinker to feed the coastal grinding plants.
An estimated 42 Mta of new integrated cement production capacity is planned for installation within the next three years, with the largest build-ups expected in Nigeria (12 Mt), Ethiopia (4.3 Mt), Angola (4 Mt), DRC (2.5 Mt), South Africa (2.5 Mt), and Kenya (2.4 Mt). Another 10 Mta of new cement grinding production capacity is planned for installation by 2016, most of it in West Africa (Ghana 3 Mt, Cameroon 1.5 Mt, Ivory Coast 1.5 Mt, Burkina Faso 1.2 Mt., among others).
Despite these new capacities, the Sub-Saharan Africa region is still expected to import about 2 Mt of cement and 10 Mt of clinker in 2016, with total cement consumption expected to reach 115 Mt, assuming an annual growth rate of 7.6 per-cent between 2013 and 2016, compared to over 9.0 percent
per year over the last decade. Most imports will be clinker, targeting West Africa.
High-level summaries of cement market demographics for select countries in Sub-Saharan Africa with growing cement industries and potential market drivers conducive to WHR development follow:
ANGOLADemographics
Area: 1,246,700 km2
Population: 20.9 MUrbanization: 59 percentPer Capita Cement Use: 240 kg
Cement Industry (2012)
Number of Plants: 4Cement Production Capacity: 4.7 MtaClinker Production Capacity: 4.0 Mta*Average Cement Price: US$155 / ton2012 Consumption: 5.01 Mt2012 Production: 3.15 Mt
* Based on an assumed overall cement / clinker production factor of 0.85
Cement Outlook, Mta
Angola 2010A 2011A 2012E 2013F 2014F
Consumption 3.81 4.09 5.01 5.56 6.37
% Change -24.1 +7.3 +22.5 +11.0 +14.6
Production 0.99 2.46 3.15 4.56 5.67
Exports 0 0 0 0 0
Imports 3.39 2.16 2.58 2.22 1.44
Source: ICR Global Cement Report, 10th Edition
Angola has one WHR system installed at Sonangol Cement. The 18 MW system was installed by Sinoma Energy Conservation.

Waste Heat Recovery for the Cement Sector 72
ETHIOPIADemographics
Area: 1,104,300 km2
Population: 87.0 MUrbanization: 17 percentPer Capita Cement Use: 62 kg
Cement Industry (2012)
Number of Plants: 20Cement Production Capacity: 12.6 MtaClinker Production Capacity: 10.7 Mta*Average Cement Price: US$150 / ton2012 Consumption: 6.45 Mt2012 Production: 7.30 Mt
* Based on an assumed overall cement / clinker production factor of 0.85
Cement Outlook, Mta
Ethiopia 2010A 2011A 2012E 2013F 2014F
Consumption 4.30 5.38 6.45 7.40 8.53
% Change +19.4 +25.1 +19.9 +14.7 +15.3
Production 2.90 3.30 7.30 8.45 10.00
Exports 0 0 1.00 1.20 1.40
Imports 1.00 1.00 0.20 0 0
Source: ICR Global Cement Report, 10th Edition
KENYADemographics
Area: 580,737 km2
Population: 43.0 MUrbanization: 32 percentPer Capita Cement Use: 80 kg
Cement Industry (2012)
Number of Plants: 9Cement Production Capacity: 7.4 MtaClinker Production Capacity: 3.0 MtaAverage Cement Price: US$140 / ton2012 Consumption: 3.71 Mt2012 Production: 4.33 Mt
Cement Outlook, Mta
Kenya 2010A 2011A 2012E 2013F 2014F
Consumption 3.06 3.33 3.71 4.12 4.59
% Change +14.4 +9.0 +11.4 +11.1 +11.4
Production 3.71 4.00 4.33 4.85 5.43
Exports 0.65 0.70 0.65 0.75 0.85
Imports 0.68 0.73 0.73 0.72 0.51
Source: ICR Global Cement Report, 10th Edition
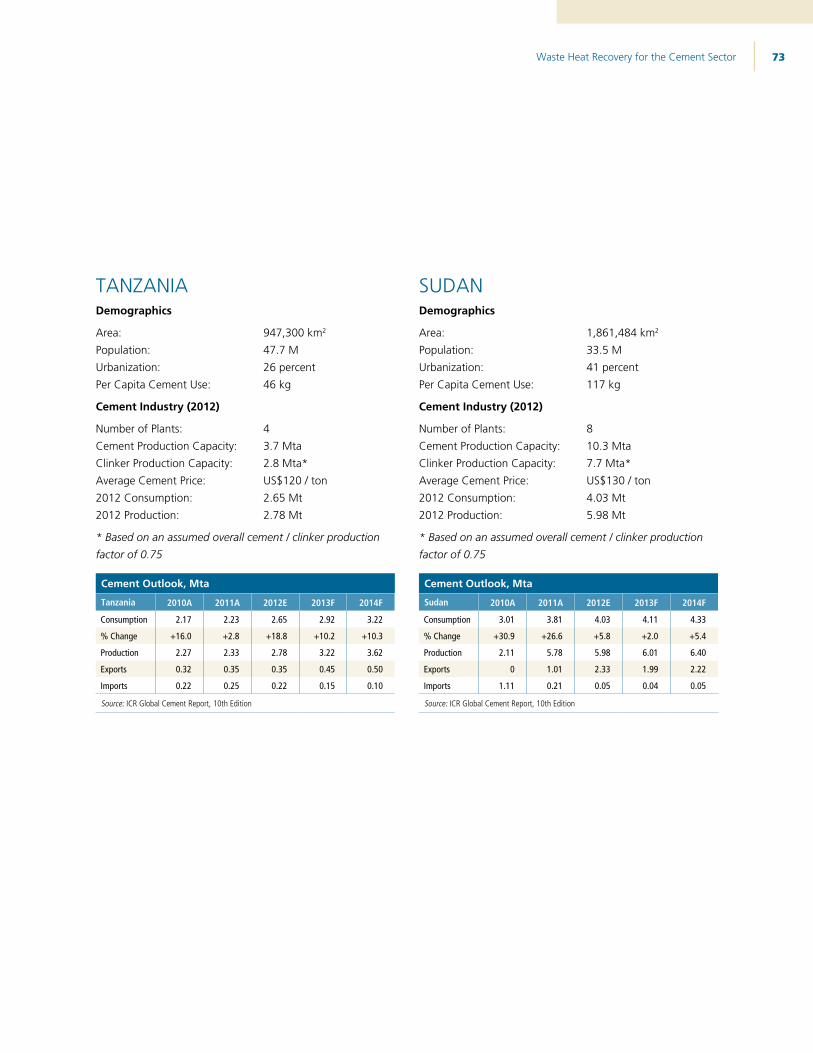
Waste Heat Recovery for the Cement Sector 73
TANZANIADemographics
Area: 947,300 km2
Population: 47.7 MUrbanization: 26 percentPer Capita Cement Use: 46 kg
Cement Industry (2012)
Number of Plants: 4Cement Production Capacity: 3.7 MtaClinker Production Capacity: 2.8 Mta*Average Cement Price: US$120 / ton2012 Consumption: 2.65 Mt2012 Production: 2.78 Mt
* Based on an assumed overall cement / clinker production factor of 0.75
Cement Outlook, Mta
Tanzania 2010A 2011A 2012E 2013F 2014F
Consumption 2.17 2.23 2.65 2.92 3.22
% Change +16.0 +2.8 +18.8 +10.2 +10.3
Production 2.27 2.33 2.78 3.22 3.62
Exports 0.32 0.35 0.35 0.45 0.50
Imports 0.22 0.25 0.22 0.15 0.10
Source: ICR Global Cement Report, 10th Edition
SUDANDemographics
Area: 1,861,484 km2
Population: 33.5 MUrbanization: 41 percentPer Capita Cement Use: 117 kg
Cement Industry (2012)
Number of Plants: 8Cement Production Capacity: 10.3 MtaClinker Production Capacity: 7.7 Mta*Average Cement Price: US$130 / ton2012 Consumption: 4.03 Mt2012 Production: 5.98 Mt
* Based on an assumed overall cement / clinker production factor of 0.75
Cement Outlook, Mta
Sudan 2010A 2011A 2012E 2013F 2014F
Consumption 3.01 3.81 4.03 4.11 4.33
% Change +30.9 +26.6 +5.8 +2.0 +5.4
Production 2.11 5.78 5.98 6.01 6.40
Exports 0 1.01 2.33 1.99 2.22
Imports 1.11 0.21 0.05 0.04 0.05
Source: ICR Global Cement Report, 10th Edition
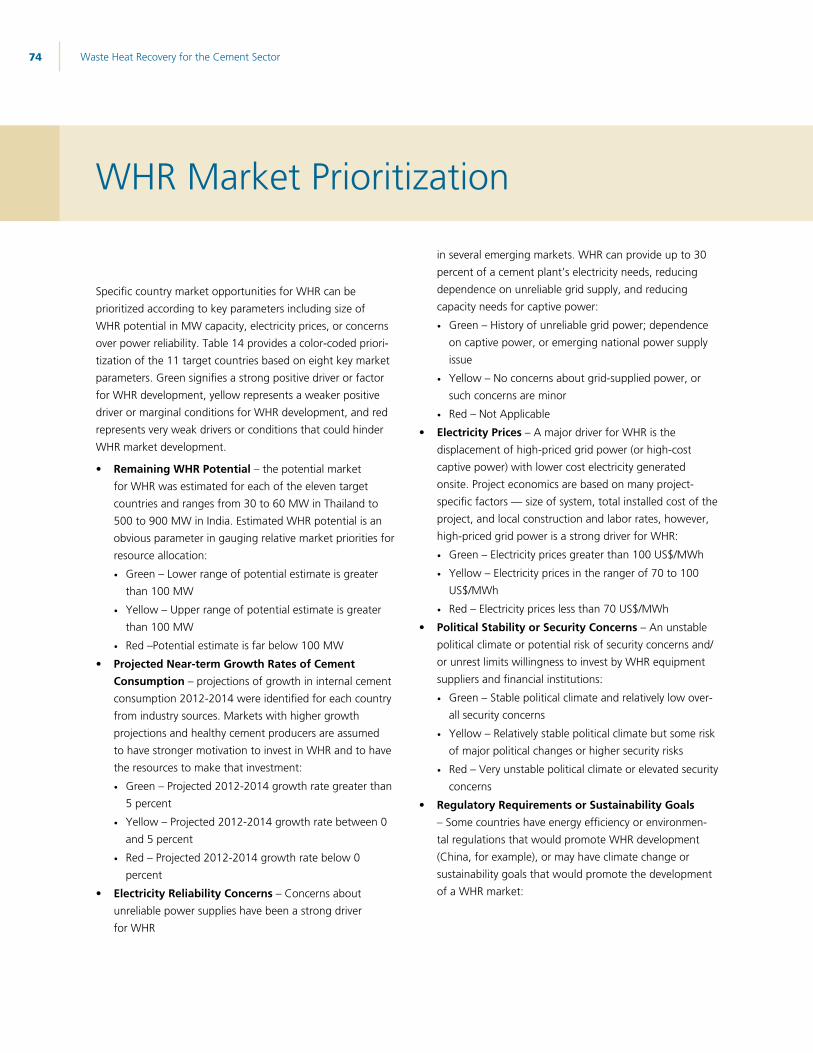
Waste Heat Recovery for the Cement Sector 74
WHR Market Prioritization
Specific country market opportunities for WHR can be prioritized according to key parameters including size of WHR potential in MW capacity, electricity prices, or concerns over power reliability. Table 14 provides a color-coded priori-tization of the 11 target countries based on eight key market parameters. Green signifies a strong positive driver or factor for WHR development, yellow represents a weaker positive driver or marginal conditions for WHR development, and red represents very weak drivers or conditions that could hinder WHR market development.
Remaining WHR Potential – the potential market for WHR was estimated for each of the eleven target countries and ranges from 30 to 60 MW in Thailand to 500 to 900 MW in India. Estimated WHR potential is an obvious parameter in gauging relative market priorities for resource allocation:
· Green – Lower range of potential estimate is greater than 100 MW
· Yellow – Upper range of potential estimate is greater than 100 MW
· Red –Potential estimate is far below 100 MW
Projected Near-term Growth Rates of Cement Consumption – projections of growth in internal cement consumption 2012-2014 were identified for each country from industry sources. Markets with higher growth projections and healthy cement producers are assumed to have stronger motivation to invest in WHR and to have the resources to make that investment:
· Green – Projected 2012-2014 growth rate greater than 5 percent
· Yellow – Projected 2012-2014 growth rate between 0 and 5 percent
· Red – Projected 2012-2014 growth rate below 0 percent
Electricity Reliability Concerns – Concerns about unreliable power supplies have been a strong driver for WHR
in several emerging markets. WHR can provide up to 30 percent of a cement plant’s electricity needs, reducing dependence on unreliable grid supply, and reducing capacity needs for captive power:
· Green – History of unreliable grid power; dependence on captive power, or emerging national power supply issue
· Yellow – No concerns about grid-supplied power, or such concerns are minor
· Red – Not Applicable
Electricity Prices – A major driver for WHR is the displacement of high-priced grid power (or high-cost captive power) with lower cost electricity generated onsite. Project economics are based on many project-specific factors — size of system, total installed cost of the project, and local construction and labor rates, however, high-priced grid power is a strong driver for WHR:
· Green – Electricity prices greater than 100 US$/MWh
· Yellow – Electricity prices in the ranger of 70 to 100 US$/MWh
· Red – Electricity prices less than 70 US$/MWh
Political Stability or Security Concerns – An unstable political climate or potential risk of security concerns and/or unrest limits willingness to invest by WHR equipment suppliers and financial institutions:
· Green – Stable political climate and relatively low over-all security concerns
· Yellow – Relatively stable political climate but some risk of major political changes or higher security risks
· Red – Very unstable political climate or elevated security concerns
Regulatory Requirements or Sustainability Goals – Some countries have energy efficiency or environmen-tal regulations that would promote WHR development (China, for example), or may have climate change or sustainability goals that would promote the development of a WHR market:
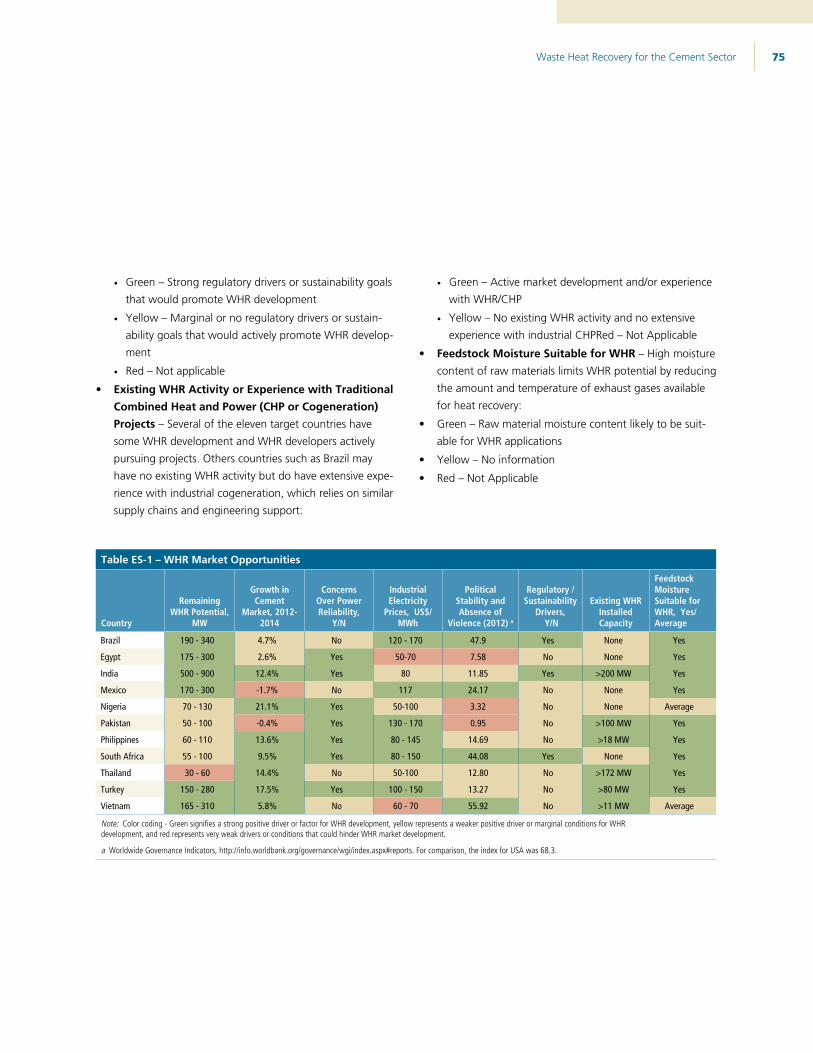
Waste Heat Recovery for the Cement Sector 75
· Green – Strong regulatory drivers or sustainability goals that would promote WHR development
· Yellow – Marginal or no regulatory drivers or sustain-ability goals that would actively promote WHR develop-ment
· Red – Not applicable
Existing WHR Activity or Experience with Traditional Combined Heat and Power (CHP or Cogeneration) Projects – Several of the eleven target countries have some WHR development and WHR developers actively pursuing projects. Others countries such as Brazil may have no existing WHR activity but do have extensive expe-rience with industrial cogeneration, which relies on similar supply chains and engineering support:
· Green – Active market development and/or experience with WHR/CHP
· Yellow – No existing WHR activity and no extensive experience with industrial CHPRed – Not Applicable
Feedstock Moisture Suitable for WHR – High moisture content of raw materials limits WHR potential by reducing the amount and temperature of exhaust gases available for heat recovery:
Green – Raw material moisture content likely to be suit-able for WHR applications
Yellow – No information
Red – Not Applicable
Table ES-1 – WHR Market Opportunities
Country
Remaining WHR Potential,
MW
Growth in Cement
Market, 2012- 2014
Concerns Over Power Reliability,
Y/N
Industrial Electricity
Prices, US$/MWh
Political Stability and Absence of
Violence (2012) a
Regulatory / Sustainability
Drivers, Y/N
Existing WHR Installed Capacity
Feedstock Moisture Suitable for WHR, Yes/Average
Brazil 190 - 340 4.7% No 120 - 170 47.9 Yes None Yes
Egypt 175 - 300 2.6% Yes 50-70 7.58 No None Yes
India 500 - 900 12.4% Yes 80 11.85 Yes >200 MW Yes
Mexico 170 - 300 -1.7% No 117 24.17 No None Yes
Nigeria 70 - 130 21.1% Yes 50-100 3.32 No None Average
Pakistan 50 - 100 -0.4% Yes 130 - 170 0.95 No >100 MW Yes
Philippines 60 - 110 13.6% Yes 80 - 145 14.69 No >18 MW Yes
South Africa 55 - 100 9.5% Yes 80 - 150 44.08 Yes None Yes
Thailand 30 - 60 14.4% No 50-100 12.80 No >172 MW Yes
Turkey 150 - 280 17.5% Yes 100 - 150 13.27 No >80 MW Yes
Vietnam 165 - 310 5.8% No 60 - 70 55.92 No >11 MW Average
Note: Color coding - Green signifies a strong positive driver or factor for WHR development, yellow represents a weaker positive driver or marginal conditions for WHR development, and red represents very weak drivers or conditions that could hinder WHR market development.
a Worldwide Governance Indicators, http://info.worldbank.org/governance/wgi/index.aspx#reports. For comparison, the index for USA was 68.3.
Waste Heat Recovery for the Cement Sector 76
References
Abo Sena, Ali., 2013, Personal Communications, Director, Egypt National Cleaner Production Centre (ENCPC), Ministry of Industry and Foreign Trade, December 2013
All Pakistan Cement Manufacturers Association (APCMA), 2013, Statement of Industry Production Capacity, December 2013
Armstrong, T., 2012, The Cement Industry in Figures, International Cement Review, 2012, http://www.ficem.org/pres/THOMAS-ARMSTRONG-LA-INDUSTRIA-DEL-CEMENTO-EN-CIFRAS.pdf
Aydınç, O uz., 2013. Personal Communications, Quality, Environment and H&S Manager at Nuh Cement, December 2013
Bank of China International (BOCI), 2011, China Cement Sector, Bank of China, May 2011
Barcelo, L., Kline. J., 2012, The Cement Industry Roadmap to Reduce carbon Emissions, Carbon Management technology Conference, 2012
Bhardwaj, S., 2010, Future Trends in Waste Heat recovery in Cement Plants, Green Cemtech, Hyderabad, 2010
Brazil National Department of Mineral Production, 2007, Minerals Yearbook 2007, http://www.dnpm.gov.br/enportal/conteudo .asp?IDSecao=170&IDPagina=1093
Brazil Update, 2012, http://www.newsletter.inventuremanagement.com/brazil-kwh-cost-among-most-expensive/
Bundela, P.S., Chawla, V., 2010, Sustainable Development through Waste Heat Recovery, American Journal of Environmental Sciences, 6 (1), 83-98, 2010
CEE Resources, 2012, Investment in Low Carbon: Financing Waste Heat Recovery for Power Generation in China, Sui Yuanchun, 1st Global CemPower, London, June 2012
Cement Manufacturers Association of the Philippines (CeMAP), 2013, 2012 Annual Cement Industry Report, 2013
CemNet, 2013, Global Plant Database, 2013, http://www.cemnet.com/members/gcr/
Center for Study of Science, Technology and Policy, 2012, A Study of Energy Efficiency in the Indian Cement Industry, March 2012
Central Intelligence Agency, 2013, World Factbook, County Profiles, https://www.cia.gov/library/publications/the-world-factbook/docs/profileguide.html
China Cement Association (CCA), 2011, The Development of China Cement Industry, Qianzhi, Lei, October 2011, Izmit, Turkey
China Cement Association (CCA), 2013, 2012 Cement Industry Capacity and Production Status, 2013, http://www.cement114 .com/hybg_view.asp?id=38023&utype=91
China Cement Net, 2009, Cogeneration Glory for the Cement Industry, Zeng Xuemin, March 2009, http://www.ccement.com/news/2009/3-24/C173029625.htm
Waste Heat Recovery for the Cement Sector 77
China Cement Net, 2011, Building Materials Industry: Second Five Year Development Guidance, China Buildings Materials Federation (CBMF), April 2011,http://www.dcement.com/Article/201107/99014.html
Competition Commission of India, 2013a, Assessment of Competition in Cement Industry in India, 2013
Competition Commission of India, 2013b, Case No. 09 of 2013, Transparent Energy Systems Pct, Ltd vs. Tecpro Systems Ltd, 2013
Conch, 2013, Operation Data Summarized, http//English.conch.cn/sm2111111241.asp
Confederation of Indian Industry (CII), 2009, Desk Study on Waste Heat Recovery Potential in Indian Cement Industry, Final Report, April 2009
Crow, J. M., 2008, The Concrete Conundrum, Chemistry World, March 2008
CW Research Global Cement Volume Forecast report (GCVFR), CW Group, February 2014
Dalian East New Energy Development Co., 2009, Waste Heat Recovery Power Generation Engineering Technical Guidance, May 2009
Dalian East New Energy Development Co., 2013a, List of Achievements in WHR Power Generation for Cement Kilns
Dalian East New Energy Development Ltd, 2013b, The Profile of WHR Technology of Dalian East, 2nd Global CemPower, London, June 2013
Enerdata, 2013, - Vietnam Announces Draft of Electricity Retail Price, March 2013, http://www.enerdata.net/enerdatauk/press-and-publication/energy-news-001/vietnam-announces-draft-electricity-retail-price_17458.html#sthash.iptNnmll.dpuf
Edwards, P., 2012a, Brazil Cement Focus, Global Cement Magazine, February 2012
Edwards, P., 2012b, Cement in Vietnam, Global Cement Magazine, April 2012
Edwards, P., 2012c, North African Regional Cement Focus, Global Cement Magazine, October 2012
Edwards, P., 2012d, West African Cement Focus, Global Cement Magazine, November 2012
Edwards, P., 2013a, Incredible Indian Cement Industry, Global Cement Magazine, February 2013
Edwards, P., 2013b, Turkish Cement Focus, Global Cement Magazine, March 2013
Edwards, P., 2013c, Nuh Cimento: Looking Ahead with Alternative Fuels and Waste Heat Recovery, Global Cement Magazine, March 2013
Edwards, P., 2013d, China: First in Cement, Global Cement Magazine, July 2013
Edwards, P., 2013e, North African Cement Focus, Global Cement Magazine, October 2013
Waste Heat Recovery for the Cement Sector 78
Environmental Protection Agency (EPA), 2010, Available and Emerging Technologies for Reducing Greenhouse Gas Emissions from the Portland Cement Industry, October 2010
Environmental Protection Agency (EPA), 2012, Waste Heat to Power Fact Sheet, EPA CHP Paretnership, 2012
Express Tribune, 2013a, Clash of Clans: Cement Makers Face Split in their Ranks, August 4, 2013, http://tribune.com.pk/story/597088/clash-of-clans-cement-makers-face-split-in-their-ranks/
Express Tribune, 2013b, Cost of Production: High Electricity Rates Spread Panic, August 18, 2013, http://tribune.com.pk/story/591588/cost-of-production-high-electricity-rates-spread-panic/
Express Tribune, 2013c, Energy Crisis, Gas Prices Increased for Captive Power Plants, August 23, 2013, http://tribune.com.pk/story/594496/energy-crisis-gas-prices-increased-for-captive-power-plants/
FLSmidth, 2012, Waste Heat Recovery Systems now an Integral Part of FLSmidth’s offerings, April 2012
FLSmidth, 2013, Waste Heat Recovery, http//www.flsmidth.com/en-US/Services+and+Capabilities/Waste+Heat+Recovery
Getting the Numbers Right (GNR) Database, WBCSD Cement Sustainability Initiative, http://www.wbcsdcement.org/index.php/key-issues/climate-protection/gnr-database
Gibbons, T., 2013, WHR in the Cement Industry, World Cement, August 2013,
Global Cement Magazine, 2013, Energy Tariff Increases Spark Discord in Pakistan’s Cement Industry, September 2013
GNR Database, 2013, World Business Council for Sustainable Development, Cement Sustainability Initiative, http//www.wbcsdcment.org/GNR-2011/
Government of the Republic of South Africa, 2011, National Climate Change Response White Paper, October 2011, http://rava.qsens.net/themes/theme_emissions/111012nccr-whitepaper.pdf
Hassan, L., 2013, Egypt’s Battle around Coal, Ahram Online, December 19, 2013, http://english.ahram.org.eg/NewsContent/1/151/89495/Egypt/Features/-Egypts-battle-around-coal.aspx
Heidelberg Cement, 2013, WHPG at Heidelberg Cement: Potential Evaluation & Operational Experience, Jan Theulen, 2ndGlobal CemPower, London, June 2013
Holcim, 2011, Untervaz Plant Improves Energy-Efficiency by 20percent by using ABB Low-temperature ORC Technology, Global Cement Magazine, June, 2011
Holcim, 2012, Heat Recovery Project, CAP Technology Review Meeting, December 4, 2012
Holcim, 2013, Experience and Challenges in Waste Heat Recovery, Urs Herzog, Thomas Lamare, 2nd Global CemPower, London, June 2013
Indian Ministry of Industry and Commerce (IMIC), 2011, Report of the Working Group on Cement Industry for XII Five Year Plan, December 2011
International Cement Review (ICR), 2103, The Global Cement Report 10th Edition, March 2013
International Energy Agency, 2012, Energy Prices and Taxes, Quarterly Report, 2012
Waste Heat Recovery for the Cement Sector 79
Jamcem Consulting, 2012, Chinese or European – Capital and Operating Cost Implications for New Cement Projects, 1st Global CemPower, London, June 2012
Kawasaki Heavy Industries, 2012, Kawasaki Global Solution for Cement Waste Heat, 1st Global CemPower, London, June 2012
Kawasaki Heavy Industries, 2013, 2nd Global CemPower, London, June 2013
Khattak, Z., Khan, J.A., Ahmad, A., Shah, S., Masaud, S, 2012, Cogeneration of Power through Waste Heat Recovery: a Cement Plant Case Study, 2012 International Conference on Future Electrical Power and Energy Systems
Lawrence Berkeley National Laboratory (LBNL), 2008, Energy Efficiency Improvement Opportunities for the Cement Industry, Worrell, Galitsky, Price, January 2008
Lechtenberg, M., 2012, Top 20 Cement Companies, Global Cement Magazine, December 2012, http://www.globalcement.com/magazine/articles/741-top-20-global-cment-companies
MaCaffrey, R., 2013, Seven Megatrends in the Global Cement Industry, 2nd Global CemPower, London, June 2013
Madlool, N., Saidur, R., Hossain, H., Rahim, N., 2011, A Critical Review on Energy Use and Savings in the Cement Industries, Renewable and Sustainable Energy Reviews, 2011
Meralca, 2014, Electricity Rate Tables, January 2014, http://www.meralco.com.ph/customer/page-cusCare-billRates.html
Ministry of Industry and Information Technology of the People’s Republic of China MIIT), 2010, State Council Circular on Further Strengthening the Elimination of Backward Production Capacity, April 2010, http://www.miit.gov.cn/n11293472/n11293877/n13138101/n13138118/13138196.html
Mirolli, D., 2012, Kalina Cycle Power Systems in Waste Heat Recovery Applications, Global Cement Magazine, August 2012
Nanjing Kesen Kenen Environment & Energy LTD, 2013, Development and Application of WHR Technology, 2nd Global CemPower, London, June 2013
National Energy Regulator of South Africa (NERSA), 2013, Electricity Prices and Tariffs, December 2013, http://www.nersa.org.za/#
National Power Corporation, 2104, Electricity Tariffs, January 2014, http://www.napocor.gov.ph/
NUS Consulting, 2013, 2011-2013 International Electricity & Natural Gas Report & Price Survey, June 2013, http://www.kraftaffarer.se/meralasning/2012E&GSurvey.pdf
One Research, 2012, Trends in Waste Heat Recovery in the Global Cement Industry, 1st Global CemPower, London, June 2012
OneStone Research, 2013, Latest Waste Heat Utilization Trends in Cement Plants, J. Harder, 2nd Global CemPower, London, June 2013
Ormat Technologies Inc., 2010, Ormat Energy Converters Proven Power from Cement Plant Waste Heat, http//www.ormat.com
Penta Engineering Corp, Feasibility of Waste Heat Recovery Applications in the Cement Industry, M. Jayaraman, F., Benavides, 1st Global CemPower, London, June 2012
Rahbord Engineering Services Co. / Nanjing Triumph Kaineng Environmental & Energy Co. (RES/NTK), 2010, Introduction of Low-Temperature Waste Heat Power Generation Technology in Cement Kilns, November 2010
Waste Heat Recovery for the Cement Sector 80
Saunders, A., 2013, Top 75 Cement Companies, Global Cement Magazine, December 2013, http://www.globalcement.com/magazine/articles/822-top-75-global-cment-companies
Societe Generale Securities, 2012, China Cement Industry: 2011 New Clinker Production Capacity, February 2012, http://stock.jrj.com.cn/invest/2012/02/23131312323783.shtml
Shakti, 2013, Technology Compendium of Energy Efficiency Opportunities for Cement, August 2013
Sindicato Nacional da Indústrial do Cimento, ‘Relatorio 2010,’ http://www.snic.org.br/pdf/snic-relatorio2010-11_web.pdf.
Sinoma Energy Conservation Ltd, 2012, Waste Heat Recovery Status and Trends in China, 1st Global CemPower, London, June 2012
Sinoma Energy Conservation Ltd., 2013, Comprehensive WHR package Solutions, 2nd Global CemPower, London, June 2013
Specifying Blended Cements for Performance and Strength, LaFarge, http://www.lafarge-na.com/Constr%20Spec%209-03%20Blends.pdf, 2013
Hefei Fung Tak Technology, 2012, China Cement Industry’s De-nitrification Processes, 2012, http://wenku.baidu.com/view/f02400ddc1c708a1284a4449.html
Tecpro Systems Limited, 2013, EPC Power Division, http//www.tecprosystems.com/epc_powewr.php
Tecpro Systems Ltd., 2012, Current Status and Future Trends in Waste Heat Recovery in the Indian Cement Industry, S.P. Ganeshan, 1st Global CemPower, London, June 2012
The Nation, 2013, Power tariff Hike Back with no Cnage, October 23, 2013, http://www.nation.com.pk/national/11-Oct-2013/power-tariff-hike-back-with-no-change
Turboden, 2012, Turn Waste Heat into Value: the Dependable Turboden ORC Solutions, 1st Global CemPower, London, June 2012
Turkish Cement Manufacturers Association, 2013, Annual Capacity Data, 2013, http://www.tcma.org.tr/ENG/index.php?page=icerikgoster&menuID=1
U.S. Department of Energy (USDOE), 2003, Energy and Emissions Reduction Opportunities for the Cement Industry
U.S. Department of Energy, 2013a, International Energy Outlook – Countries, Energy Information Administration, 2013, http://www.eia.gov/countries/
U.S. Department of Energy, 2013b, International Energy Outlook – International Energy Statistics, Energy Information Administration, 2013, http://www.eia.gov/countries/data.cfm
U.S. Geological Survey (USGS), 2013, Cement – Mineral Commodity Summary, Page 39, January 2013
U.S. Geological Survey (USGS), 2014, Cement – Mineral Commodity Summary, Page 39, February 2014
World Alliance for Decentralized Energy (WADE), 2007, Concrete Energy Savings – Onsite Power in the Cement Sector, March, 2007, http/www.localpower.org
Waste Heat Recovery for the Cement Sector 81
World Bank, 2013, Country Profiles, http://data.worldbank.org/country
World Business Council for Sustainable Development / International Energy Agency (WBCSD/IEA), 2009, Cement Technology Roadmap 2009
World Cement 2014, Cost Increases for Pakistani Producers with Captive Power Plants, Guinioui, K, January 2014, http://www.worldcement.com/news/cement/articles/Cost_increases_for_Pakistani_cement_producers_with_captive_power_plants_574.aspx#.UwJW5ZqYbIU


![In: Baldi, F, Nguyen, T-V., Ahlgren, F. (2016) and ...957811/FULLTEXT01.pdf · to-power waste heat recovery (WHR) solutions, specifically steam cycles and organic Rankine cycles [5].](https://static.fdocuments.net/doc/165x107/5fa4a81bcc1749708e44542e/in-baldi-f-nguyen-t-v-ahlgren-f-2016-and-957811fulltext01pdf-to-power.jpg)