Waste Biomass to Charcoal Briquettes in Tanzania
35
Waste Biomass to Charcoal Briquettes in Tanzania Regional Supply Potential – REPIC Project Report
Transcript of Waste Biomass to Charcoal Briquettes in Tanzania
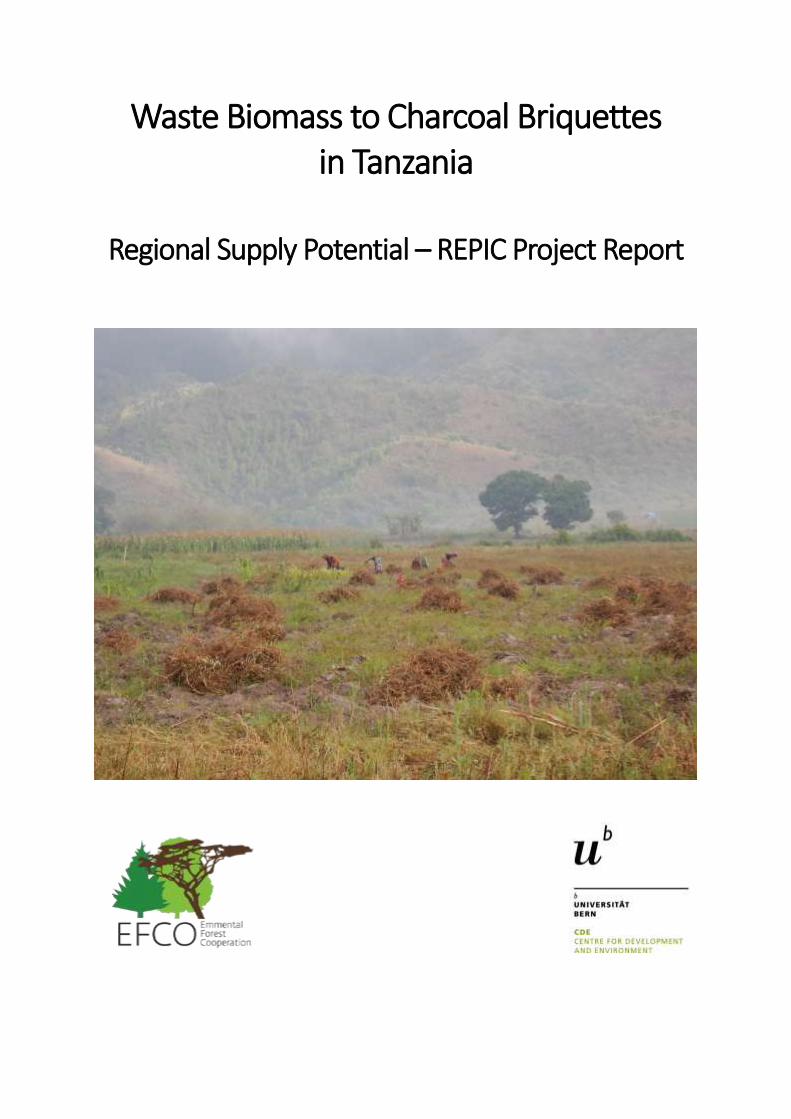
Waste Biomass to Charcoal Briquettes in Tanzania
Regional Supply Potential – REPIC Project Report

Waste Biomass to Charcoal Briquettes in Tanzania Regional Supply Potential – REPIC Project Report
2
Report to the Renewable Energy, Energy and Resource Efficiency Promotion in Developing and Tran-
sition Countries (REPIC) – Contract # 2016.08
REPIC project page: http://www.repic.ch/repic-en/projects/ongoing-projects/resource-effi-
ciency/efco-tanzania/
Bern, 16. February 2019
Authors:
Roger Bär Centre for Development and Environment (CDE), University of Bern Mittelstrasse 43, 3012 Bern, Switzerland [email protected]
Michael Curran Emmental Forest Cooperation (EFCO) and Büro Weichen stellen Dorfstrasse 16, 3555 Trubschachen [email protected]
Suggested citation: Bär, R. and Curran, M. (2019). Waste Biomass to Charcoal Briquettes in Tanzania Regional Supply Potential – REPIC Project Report. Centre for Development and Environment (CDE) of the University of Bern and Emmental Forest Cooperation (EFCO). Report to the Renewable Energy, Energy and Resource Efficiency Promotion in Developing and Transition Countries (REPIC). Ursen, Switzerland.
Waste Biomass to Charcoal Briquettes in Tanzania Regional Supply Potential – REPIC Project Report
3
Table of Contents 1 Introduction ..................................................................................................................................... 5
1.1 Context .................................................................................................................................... 5
1.2 The “Waste Biomass to Charcoal Briquettes in Tanzania” project ......................................... 5
1.3 Objective and outputs ............................................................................................................. 6
2 Methods .......................................................................................................................................... 8
2.1 Case study area ....................................................................................................................... 8
2.2 Approach ................................................................................................................................. 9
2.3 Land classification.................................................................................................................. 11
2.3.1 Acquisition and pre-possessing of satellite imagery ..................................................... 11
2.3.2 Land cover data sampling .............................................................................................. 11
2.3.3 Land cover classification ................................................................................................ 15
2.4 Biomass estimation ............................................................................................................... 15
2.4.1 Sub-plot sampling strategy ............................................................................................ 15
2.4.2 Aggregation of sub-plots ............................................................................................... 16
2.4.3 Calculation of dry weight ............................................................................................... 16
2.4.4 Forestry aggregation over time ..................................................................................... 16
2.4.5 Estimation of land cover class productivity ................................................................... 16
2.5 Scenarios of biomass harvesting and briquette production ................................................. 17
3 Results ........................................................................................................................................... 20
3.1 Land cover classification ........................................................................................................ 20
3.1.1 Land cover ..................................................................................................................... 20
3.1.2 Supply sources ............................................................................................................... 21
3.2 Biomass estimation ............................................................................................................... 23
3.2.1 Productivity ................................................................................................................... 23
3.2.2 Magunguli supply catchment ........................................................................................ 24
3.3 Scenarios of upscaling production across the landscape ...................................................... 25
3.3.1 Supply potential map .................................................................................................... 25
3.3.2 Potential facility sites and biomass harvest areas for the upscaling scenario .............. 25
3.4 Impact assessment of upscaling ............................................................................................ 28
3.4.1 Production and job creation .......................................................................................... 28
3.4.2 Meeting charcoal demand............................................................................................. 28
3.4.3 Avoided environmental impacts ................................................................................... 29
4 Discussion and conclusion ............................................................................................................. 30
5 References ..................................................................................................................................... 33
6 Appendix ........................................................................................................................................ 36
Waste Biomass to Charcoal Briquettes in Tanzania Regional Supply Potential – REPIC Project Report
4
6.1 Scripts .................................................................................................................................... 36
6.1.1 Pre-process the composite images ............................................................................... 36
6.1.2 Analyse data coverage of input stack ............................................................................ 37
6.1.3 Land use classification ................................................................................................... 38
6.1.4 Analyse training data ..................................................................................................... 41
6.1.5 Validate results .............................................................................................................. 43
6.1.6 Estimate the biomass supply ......................................................................................... 44
6.1.7 Calculate the potential biomass supply within different radii ...................................... 47
6.2 Input layers ............................................................................................................................ 49
6.3 Comparison of results forest plantation mapping ................................................................ 50
6.4 Biomass assessment .............................................................................................................. 51
6.5 Biomass pyrolysis trails .......................................................................................................... 53
6.6 Economic cost models of briquette production .................................................................... 54
6.6.1 Production cost data according to production system scenario ................................... 54
6.6.2 Production statistics and financial summary per production system scenario ............ 55
6.6.3 Employment statistics according to production system scenario ................................. 56
Waste Biomass to Charcoal Briquettes in Tanzania Regional Supply Potential – REPIC Project Report
5
1 Introduction
1.1 Context
Wood-based cooking fuels, notably firewood and charcoal, are currently the most widely used cook-
ing fuel in Tanzania (NBS and REA 2017). However, wood is being sourced often in an unsustainable
way leading to environmental degradation or local supply shortages (Mwampamba 2007; Ghilardi et
al. 2009; Ahrends et al. 2010). Currently, policies focus mainly on fossil based cooking fuels alterna-
tives such as LQP or paraffin. However, these fossil fuels contribute to increasing CO2 levels in the
atmosphere and thus to global warming. Furthermore, charcoal is a major income opportunity for
poor rural households and it unlikely that fossil cooking fuels could fully replace this income oppor-
tunity.
A promising alternative to firewood - and notably to charcoal - are char dust briquettes. Char dust
briquettes are briquettes from carbonized biomass – typically biomass waste. In line with the wide
range of the possible biomass input, a wide range of briquette production technologies exist (Scholz
et al. 2014; Asamoah et al. 2016). From an economic point of view, studies show different and some-
times contradicting findings. On the one hand, for instance, it has been claimed that the average cost
per energy output of briquettes is more than twice than that of charcoal (Tumutegyereize et al.
2016) but on the other hand, that briquettes are in a price range that makes them competitive with
charcoal. (Okoko et al. 2018). From an ecological point of view, studies agree fairly well on the ad-
vantages of consumption of char dust briquettes. They have the potential to lower the carbon foot-
print (Njenga et al. 2014; Okoko et al. 2017), help alleviate environmental degradation (Njenga et al.
2013; Njenga et al. 2014; Bär et al. 2017), can increase access to renewable energy (Njenga et al.
2013), and provide new income opportunities (Ngusale et al. 2014).
Despite the above-mentioned advantages and potentials, the use of char dust briquettes for cooking
in Tanzania (NBS and REA 2017) and in sub-Saharan Africa (Kammila et al. 2014; Kappen et al. 2017)
is very marginal. Multiple studies have examined challenges that might present explanations to this
low use of briquettes, but also opportunities related to improve production, marketing, and con-
sumption of briquettes (Mwampamba et al. 2013; Ngusale et al. 2014; Njenga et al. 2014; Scholz et
al. 2014; Asamoah et al. 2016; Lohri et al. 2016). Asamoha et al. (2016), for instance, have identified
multiple drivers to success and challenges faced by briquette business. Main drivers to success are
the cost and availability of competing fuels, policy regulations, partnerships, consistency in the qual-
ity and supply of briquettes, the appropriate targeting of consumers, securing contacts with partners,
and an effective marketing strategy coupled with a good distribution system; the main barriers com-
prise regulatory barriers, financial barriers, and operational and market-related barriers.
1.2 The “Waste Biomass to Charcoal Briquettes in Tanzania” project
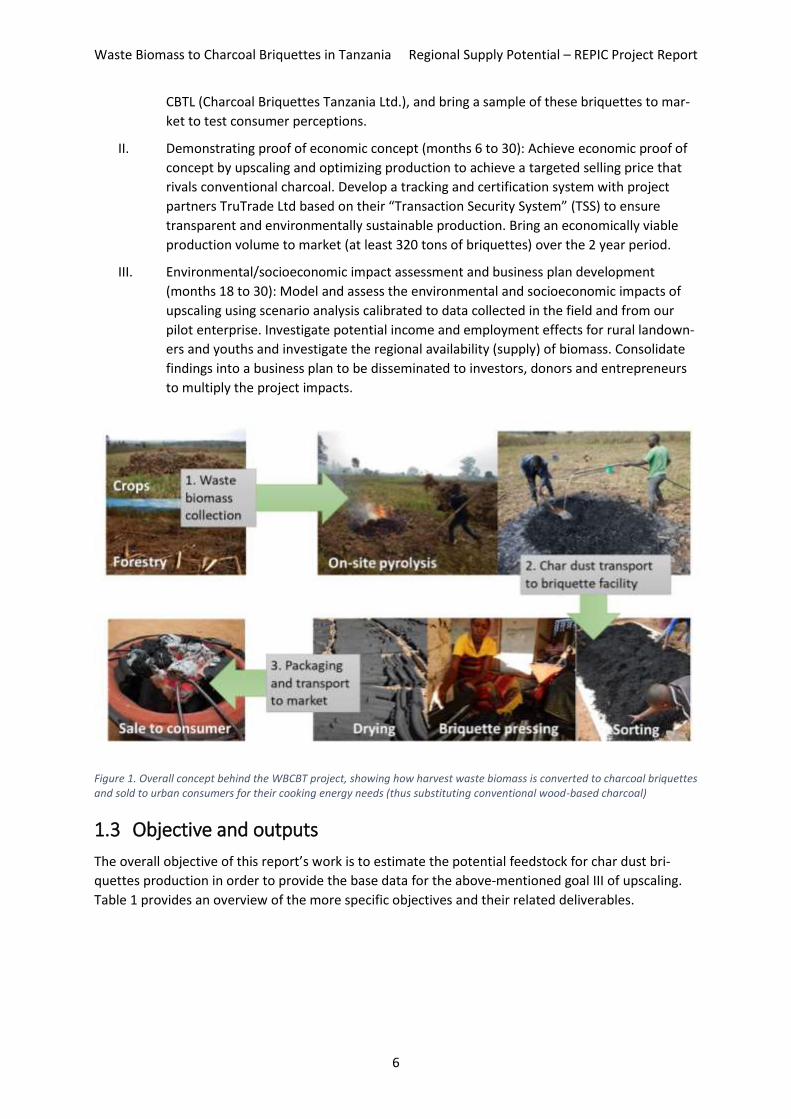
The REPIC co-funded project “Waste Biomass to Charcoal Briquettes in Tanzania” (WBCBT) launched
in September 2016. The overall goal was to promote charcoal production based on waste agricultural
and forestry biomass as a substitute for deforestation-based (conventional) wood charcoal. The pro-
ject is split into three project Phases (I-III) with respective goals of:
I. Demonstrating proof of operational concept (initial 6 months): Establish a pre-commer-
cial start-up enterprise and begin production of charcoal dust (char dust) using available
technology. Process the dust into charcoal briquettes with project partners ARTI (Appro-
priate Rural Technology Institute; http://arti-africa.org/) and their commercial spin-off
Waste Biomass to Charcoal Briquettes in Tanzania Regional Supply Potential – REPIC Project Report
6
CBTL (Charcoal Briquettes Tanzania Ltd.), and bring a sample of these briquettes to mar-
ket to test consumer perceptions.
II. Demonstrating proof of economic concept (months 6 to 30): Achieve economic proof of
concept by upscaling and optimizing production to achieve a targeted selling price that
rivals conventional charcoal. Develop a tracking and certification system with project
partners TruTrade Ltd based on their “Transaction Security System” (TSS) to ensure
transparent and environmentally sustainable production. Bring an economically viable
production volume to market (at least 320 tons of briquettes) over the 2 year period.
III. Environmental/socioeconomic impact assessment and business plan development
(months 18 to 30): Model and assess the environmental and socioeconomic impacts of
upscaling using scenario analysis calibrated to data collected in the field and from our
pilot enterprise. Investigate potential income and employment effects for rural landown-
ers and youths and investigate the regional availability (supply) of biomass. Consolidate
findings into a business plan to be disseminated to investors, donors and entrepreneurs
to multiply the project impacts.
Figure 1. Overall concept behind the WBCBT project, showing how harvest waste biomass is converted to charcoal briquettes and sold to urban consumers for their cooking energy needs (thus substituting conventional wood-based charcoal)
1.3 Objective and outputs
The overall objective of this report’s work is to estimate the potential feedstock for char dust bri-
quettes production in order to provide the base data for the above-mentioned goal III of upscaling.
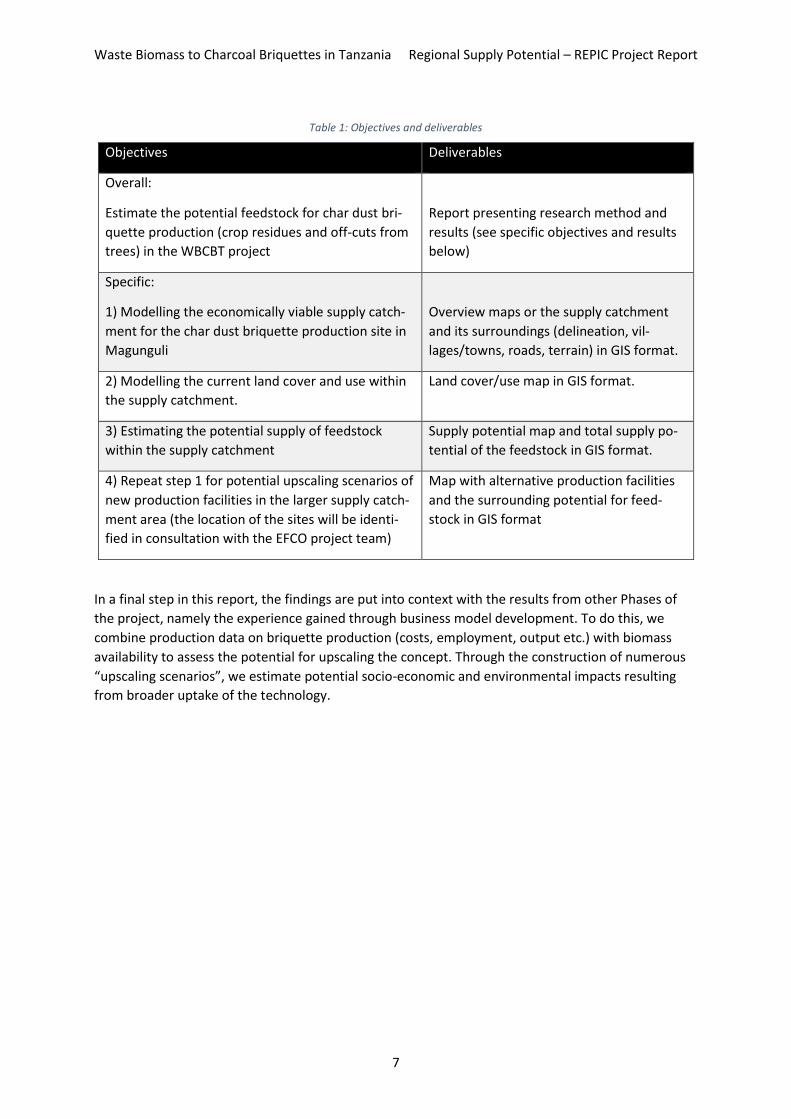
Table 1 provides an overview of the more specific objectives and their related deliverables.
Waste Biomass to Charcoal Briquettes in Tanzania Regional Supply Potential – REPIC Project Report
7
Table 1: Objectives and deliverables
Objectives Deliverables
Overall:
Estimate the potential feedstock for char dust bri-
quette production (crop residues and off-cuts from
trees) in the WBCBT project
Report presenting research method and
results (see specific objectives and results
below)
Specific:
1) Modelling the economically viable supply catch-
ment for the char dust briquette production site in
Magunguli
Overview maps or the supply catchment
and its surroundings (delineation, vil-
lages/towns, roads, terrain) in GIS format.
2) Modelling the current land cover and use within
the supply catchment.
Land cover/use map in GIS format.
3) Estimating the potential supply of feedstock
within the supply catchment
Supply potential map and total supply po-
tential of the feedstock in GIS format.
4) Repeat step 1 for potential upscaling scenarios of
new production facilities in the larger supply catch-
ment area (the location of the sites will be identi-
fied in consultation with the EFCO project team)
Map with alternative production facilities
and the surrounding potential for feed-
stock in GIS format
In a final step in this report, the findings are put into context with the results from other Phases of
the project, namely the experience gained through business model development. To do this, we
combine production data on briquette production (costs, employment, output etc.) with biomass
availability to assess the potential for upscaling the concept. Through the construction of numerous
“upscaling scenarios”, we estimate potential socio-economic and environmental impacts resulting
from broader uptake of the technology.
Waste Biomass to Charcoal Briquettes in Tanzania Regional Supply Potential – REPIC Project Report
8
2 Methods
2.1 Case study area
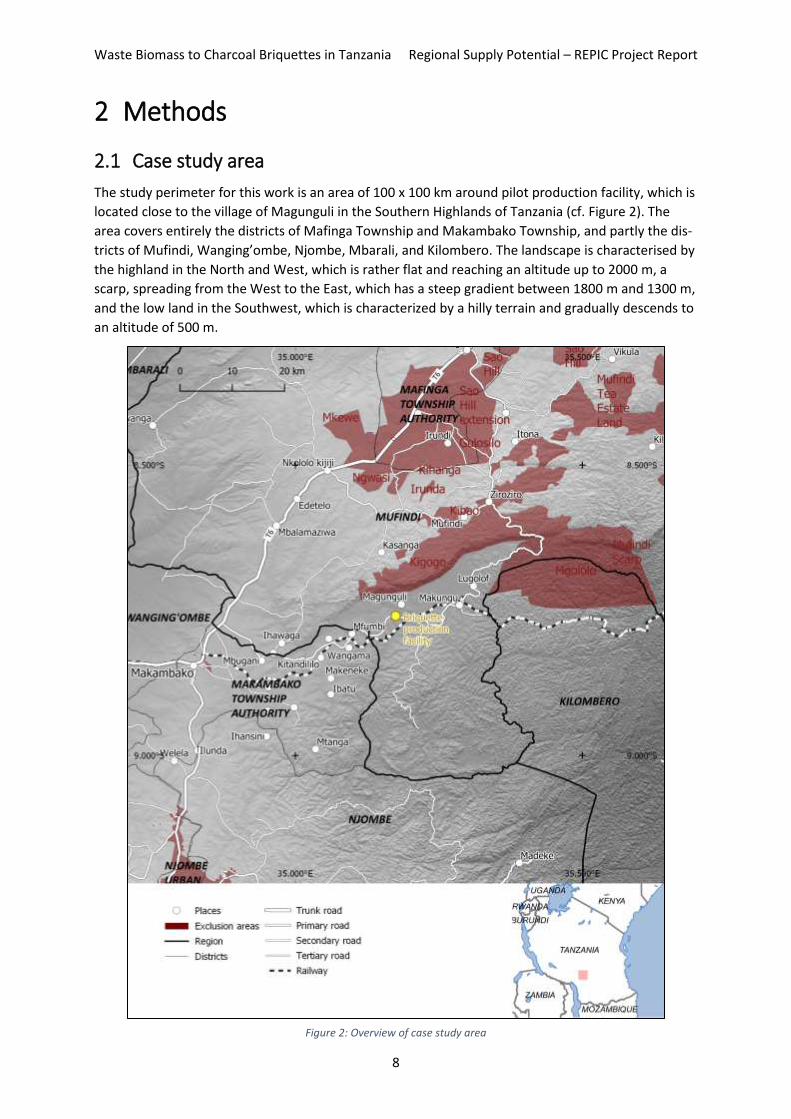
The study perimeter for this work is an area of 100 x 100 km around pilot production facility, which is
located close to the village of Magunguli in the Southern Highlands of Tanzania (cf. Figure 2). The
area covers entirely the districts of Mafinga Township and Makambako Township, and partly the dis-
tricts of Mufindi, Wanging’ombe, Njombe, Mbarali, and Kilombero. The landscape is characterised by
the highland in the North and West, which is rather flat and reaching an altitude up to 2000 m, a
scarp, spreading from the West to the East, which has a steep gradient between 1800 m and 1300 m,
and the low land in the Southwest, which is characterized by a hilly terrain and gradually descends to
an altitude of 500 m.
Figure 2: Overview of case study area
Waste Biomass to Charcoal Briquettes in Tanzania Regional Supply Potential – REPIC Project Report
9
The production food crops and the wood are the dominant productive land use types in the study
perimeter. Smallholdings cover the most of the productive land cultivating mainly maize and manag-
ing private forest plantations. Government institutions and private large-scale enterprises, however,
own and manage waste areas consisting mostly of forest plantations, tea plantations, and protected
forest reserves.
The closest potential target marked is Makambako. The town has a population of approximately
90,000 inhabitants and is located approximately 50 km west of the pilot production facility. Other po-
tential market are Njombe and Mafinga. Njombe has a population of approximately 130,000 persons
and is located 60 km south of Makambako; Mafinga has a population of approximately 50,000 per-
sons and is located 85 km northeast of Makambako. Both towns are situated outside the actual study
area, but are potential target markets due to the proximity to case study perimeter and the good
road infrastructure (paved trunk road T6) connecting them with Makambako and hence the pilot pro-
duction facility.
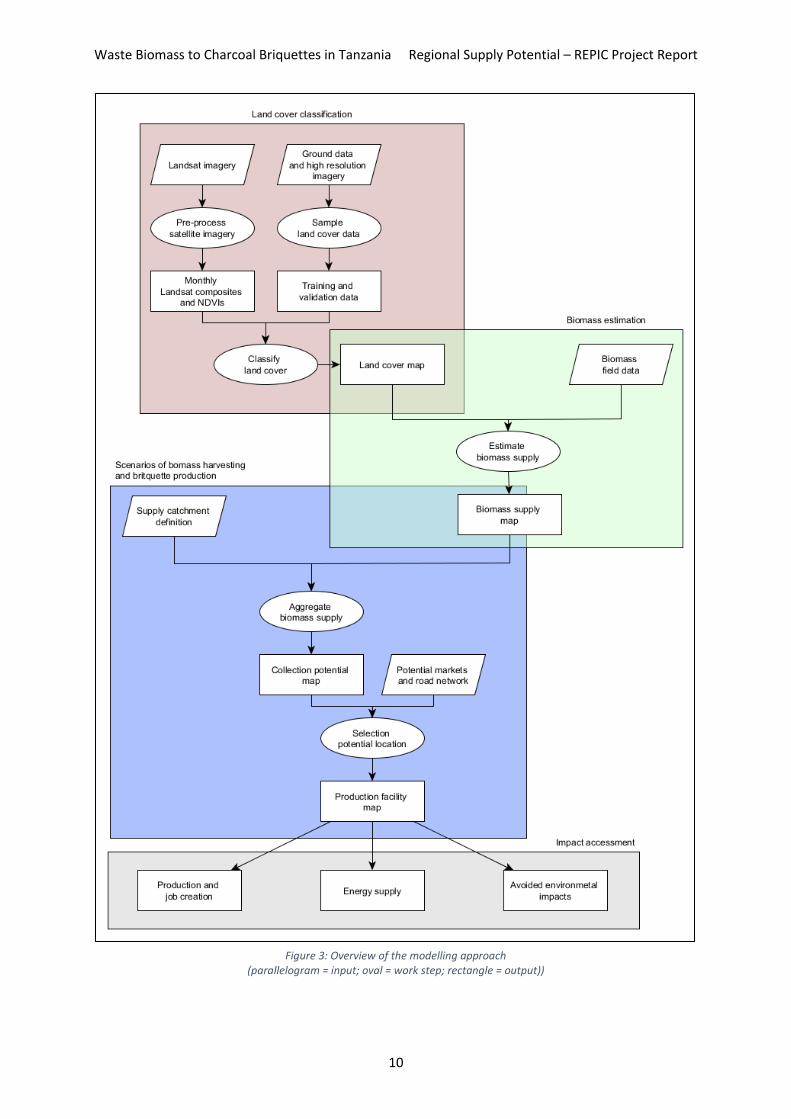
2.2 Approach
The approach to model the regional supply potential consists of four main work packages: 1) the land
classification, 2) the biomass estimation, 3) the scenarios of biomass harvesting and briquette pro-
duction, and 4) the impact assessment. The main corresponding outputs are a land classification map
presenting the different land classes of the case study areas, a biomass map presenting the potential
biomass supply from crop field and forest plantations, and a production facility map that indicates
potential sites for new briquette production facilities. Figure 3 gives an overview of the different
work steps; the following sections describe these work steps in more detail.
Waste Biomass to Charcoal Briquettes in Tanzania Regional Supply Potential – REPIC Project Report
10
Figure 3: Overview of the modelling approach
(parallelogram = input; oval = work step; rectangle = output))
Waste Biomass to Charcoal Briquettes in Tanzania Regional Supply Potential – REPIC Project Report
11
2.3 Land classification
2.3.1 Acquisition and pre-possessing of satellite imagery
The land classification uses Landsat imagery and its derived NDVI layers as input base data. In a first
step, we created monthly Landsat composites for the time between November 2015 and October
2018. In a second step, we created a Normalized Difference Vegetation Index (NDVI) layer for each
Landsat composite image.
For the creation of the monthly Landsat composites, we used the Google Earth Engine Image Pre-
processing Tool1 developed by the Centre for Development and Environment (Hurni et al. 2017). The
tool allows:
1) downloading Landsat imagery for a given area and time period
2) pre-pre-processing the images by applying a cloud masks and convert the images to top-of-
atmosphere (including topographic correction)
3) creating a mosaic using the pre-processed images
No data cells where subsequently set to -9999.
For each Landsat composite, we calculated the Normalise Difference Vegetation Index (NDVI) calcu-
lated as follows:
𝑁𝐷𝑉𝐼 =(NIR − Red)
(NIR + Red)
where red and NIR stand for the spectral reflectance values in the red and near-infrared regions, re-
spectively. The NDVI layers where computed using R (cf. Appendix: 6.1).
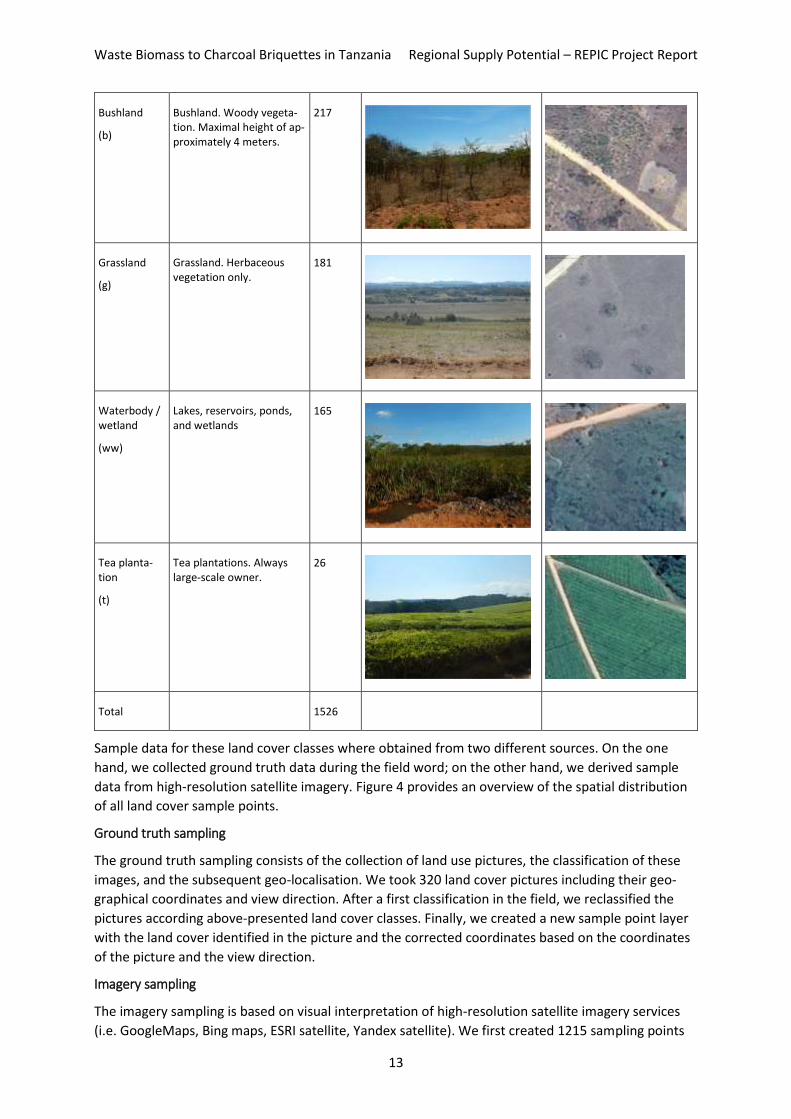
2.3.2 Land cover data sampling
Land cover classes
We distinguished between nine different land cover classes. Crop fields and forest plantations are
the relevant land cover types the potential supply of biomass residues. The remaining seven land
cover classes were included in order to improve the accuracy of the classification. However, classifi-
cation errors concerning these latter classes, i.e. class confusions among them, will not concern the
biomass estimations. Table 2 provides an overview of the nine land cover classes including a descrip-
tion and sample images of each class.
1 http://www.cde.unibe.ch/research/projects/a_tool_for_satellite_image_preprocessing_and_composition/index_eng.html

Waste Biomass to Charcoal Briquettes in Tanzania Regional Supply Potential – REPIC Project Report
12
Table 2: Land cover classes
Class Description Sample points
Photo (Field data)
High-resolution satellite im-agery (GoogleMaps)
Crop field
(c)
Plots for food crop pro-duction. Mostly maize.
281
Forest plan-tation
(fp)
Private forest plantations. Smallholder only. Mostly Pine and Eucalyptus
220
Dense natu-ral forest
(fd)
Natural forest. Closed can-opy cover
185
Sparse natu-ral forest
(fl)
Natural forest. Open can-opy cover
204
Urban / bare
(bu)
Areas or urban areas 56
Waste Biomass to Charcoal Briquettes in Tanzania Regional Supply Potential – REPIC Project Report
13
Bushland
(b)
Bushland. Woody vegeta-tion. Maximal height of ap-proximately 4 meters.
217
Grassland
(g)
Grassland. Herbaceous vegetation only.
181
Waterbody / wetland
(ww)
Lakes, reservoirs, ponds, and wetlands
165
Tea planta-tion
(t)
Tea plantations. Always large-scale owner.
26
Total 1526
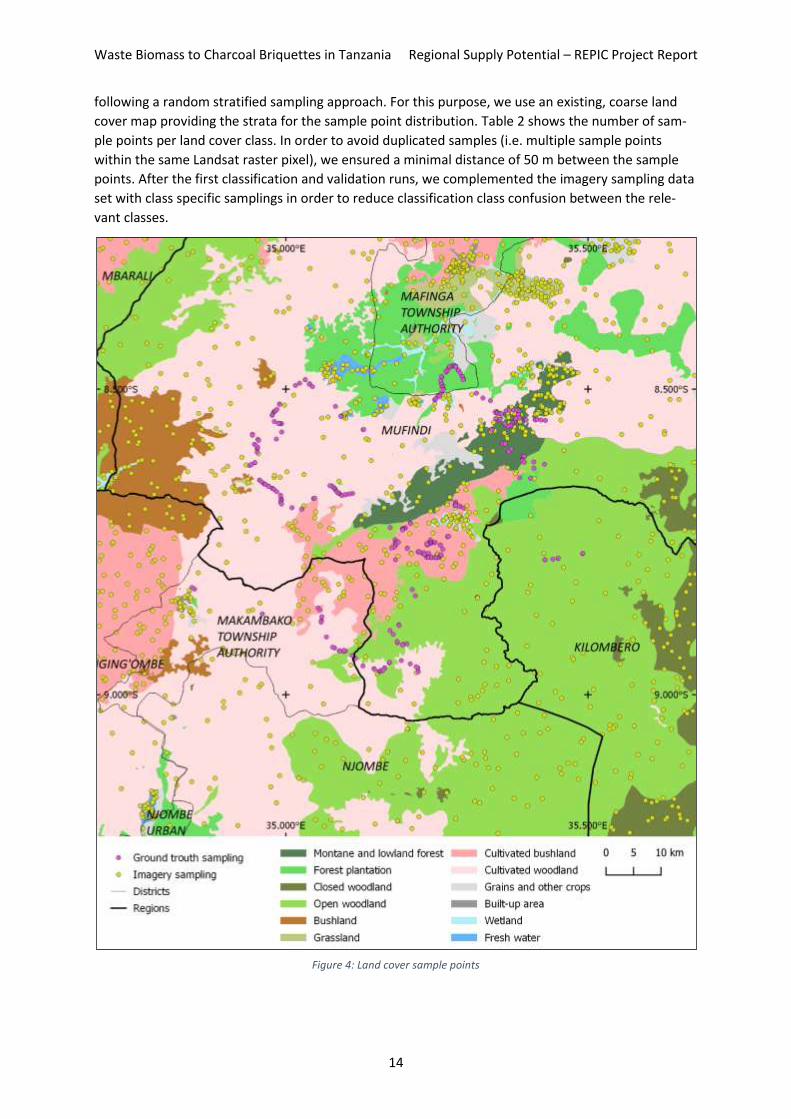
Sample data for these land cover classes where obtained from two different sources. On the one
hand, we collected ground truth data during the field word; on the other hand, we derived sample
data from high-resolution satellite imagery. Figure 4 provides an overview of the spatial distribution
of all land cover sample points.
Ground truth sampling
The ground truth sampling consists of the collection of land use pictures, the classification of these
images, and the subsequent geo-localisation. We took 320 land cover pictures including their geo-
graphical coordinates and view direction. After a first classification in the field, we reclassified the
pictures according above-presented land cover classes. Finally, we created a new sample point layer
with the land cover identified in the picture and the corrected coordinates based on the coordinates
of the picture and the view direction.
Imagery sampling
The imagery sampling is based on visual interpretation of high-resolution satellite imagery services
(i.e. GoogleMaps, Bing maps, ESRI satellite, Yandex satellite). We first created 1215 sampling points
Waste Biomass to Charcoal Briquettes in Tanzania Regional Supply Potential – REPIC Project Report
14
following a random stratified sampling approach. For this purpose, we use an existing, coarse land
cover map providing the strata for the sample point distribution. Table 2 shows the number of sam-
ple points per land cover class. In order to avoid duplicated samples (i.e. multiple sample points
within the same Landsat raster pixel), we ensured a minimal distance of 50 m between the sample
points. After the first classification and validation runs, we complemented the imagery sampling data
set with class specific samplings in order to reduce classification class confusion between the rele-
vant classes.
Figure 4: Land cover sample points
Waste Biomass to Charcoal Briquettes in Tanzania Regional Supply Potential – REPIC Project Report
15
2.3.3 Land cover classification
Classification
We ran the land cover classification based on pre-processed satellite imagery and the collected land
cover sampling data using the Random Forest algorithm (Breiman 2001). Beforehand, we split the
sampling data randomly into training and validation data by a 70-to-30 ratio. The corresponding R
script can be found in Appendix 6.1.
Exclusion areas
After the completion of the land cover classification, we defined manually exclusion areas. Such ex-
clusion areas comprise protected areas (Game controlled areas and forest reserves) and large forest
plantations owned by the government or private firms. These areas were considered not to be po-
tential biomass supply areas and there for excluded from the analysis at a later stage.
We obtained the exclusion from the World Database of Protected Areas (UNEP-WCMC 2018). The
perimeter of the areas where subsequently retraced based on the visual interpretation of high-reso-
lution satellite imagers (i.e. GoogleMaps, Bing maps, ESRI satellite, Yandex satellite) in order to adjust
the accuracy to the spatial resolution of the case study site’s spatial scale and to complemented miss-
ing areas.
2.4 Biomass estimation
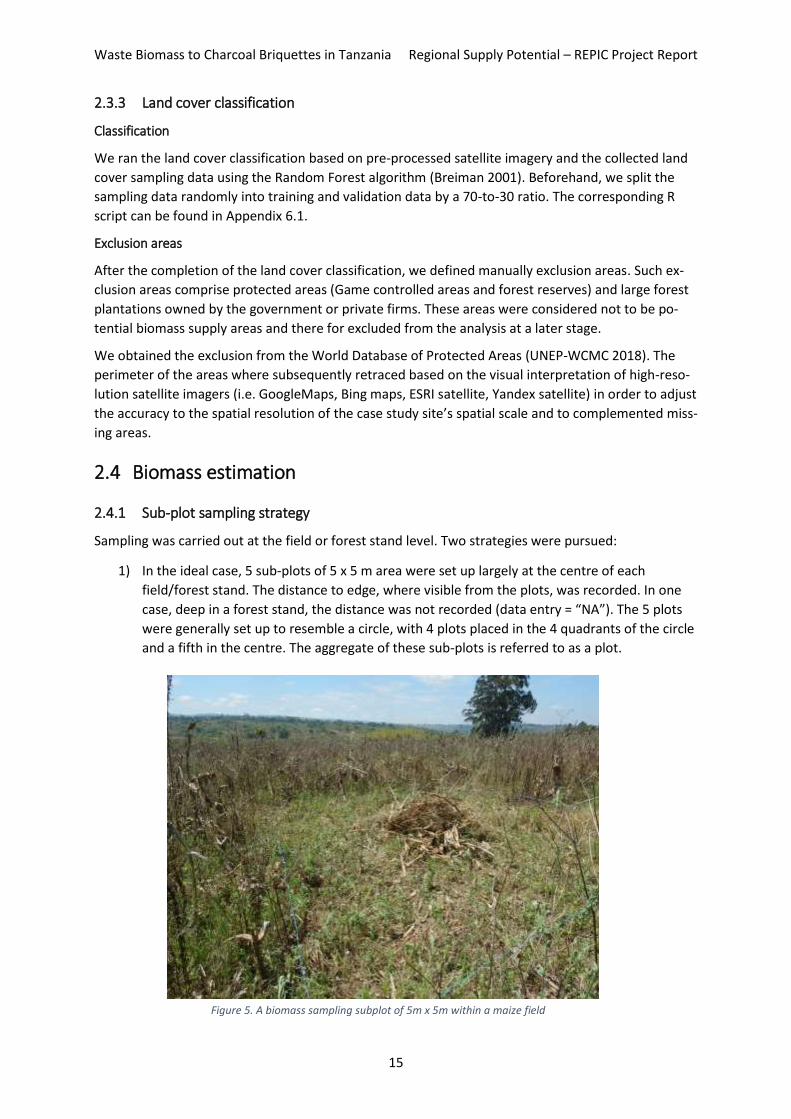
2.4.1 Sub-plot sampling strategy
Sampling was carried out at the field or forest stand level. Two strategies were pursued:
1) In the ideal case, 5 sub-plots of 5 x 5 m area were set up largely at the centre of each
field/forest stand. The distance to edge, where visible from the plots, was recorded. In one
case, deep in a forest stand, the distance was not recorded (data entry = “NA”). The 5 plots
were generally set up to resemble a circle, with 4 plots placed in the 4 quadrants of the circle
and a fifth in the centre. The aggregate of these sub-plots is referred to as a plot.
Figure 5. A biomass sampling subplot of 5m x 5m within a maize field
Waste Biomass to Charcoal Briquettes in Tanzania Regional Supply Potential – REPIC Project Report
16
2) In another set of cases, fields were already being cleared for planting in the next season. In
these cases, biomass could not be localized on field, as piles of biomass had already been
prepared by the farmers. Therefore, we measured biomass amounts across the entire field.
This allowed a much larger area to be sampled, but lacked any Plot-SubPlot hierarchy. There-
fore the sum of biomass for the entire field is simply referred to as the Plot.
2.4.2 Aggregation of sub-plots
Because two sampling strategies were performed with two different levels of detail, aggregation was
necessary to the coarsest scale. Therefore and to facilitate uniform comparison, the sub-plot data
were all aggregated to a single plot number (i.e. all biomass and area summed together).
2.4.3 Calculation of dry weight
From the aggregate data on area and biomass amounts (in kg), biomass density was estimated in the
following way: 1) Biomass weight was converted to dry weight using two approaches, the “green”
moisture content (MC) approach and the “brown” moisture content approach. For the green MC ap-
proach, moisture content is simply expressed as a fraction of the total weight, therefore dry weight is
calculated by taking away this fraction from the total weight:
Dry weight = Total weight*(1-Moisture content(%)/100)
For the brown MC approach, moisture content is expressed as a percent of the dry weight (i.e. the
ratio water to dry weight in the total biomass):
Dry weight = Total weight/(1+(Moisture content(%)/100))
We used simple moisture meters that are available at typical DIY suppliers for assessing the moisture
content of wood and other biomass. There was no information on the type of moisture content (%)
that was calculated (green or brown), therefore we calculated both versions. For the simple instru-
ments used, we believe the estimate would generally follow the “green” approach, as the “brown”
approach is more industry specific and specialized for larger scale equipment. The outcome of calcu-
lations are very similar, but the “green” approach usually estimates slightly lower values.
2.4.4 Forestry aggregation over time
In order to get an accurate picture of the forestry biomass, the following considerations are needed:
1) litter biomass is available only in pine forests, and can be collected each year. 2) Pruning biomass
from cutting the low lying branches is only relevant in 3rd and 4th year of the plantation. 3) Finally,
the harvest biomass was not estimated here because weighting this was unfeasible. Thus, for all har-
vest waste estimates, we resort to literature data. To get an accurate picture of the total biomass per
year, one needs to calculate:
Total biomass per year (kg/m-2 y-1) = (Litter biomass (kg/m-2 y-2) + [(pruning 3rd year (kg/m-2) +
pruning 4th year (kg/m-2) + harvest waste (kg/m-2)) / age of plantation at harvesting (y)]
This will give the lifetime average of a single stand of trees. For eucalyptus stands, there is no real
pruning or litter waste that is suitable, only the harvest waste.
2.4.5 Estimation of land cover class productivity
We estimated the biomass supply potential of forest plantations and crop field by simply calculating
the mean dry weight density for the respective land use type. Subsequently, we assigned these val-
ues to the raster cells to the crop fields and forest plantation by multiplying the dry weight density
with the cell size.
Waste Biomass to Charcoal Briquettes in Tanzania Regional Supply Potential – REPIC Project Report
17
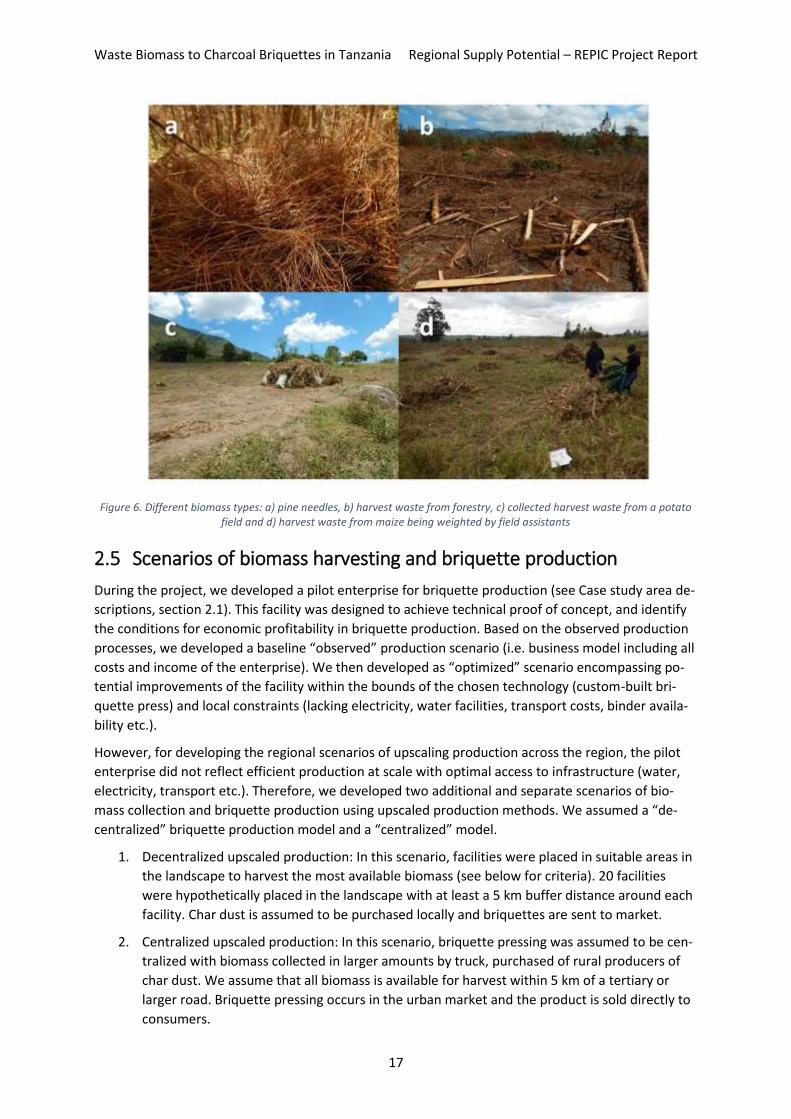
Figure 6. Different biomass types: a) pine needles, b) harvest waste from forestry, c) collected harvest waste from a potato field and d) harvest waste from maize being weighted by field assistants
2.5 Scenarios of biomass harvesting and briquette production
During the project, we developed a pilot enterprise for briquette production (see Case study area de-
scriptions, section 2.1). This facility was designed to achieve technical proof of concept, and identify
the conditions for economic profitability in briquette production. Based on the observed production
processes, we developed a baseline “observed” production scenario (i.e. business model including all
costs and income of the enterprise). We then developed as “optimized” scenario encompassing po-
tential improvements of the facility within the bounds of the chosen technology (custom-built bri-
quette press) and local constraints (lacking electricity, water facilities, transport costs, binder availa-
bility etc.).
However, for developing the regional scenarios of upscaling production across the region, the pilot
enterprise did not reflect efficient production at scale with optimal access to infrastructure (water,
electricity, transport etc.). Therefore, we developed two additional and separate scenarios of bio-
mass collection and briquette production using upscaled production methods. We assumed a “de-
centralized” briquette production model and a “centralized” model.
1. Decentralized upscaled production: In this scenario, facilities were placed in suitable areas in
the landscape to harvest the most available biomass (see below for criteria). 20 facilities
were hypothetically placed in the landscape with at least a 5 km buffer distance around each
facility. Char dust is assumed to be purchased locally and briquettes are sent to market.
2. Centralized upscaled production: In this scenario, briquette pressing was assumed to be cen-
tralized with biomass collected in larger amounts by truck, purchased of rural producers of
char dust. We assume that all biomass is available for harvest within 5 km of a tertiary or
larger road. Briquette pressing occurs in the urban market and the product is sold directly to
consumers.
Waste Biomass to Charcoal Briquettes in Tanzania Regional Supply Potential – REPIC Project Report
18
For both upscaling scenarios, we combined data observed in the field (i.e. in biomass conversion effi-
ciencies, char dust weight and conversion factors, local wages etc.) with additional data from larger-
scale producers (ARTI Tanzania, pers. comm). Thus these hypothetical models are anchored in realis-
tic assumptions and parameters. All production model scenarios are presented in Appendix 0.
Decentralized scenario site selection for hypothetical new facilities
We based site selection for briquette facilities on the amount of available biomass within an econom-
ically-viable collection distance. We first created a supply potential map by calculating for each cell
the total sum of biomass productivity with a radius of 5 km. In other words, we assumed each cell to
be a potential site for a production facility and calculated the potential biomass supply from crop
fields and smallholder forest plantations that are within a reasonable distance. In consultation with
local partners, we manually placed 20 such facilities in the best areas of the landscape to harvest bio-
mass, considering also a minimum connection to a minor road (to transport briquettes to market).
The choice of 5 km as the maximal distance for biomass collection is based on the experiences at the
pilot production facility, where the transport of char dust from collected biomass was usually carried
out by tractor and trailer and rarely exceeded a distance of 5 km as the bird flies. In a second step,
we estimated transport costs of a second-hand tractor and trailer similar to what is available in the
study region using the Excel based tool “TractoScope” (Agroscope, Institut für Nachhaltigkeitswissen-
schaften INH, Tänikon - V. 5.1/2015). This tool estimates machine costs for a variety of machines
based on a set of database parameters, which can be adjusted by the user (e.g. fuel use, motor use
intensity, repair costs, new/second hand and purchase price).
We adjusted these parameters to reflect the local machine and context, but assumed a larger trailer
than what was locally available, to reflect the potential for upscaling. Based on a separate economic
model of the local production facility and its potential for upscaling (see Appendix), we arrived at a
maximum one-way transport distance of 12.5 km to facilitate two loading trips to collect char dust
per day. This would certainly lie under 10 km as the bird flies. Therefore a maximum range of 5 km is
realistic both from our practical experience in the field, and from the consideration of economic costs
of char dust transport.
Centralized scenario biomass harvesting and briquette production
For the centralized production, we adjusted the transport costs even further to account for truck
transport of char dust to the urban markets. We then assumed that all biomass within 5 km of a ter-
tiary road is available for conversion into char dust by char dust producers. Otherwise the assump-
tion of briquette technology and production is identical in the two scenarios. What differs is the total
amount of biomass harvestable and the location of job and income creation.
Waste Biomass to Charcoal Briquettes in Tanzania Regional Supply Potential – REPIC Project Report
19
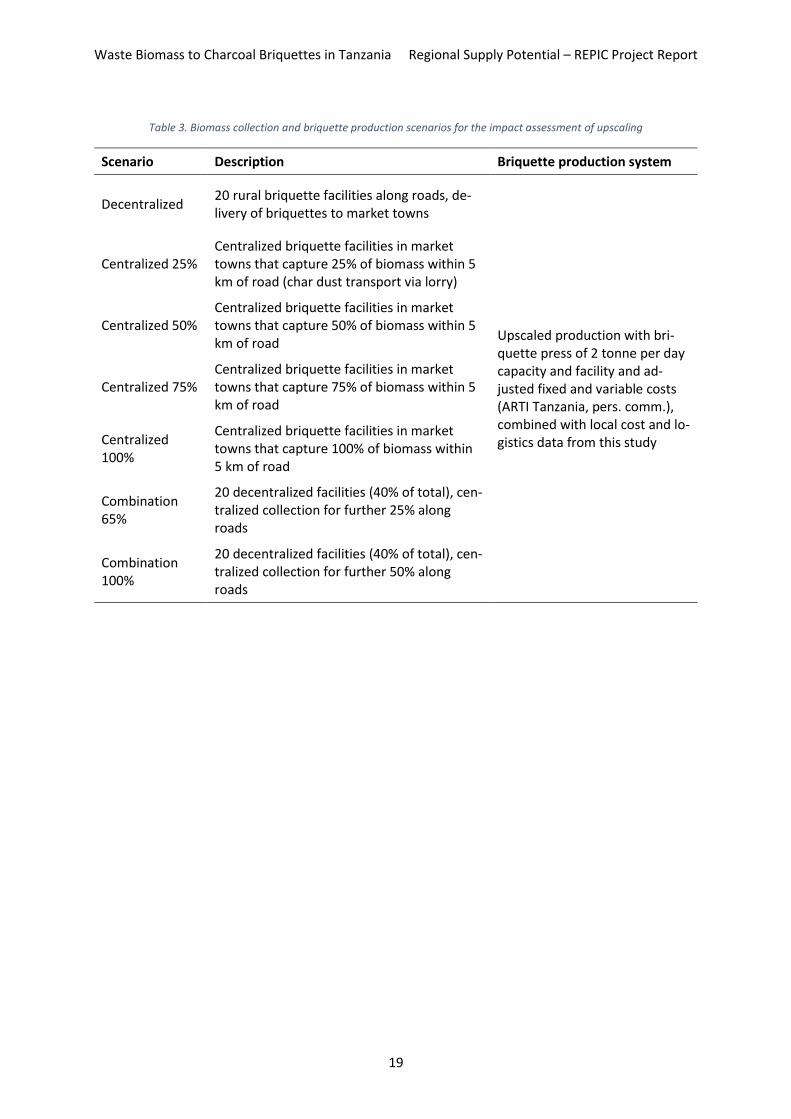
Table 3. Biomass collection and briquette production scenarios for the impact assessment of upscaling
Scenario Description Briquette production system
Decentralized 20 rural briquette facilities along roads, de-livery of briquettes to market towns
Upscaled production with bri-quette press of 2 tonne per day capacity and facility and ad-justed fixed and variable costs (ARTI Tanzania, pers. comm.), combined with local cost and lo-gistics data from this study
Centralized 25% Centralized briquette facilities in market towns that capture 25% of biomass within 5 km of road (char dust transport via lorry)
Centralized 50% Centralized briquette facilities in market towns that capture 50% of biomass within 5 km of road
Centralized 75% Centralized briquette facilities in market towns that capture 75% of biomass within 5 km of road
Centralized 100%
Centralized briquette facilities in market towns that capture 100% of biomass within 5 km of road
Combination 65%
20 decentralized facilities (40% of total), cen-tralized collection for further 25% along roads
Combination 100%
20 decentralized facilities (40% of total), cen-tralized collection for further 50% along roads
Waste Biomass to Charcoal Briquettes in Tanzania Regional Supply Potential – REPIC Project Report
20
3 Results
3.1 Land cover classification
3.1.1 Land cover
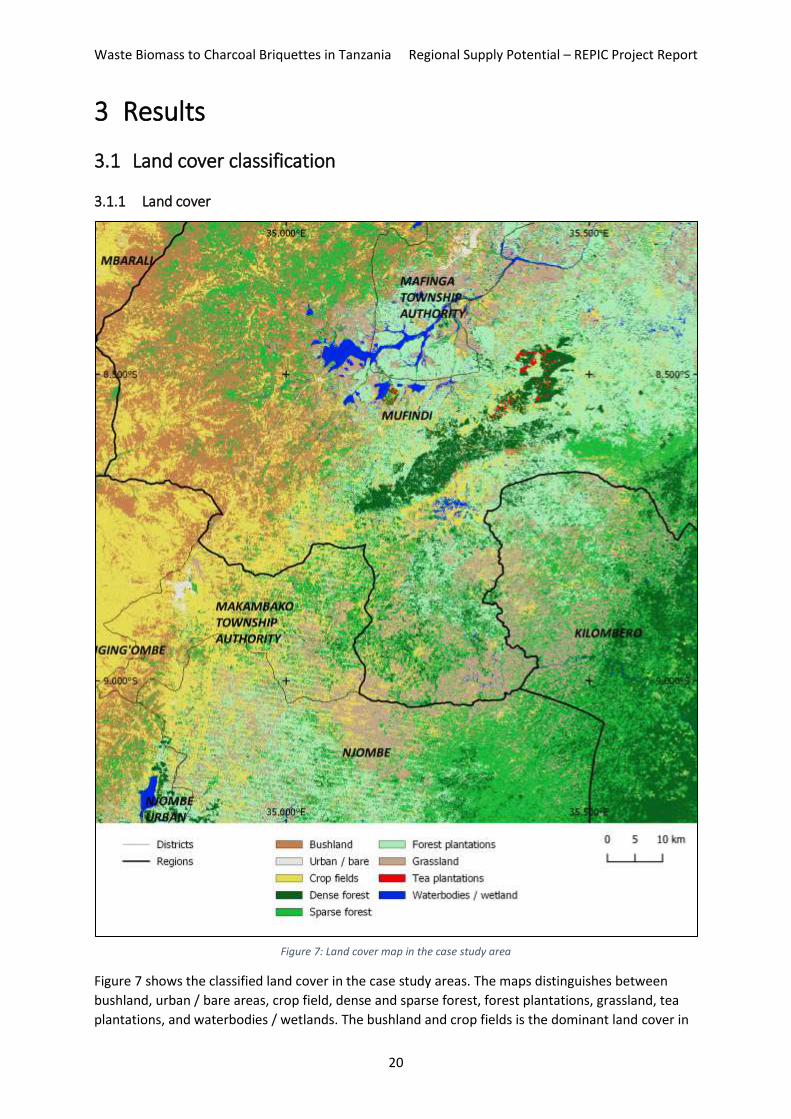
Figure 7: Land cover map in the case study area
Figure 7 shows the classified land cover in the case study areas. The maps distinguishes between
bushland, urban / bare areas, crop field, dense and sparse forest, forest plantations, grassland, tea
plantations, and waterbodies / wetlands. The bushland and crop fields is the dominant land cover in
Waste Biomass to Charcoal Briquettes in Tanzania Regional Supply Potential – REPIC Project Report
21
the East and notable the Northeast of the case study area. Dense and sparse forest is the dominant
land cover in the Southeast. Forest plantations and grassland are dominant land cover types in the
Northwest and the South east.
A stripe pattern of forest plantations, grassland and sparse forest is clearly visible in the Southwest of
the map. This stripes are the result of missing data in the Landsat 7 SCL-off images that where in-
cluded the monthly Landsat composites. While these stripes are visually evident, it is unlikely that
they affect the accuracy of the map significantly. This applies notably for the biomass supply poten-
tial that will be aggregated to areas with a radius between 5 and 10 km.
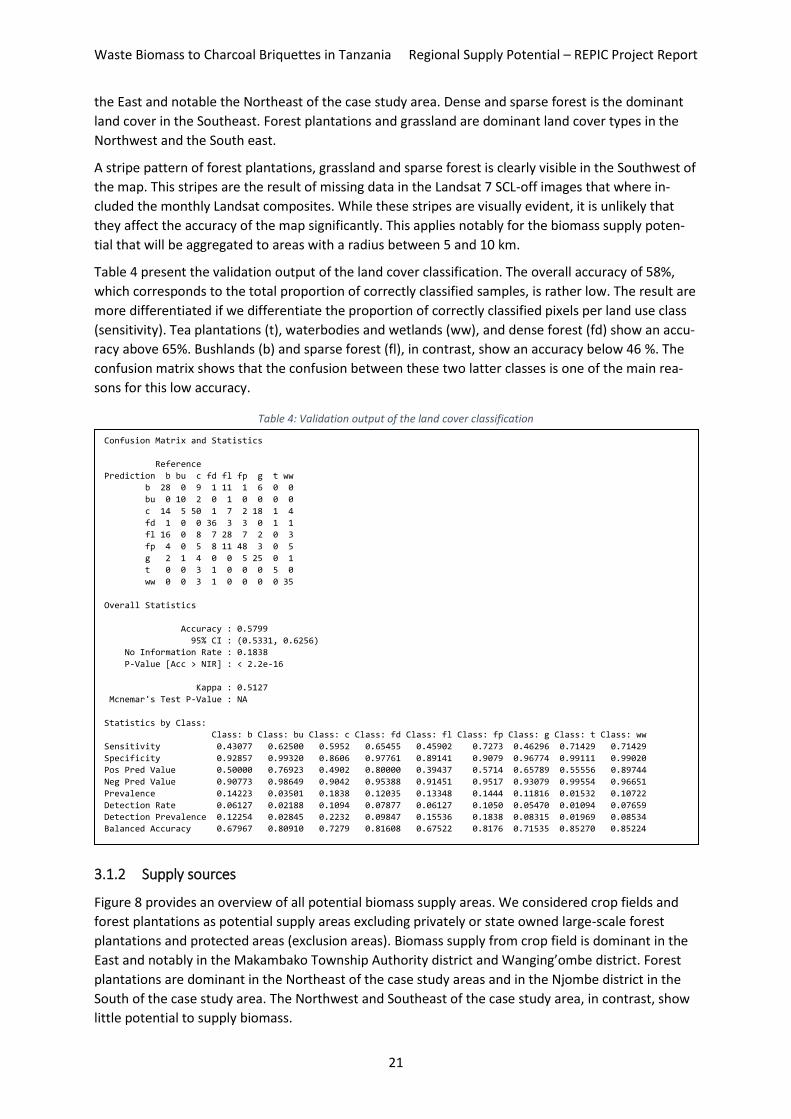
Table 4 present the validation output of the land cover classification. The overall accuracy of 58%,
which corresponds to the total proportion of correctly classified samples, is rather low. The result are
more differentiated if we differentiate the proportion of correctly classified pixels per land use class
(sensitivity). Tea plantations (t), waterbodies and wetlands (ww), and dense forest (fd) show an accu-
racy above 65%. Bushlands (b) and sparse forest (fl), in contrast, show an accuracy below 46 %. The
confusion matrix shows that the confusion between these two latter classes is one of the main rea-
sons for this low accuracy.
Table 4: Validation output of the land cover classification
3.1.2 Supply sources
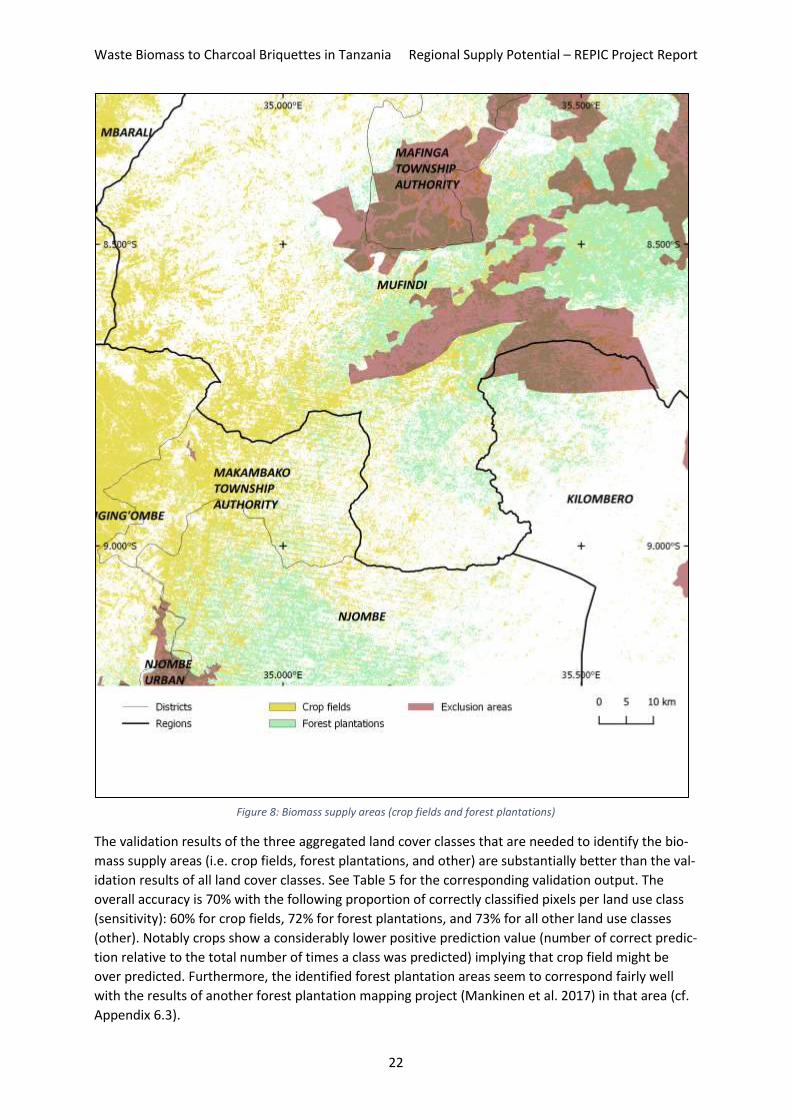
Figure 8 provides an overview of all potential biomass supply areas. We considered crop fields and
forest plantations as potential supply areas excluding privately or state owned large-scale forest
plantations and protected areas (exclusion areas). Biomass supply from crop field is dominant in the
East and notably in the Makambako Township Authority district and Wanging’ombe district. Forest
plantations are dominant in the Northeast of the case study areas and in the Njombe district in the
South of the case study area. The Northwest and Southeast of the case study area, in contrast, show
little potential to supply biomass.
Confusion Matrix and Statistics
Reference
Prediction b bu c fd fl fp g t ww
b 28 0 9 1 11 1 6 0 0
bu 0 10 2 0 1 0 0 0 0
c 14 5 50 1 7 2 18 1 4
fd 1 0 0 36 3 3 0 1 1
fl 16 0 8 7 28 7 2 0 3
fp 4 0 5 8 11 48 3 0 5
g 2 1 4 0 0 5 25 0 1
t 0 0 3 1 0 0 0 5 0
ww 0 0 3 1 0 0 0 0 35
Overall Statistics
Accuracy : 0.5799
95% CI : (0.5331, 0.6256)
No Information Rate : 0.1838
P-Value [Acc > NIR] : < 2.2e-16
Kappa : 0.5127
Mcnemar's Test P-Value : NA
Statistics by Class:
Class: b Class: bu Class: c Class: fd Class: fl Class: fp Class: g Class: t Class: ww
Sensitivity 0.43077 0.62500 0.5952 0.65455 0.45902 0.7273 0.46296 0.71429 0.71429
Specificity 0.92857 0.99320 0.8606 0.97761 0.89141 0.9079 0.96774 0.99111 0.99020
Pos Pred Value 0.50000 0.76923 0.4902 0.80000 0.39437 0.5714 0.65789 0.55556 0.89744
Neg Pred Value 0.90773 0.98649 0.9042 0.95388 0.91451 0.9517 0.93079 0.99554 0.96651
Prevalence 0.14223 0.03501 0.1838 0.12035 0.13348 0.1444 0.11816 0.01532 0.10722
Detection Rate 0.06127 0.02188 0.1094 0.07877 0.06127 0.1050 0.05470 0.01094 0.07659
Detection Prevalence 0.12254 0.02845 0.2232 0.09847 0.15536 0.1838 0.08315 0.01969 0.08534
Balanced Accuracy 0.67967 0.80910 0.7279 0.81608 0.67522 0.8176 0.71535 0.85270 0.85224
Waste Biomass to Charcoal Briquettes in Tanzania Regional Supply Potential – REPIC Project Report
22
Figure 8: Biomass supply areas (crop fields and forest plantations)
The validation results of the three aggregated land cover classes that are needed to identify the bio-
mass supply areas (i.e. crop fields, forest plantations, and other) are substantially better than the val-
idation results of all land cover classes. See Table 5 for the corresponding validation output. The
overall accuracy is 70% with the following proportion of correctly classified pixels per land use class
(sensitivity): 60% for crop fields, 72% for forest plantations, and 73% for all other land use classes
(other). Notably crops show a considerably lower positive prediction value (number of correct predic-
tion relative to the total number of times a class was predicted) implying that crop field might be
over predicted. Furthermore, the identified forest plantation areas seem to correspond fairly well
with the results of another forest plantation mapping project (Mankinen et al. 2017) in that area (cf.
Appendix 6.3).

Waste Biomass to Charcoal Briquettes in Tanzania Regional Supply Potential – REPIC Project Report
23
Table 5: Validation output of the biomass supply areas only
3.2 Biomass estimation
3.2.1 Productivity
Table 6 shows the values for the collected biomass aggregated from the subplots to the plot. The first
column indicates the land classes of the field collection plot, the second column presents a descrip-
tion of the collected biomass, the third column indicates additional relevant information about the
context (field collection, availability of the biomass, etc.) and the last column presents the estimated
biomass supply potential per year and square meter given in kg of dry weight (brown MC approach).
This field data results in an average of 0.2 kg (SD: 0.097) dry weight biomass per square meter in crop
fields and 0.46 kg (SD: 0.086) dry weight biomass per square meter in forest plantations. The total
potential for biomass feedstock with the case study areas accounts for approximately 167,000
tonnes; 48,000 tonnes form crop fields and 119,000 tonnes from forest plantations.
Table 6: Biomass field collection per plot type
Plot_type Biomass_type Notes Dry weight (Kg per year and m2)
Cropland Maize stalks and leaves (70%), grasses and shrubs (30%)
Test data from 30 m plot split into 15*15 m quadrants
0.311
Cropland Maize stalks and leaves (70%), grasses and shrubs (30%)
Neighbouring plot to test plot (P1) for com-parison
0.293
Cropland Peas stalks and pods Large field, already cleared in piles 0.141
Cropland Peas stalks and pods Large field, already cleared in piles 0.103
Cropland Maize stalks and leaves (80%), grasses, shrubs and ferns (20%)
Large field, already cleared in piles 0.245
Cropland Maize stalks and leaves (95%), shrubs (5%)
Village garden, planted each year with maize, no crop rotation
0.094
Forestry Pine needle ground litter, 4 years old, 2 years deposition
For annual availability, divide by 2 years (age of plantation minus first 2 yrs of young
0.367
Confusion Matrix and Statistics
reference
prediction crops forest plantations other
crops 50 2 50
forest plantations 5 48 31
other 29 16 226
Overall Statistics
Accuracy : 0.709
95% CI : (0.665, 0.7502)
No Information Rate : 0.6718
P-Value [Acc > NIR] : 0.049035
Kappa : 0.4551
Mcnemar's Test P-Value : 0.008663
Statistics by Class:
Class: crops Class: forest plantations Class: other
Sensitivity 0.5952 0.7273 0.7362
Specificity 0.8606 0.9079 0.7000
Pos Pred Value 0.4902 0.5714 0.8339
Neg Pred Value 0.9042 0.9517 0.5645
Prevalence 0.1838 0.1444 0.6718
Detection Rate 0.1094 0.1050 0.4945
Detection Prevalence 0.2232 0.1838 0.5930
Balanced Accuracy 0.7279 0.8176 0.7181
Waste Biomass to Charcoal Briquettes in Tanzania Regional Supply Potential – REPIC Project Report
24
growth), as young trees produce very little and compensate lat~
Forestry Pine needle ground litter, 7 years old, 2 years deposition
Pruned branches and litter collected on the same plot but weighed separately
0.568
Forestry Pruned branches, 3rd y pruning
Use as firewood second choice and limited to plantations surrounding villages, major-ity left in plot, or cleared and burned for fire prevention
0.476
Forestry Pruned branches, 4th year Pruned branches and litter collected on the same plot but weighed separately
0.423
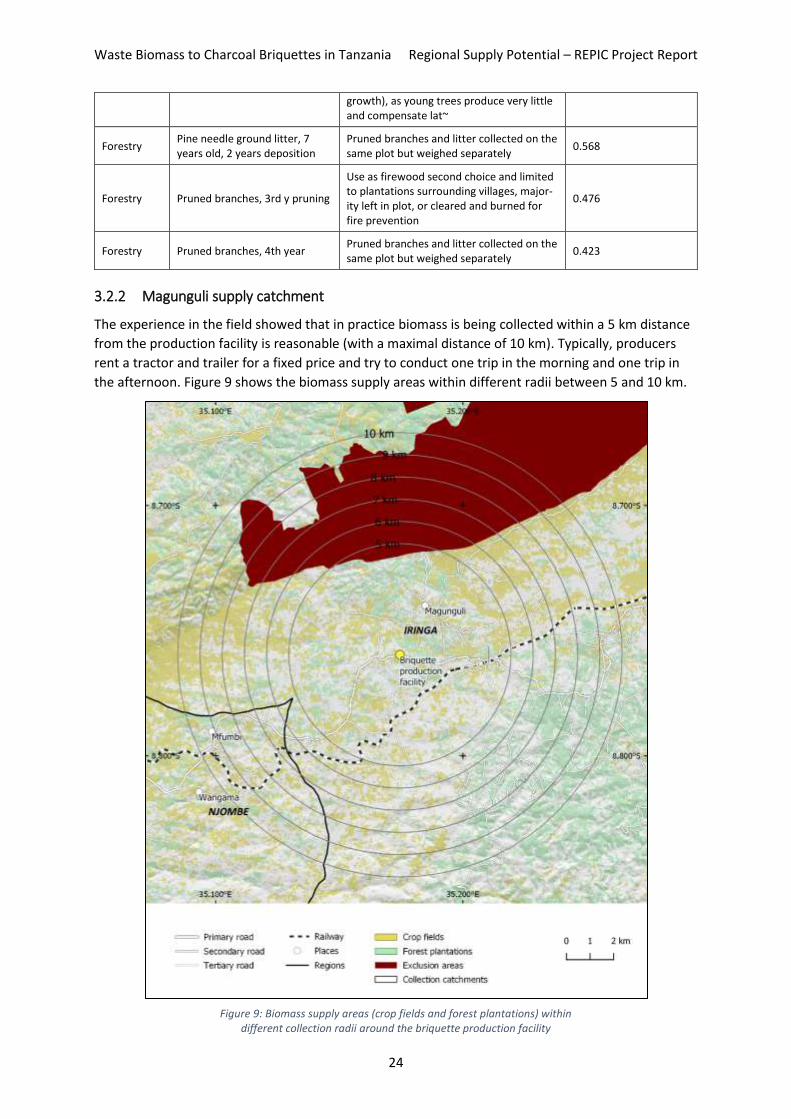
3.2.2 Magunguli supply catchment
The experience in the field showed that in practice biomass is being collected within a 5 km distance
from the production facility is reasonable (with a maximal distance of 10 km). Typically, producers
rent a tractor and trailer for a fixed price and try to conduct one trip in the morning and one trip in
the afternoon. Figure 9 shows the biomass supply areas within different radii between 5 and 10 km.
Figure 9: Biomass supply areas (crop fields and forest plantations) within
different collection radii around the briquette production facility
Waste Biomass to Charcoal Briquettes in Tanzania Regional Supply Potential – REPIC Project Report
25
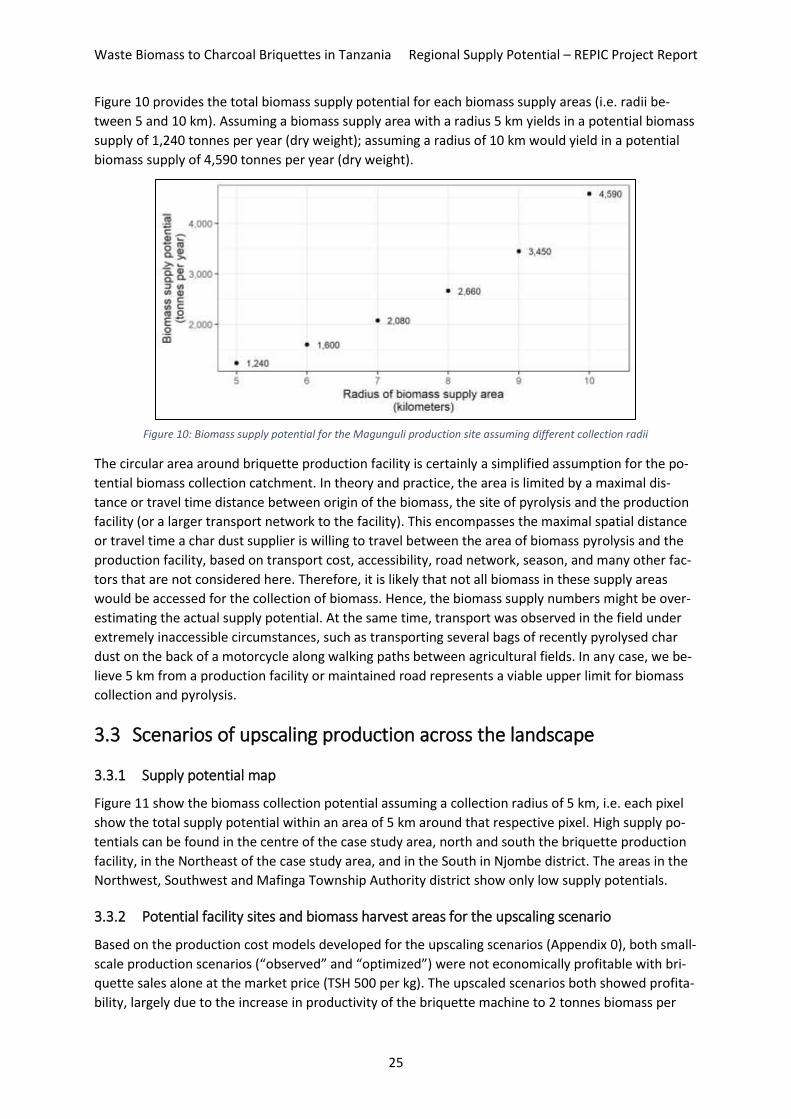
Figure 10 provides the total biomass supply potential for each biomass supply areas (i.e. radii be-
tween 5 and 10 km). Assuming a biomass supply area with a radius 5 km yields in a potential biomass
supply of 1,240 tonnes per year (dry weight); assuming a radius of 10 km would yield in a potential
biomass supply of 4,590 tonnes per year (dry weight).
Figure 10: Biomass supply potential for the Magunguli production site assuming different collection radii
The circular area around briquette production facility is certainly a simplified assumption for the po-
tential biomass collection catchment. In theory and practice, the area is limited by a maximal dis-
tance or travel time distance between origin of the biomass, the site of pyrolysis and the production
facility (or a larger transport network to the facility). This encompasses the maximal spatial distance
or travel time a char dust supplier is willing to travel between the area of biomass pyrolysis and the
production facility, based on transport cost, accessibility, road network, season, and many other fac-
tors that are not considered here. Therefore, it is likely that not all biomass in these supply areas
would be accessed for the collection of biomass. Hence, the biomass supply numbers might be over-
estimating the actual supply potential. At the same time, transport was observed in the field under
extremely inaccessible circumstances, such as transporting several bags of recently pyrolysed char
dust on the back of a motorcycle along walking paths between agricultural fields. In any case, we be-
lieve 5 km from a production facility or maintained road represents a viable upper limit for biomass
collection and pyrolysis.
3.3 Scenarios of upscaling production across the landscape
3.3.1 Supply potential map
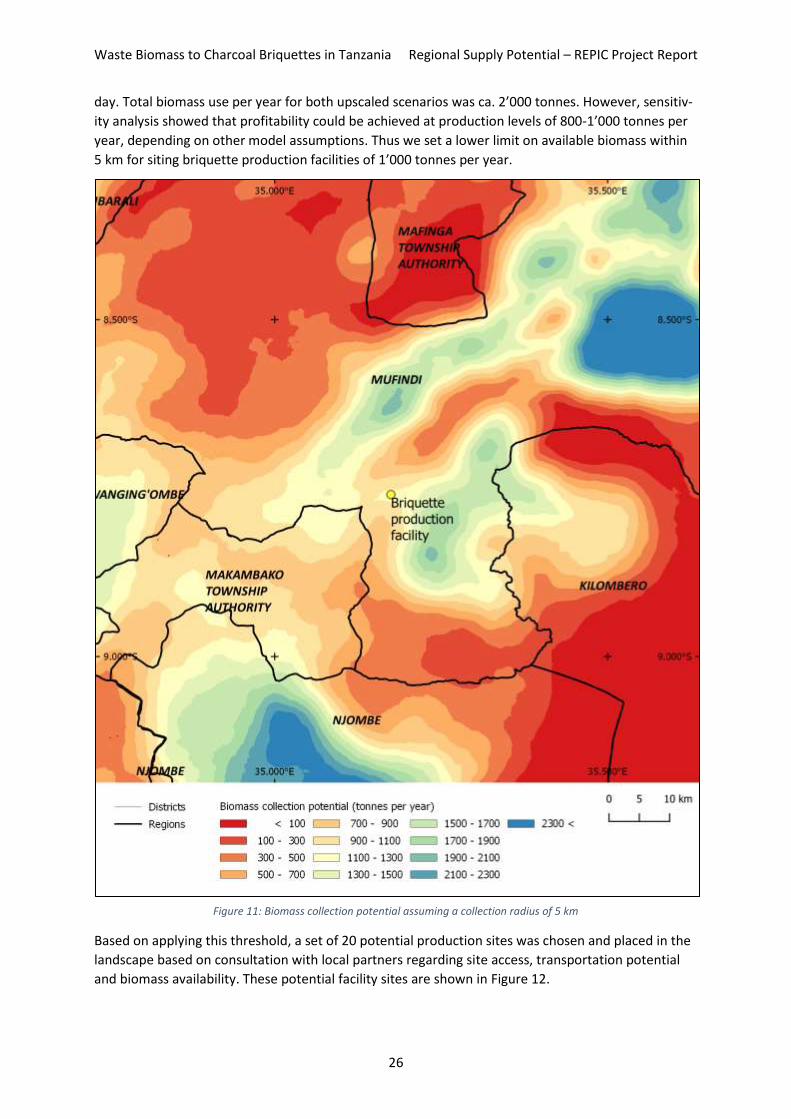
Figure 11 show the biomass collection potential assuming a collection radius of 5 km, i.e. each pixel
show the total supply potential within an area of 5 km around that respective pixel. High supply po-
tentials can be found in the centre of the case study area, north and south the briquette production
facility, in the Northeast of the case study area, and in the South in Njombe district. The areas in the
Northwest, Southwest and Mafinga Township Authority district show only low supply potentials.
3.3.2 Potential facility sites and biomass harvest areas for the upscaling scenario
Based on the production cost models developed for the upscaling scenarios (Appendix 0), both small-
scale production scenarios (“observed” and “optimized”) were not economically profitable with bri-
quette sales alone at the market price (TSH 500 per kg). The upscaled scenarios both showed profita-
bility, largely due to the increase in productivity of the briquette machine to 2 tonnes biomass per
Waste Biomass to Charcoal Briquettes in Tanzania Regional Supply Potential – REPIC Project Report
26
day. Total biomass use per year for both upscaled scenarios was ca. 2’000 tonnes. However, sensitiv-
ity analysis showed that profitability could be achieved at production levels of 800-1’000 tonnes per
year, depending on other model assumptions. Thus we set a lower limit on available biomass within
5 km for siting briquette production facilities of 1’000 tonnes per year.
Figure 11: Biomass collection potential assuming a collection radius of 5 km
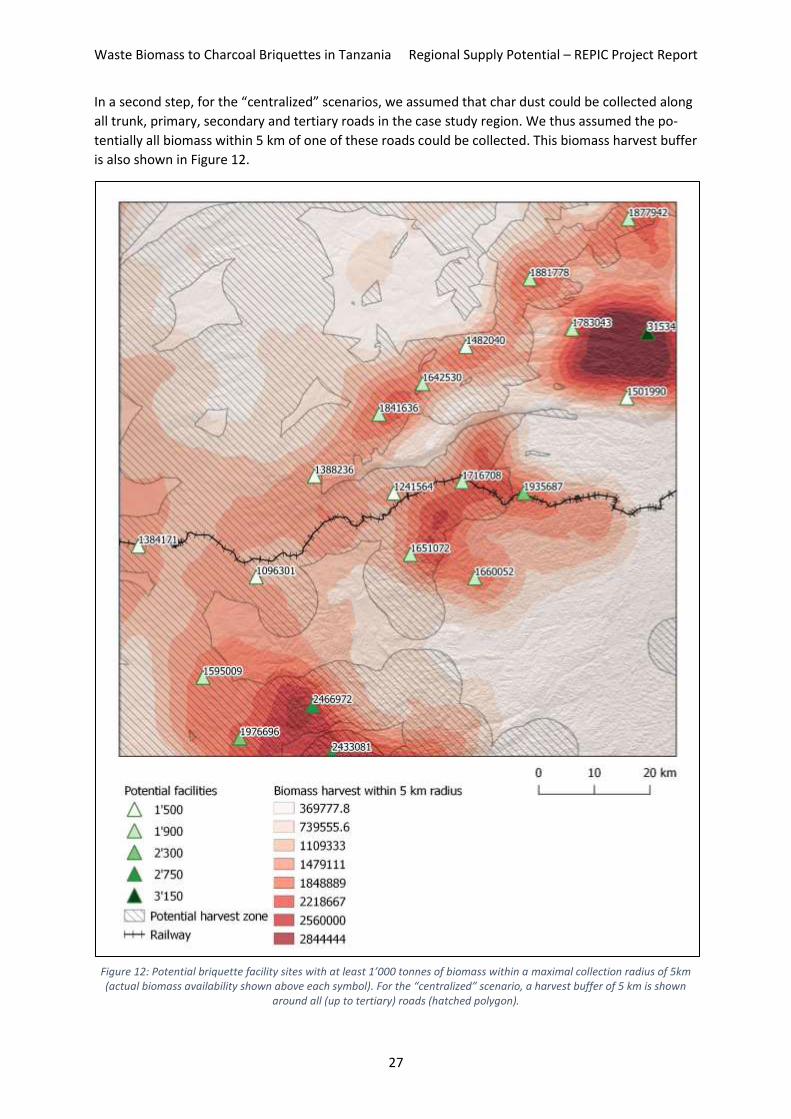
Based on applying this threshold, a set of 20 potential production sites was chosen and placed in the
landscape based on consultation with local partners regarding site access, transportation potential
and biomass availability. These potential facility sites are shown in Figure 12.
Waste Biomass to Charcoal Briquettes in Tanzania Regional Supply Potential – REPIC Project Report
27
In a second step, for the “centralized” scenarios, we assumed that char dust could be collected along
all trunk, primary, secondary and tertiary roads in the case study region. We thus assumed the po-
tentially all biomass within 5 km of one of these roads could be collected. This biomass harvest buffer
is also shown in Figure 12.
Figure 12: Potential briquette facility sites with at least 1’000 tonnes of biomass within a maximal collection radius of 5km (actual biomass availability shown above each symbol). For the “centralized” scenario, a harvest buffer of 5 km is shown
around all (up to tertiary) roads (hatched polygon).
Waste Biomass to Charcoal Briquettes in Tanzania Regional Supply Potential – REPIC Project Report
28
3.4 Impact assessment of upscaling
3.4.1 Production and job creation
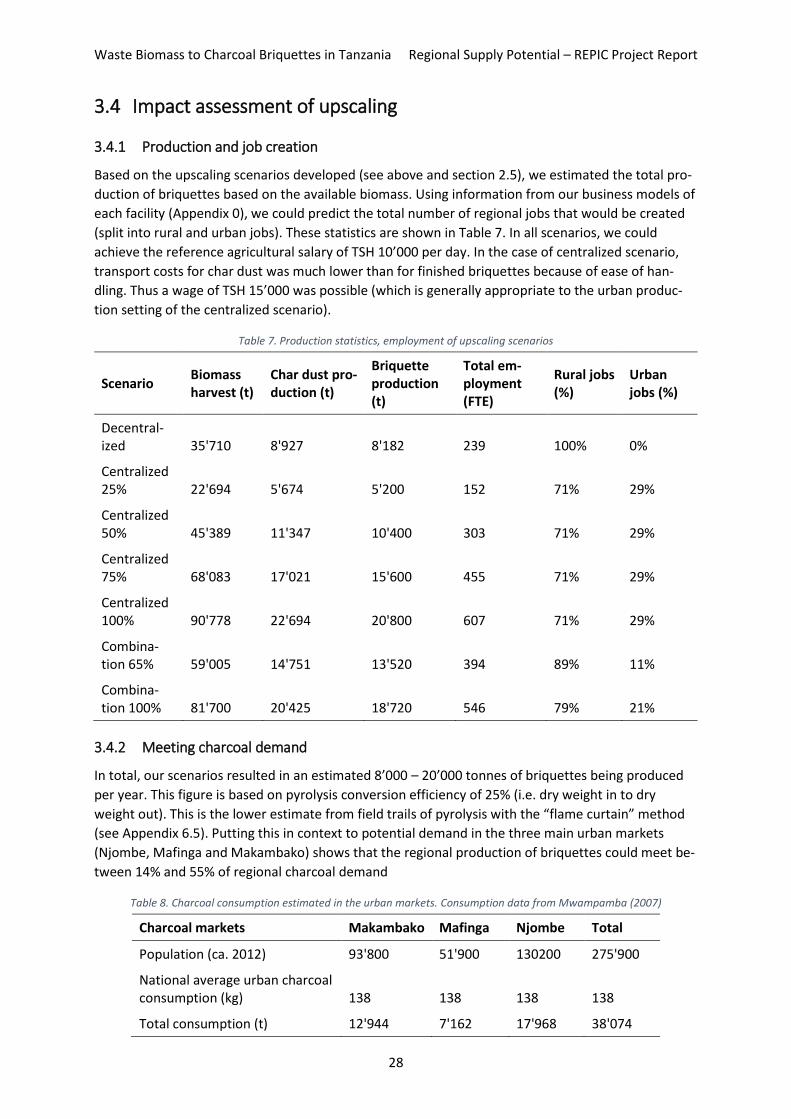
Based on the upscaling scenarios developed (see above and section 2.5), we estimated the total pro-
duction of briquettes based on the available biomass. Using information from our business models of
each facility (Appendix 0), we could predict the total number of regional jobs that would be created
(split into rural and urban jobs). These statistics are shown in Table 7. In all scenarios, we could
achieve the reference agricultural salary of TSH 10’000 per day. In the case of centralized scenario,
transport costs for char dust was much lower than for finished briquettes because of ease of han-
dling. Thus a wage of TSH 15’000 was possible (which is generally appropriate to the urban produc-
tion setting of the centralized scenario).
Table 7. Production statistics, employment of upscaling scenarios
Scenario Biomass harvest (t)
Char dust pro-duction (t)
Briquette production (t)
Total em-ployment (FTE)
Rural jobs (%)
Urban jobs (%)
Decentral-ized 35'710 8'927 8'182 239 100% 0%
Centralized 25% 22'694 5'674 5'200 152 71% 29%
Centralized 50% 45'389 11'347 10'400 303 71% 29%
Centralized 75% 68'083 17'021 15'600 455 71% 29%
Centralized 100% 90'778 22'694 20'800 607 71% 29%
Combina-tion 65% 59'005 14'751 13'520 394 89% 11%
Combina-tion 100% 81'700 20'425 18'720 546 79% 21%
3.4.2 Meeting charcoal demand
In total, our scenarios resulted in an estimated 8’000 – 20’000 tonnes of briquettes being produced
per year. This figure is based on pyrolysis conversion efficiency of 25% (i.e. dry weight in to dry
weight out). This is the lower estimate from field trails of pyrolysis with the “flame curtain” method
(see Appendix 6.5). Putting this in context to potential demand in the three main urban markets
(Njombe, Mafinga and Makambako) shows that the regional production of briquettes could meet be-
tween 14% and 55% of regional charcoal demand
Table 8. Charcoal consumption estimated in the urban markets. Consumption data from Mwampamba (2007)
Charcoal markets Makambako Mafinga Njombe Total
Population (ca. 2012) 93'800 51'900 130200 275'900
National average urban charcoal consumption (kg) 138 138 138 138
Total consumption (t) 12'944 7'162 17'968 38'074
Waste Biomass to Charcoal Briquettes in Tanzania Regional Supply Potential – REPIC Project Report
29
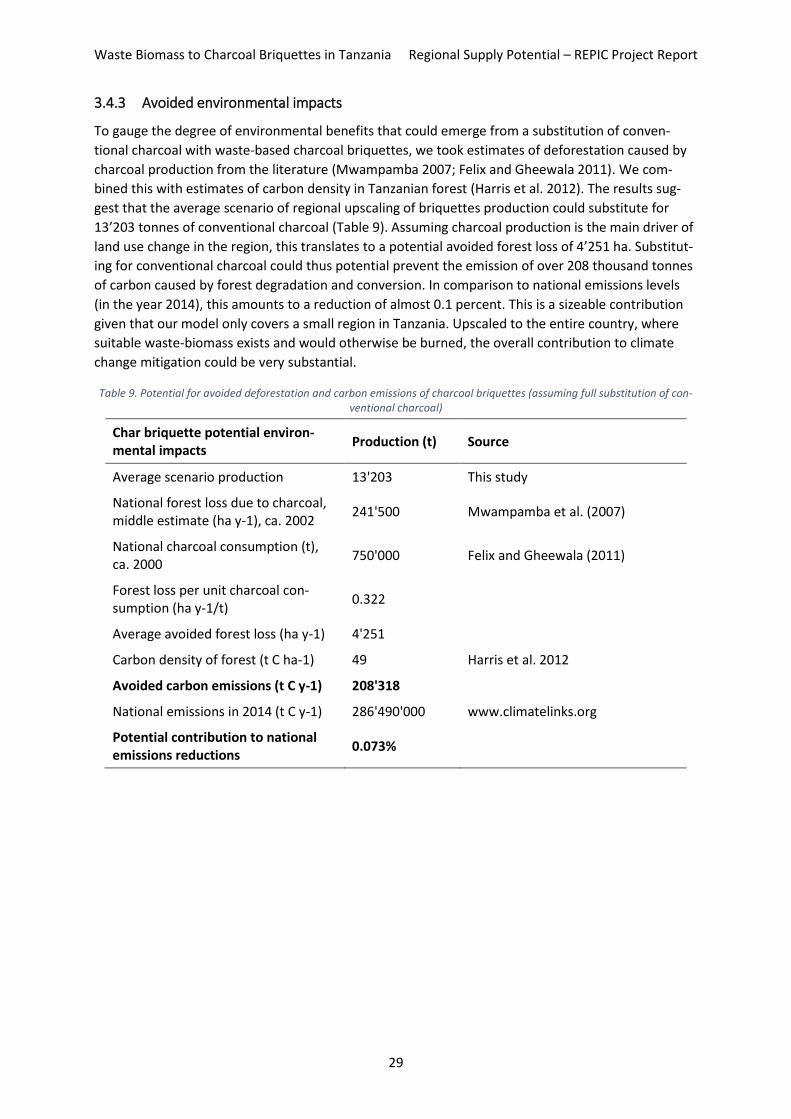
3.4.3 Avoided environmental impacts
To gauge the degree of environmental benefits that could emerge from a substitution of conven-
tional charcoal with waste-based charcoal briquettes, we took estimates of deforestation caused by
charcoal production from the literature (Mwampamba 2007; Felix and Gheewala 2011). We com-
bined this with estimates of carbon density in Tanzanian forest (Harris et al. 2012). The results sug-
gest that the average scenario of regional upscaling of briquettes production could substitute for
13’203 tonnes of conventional charcoal (Table 9). Assuming charcoal production is the main driver of
land use change in the region, this translates to a potential avoided forest loss of 4’251 ha. Substitut-
ing for conventional charcoal could thus potential prevent the emission of over 208 thousand tonnes
of carbon caused by forest degradation and conversion. In comparison to national emissions levels
(in the year 2014), this amounts to a reduction of almost 0.1 percent. This is a sizeable contribution
given that our model only covers a small region in Tanzania. Upscaled to the entire country, where
suitable waste-biomass exists and would otherwise be burned, the overall contribution to climate
change mitigation could be very substantial.
Table 9. Potential for avoided deforestation and carbon emissions of charcoal briquettes (assuming full substitution of con-ventional charcoal)
Char briquette potential environ-mental impacts
Production (t) Source
Average scenario production 13'203 This study
National forest loss due to charcoal, middle estimate (ha y-1), ca. 2002
241'500 Mwampamba et al. (2007)
National charcoal consumption (t), ca. 2000
750'000 Felix and Gheewala (2011)
Forest loss per unit charcoal con-sumption (ha y-1/t)
0.322
Average avoided forest loss (ha y-1) 4'251
Carbon density of forest (t C ha-1) 49 Harris et al. 2012
Avoided carbon emissions (t C y-1) 208'318
National emissions in 2014 (t C y-1) 286'490'000 www.climatelinks.org
Potential contribution to national emissions reductions
0.073%
Waste Biomass to Charcoal Briquettes in Tanzania Regional Supply Potential – REPIC Project Report
30
4 Discussion and conclusion The report presented above illustrates the importance of efficient use of available biomass in Tanza-
nia. As a country with a strong dependence on biomass energy (Felix and Gheewala 2011; Zah and
Ehrensperger 2014), it is crucial to consider all sources of biomass and their uses when building a co-
herent policy to meet demand. In this study, we turned our attention to optimizing biomass use in a
rural case study in the Southern Highlands, where harvest waste from is crops is typically gathered in
piles and burned. We illustrated that such waste biomass within a single region has the potential to
meet a significant portion (ca. a third) of urban demand for charcoal in nearby market centres.
Income generation
In terms of socio-economic impacts, this would create hundreds of full time job equivalents in rural
areas, depending on the scenario. However, the main benefit would not take the form of full time
jobs, but rather additional income for farmers with little additional work in addition to regular field
clearing activities. Through the pyrolysis rather than burning of crop residues, such income would be
distributed across a much wider range of beneficiaries. The additional work required for each farmer
was estimated during three pyrolysis trails with the “flame curtain” method of char dust production
(Cornelissen et al. 2016; Pandit et al. 2017), in addition to much practical experience on the part of
the project partners. In general, about 3-4 hours of additional labour is required for pyrolysis of bio-
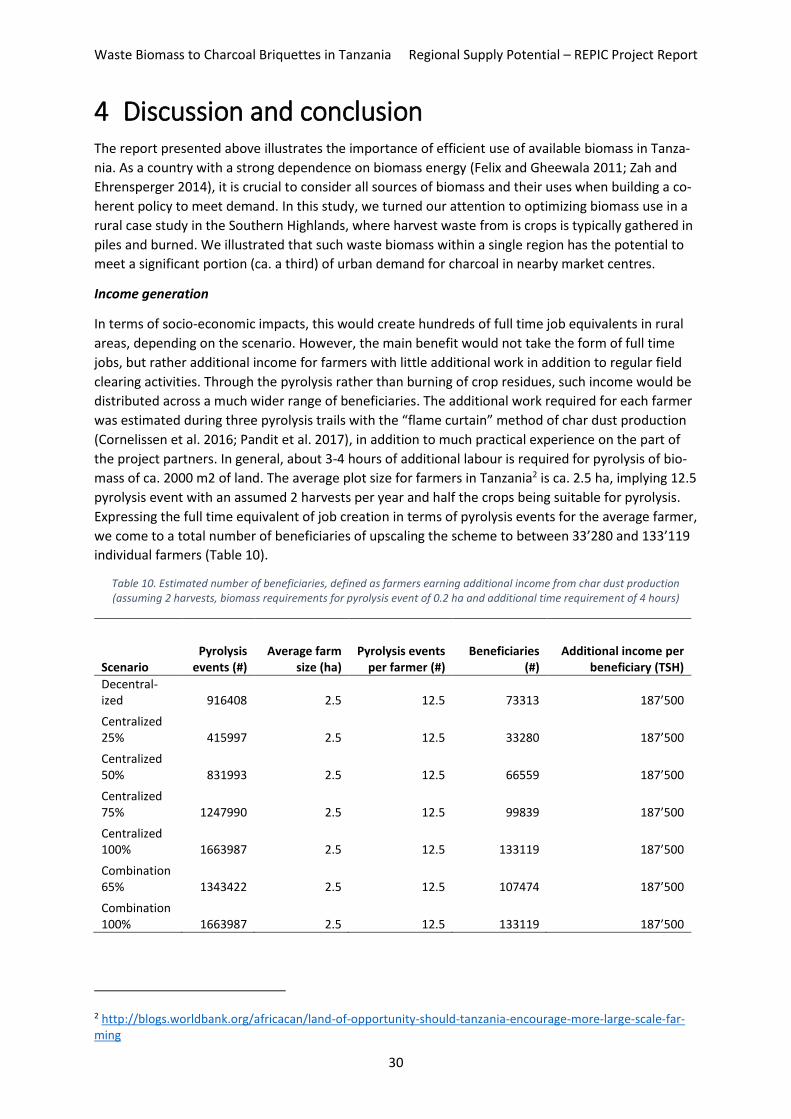
mass of ca. 2000 m2 of land. The average plot size for farmers in Tanzania2 is ca. 2.5 ha, implying 12.5
pyrolysis event with an assumed 2 harvests per year and half the crops being suitable for pyrolysis.
Expressing the full time equivalent of job creation in terms of pyrolysis events for the average farmer,
we come to a total number of beneficiaries of upscaling the scheme to between 33’280 and 133’119
individual farmers (Table 10).
Table 10. Estimated number of beneficiaries, defined as farmers earning additional income from char dust production (assuming 2 harvests, biomass requirements for pyrolysis event of 0.2 ha and additional time requirement of 4 hours)
Scenario Pyrolysis
events (#) Average farm
size (ha) Pyrolysis events
per farmer (#) Beneficiaries
(#) Additional income per
beneficiary (TSH)
Decentral-ized 916408 2.5 12.5 73313 187’500
Centralized 25% 415997 2.5 12.5 33280 187’500
Centralized 50% 831993 2.5 12.5 66559 187’500
Centralized 75% 1247990 2.5 12.5 99839 187’500
Centralized 100% 1663987 2.5 12.5 133119 187’500
Combination 65% 1343422 2.5 12.5 107474 187’500
Combination 100% 1663987 2.5 12.5 133119 187’500
2 http://blogs.worldbank.org/africacan/land-of-opportunity-should-tanzania-encourage-more-large-scale-far-ming

Waste Biomass to Charcoal Briquettes in Tanzania Regional Supply Potential – REPIC Project Report
31
A single pyrolysis event delivers about 3 units of char dust, which we assume in our economic model
to be purchased for TSH 5’000. This price was negotiated in the field during the pilot project and rep-
resents a strong incentive for char dust production. Thus, a single pyrolysis event would deliver ca.
TSH 15’000 of additional income, which is about 1.5 times the daily average wage in agriculture for
half a day’s additional work. Thus, farmers could generate almost 20 days’ worth of additional in-
come each year. For a full time equivalent of 240 days per year, that equates to an income rise of ca.
8% for an additional 6.25 days of work per year (ca. 2.6% increase). Thus the benefits for rural char
dust producers would greatly outweigh the additional time requirements and deliver a strong net in-
come increase.
For Briquette producers, the income achieved for the full time jobs at least matches or exceeds the
reference salary for agricultural work. In the scenarios of decentralized production, wages were set
at a lower rate (TSH 10’000 per day) due to higher costs elsewhere (mainly packaging, transport and
water/energy facilities). In the centralized scenarios, reduce costs could facilitate higher wages (TSH
15’000 per day). Both of these figures are roughly in parity with reference rural and urban wages, re-
spectively. Thus, no major income increase is expected beyond the basic benefit of job creation.
Forest conservation
Regarding environmental benefit, the study showed that substitution of conventional charcoal with
char briquettes could have a considerable impact on forest loss due to charcoal production. Here, we
assume that charcoal production is a direct driver of forest loss in the case study region. Our esti-
mates of forest loss per unit of charcoal are taken from the literature (Mwampamba 2007). Yet char-
coal production on private land may be a bi-product of land use change that would otherwise occur
(e.g. clearing for agriculture or forestry by new settlers or existing land owners with additional capac-
ity to bring land under the plough). In such a case, the charcoal represents an additional income gen-
erating activity next to the primary aim of land clearing, but it would be produced regardless of exter-
nal demand. Substitution of briquettes for such charcoal would not deliver the promised benefits of
reducing land clearing unless the oversupply to the market reduced prices and incentives to profes-
sional charcoal producers elsewhere. At the same time, a reduced price could stimulate demand
which would then offset even this partial benefit.
In the Southern Highlands, a Private Forestry Programme (PFP), or “Panda Miti Kibiashara” has been
running for several years, funded as a bilateral programme of the Tanzanian and Finnish govern-
ment3. This programme aims at “increasing rural income in the Southern Highlands area of Tanzania
through developing sustainable plantation forestry and value addition“4 through capacity building
and financial support. While environmental criteria are present within the project goals (e.g. in estab-
lishing conservation zones for biodiversity), the net results is facilitating the conversion of native
woodland on private lands into exotic forestry plantations. Personal accounts by locals in the area
confirmed the expansion of exotic forest plantations (mainly pine) in the area over the past couple of
decades (alongside conversion to agriculture). This is supported by a recent mapping study by the
PFP programme, which found a majority area of young-stage forestry stands established on private
lands in contrast to mature-stage stands in public and commercial plantations (Mankinen et al.
2017). This implies forestry expansion is a major driver of land use change in the area. If charcoal
from native woodland is assumed to be a bi-product of this expansion, and not an end in itself, then
char dust briquettes will have little impact on land clearing until other incentives, such as those of
3 http://www.privateforestry.or.tz/en/about/partnerships 4 http://www.privateforestry.or.tz/en/about/category/who-we-are

Waste Biomass to Charcoal Briquettes in Tanzania Regional Supply Potential – REPIC Project Report
32
the PFP, are addressed. Therefore our environmental results must be interpreted with extreme cau-
tion, particularly in the context of the Southern Highlands.
That said, given the massive demand for charcoal across the country, the net result of introducing
char dust briquettes is likely to be positive. Even if half of the potential benefits that we estimate are
realized, promoting this technology would still deliver a substantial reduction in charcoal-related car-
bon emissions due to land use change. A clear next step would be to assess the drivers of land use
change in different parts of the country, along with the structure of the charcoal market, and strate-
gically introduce char briquettes where the context is correct. This means areas where agricultural
wastes is burned rather than used for another means (e.g. compost, animal feed), where deforesta-
tion is largely driven by charcoal demand and where marketing of briquettes matches the target mar-
kets for such charcoal.
In conclusion, the production of char dust briquettes represents an attractive option for increasing
the efficiency of biomass use whilst simultaneously raising incomes and providing rural jobs. Our re-
sults support this optimism under simplified assumptions, particularly in the social domain. At the
same time, the introduction of the technology is not a panacea for environmental problems associ-
ated to charcoal, because their causes are generally more complex than first appears. Thus char dust
briquettes from agricultural waste must be considered one possible intervention that needs to be co-
ordinated with other changes in incentives and environmental management practices across the agri-
cultural and forestry sector.
Waste Biomass to Charcoal Briquettes in Tanzania Regional Supply Potential – REPIC Project Report
33
5 References Ahrends A, Burgess ND, Milledge S a H, Bulling MT, Fisher B, Smart JCR, Clarke GP, Mhoro BE, Lewis SL. 2010. Predictable waves of sequential forest degradation and biodiversity loss spreading from an African city. Proceedings of the National Academy of Sciences of the United States of America. 107(33):14556–61. doi:10.1073/pnas.0914471107.
Asamoah B, Nikiema J, Gebrezgabher S, Odonkor E, Njenga M. 2016. A review on production, market-ing and use of fuel briquettes. International Water Management Institute IWMI Reports Report No.: 257959. [accessed 2018 Dec 27]. https://ideas.repec.org/p/ags/iwmirp/257959.html.
Bär R, Heinimann A, Ehrensperger A. 2017. Assessing the potential supply of biomass cooking fuels in Kilimanjaro region using land use units and spatial Bayesian networks. Energy for Sustainable Devel-opment. 40:112–125. doi:10.1016/j.esd.2017.05.007.
Breiman L. 2001. Random Forests. Machine Learning. 45(1):5–32. doi:10.1023/A:1010933404324. [accessed 2018 Dec 3]. https://doi.org/10.1023/A:1010933404324.
Cornelissen G, Pandit NR, Taylor P, Pandit BH, Sparrevik M, Schmidt HP. 2016. Emissions and Char Quality of Flame-Curtain “Kon Tiki” Kilns for Farmer-Scale Charcoal/Biochar Production. Bond-Lam-berty B, editor. PLOS ONE. 11(5):e0154617. doi:10.1371/journal.pone.0154617.
Felix M, Gheewala SH. 2011. A Review of Biomass Energy Dependency in Tanzania. Energy Procedia. 9:338–343. doi:10.1016/j.egypro.2011.09.036.
Ghilardi A, Guerrero G, Masera O. 2009. A GIS-based methodology for highlighting fuelwood sup-ply/demand imbalances at the local level: A case study for Central Mexico. Biomass and Bioenergy. 33(6–7):957–972. doi:10.1016/j.biombioe.2009.02.005.
Harris NL, Brown S, Hagen SC, Saatchi SS, Petrova S, Salas W, Hansen MC, Potapov PV, Lotsch A. 2012. Baseline Map of Carbon Emissions from Deforestation in Tropical Regions. Science. 336(6088):1573–1576. doi:10.1126/science.1217962.
Hurni K, Würsch L, Heinimann A. 2017. Google Earth Engine Image Pre-processing Tool: Background and Methods. Bern, Switzerland: Centre for Development and Environment (CDE), University of Bern.
Kammila S, Kappen JF, Rysankova D, Hyseni B, Putti VR. 2014. Clean and Improved Cooking in Sub-Saharan Africa : A Landscape Report. The World Bank Report No.: 98664. [accessed 2018 Dec 28]. http://documents.worldbank.org/curated/en/164241468178757464/Clean-and-improved-cooking-in-Sub-Saharan-Africa-a-landscape-report.
Kappen JF, Hosier RH, Tao N, Hyseni B, Usui K. 2017. Scalable business models for alternative biomass cooking fuels and their potential in Sub-Saharan Africa. The World Bank Report No.: 120561. [ac-cessed 2018 Dec 28]. http://documents.worldbank.org/curated/en/327641508494599807/Scalable-business-models-for-alternative-biomass-cooking-fuels-and-their-potential-in-Sub-Saharan-Africa.
Lohri CR, Rajabu HM, Sweeney DJ, Zurbrügg C. 2016. Char fuel production in developing countries – A review of urban biowaste carbonization. Renewable and Sustainable Energy Reviews. 59:1514–1530. doi:10.1016/j.rser.2016.01.088. [accessed 2016 Oct 13]. http://www.sciencedirect.com/science/arti-cle/pii/S1364032116001180.
Mankinen U, Käyhkö N, Koskinen J, Pekkarinen A. 2017. Privat Forestry Programme: Forest Planta-tion Mapping of the Southern Highlands - Final report. Iringa, Tanzania: Ministry of Natural Resources
Waste Biomass to Charcoal Briquettes in Tanzania Regional Supply Potential – REPIC Project Report
34
and Tourism (MNRT), University of Turku, and Food and Agriculture Organization of the United Na-tions.
Mwampamba TH. 2007. Has the woodfuel crisis returned? Urban charcoal consumption in Tanzania and its implications to present and future forest availability. Energy Policy. 35(8):4221–4234. doi:10.1016/j.enpol.2007.02.010.
Mwampamba TH, Owen M, Pigaht M. 2013. Opportunities, challenges and way forward for the char-coal briquette industry in Sub-Saharan Africa. Energy for Sustainable Development. 17(2):158–170. doi:10.1016/j.esd.2012.10.006.
NBS, REA. 2017. Energy Access Situation Report 2016 -Tanzania Mainland. Dar es Salaam, Tanzania: National Bureau of Statistics (NBS) and Rural Energy Agency (REA).
Ngusale GK, Luo Y, Kiplagat JK. 2014. Briquette making in Kenya: Nairobi and peri-urban areas. Re-newable and Sustainable Energy Reviews. 40:749–759. doi:10.1016/j.rser.2014.07.206. [accessed 2014 Aug 26]. http://www.sciencedirect.com/science/article/pii/S1364032114006662.
Njenga M, Karanja N, Karlsson H, Jamnadass R, Iiyama M, Kithinji J, Sundberg C. 2014. Additional cooking fuel supply and reduced global warming potential from recycling charcoal dust into charcoal briquette in Kenya. Journal of Cleaner Production. 81:81–88. doi:10.1016/j.jclepro.2014.06.002. [ac-cessed 2017 Apr 28]. http://www.sciencedirect.com/science/article/pii/S0959652614005861.
Njenga M, Yonemitsu A, Karanja N, Iiyama M, Kithinji J, Dubbeling M, Sundberg C, Jamnadass R. 2013. Implications of charcoal briquette produced by local communities on livelihoods and environ-ment in Nairobi, Kenya. Int J Renew Energ Dev (IJRED). 2(1):19–29.
Okoko A, von Dach SW, Reinhard J, Kiteme B, Owuor S. 2018. Life Cycle Costing of Alternative Value Chains of Biomass Energy for Cooking in Kenya and Tanzania. Journal of Renewable Energy. 2018. doi:https://doi.org/10.1155/2018/3939848. [accessed 2018 Nov 6]. https://www.hindawi.com/jour-nals/jre/2018/3939848/abs/.
Okoko A, Reinhard J, von Dach SW, Zah R, Kiteme B, Owuor S, Ehrensperger A. 2017. The carbon footprints of alternative value chains for biomass energy for cooking in Kenya and Tanzania. Sustaina-ble Energy Technologies and Assessments. 22:124–133. doi:10.1016/j.seta.2017.02.017. [accessed 2017 Apr 28]. http://www.sciencedirect.com/science/article/pii/S2213138817301261.
Pandit NR, Mulder J, Hale SE, Schmidt HP, Cornelissen G. 2017. Biochar from “Kon Tiki” flame curtain and other kilns: Effects of nutrient enrichment and kiln type on crop yield and soil chemistry. Paz-Fer-reiro J, editor. PLOS ONE. 12(4):e0176378. doi:10.1371/journal.pone.0176378.
Scholz SB, Sembres T, Roberts K, Whitman T, Wilson K, Lehmann J. 2014. Biochar Systems for Small-holders in Developing Countries: Leveraging Current Knowledge and Exploring Future Potential for Climate-Smart Agriculture. Washington DC, USA: The World Bank. [accessed 2015 Mar 12]. https://openknowledge.worldbank.org/handle/10986/18781.
Tumutegyereize P, Mugenyi R, Ketlogetswe C, Gandure J. 2016. A comparative performance analysis of carbonized briquettes and charcoal fuels in Kampala-urban, Uganda. Energy for Sustainable Devel-opment. 31:91–96. doi:10.1016/j.esd.2016.01.001. [accessed 2018 Jan 30]. http://www.sciencedi-rect.com/science/article/pii/S0973082616000028.
UNEP-WCMC. 2018. The World Database on Protected Areas (WDPA). Protected Planet. [accessed 2017 Sep 26]. https://www.protectedplanet.net/.

Waste Biomass to Charcoal Briquettes in Tanzania Regional Supply Potential – REPIC Project Report
35
Zah R, Ehrensperger A. 2014. Coordinated Advocacy for biomass friendly governance of the energy sector in Tanzania. Mandate 1: Potentials, limiations and impacts of biomass energy in Tanzania. SDC Tanzania Coordination Office, Dar es Salam.