Waste and Climate Change: Global trends and strategy framework
79
U n i t e d n a t i o n s e n v i r o n m e n t P r o g r a m m e W aste and Climate Change Global T rends and Strategy Framework
-
Upload
united-nations-environment-programme -
Category
Documents
-
view
221 -
download
0
Transcript of Waste and Climate Change: Global trends and strategy framework

8/8/2019 Waste and Climate Change: Global trends and strategy framework
http://slidepdf.com/reader/full/waste-and-climate-change-global-trends-and-strategy-framework 1/79
U n i t
e d
n a t i o n s
e n v i r o n m
e n
t
P r o g r a m
m
e
W aste and
Climate Change
Global Trends and
Strategy Framework

8/8/2019 Waste and Climate Change: Global trends and strategy framework
http://slidepdf.com/reader/full/waste-and-climate-change-global-trends-and-strategy-framework 2/79
Copyright © United Nations Environment Programme, 2010
This publication may be reproduced in whole or in part and in any orm or
educational or non-proft purposes without special permission rom the copyright
holder, provided acknowledgement o the source is made. UNEP would appreciate
receiving a copy o any publication that uses this publication as a source.
No use o this publication may be made or resale or or any other commercial
purpose whatsoever without prior permission in writing rom the United Nations
Environment Programme.
Disclaimer
The designations employed and the presentation o the material in this publication do
not imply the expression o any opinion whatsoever on the part o the United Nations
Environment Programme concerning the legal status o any country, territory,
city or area or o its authorities, or concerning delimitation o its rontiers or
boundaries. Moreover, the views expressed do not necessarily represent the decision
or the stated policy o the United Nations Environment Programme, nor
does citing o trade names or commercial processes constitute
endorsement.
UNEPpromotes environ-
mentally sound practicesglobally and in its own activities.
This publication is printed on 100%recycled paper, using vegetable -basedinks and other eco-friendly practices.Our distribution policy aims to reduce
UNEP’s carbon footprint.

8/8/2019 Waste and Climate Change: Global trends and strategy framework
http://slidepdf.com/reader/full/waste-and-climate-change-global-trends-and-strategy-framework 3/79
i
Compiled by
United Nations Environmental Programme
Division of Technology, Industry and Economics
International Environmental Technology Centre
Osaka/Shiga
Waste and Climate Change:
Global trends and strategy framework

8/8/2019 Waste and Climate Change: Global trends and strategy framework
http://slidepdf.com/reader/full/waste-and-climate-change-global-trends-and-strategy-framework 4/79
ii
AcknowledgementsThe Executive Director of UNEP has been enthusiastically following up on UNEP Governing
Council Decision 25/8 on Waste to build capacity on waste management. UNEP, based on its
successful and continuous support on waste management, has received a lot of requests from
national governments and other entities to develop a strategy for co-benefits of waste
management in the context of climate change. To develop this strategy, UNEP carried out anintensive review of linkages between waste management and climate change. Accordingly a
draft paper to highlight the linkages and draft strategy was prepared and presented during a
keynote presentation at ISWA/DAKOFA Conference on Waste as a pre COP event in
Copenhagen during 2009. This draft paper attracted a lot of interest and technical feedback. A
revised version, based on the feedback was prepared and presented at a Co-Benefits
Workshop in Thailand and at Mayor of London’s Conference on Waste and Climate Change
under C40 Leadership Initiative. The governments and local authorities, in addition to experts,
provided good inputs as well as technical and political feedback. Based on that feedback, third
draft was prepared and uploaded at UNEP IETC website (www.unep.or.jp) in July 2010 for
further comments and feedback.
Taking this opportunity, we would like to thank all those experts and government officials, whoprovided valuable feedback to realize this publication and future path for our activities on waste
in the context of climate change. We are also very grateful to Dr. Jessica North of Hyder
Consulting Pty Ltd. (Australia) for her work and patients to work with different stakeholders on
this publication.

8/8/2019 Waste and Climate Change: Global trends and strategy framework
http://slidepdf.com/reader/full/waste-and-climate-change-global-trends-and-strategy-framework 5/79
iii
CONTENTS
Executive summary ............................................................................. 1
Abbreviations ........................................................................................ 3
1 Introduction ........................................................................................... 4
1.1 Context ....................................................... .......................................... 4
1.2 Scope of work ................................................. ...................................... 6
2 Waste management and GHG ............................................................. 8
2.1 Background .......................................................................................... 8
2.2 Sources of GHG ................................................................................... 8
2.3 GHG savings ...................................................................................... 11
2.4 Biogenic carbon .................................................................................. 13
3 Climate impact of waste ..................................................................... 14
3.1 Waste and climate change studies ..................................................... 14
3.2 Global trends in waste generation and management ......................... 14
3.2.1 Decoupling waste generation from GDP ............................ 16
3.2.2 Global landfill emissions and data quality .......................... 16
3.3 Climate impact of waste management practices ................................ 18
3.3.1 Landfill ............................................................................... 18
3.3.2 Thermal treatment ............................................................. 22
3.3.3 Mechanical biological treatment ........................................ 26
3.3.4 Composting and anaerobic digestion (of source-separated
organic wastes) ........................................................ ......... 28
3.3.5 Recycling ........................................................................... 30
3.3.6 Waste prevention ............................................................... 34
3.4 Summary of GHG implications of waste management practices ........ 36
4 Development of international strategy framework .............................. 40
4.1 Context – international conventions .................................................... 40
4.1.1 Need for enhanced action .................................................. 41
4.2 Current international activity – waste and climate change .................. 43
4.2.1 Offsetting: CDM and JI ...................................... ................ 44
4.3 Gap analysis ....................................................... ................................ 45
4.4
Strategy framework ............................................................................ 47
4.4.1 Vision .......................................................... ....................... 48
4.4.2 Goals ................................................................................. 48
4.4.3 Guiding principles .............................................................. 48
4.4.4 Functions ........................................................................... 48
4.4.5 Actions .......................................................... ..................... 50
4.4.6 Approach ........................................................................... 54
4.5 Summary of framework strategy development ................................... 55
5 REFERENCES ................................................................................... 56
Appendix A – UNEP Decision GC 25/8 ........................................................ 61
Appendix B – Bali Declaration ...................................................................... 64
Appendix C – International activity ............................................................... 66
Appendix D – CDM waste projects ............................................................... 70

8/8/2019 Waste and Climate Change: Global trends and strategy framework
http://slidepdf.com/reader/full/waste-and-climate-change-global-trends-and-strategy-framework 6/79

8/8/2019 Waste and Climate Change: Global trends and strategy framework
http://slidepdf.com/reader/full/waste-and-climate-change-global-trends-and-strategy-framework 7/79
1
Executive summaryAt a global scale, the waste management sector makes a relatively minor contribution to
greenhouse gas (GHG) emissions, estimated at approximately 3-5% of total anthropogenic
emissions in 2005. However, the waste sector is in a unique position to move from being a
minor source of global emissions to becoming a major saver of emissions. Although minor
levels of emissions are released through waste treatment and disposal, the prevention andrecovery of wastes (i.e. as secondary materials or energy) avoids emissions in all other sectors
of the economy. A holistic approach to waste management has positive consequences for GHG
emissions from the energy, forestry, agriculture, mining, transport, and manufacturing sectors.
The Governing Council of the United Nations Environment Programme (UNEP) has directed its
International Environmental Technology Centre (IETC) branch to take action in the area of
waste management. There are substantial co-benefits of waste management in the context of
climate change. As a first step to realize these co-benefits, this paper seeks (a) to examine the
potential climate impacts and benefits of different waste management activities, and (b) to
present a UNEP-led framework strategy to assist member countries in prioritising their
resources and efforts for waste management and climate change mitigation. The framework
strategy is intended to align with the internationally recognised waste management hierarchy, inwhich waste prevention receives the highest priority, to optimise the co-benefits for climate
change mitigation.
Every waste management practice generates GHG, both directly (i.e. emissions from the
process itself) and indirectly (i.e. through energy consumption). However, the overall climate
impact or benefit of the waste management system will depend on net GHGs, accounting for
both emissions and indirect, downstream GHG savings. The actual magnitude of these
emissions is difficult to determine because of poor data on worldwide waste generation,
composition and management and inaccuracies in emissions models. Although currently OECD
countries generate the highest levels of methane, those of developing nations are anticipated to
increase significantly as better waste management practices lead to more anaerobic, methane-producing conditions in landfills.
Estimates of GHG emissions from waste management practices tend to be based on life-cycle
assessment (LCA) methods. LCA studies have provided extremely useful analyses of the
potential climate impacts and benefits of various waste management options. However, due to
data availability and resources, LCA studies are primarily focussed on scenarios appropriate for
developed countries. Due to the key, underlying assumptions on which these assessments are
based (such as local/regional waste composition, country-specific energy mix, technology
performance, etc) the results are not necessarily transferable to other countries. This makes it
generally impossible to make global comparisons regarding the GHG performance of different
waste management technologies.
The climate benefits of waste practices result from avoided landfill emissions, reduced raw
material extraction and manufacturing, recovered materials and energy replacing virgin
materials and fossil-fuel energy sources, carbon bound in soil through compost application, and
carbon storage due to recalcitrant materials in landfills. In particular, there is general global
consensus that the climate benefits of waste avoidance and recycling far outweigh the benefits
from any waste treatment technology, even where energy is recovered during the process.
Although waste prevention is found at the top of the ‘waste management hierarchy’ it generally
receives the least allocation of resources and effort. The informal waste sector makes a
significant, but typically ignored, contribution to resource recovery and GHG savings in cities of
developing nations.
A range of activities focussed on waste and climate change are currently being led by
international organisations, including UNEP. There is clear recognition of the considerable
climate benefit that could be achieved through improved management of wastes. UNEP is

8/8/2019 Waste and Climate Change: Global trends and strategy framework
http://slidepdf.com/reader/full/waste-and-climate-change-global-trends-and-strategy-framework 8/79
2
involved in a variety of relevant partnerships and programmes, such as Integrated Waste
Management, Cleaner Production, and Sustainable Consumption and Production. There is also
strong interest in Clean Development Mechanism (CDM) projects in the waste sector. CDM
activity has focussed mainly on landfill gas capture (where gas is flared or used to generate
energy) due to the reduction in methane emissions that can be achieved.
However, there is a lack of a cohesive approach, which has resulted in gaps, duplication, and
regional disparity is programmes offered. A central mechanism is needed to collaborate with
existing organisations to ensure accessibility to and dissemination of relevant information across
the globe, effective use of resources to achieve climate benefit through integrated waste
management, promotion of best practice, and rapid transfer of simple, effective, proven
technologies and knowledge to developing countries.
UNEP is clearly positioned to help catalyse enhanced action for climate change mitigation within
the waste sector, collaborating with existing organisations to ensure more effective delivery of
initiatives across the globe. As the designated authority of the United Nations system in
environmental issues, UNEP has a key role to play in providing leadership and encouraging
partnerships in the fields of waste management and climate change. The development of a
framework strategy to implement the proposed mechanism requires input from a range ofstakeholders. To this end, the current report is intended as a further step in a global dialogue to
engage the international waste community, identify the key issues, and create a strategy that
will deliver significant climate benefit in the waste sector.

8/8/2019 Waste and Climate Change: Global trends and strategy framework
http://slidepdf.com/reader/full/waste-and-climate-change-global-trends-and-strategy-framework 9/79
3
Abbreviations
BAU Business as usual
CDM Clean development mechanism
CER Certified emission reduction
CH4 Methane
CO2 Carbon dioxide
CO2-e CO2 equivalent
DAKOFA Danish Waste Management Association (eng.)
DOC Degradable organic carbon
DTIE Division of Technology, Industry and Economics (UNEP)
EIT Economies in transitionEPR Extended producer responsibility
FOD First order decay
GDP Gross domestic product
GEF Global Environment Fund
GHG Greenhouse gas
IPCC Intergovernmental Panel on Climate Change
ISWA International Solid Waste Association
JI Joint implementation
LFG Landfill gas
MBT Mechanical biological treatment
MSW Municipal solid waste
N2O Nitrous oxide
OECD Organisation for Economic Co-operation and Development
RDF Refuse derived fuel
SBC Secretariat of the Basel Convention
SCP Sustainable Consumption and Production
UNEP United Nations Environmental Programme
UNFCCC United Nations Framework Convention on Climate Change
WEEE Waste electrical and electronic equipment

8/8/2019 Waste and Climate Change: Global trends and strategy framework
http://slidepdf.com/reader/full/waste-and-climate-change-global-trends-and-strategy-framework 10/79
4
1 Introduction
The waste management sector is in a unique position to move from being a comparatively minor
source of global greenhouse gas (GHG) emissions1
to becoming a major contributor to reducing
GHG emissions. Although minor levels of emissions are released through waste treatment and
disposal, the prevention and recovery of wastes (i.e. as secondary materials or energy) avoids
emissions in other sectors of the economy. A holistic approach to waste management haspositive consequences for GHG emissions from the energy, agriculture, transport, and
manufacturing sectors. A recent report by the US EPA estimates that 42% of total GHG
emissions in the US are associated with the management of materials (US EPA 2009).
A number of international organisations include waste and climate change initiatives in their
portfolio of activities, recognising the considerable climate benefit that could be achieved
through improved management of wastes. UNEP is clearly positioned to help catalyse
enhanced action for climate change mitigation within the waste sector, collaborating with
existing organisations to ensure more effective delivery of initiatives across the globe. As the
designated authority of the United Nations system in environmental issues, UNEP has a key
role to play in providing leadership and encouraging partnerships in the fields of wastemanagement and climate change.
1.1 Context
Waste generation does not result in positive impacts on climate. Waste treatment and disposal
can have both positive and negative climate impacts. Therefore, an increasingly key focus of
waste management activities is to reduce GHG emissions. To strengthen waste management
activities in the context of climate change, UNEP is preparing to develop a full scale programme
based on its activities on waste management.
UNEP, through the International Environmental Technology Centre (IETC) and SustainableConsumption and Production (SCP) branches of the Division of Technology, Industry and
Economics (DTIE), and through the Secretariat of the Basel Convention (SCB), is supporting
the implementation of UNEP Government Council decision (GC 25/8) on Waste Management
and the Bali Declaration by Conference of Parties (COP) of the Basel Convention on Waste
Management for Human Health.2
These two pivotal UNEP decisions direct DTIE to take action
in the area of waste and climate change.
UNEP is already undertaking various programmes and projects to assist its member countries
to achieve improved waste management. These programmes and projects include Integrated
Solid Waste Management (ISWM) based on the 3R (reduce, recycle, and reuse) approach,
Sustainable Consumption and Production, E-waste management, converting waste agriculture
biomass and waste plastics into useful energy and/or material resources, and management ofhazardous waste. ISWM is a central theme of the current paper, which aims to look at the
climate impact and benefit of the full range of waste practices, from waste avoidance to
disposal, and develop the framework for a cohesive international strategy. UNEP is
simultaneously proposing a ‘Global Platform for Waste Management’ (GPWM) to facilitate
coherent delivery of international support for waste management – there would be clear
1Waste sector emissions were estimated to account for 3-5% of total global anthropogenic emissions in 2005 (Bogner et
al 2007).
2GC 25/8 is presented in more detail in Appendix A – UNEP Decision. The Bali Declaration is presented in detail in
Appendix B – Bali Declaration.

8/8/2019 Waste and Climate Change: Global trends and strategy framework
http://slidepdf.com/reader/full/waste-and-climate-change-global-trends-and-strategy-framework 11/79
5
synergies between a GPWM mechanism and an international strategy for waste and climate
change.
UNEP’s initiatives, including the current report, endeavour to align with the prioritisation of
activities presented in the waste management hierarchy (see Figure 1). As described by the
International Solid Waste Association (ISWA 2009):
‘ …the waste hierarchy is a valuable conceptual and political prioritisation tool which can assist in
developing waste management strategies aimed at limiting resource consumption and protecting
the environment’.
As a result, priority is given in order to waste minimisation, re-use, recycling, waste-to-energy,
and finally landfill.
Figure 1: The waste hierarchy
The present paper presents examples of the potential benefits of different waste management
activities for climate change abatement, discusses the relationships between waste and climate
change, and identifies specific impacts of waste management on climate change. The objective
of the paper is to identify the potential impacts and benefits of different waste management
systems in terms of climate impact, derived from information presented in the literature. Based
on these findings, a framework is proposed for developing a UNEP-led international strategytargeting waste and climate change initiatives.
There is a considerable body of literature regarding waste and climate change. The present
report does not purport to make a further scientific contribution, or to make an exhaustive
assessment of all existing publications, but rather demonstrates the wide range of issues taken
into consideration by UNEP in development of the framework strategy. The intention is not to
derive conclusions regarding the climate performance of one waste management approach
versus another – sustainable solid waste management requires consideration of a range of
systems and methods, appropriate to local conditions. Instead, the present report attempts to
guide the strategy framework towards allocation of limited resources to priority actions, aligned
with both climate change mitigation and the waste hierarchy.
WASTE PREVENTION
RE-USE
RECYCLING
WASTE-TO-ENERGY
LANDFILL

8/8/2019 Waste and Climate Change: Global trends and strategy framework
http://slidepdf.com/reader/full/waste-and-climate-change-global-trends-and-strategy-framework 12/79
6
1.2 Scope of work
This paper examines the climate impact of management systems for municipal solid waste
(MSW), commercial and industrial (C&I) waste (excluding mining and munitions), construction
and demolition (C&D) waste, agricultural waste, and hazardous waste (where data is available),
at a global scale. Wastewater management is not addressed within the scope of the present
report.
The classification of waste streams varies from country to country and often makes it difficult to
discern separate waste streams in international reports. In Europe, for example, MSW is often
defined as all waste arising within a municipal boundary, including any commercial, industrial,
construction, and hazardous waste. In Australia, MSW refers to household waste and
commercial waste collected with household waste. Construction and demolition waste may also
be counted as commercial waste. Although climate impacts from wastewater and sewage
treatment are not specifically discussed in the present report, these issues are significant, and
certainly deserve detailed assessment. In some countries, bio-solids from wastewater treatment
plants are included in totals of solid waste, and may therefore be included in reports of solid
waste. Indeed, the two are occasionally treated at the same facility. The term ‘biowaste’ is used
in the current paper in the European sense to mean biodegradable material, such as food and
garden wastes.
Parameters of this paper are restricted to GHG emissions and GHG benefits associated with
fossil fuel savings and material substitution, since its focus is the climate impact of waste
management practices. Discussions focus on the GHG of particular relevance to waste
management, notably carbon dioxide (CO2), methane (CH4), and nitrous oxide (N2O). The
majority of waste and climate change studies adopt a time-horizon of 100 years over which to
consider the consolidated impact of GHG. Whether or not this arbitrary time-frame is
appropriate is not a focus of the current paper.
For the majority of waste management scenarios examined, the climate impact is consideredfrom the point of waste generation to the point of material reuse, recovery, or final disposal – the
embodied resources and energy in wasted materials are not considered. However, in the case
of recycling and waste prevention, a climate benefit is examined in terms of avoided primary
manufacture of materials (i.e. avoided inputs of resources and energy). The climate impact of
the production of a marketable product from recovered materials, and the replacement of raw
materials with recovered product, is included.
The focus is primarily on the climate impacts of direct and indirect emissions from waste
treatment, recovery, and disposal processes. A complete discussion of the climate change
impacts of waste management requires discussion of upstream, direct, and downstream GHG
contributions. Upstream contributions arise from inputs of energy and ancillary materials; direct
emissions are from system operations; and downstream contributions and savings relate to
energy and material substitution and carbon storage/sequestration (Gentil et al 2009). Typically,
not all GHG contributions are accounted for in emissions reports (see Table 1). Some
contributions are minor – for example, waste collection usually represents only a small fraction
of the overall GHG balance of waste management systems (e.g. less than 5% (Smith et al 2001;
Dehoust et al 2005)).

8/8/2019 Waste and Climate Change: Global trends and strategy framework
http://slidepdf.com/reader/full/waste-and-climate-change-global-trends-and-strategy-framework 13/79
7
Table 1: A generalised description of 'accounted' and 'not accounted' indirect and direct GHG emissions and
savings (adapted from Gentil et al 2009)
Upstream (indirect) Direct (operating) Downstream (indirect)
Accounted Production of fuel,
electricity, heat, and
ancillary materials
Collection and
transport, intermediate
facilities, recycling,aerobic / anaerobic
biological treatment,
thermal treatment,
landfill
Emissions and savings
of energy / material
substitution, carbonsequestration / storage
Not accounted Unaccounted GHGs,
construction,
maintenance,
decommissioning,
import-export,
embedded energy in
waste
Unaccounted GHGs,
unaccounted waste
streams, historical
waste (in landfill), staff
commuting and travel
Unaccounted GHGs,
decommissioning (end-
of-life)
The current report assumes a basic understanding of waste management systems, processes
and policy.
The limitations of a report that focuses solely on the climate impacts of waste management
should be emphasised. The generation, treatment, and disposal of waste create myriad
additional environmental, social, and economic impacts – many of them adverse. Clearly, there
is some danger in considering only the climate aspects of an activity. Although the background
report highlights the climate impacts of waste activities, any strategy in this field must
necessarily be part of a wider, more holistic, integrated approach to global resource use andmanagement.
Minimal reference is made to costs in the following sections – a financial assessment of waste
management systems is beyond the scope of the current report. This can be seen as a major
limitation given that financial resources in this area are scarce, and an international framework
strategy must necessarily address the distribution of those resources to best address waste and
climate change.

8/8/2019 Waste and Climate Change: Global trends and strategy framework
http://slidepdf.com/reader/full/waste-and-climate-change-global-trends-and-strategy-framework 14/79
8
2 Waste management and GHG
2.1 Background
GHG emissions and savings (credits) are attributable to various stages of a waste management
system. Figure 2 shows a simplified schematic of a municipal waste management system with
the predominant climate impact sources. The general suite of activities – collection, separation,
treatment, transfer, and disposal – applies to all waste types (i.e. MSW, C&I, C&D, hazardous),
with varying levels of sophistication, with the possible exception of agricultural waste. In many
rural areas, agricultural waste is dealt with in-situ, through uncontrolled burning, burial, or simple
land dumping.
Evidently, not all sources of emissions are indicated in the diagram: there are further
environmental burdens associated with manufacture of waste receptacles, vehicles, and
treatment facilities, as well as the transfer of residual waste materials from intermediate stations
and treatment facilities to landfill.
Figure 2 Simplified schematic of waste management system and GHG emissions (applicable to urban waste
management)
2.2 Sources of GHG
Methane emissions from landfill are generally considered to represent the major source of
climate impact in the waste sector (this impact is quantified in later sections). It is worth noting
that, if a broader view of waste management were taken, which included materials
management, landfill methane would no longer be the largest source of GHG in the sector. The
potential to save GHG through improved materials management (i.e. preventing material waste)
is discussed in later sections.
Waste contains organic material, such as food, paper, wood, and garden trimmings. Once
waste is deposited in a landfill, microbes begin to consume the carbon in organic material,
which causes decomposition. Under the anaerobic conditions prevalent in landfills, the microbial
communities contain methane-producing bacteria. As the microbes gradually decompose
organic matter over time, methane (approximately 50%), carbon dioxide (approximately 50%),
Treatment
process
Materialrecovery
Landfill
GHG
emissions
GHG
emissions
Energy –
GHG
Energy -
GHG offsets
GHG
emissions
Energy –
GHG
GHG
emissions

8/8/2019 Waste and Climate Change: Global trends and strategy framework
http://slidepdf.com/reader/full/waste-and-climate-change-global-trends-and-strategy-framework 15/79
9
and other trace amounts of gaseous compounds (< 1%) are generated and form landfill gas. In
controlled landfills, the process of burying waste and regularly covering deposits with a low-
permeability material creates an internal environment that favours methane-producing bacteria.
As with any ecological system, optimum conditions of temperature, moisture, and nutrient
source (i.e. organic waste) result in greater biochemical activity and hence greater generation of
landfill gas.
The gradual decay of the carbon stock in a landfill generates emissions even after waste
disposal has ceased. This is because the chemical and biochemical reactions take time to
progress and only a small amount of the carbon contained in waste is emitted in the year this
waste is disposed. Most is emitted gradually over a period of years.
Methane and carbon dioxide (CO2) are greenhouse gases (GHG), whose presence in the
atmosphere contribute to global warming and climate change. Methane is a particularly potent
GHG, and is currently considered to have a global warming potential (GWP) 25 times that of
CO2 when a time horizon of 100 years is considered; the GWP is much higher (i.e. 72) when a
20-year time horizon is applied (see Table 2). Evidently, the choice of time horizon can have a
dramatic effect on the estimated climate impact of methane emissions. Ideally, and in-line with
IPCC guidance (1995), the choice of time horizon should reflect climate policy, or the climateeffect of most concern. For example if the aim of a policy is to reduce the immediate or near-
future levels of GHG, or minimise the rate of climate change, then a 20-year horizon is most
appropriate. However, if the focus is on minimising the ‘risk of long-term, quasi-irreversible
climate or climate-related changes’, then a 100 or 500 year time horizon is most suitable
(Fuglestveldt et al 2001). However, as noted by an IPCC scientist: ‘the time horizons tend to be
misused or even abused. Industries tend to pick the horizon that puts their ‘product’ in the best
light’ (Fuglestveldt et al 2001).
In terms of reporting landfill emissions, the Intergovernmental Panel on Climate Change (IPCC)
has set an international convention to not report CO2 released due to the landfill decomposition
or incineration of biogenic sources of carbon – biogenic carbon is accounted for under the ‘land
use / land use change and forestry’ (LULUCF) sector (see discussion below, and refer to IPCC
(2006) for accounting methodologies). Therefore, where landfill is concerned, only methane
emissions are reported, expressed as tonnes of CO2 equivalent (i.e. 1 tonne of methane is
expressed as 25 tonnes of CO2-e). In practice, methane emissions from landfill are rarely
measured, but rather estimated for reporting.
Table 2 Global warming potential (GWP) for a given time horizon (Forster et al 2007)
Greenhouse gas GWP
20-yr
(kg CO2-e)
GWP (IPCC 2007)
100-yr
(kg CO2-e)
GWP
500-yr
(kg CO2-e)
Carbon dioxide CO2 1 1 1
Methane CH4 72 25 7.6
Nitrous oxide N2O 289 298 153
Estimates of methane emissions from landfill are generally made using a first order decay
(FOD) model, which calculates the rate of methane generation as proportional to waste input.
The IPCC Tier 1 and Tier 2 FOD (IPCC 2006) model is used by most countries to produce
national GHG inventories, and tends to also form the basis for in-country reporting and
regulations. EMCON Associates originally developed the FOD model to estimate methane
generation and recovery from landfills in 1980 to assist LFG capture projects. The model was
not intended for use as a tool to calculate ‘fugitive’ emissions, and has been shown to vary in

8/8/2019 Waste and Climate Change: Global trends and strategy framework
http://slidepdf.com/reader/full/waste-and-climate-change-global-trends-and-strategy-framework 16/79
10
how accurately it can predict emissions (compared to direct measurements using static
chambers) (Bogner et al 2009).
A key piece of information to input to the model is the quantity and composition of waste
deposited in landfills. These parameters vary enormously between and within individual sites,
regions, and countries, and reliable data is costly and time-consuming to obtain. For these
reasons, the IPCC provides a set of default values, which can be used where data is
unavailable to calculate national GHG emissions from landfill. However, it should be noted that
the use of default values could cause the FOD model to significantly underestimate or
overestimate methane emissions (see discussions regarding uncertainty of estimates in the
following literature review).
Where landfill gas is captured and used to generate electricity, it should be recognised that
fugitive methane leaks from the system also contribute to total landfill GHG emissions. The
climate benefit of this energy generation is discussed in the following sections.
Methane from wastewater management is the second largest source of GHG emissions from
the waste sector as a whole, according to IPCC inventories (Bogner et al 2008). As previously
stated, wastewater is not discussed within the scope of the present report, but certainly meritsglobal attention. Additional, comparatively minor sources of GHG from the waste sector at the
global scale include combustion of waste, and biological treatment. Uncontrolled burning of
waste is largely obsolete in developed countries, but continues to be practiced in developing
regions, causing release of CO2.3
Some landfills in developing countries, such as the Smokey
Mountain site in Manila, smoulder continuously.
Controlled burning, in waste incinerators, also generates CO2 emissions. Where incinerators
generate energy, GHG may also be credited – this is discussed in the following section. Where
incinerators do not generate energy, they will be net energy users, which will also contribute to
their total GHG emissions. Advanced thermal treatment technologies, such as gasification and
pyrolysis, may emit fewer emissions compared to mass-burn incineration. However, these are
emerging technologies and cannot be considered ‘established’ technologies for the treatment of
bulk mixed waste.
Aerobic composting processes directly emit varying levels of methane and nitrous oxide,
depending on how the process is managed in practice. Closed systems, such as enclosed
maturation bays or housed windrows, reduce emissions through use of air filters (often bio-
filters) to treat air exiting the facility. Compost plants require varying, but usually small, amounts
of energy input (with associated ‘upstream’ GHG emissions). Further GHG emissions occur
‘downstream’, depending on the application of the compost product – CO2 will be gradually
released as the compost further degrades and becomes integrated with soil-plant systems.
Anaerobic digestion (AD) systems are enclosed in order to capture and contain the biogasgenerated by the digestion process. GHG emissions from AD facilities are generally limited to
system leaks from gas engines used to generate power from biogas, fugitive emissions from
system leaks and maintenance, and possible trace amounts of methane emitted during
maturation of the solid organic output. Such systems also consume energy, however plants are
generally self-sustaining if appropriately operated (i.e. a portion of the biogas output generates
energy for use in-plant). ‘Downstream’ GHG emissions will depend on the application of the
matured digestate (as per aerobic compost product).
3Numerous other air pollutants are released during open, uncontrolled burning – the scope of the present paper is
limited to GHG emissions.

8/8/2019 Waste and Climate Change: Global trends and strategy framework
http://slidepdf.com/reader/full/waste-and-climate-change-global-trends-and-strategy-framework 17/79
11
Mechanical biological treatment (MBT) encompasses mechanical sorting of the mixed residual
waste fraction, with some recovery of recyclable materials (limited due to contamination), and
separation of a fine, organic fraction for subsequent biological treatment. The biological
component may include anaerobic digestion with recovery of biogas for energy/heat generation,
or aerobic composting to produce a biologically stable product for either land application (limited
applicability) or use as refuse-derived fuel (RDF) to substitute fuel in industrial furnaces (i.e. co-
incineration in cement kilns). MBT facilities vary considerably in terms of sophistication,
configuration, scale, and outputs. GHG emissions associated with MBT are due to energy inputs
(although AD systems may be self-sustaining), direct process emissions (this will depend on the
air protection control system, such as a biofilter, attached to the aerobic composting
component), gas engine emissions (for AD), and use of the composted organic output (disposed
of to landfill or applied to land). There is some use of composted MBT output to remediate
contaminated land, however most OECD countries strictly regulate the use of compost derived
from mixed waste, and the majority is disposed of in landfill, or used as cover material for landfill
operations.
2.3 GHG savings
In the context of the current report, the waste sector can save or reduce GHG emissions
through several activities:
Avoiding the use of primary materials for manufacturing through waste avoidance and
material recovery (i.e. the GHG emissions associated with the use of primary materials –
mostly energy-related – are avoided)
Producing energy that substitutes or replaces energy derived from fossil fuels (i.e. the
emissions arising from the use of waste as a source of energy are generally lower than
those produced from fossil fuels).
Storing carbon in landfills (i.e. carbon-rich materials that are largely recalcitrant in
anaerobic landfill conditions, such as plastics and wood) and through application ofcompost to soils
4.
Indeed, depending on which GHG accounting convention is used5, the waste sector is capable
of generating a net GHG benefit through waste avoidance, material recovery, and energy
recovery.
Waste minimisation refers to waste avoidance, through various mechanisms such as Cleaner
Production and material light-weighting, and waste reduction. Reduction of waste post-
generation is achieved through re-use and recycling. Indefinite re-use may be assumed for
certain items in the waste stream, and closed-loop recycling may be assumed for certain types
of materials (i.e. aluminium, steel, HDPE, PET, glass). Open-loop recycling, ‘down-cycling’, and
industrial symbiosis are additional recycling methods. From a climate perspective, the benefits
of both re-use and recycling are realised in avoided GHG emissions from waste treatment and
disposal, and a GHG benefit in avoided resource extraction and manufacture of new products.
4The IPCC methodology for reporting national GHG inventories does not credit the waste sector with GHG savings due
to long-term carbon storage in landfills, but rather requests that this detail is reported as an ‘information item’ in the waste
sector. The methodology also does not credit GHG savings to long-term carbon storage due to compost application to
land (IPCC 2007).
5There is no universally accepted method for accounting for GHG emissions in the waste sector. Some conventions may
not consider ‘material avoidance’ to generate a GHG saving with respect to waste – the saving may be credited to theindustrial/manufacturing sector, or considered outside the boundaries of waste management. It is important to note
nevertheless that the waste sector delivers this saving.

8/8/2019 Waste and Climate Change: Global trends and strategy framework
http://slidepdf.com/reader/full/waste-and-climate-change-global-trends-and-strategy-framework 18/79
12
Recycling processes also vary between developed and developing nations. For example, there
may be significant GHG emissions associated with poorly regulated, low-technology paper
recycling plants in a developing country, which may reduce the net climate benefit associated
with paper recycling. However, it may be reasonable to expect improvement in facility
performance across the globe as standards progress into the future. The informal recycling
sector often plays a significant, yet largely unrecognised role in waste management of
developing nation cities. For example, Delhi waste pickers collect and recycle 15-20% of the
city’s MSW (Chintan 2009).
The compost output (from facilities that accept source-separated organic wastes) is typically
assumed to substitute for the primary production of mineral fertilisers and/or peat – in either
case, there is an associated GHG saving from avoided primary production. There are additional
GHG benefits from reduced use of irrigation, pesticides, and tillage where compost is regularly
applied to agricultural land.
AD systems and thermal treatments equipped with energy recovery systems generate power
(electricity or heat) that can be assumed to replace a fossil-fuel based power source, with a
consequent GHG benefit. This is also the case for landfill gas capture systems, which collect a
portion of the gas (CO2 and CH4) generated in a landfill and use it to produce energy (usuallyelectricity through gas engines). The GHG credit will vary depending on the source of fossil fuel
that is assumed to be replaced – for example, substituting a coal power-source results in a
much higher credit than substituting power derived from natural gas. These benefits are likely to
decrease in most countries as the carbon intensity of national energy supplies declines. Where
renewable sources of energy predominate, such as hydro, wind and solar, there may be no
GHG savings associated with energy derived from waste.
It is effectively impossible to identify a ‘true’ level of GHG savings associated with the
substitution of conventional energy sources. The GHG results presented in a given study will
depend on a number of factors, including:
Whether the energy is assumed to be produced as electricity, heat, or a combination;
Whether the energy produced is substituting the country average mix of power sources
(i.e. % coal, % gas, % wind/solar/hydro) or marginal sources (i.e. the source(s) most likely
to be replaced by the additional contribution of energy-derived waste) (see Fruergaard et
al (2009) for a detailed discussion of average and marginal energy, and the implications
for GHG studies);
Assumed efficiencies of different energy-producing technologies;
How the provision of fuel has been accounted for (i.e. GHG emissions from extraction of
raw materials, processing, storage, and transportation) (Fruergaard et al 2009); and
How the provision of electricity and/or heat has been accounted for (i.e. GHG emissionsfrom combustion of fuels, construction/demolition of the facilities themselves, and
management of wastes) (Fruergaard et al 2009).
The GHG savings attributed to energy recovery in waste management systems often represent
a significant portion of the estimated GHG balance. The factors noted above are not always
clearly or transparently presented in studies, and will also vary considerably between countries
and regions, which make useful comparisons difficult to achieve.
Further discussions of the assumptions and implications of GHG savings are found in the
following literature review.
8/8/2019 Waste and Climate Change: Global trends and strategy framework
http://slidepdf.com/reader/full/waste-and-climate-change-global-trends-and-strategy-framework 19/79
13
2.4 Biogenic carbon
Many studies that examine the linkages between waste and climate change adopt the current
IPCC convention for national GHG inventories of ignoring the contribution of CO 2 emitted from
biogenic materials where these materials are grown on a sustainable basis. The argument is
that during the growth of the plants, carbon has been taken-up and incorporated, and that same
amount of carbon is emitted when burnt or aerobically decomposed – the carbon equation iseffectively ‘neutral’. There are several points to this argument that are worth considering:
Climate change is time-critical – it is widely accepted that immediate reductions in global
GHG emissions are essential to reduce the impact of climate change. The atmosphere
does not differentiate between a molecule of biogenic CO2 and a molecule of fossil -
derived CO2; therefore it appears logical that immediate efforts should be made to
minimise emissions of all CO2, regardless of source.
Plant growth – particularly of trees and longer-lived species – does not occur evenly over
years and seasons, and the initial up-take of carbon by a seedling is far less than the
uptake of carbon by a mature plant. Therefore it could be several years before a flux of
biogenic CO2 emitted instantaneously from a process (i.e. combustion of biogenic carbon)is re-captured through plant growth.
The majority of wood, paper, and agricultural materials that enter the waste stream have
not been produced through sustainable forestry/land practices – unsustainable practices
deplete the carbon stored in forests and soil over time. According to IPCC methodologies
for reporting national GHG inventories, if any factor ‘…is causing long-term decline in the
total carbon embodied in living biomass (e.g., forests), this net release of carbon should
be evident in the calculation of CO2 emissions described in the Agriculture, Forestry and
Other Land Use (AFOLU) Volume of the 2006 Guidelines ’. However, it is unclear how and
whether this information is being recorded in all cases.
In a national GHG inventory for IPCC purposes, where deforestation and re-growth is
accounted for in the land-use category (LULUCF), there may be an argument for ignoring
biogenic carbon. However, in an examination of the GHG impact of waste management
systems, where solutions are being sought to reduce emissions in the waste sector, there
is justification for including all sources of GHG.
The benefits that accrue from a reduction in total CO2, irrespective of the source, would
seem to be the best indicator of the consequences of the different options. The key
theme is climate change and how to mitigate it, not differentiation of carbon sources.
The majority of literature referred to in the current report presents climate impacts following the
IPCC convention. However, the reader is urged to keep in mind the relevance of excluding
biogenic carbon from the climate change equation6.
6Further discussion of biogenic carbon can be found in, for example: Eunomia (2008a), Rabl et al 2008, and Christensen
et al (2009).

8/8/2019 Waste and Climate Change: Global trends and strategy framework
http://slidepdf.com/reader/full/waste-and-climate-change-global-trends-and-strategy-framework 20/79
14
3 Climate impact of waste
3.1 Waste and climate change studies
The international literature on linkages between waste and climate change is largely focussedon MSW in developed countries, and there is limited reference or comparison to the impact of
other waste streams or waste management in developing nations. The national studies rely on
availability of extensive waste data sources, which is generally not the case in developing
countries.
A large body of work takes a life-cycle assessment (LCA) approach to evaluating the current
and potential future climate impact of waste scenarios. Although LCA is recognised as a
valuable method for assessing direct and indirect impacts of waste systems (Bogner et al 2007),
there is still considerable debate over methodology in this type of assessment, as well as
inherent uncertainty. A key guideline for LCA results is that they should not be taken out of the
context of the originating study (which tends to be very localised), should not be regarded asabsolute values, and should only be considered for comparative purposes within the study (i.e.
to compare the relative performance of different waste management options for a given city or
defined region).
Furthermore, national studies are based on domestic production, consumption, transportation,
recovery and disposal processes. However, waste streams may include considerable quantities
of imported products, and many countries export secondary materials to foreign recycling
markets. The climate impact attributed to a domestic process may be very different to that of a
foreign process.
For these reasons, the current report does not endeavour to derive ‘global’ values for the GHG
impacts and benefits of different waste management approaches – this would be impossible.Rather, the report attempts to indicate where potential impacts and benefits may be found within
the waste management sector. Where specific examples are provided, the country or regional
context for which they were originally developed is presented. The magnitude of impacts and
benefits will vary for any given waste management method, depending on local conditions and
specific study assumptions. Disparities between conditions in developed and developing nations
make comparisons unfeasible. Therefore, it cannot be concluded that one waste management
approach in particular has, universally, a better climate impact than any other approach.
3.2 Global trends in waste generation and managementWaste generation and waste composition varies between and also within countries (see Table
5), primarily due to differences in population, urbanisation and affluence. However, as already
noted above, this type of information tends to be compromised (where used for comparative
purposes) by the variance in definition of waste. Waste generation rates have been positively
correlated to per capita energy consumption, GDP and final private consumption (Bogner et al
2008). Europe and the United States are the main producers of MSW in absolute terms
(Lacoste and Chalmin, 2006).
Although developed countries are striving to decouple waste generation from economic growth,
overall reduction in waste generation remains a challenge, partiuclarly where populations are
increasing.
8/8/2019 Waste and Climate Change: Global trends and strategy framework
http://slidepdf.com/reader/full/waste-and-climate-change-global-trends-and-strategy-framework 21/79
15
In non-OECD regions, as countries progress towards achieving a higher standard of living,
waste generation per capita and overall national waste production is set to increase accordingly
if current production/consumption patterns persist. Although average annual per capita waste
generation in developing nations is estimated at 10-20% that of developed nations, this figure is
constantly rising in response to economic growth. Globally, waste generation is increasing.
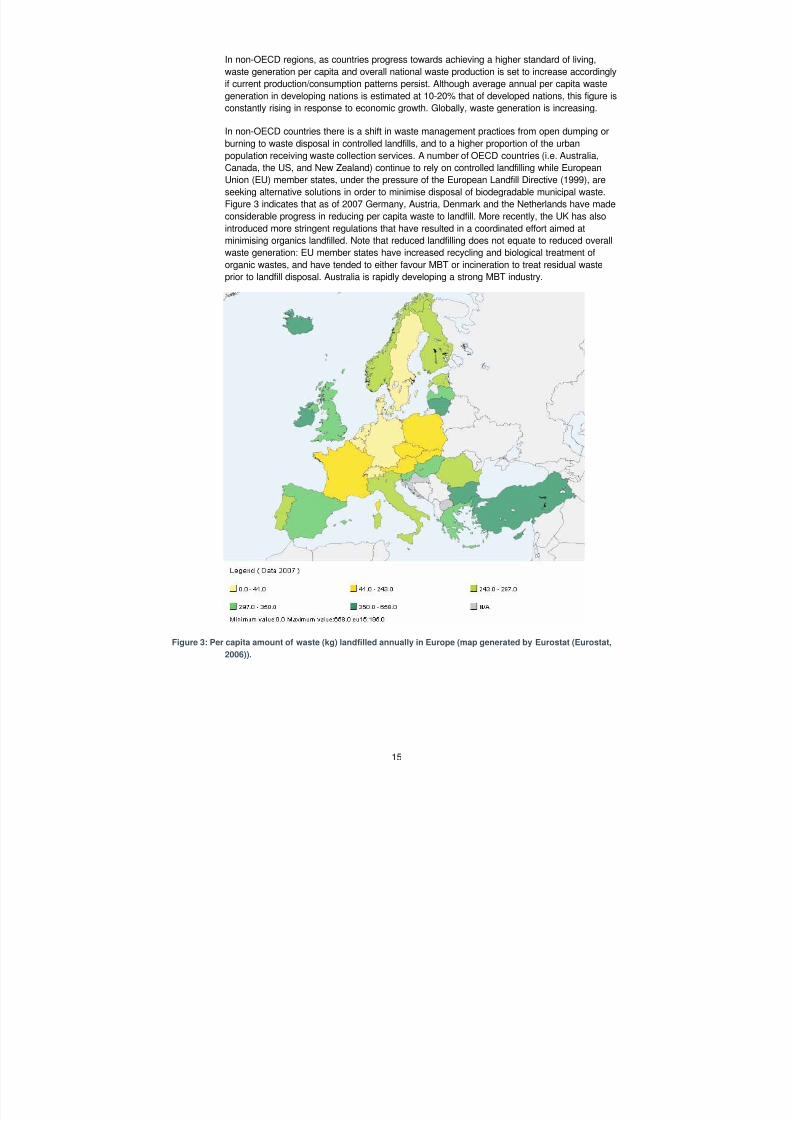
In non-OECD countries there is a shift in waste management practices from open dumping or
burning to waste disposal in controlled landfills, and to a higher proportion of the urban
population receiving waste collection services. A number of OECD countries (i.e. Australia,
Canada, the US, and New Zealand) continue to rely on controlled landfilling while European
Union (EU) member states, under the pressure of the European Landfill Directive (1999), are
seeking alternative solutions in order to minimise disposal of biodegradable municipal waste.
Figure 3 indicates that as of 2007 Germany, Austria, Denmark and the Netherlands have made
considerable progress in reducing per capita waste to landfill. More recently, the UK has also
introduced more stringent regulations that have resulted in a coordinated effort aimed at
minimising organics landfilled. Note that reduced landfilling does not equate to reduced overall
waste generation: EU member states have increased recycling and biological treatment of
organic wastes, and have tended to either favour MBT or incineration to treat residual waste
prior to landfill disposal. Australia is rapidly developing a strong MBT industry.
Figure 3: Per capita amount of waste (kg) landfilled annually in Europe (map generated by Eurostat (Eurostat,
2006)).

8/8/2019 Waste and Climate Change: Global trends and strategy framework
http://slidepdf.com/reader/full/waste-and-climate-change-global-trends-and-strategy-framework 22/79
16
3.2.1 Decoupling waste generation from GDP
Decoupling waste generation from GDP is essential to ensure sustainable use of the world’s
resources, with consequent climate benefits. Unfortunately, there are limited examples of such
de-linking in the world, and no examples of decoupling per capita GDP from per capita waste
generation were found in the course of the present investigation. In developing nations,
increasing GDP is strongly linked to increasing waste generation in urban areas. For example,India experienced an average GDP growth of 7% between 1997 and 2007, and estimated
municipal waste arisings have increased from 48 million tonnes to 70 million tonnes during the
same period (Chintan 2009, Sharholy 2008).
Several EU member states have to some extent managed to decouple waste generation from
economic factors such as GDP (European Communities, 2003; OECD, 2005). However, in
absolute terms, waste generation is increasing in the OECD. Germany appeared to have
decoupled national waste generation from total GDP between 2000 and 2005; however waste
generation increased between 2005 and 2006 due largely to a flux of construction and
demolition waste (see Figure 4). A strong regulatory environment, driven largely by EU waste
directives, caused the sharp decrease in waste generation in Germany.
Figure 4: German waste generation and GDP data, 2000 - 2006 (German Federal Ministry for the Environment,Nature Conservation and Nuclear Safety, 2008)
3.2.2 Global landfill emissions and data quality
Two independent studies have compiled global waste emissions data and trends – these are
effectively reports of landfill emissions, since landfill methane is generally considered to
represent the major source of emissions from the waste sector (this is elaborated on later in the
current document). The US EPA study presents annual emissions from landfill for almost 100
countries as well as for geographical regions and international entities (US EPA, 2006). The
data includes historical and projected emissions from national inventories as reported by

8/8/2019 Waste and Climate Change: Global trends and strategy framework
http://slidepdf.com/reader/full/waste-and-climate-change-global-trends-and-strategy-framework 23/79
17
countries as National Communications to the UNFCC while data gaps were addressed by
utilising IPCC Tier 1 methodology7
and defaults for calculating emissions. In the second study,
Monni et al applied the IPCC FOD model (the Tier 2 method previously described), in order to
calculate global emissions (Monni et al 2006). Using the model and default factors, landfill
methane generation was calculated for past, present and future key years.
Table 3 presents the global landfill emissions calculated by these two studies. As US EPA
assumes instantaneous emissions after deposition, the findings are not directly comparable.
Moreover, this assumption is unrealistic as it is well documented that decomposition of waste in
landfills is a gradual process that can take decades to complete. As a result Monni et al
calculations are lower than US EPA for the first few covered years as initial emission growth is
slower than the corresponding growth in waste quantities, while future emissions are higher due
to the gradual decomposition of waste deposited prior to the introduction of waste minimisation
measures such as the EU Landfill Directive. In both studies however, there is a trend for
emissions from waste to increase.
Table 3: GHG emissions from waste as calculated by US EPA (2006) and Monni et al (2006) (MtCO2-e, rounded)
(Data sourced from Bogner et al 2007).
Source 1990 1995 2000 2005 2010 2015 2020 2030 2050
US EPA (2006) 760 770 730 750 760 790 820
Monni et al (2006) 340 400 450 520 640 800 1000 1500 2900
As reported by Bogner et al (2007), availability and quality of annual data are major problems
for the waste sector. This uncertainty extends to data on waste type and mix, quantity, and
management practices. In addition to considerable variation in data quality and unavailability of
any kind of data for a number of countries, non harmonised national definitions of waste make
comparisons between countries difficult (Monni et al 2004).
The 2006 IPCC Guidelines (IPCC, 2006) indicate that uncertainties for global emissions from
waste can be as high as 10-30% for developed countries (with good data sets) to 60+% for
developing countries that do not have annual data. Examining the 2001 Finnish GHG emissions
inventory, Monni et al (2004) calculated a -28% to +30% uncertainty with respect to emissions
arising from waste disposal. Monni et al also noted that if alternative, but equally defensible,
assumptions were adopted for future waste generation, their results for total methane emissions
from landfills worldwide could be 40-50% lower, or 20-25% higher than those actually
presented.
Furthermore, calculations for estimating emissions from decomposition of waste in landfill are
also subject to high levels of uncertainty. An accepted method for direct measurement ofemissions is not currently available and therefore all estimates are based on theoretical models
such as the IPCC First Order Decay model (IPCC, 2006). All available models are based on a
number of underlying assumptions. Even accepting that data on waste quantities and
composition are accurate, subsequent assumptions on decomposition rates, methane
generation rates and oxidation rates amongst others, all add error and uncertainty to the
calculations.
In summary, it is extremely difficult to gauge the accuracy of current estimates of the climate
impact of waste activities, either at a national or global scale, due to data limitations. Results of
projections of GHG emissions from waste are highly dependent on the assumed rates of waste
7At the time of the study, Tier 1 methods assumed that all potential methane is released in the year the waste is
disposed of. Since 2006, IPCC uses a Tier 1 method based on the FOD model.

8/8/2019 Waste and Climate Change: Global trends and strategy framework
http://slidepdf.com/reader/full/waste-and-climate-change-global-trends-and-strategy-framework 24/79
18
generation. There are already uncertainties at the national level, and this is exacerbated when
global predictions are made. Although a concerted international effort could be mobilised to
address these limitations and produce robust waste databases, it would seem more logical and
worthwhile to direct limited global resources towards minimising GHG emissions from waste
activities.
3.3 Climate impact of waste management practicesEvery waste management practice generates GHG, both directly (i.e. emissions from the
process itself) and indirectly (i.e. through energy consumption). However, the overall climate
impact or benefit of the waste management system will depend on net GHGs, accounting for
both emissions and GHG savings.
The following discussion is not intended to represent an exhaustive investigation of the climate
impact of each waste management approach, but rather explores the range of potential benefits
and impacts of the major management practices, supported by examples from the literature.
The discussion is organised in reverse order of the waste management hierarchy, beginning
with landfill and ending with waste prevention.
3.3.1 Landfill
In the majority of countries around the world, controlled and uncontrolled landfilling of untreated
waste is the primary disposal method. Methane emissions from landfill represent the largest
source of GHG emissions from the waste sector, contributing around 700 Mt CO2-e (estimate
for 2009) (Bogner et al 2007). In comparison, the next largest source of GHG emissions from
the management of solid wastes is incineration8, estimated to contribute around 40 Mt CO2-e
(2009 data estimated in Bogner et al (2007)). Landfills may also be a source of nitrous oxide;
however the contribution to global GHG emissions is believed to be negligible, and related to
the management of both wastewater biosolids disposed at landfills and landfill leachate (Bogner
et al 2008).
Table 4 provides a qualitative summary of the indirect and direct GHG emissions and savings
associated with landfilling. To provide a complete picture, all GHGs are noted, including
biogenic CO2.
8To reiterate, the second largest source of emissions from the waste sector as a whole is wastewater. The current report
addresses emissions from solid waste management.
8/8/2019 Waste and Climate Change: Global trends and strategy framework
http://slidepdf.com/reader/full/waste-and-climate-change-global-trends-and-strategy-framework 25/79
19
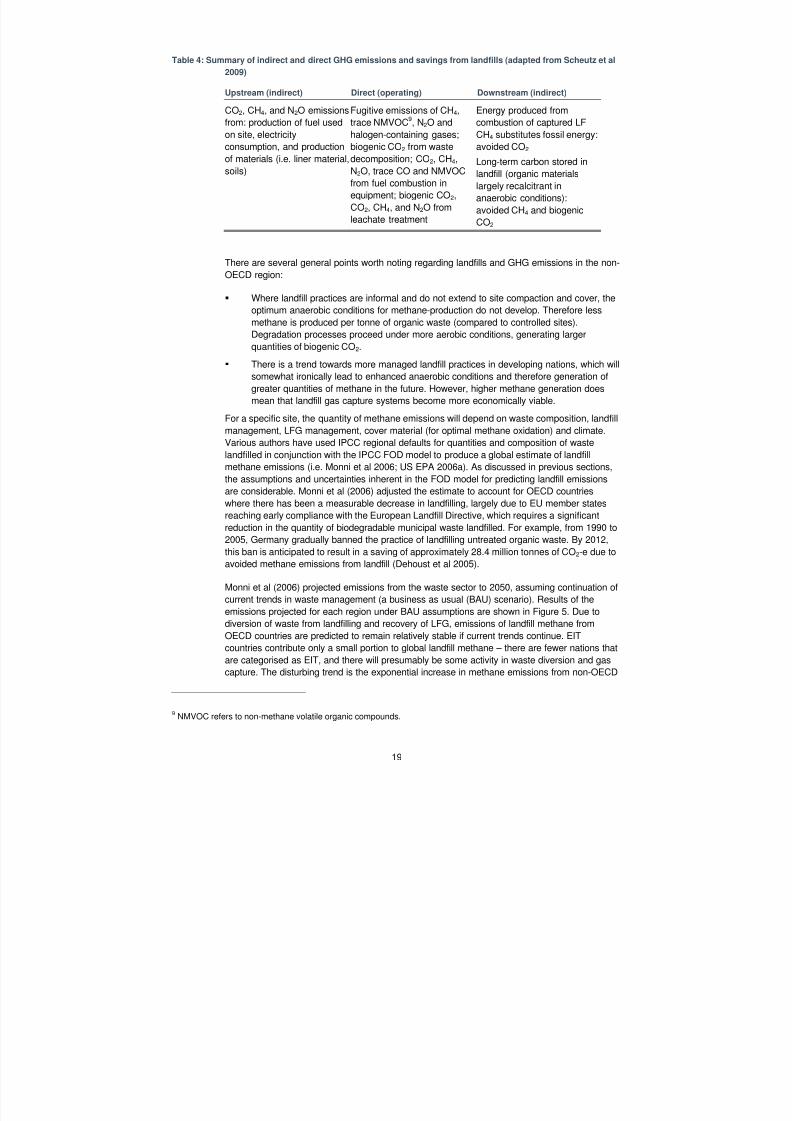
Table 4: Summary of indirect and direct GHG emissions and savings from landfills (adapted from Scheutz et al
2009)
Upstream (indirect) Direct (operating) Downstream (indirect)
CO2, CH4, and N2O emissions
from: production of fuel used
on site, electricityconsumption, and production
of materials (i.e. liner material,
soils)
Fugitive emissions of CH4,
trace NMVOC9, N2O and
halogen-containing gases;biogenic CO2 from waste
decomposition; CO2, CH4,
N2O, trace CO and NMVOC
from fuel combustion in
equipment; biogenic CO2,
CO2, CH4, and N2O from
leachate treatment
Energy produced from
combustion of captured LF
CH4 substitutes fossil energy:avoided CO2
Long-term carbon stored in
landfill (organic materials
largely recalcitrant in
anaerobic conditions):
avoided CH4 and biogenic
CO2
There are several general points worth noting regarding landfills and GHG emissions in the non-
OECD region:
Where landfill practices are informal and do not extend to site compaction and cover, the
optimum anaerobic conditions for methane-production do not develop. Therefore less
methane is produced per tonne of organic waste (compared to controlled sites).
Degradation processes proceed under more aerobic conditions, generating larger
quantities of biogenic CO2.
There is a trend towards more managed landfill practices in developing nations, which will
somewhat ironically lead to enhanced anaerobic conditions and therefore generation of
greater quantities of methane in the future. However, higher methane generation does
mean that landfill gas capture systems become more economically viable.
For a specific site, the quantity of methane emissions will depend on waste composition, landfillmanagement, LFG management, cover material (for optimal methane oxidation) and climate.
Various authors have used IPCC regional defaults for quantities and composition of waste
landfilled in conjunction with the IPCC FOD model to produce a global estimate of landfill
methane emissions (i.e. Monni et al 2006; US EPA 2006a). As discussed in previous sections,
the assumptions and uncertainties inherent in the FOD model for predicting landfill emissions
are considerable. Monni et al (2006) adjusted the estimate to account for OECD countries
where there has been a measurable decrease in landfilling, largely due to EU member states
reaching early compliance with the European Landfill Directive, which requires a significant
reduction in the quantity of biodegradable municipal waste landfilled. For example, from 1990 to
2005, Germany gradually banned the practice of landfilling untreated organic waste. By 2012,
this ban is anticipated to result in a saving of approximately 28.4 million tonnes of CO2-e due toavoided methane emissions from landfill (Dehoust et al 2005).
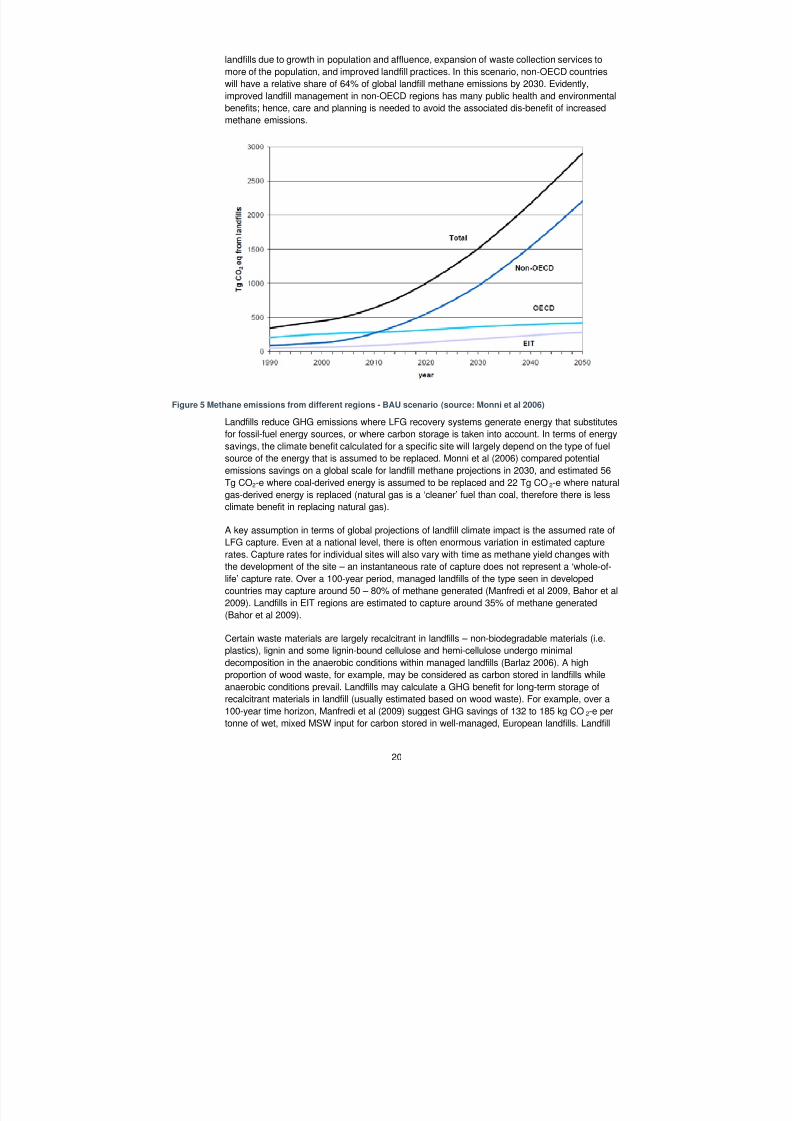
Monni et al (2006) projected emissions from the waste sector to 2050, assuming continuation of
current trends in waste management (a business as usual (BAU) scenario). Results of the
emissions projected for each region under BAU assumptions are shown in Figure 5. Due to
diversion of waste from landfilling and recovery of LFG, emissions of landfill methane from
OECD countries are predicted to remain relatively stable if current trends continue. EIT
countries contribute only a small portion to global landfill methane – there are fewer nations that
are categorised as EIT, and there will presumably be some activity in waste diversion and gas
capture. The disturbing trend is the exponential increase in methane emissions from non-OECD
9NMVOC refers to non-methane volatile organic compounds.
8/8/2019 Waste and Climate Change: Global trends and strategy framework
http://slidepdf.com/reader/full/waste-and-climate-change-global-trends-and-strategy-framework 26/79
20
landfills due to growth in population and affluence, expansion of waste collection services to
more of the population, and improved landfill practices. In this scenario, non-OECD countries
will have a relative share of 64% of global landfill methane emissions by 2030. Evidently,
improved landfill management in non-OECD regions has many public health and environmental
benefits; hence, care and planning is needed to avoid the associated dis-benefit of increased
methane emissions.
Figure 5 Methane emissions from different regions - BAU scenario (source: Monni et al 2006)
Landfills reduce GHG emissions where LFG recovery systems generate energy that substitutes
for fossil-fuel energy sources, or where carbon storage is taken into account. In terms of energy
savings, the climate benefit calculated for a specific site will largely depend on the type of fuel
source of the energy that is assumed to be replaced. Monni et al (2006) compared potential
emissions savings on a global scale for landfill methane projections in 2030, and estimated 56
Tg CO2-e where coal-derived energy is assumed to be replaced and 22 Tg CO2-e where natural
gas-derived energy is replaced (natural gas is a ‘cleaner’ fuel than coal, therefore there is less
climate benefit in replacing natural gas).
A key assumption in terms of global projections of landfill climate impact is the assumed rate of
LFG capture. Even at a national level, there is often enormous variation in estimated capture
rates. Capture rates for individual sites will also vary with time as methane yield changes withthe development of the site – an instantaneous rate of capture does not represent a ‘whole-of-
life’ capture rate. Over a 100-year period, managed landfills of the type seen in developed
countries may capture around 50 – 80% of methane generated (Manfredi et al 2009, Bahor et al
2009). Landfills in EIT regions are estimated to capture around 35% of methane generated
(Bahor et al 2009).
Certain waste materials are largely recalcitrant in landfills – non-biodegradable materials (i.e.
plastics), lignin and some lignin-bound cellulose and hemi-cellulose undergo minimal
decomposition in the anaerobic conditions within managed landfills (Barlaz 2006). A high
proportion of wood waste, for example, may be considered as carbon stored in landfills while
anaerobic conditions prevail. Landfills may calculate a GHG benefit for long-term storage of
recalcitrant materials in landfill (usually estimated based on wood waste). For example, over a
100-year time horizon, Manfredi et al (2009) suggest GHG savings of 132 to 185 kg CO 2-e per
tonne of wet, mixed MSW input for carbon stored in well-managed, European landfills. Landfill

8/8/2019 Waste and Climate Change: Global trends and strategy framework
http://slidepdf.com/reader/full/waste-and-climate-change-global-trends-and-strategy-framework 27/79
21
carbon storage may be reported in IPCC national GHG inventories, but the carbon is credited to
the harvested wood products (HWP) sector (IPCC 2006). It must be emphasised that, purely
from a climate change perspective, burying wood in landfills may be part of the solution;
however, there are myriad other reasons (i.e. ecological, resource use, land use) for not doing
this.
European studies emphasise the climate benefit of diverting biodegradable waste from landfills
(e.g. Dehoust et al 2005; Smith et al 2001; Eunomia, 2002). Smith et al (2001) suggest that
diverting food, garden, and paper waste to composting or recycling reduces net GHG emissions
by 260 kg CO2-e per tonne of MSW (assuming landfills meet average EU standards for LFG
management). Diversion of organic wastes from landfill and implementation of active systems
for landfill gas extraction are complimentary to an extent: due to the gradual release of methane
over many years, even if a ban on landfilling organic waste were implemented at a site today,
there would still be an existing store of organic material releasing methane, that could be
extracted into the future. The considerable impact of these measures is evident in the EC-15 (as
discussed above). In addition, organic waste diversion and LFG capture are feasible options for
implementation in non-OECD regions. However, detailed, site-specific analysis is necessary to
determine the effectiveness (including cost implications) of installing LFG capture systems on
landfills with active organic waste diversion programs.
CDM landfill projects
The Clean Development Mechanism (CDM), under the Kyoto Protocol, provides an opportunity
for developing nations to implement landfill gas capture schemes, thereby improving waste
management practices and addressing climate change. CDM is discussed in more detail in later
sections. Several points are worth noting regarding LFG capture projects:
Landfill gas management should be promoted in all countries as a required practice;
however, under the current terms of CDM, such regulation would no longer enable landfill
gas projects to meet the ‘additionality’ criteria for CDM approval;
The availability of ‘cheap’ credits obtained through CDM landfill gas projects might
undermine the drivers, which carbon trading schemes hope to provide;
There are difficulties in assessing the portion of methane actually being captured from a
site (as discussed previously).
LFG capture projects represent a large portion of registered CDM projects (these are discussed
later in the report). The CDM is applicable during the first commitment period of the Kyoto
Protocol (2008 – 2012), however after that its continuation is uncertain.
CDM projects recovered a reported 30 Mt CO2-e of landfill methane in 2008 (Monni et al 2006).
Monni et al (2006) compared several different waste management scenarios, at a global scale
(see Figure 6 – note that the study does not take into account GHG credits, such as materialsavings, energy savings associated with LFG recovery, or carbon storage). In the ‘CDM ending
in 2012’ scenario, 30 Mt CO2-e has been assumed as annual recovery from 2008-2012, after
which no further installation of gas recovery is assumed in non-OECD countries. The High
Recovery (‘HR’) scenario assumes an annual increase in LFG recovery of 15% in all regions (in
non-OECD from 2013 onwards). This is a very ambitious assumption, and although theoretically
possible, it does not represent a conservative approach. Due to the high assumed recovery
rate, the HR scenario performs extremely well compared to other scenarios, and is particularly
effective in the non-OECD region. The modelling highlights the potential benefits of LFG capture
at the global scale.

8/8/2019 Waste and Climate Change: Global trends and strategy framework
http://slidepdf.com/reader/full/waste-and-climate-change-global-trends-and-strategy-framework 28/79

8/8/2019 Waste and Climate Change: Global trends and strategy framework
http://slidepdf.com/reader/full/waste-and-climate-change-global-trends-and-strategy-framework 29/79
23
that derive energy from waste. Much of the waste in the non-OECD region is characterised by a
high percentage of putrescible waste (see Table 5) with consequent high moisture and low
calorific value, making it unsuitable for incineration without considerable pre-treatment, such as
pressing or drying (Lacoste and Chalmin 2006; UNEP 2009).
Table 5 Characteristics of MSW in low, medium, and high GDP countries (source: Lacoste and Chalmin, 2006)
Low-GDP countries Medium-GDP countries High GDP countries
Example country India Argentina EU-15
GDP US$/capita/year <$5,000 $5,000 - $15,000 >$20,000
MSW kg/capita/year 150 - 250 250 – 550 350 – 750
MSW collection rate <70% 70% – 95% >95%
% putrescible waste in
MSW
50% - 80% 20% - 65% 20% - 40%
Heating value kcal/kg 800 – 1,100 1,100 – 1,300 1,500 – 2,700
China, despite its non-ideal waste composition, has vigorously embraced incineration: the
proportion of MSW incinerated has risen from 1.7% in 2000 to 5% in 2005, with the construction
of 67 incinerators (Bogner et al 2007). A 2005 World Bank report noted:
Shanghai, which has the most ‘internationally standard’ waste stream (i.e. higher fraction
of plastics and papers and less moisture) in China still has a waste composition that is
barely autogenic (a high enough heating value to burn on its own). Most Chinese cities
would have to use supplemental fuel in order to burn their solid waste, and thus there
would be no net energy generation to offset the high costs of incineration (World Bank
2005).
India has had limited success with thermal treatment projects, which tend to focus on turning
MSW into refuse derived fuel (RDF), or ‘fluff’, to combust for energy production or to supplement
fuel for cement kilns. The informal recycling sector in Indian cities recovers much of the dry,
high calorific material from MSW, leaving a moist residue with high green waste content
unsuitable for production of combustible ‘fluff’ without considerable pre-treatment (i.e. drying).
For example, these difficulties have been reported at facilities in Chandigarh and Hyderabad
(Yadav 2009, Joseph 2007). India, like many developing nations, also lacks laboratory facilities
to appropriately monitor the performance of thermal facilities (i.e. testing substance levels in
emissions and ash). Similar problems have been experienced at incinerators in Thailand.
At the global level, the climate impact of incineration is minor compared to that of landfilling,contributing around 40 Mt CO2-e in the current year (Bogner et al 2007)
10. Direct emissions from
facilities are predominantly fossil and biogenic CO2. The amounts of fossil and biogenic carbon
in the waste input will vary significantly between countries, regions, and even facilities (Astrup et
al 2009). Typically only fossil CO2 is counted as a GHG emission from incineration; therefore,
10Municipal waste may contain 40-60% biogenic carbon, which is also emitted during incineration. This same portion of
biogenic carbon (apart from the largely recalcitrant wood fraction) also contributes to biogenic CO2 emissions from
landfill. It is worth considering the relevance of time, in the context of the time-critical nature of climate change (i.e.
immediate mitigation action is necessary): the biogenic CO2 from incineration is released instantaneously to the
atmosphere, whereas the biogenic CO2 from landfill is released gradually over a period of years. This comment is notintended to suggest a preference for one waste management system over another, but rather seeks to highlight an
important discussion.

8/8/2019 Waste and Climate Change: Global trends and strategy framework
http://slidepdf.com/reader/full/waste-and-climate-change-global-trends-and-strategy-framework 30/79
24
the overall climate impact of incineration will be highly influenced by the fossil carbon content of
the input waste. Downstream, indirect GHG savings due to energy generation may dominate an
estimate of emissions from incineration, depending on the energy assumed to be replaced.
Table 6 provides a qualitative summary of the indirect and direct GHG emissions and savings
associated with incineration. To provide a complete picture, all GHGs are noted, including
biogenic CO2.
Table 6: Summary of indirect and direct GHG emissions and savings from incineration (adapted from Scheutz et
al 2009)
Upstream (indirect) Direct (operating) Downstream (indirect)
CO2, CH4, and N2O emissions
from: production of fuel used
in facility, heat and electricity
consumption, production of
materials (i.e. air pollution
control (APC) systems) and
infrastructure
CO2 and biogenic CO2 from
waste combustion; trace CH4,
N2O, CO, and NMVOC
Heat and/or electricity
produced from combustion of
waste substitutes fossil
energy: avoided CO2
Recovery of metals from ash
substitutes raw materials:
avoided GHG emissions from
material production
Use of bottom ash to
substitute aggregate: avoided
GHG emissions from
producing virgin aggregate
CO2, CH4, N2O, and trace CO,
and NMVOC from transport of
APC residues and fly ash
The estimated GHG impact of thermal waste treatment processes, such as incineration,
gasification, and pyrolysis, depends in large part on the energy source(s) assumed to be
replaced by energy generated through the process. The Dehoust et al (2005) study examined
the impact of changing the energy source from natural gas (i.e. combined cycle gas turbine
(CCGT)) to coal, and found that the GHG saving doubled: if coal is assumed to be replaced,
thermal treatment receives double the carbon credit for energy produced than if natural gas is
assumed to be replaced. The choice of both baseline and marginal energy mix is a key element
of waste and climate change studies, and is often a point of debate. Many developed countries
are moving towards more sustainable national energy supply, with conventional coal-powered
stations being phased-out in favour of less GHG-emitting alternatives. Therefore, at least in
developed countries, the climate benefit of energy derived from waste incineration may lessen
in the future.
Estimations of the climate impact of incineration with energy recovery also depend on whether
electricity, heat or combined heat and power (CHP) are assumed to be produced. European
waste incinerators are reported to have conversion efficiencies of 15-30% for electricity and 60-
85% for heat, with efficiency based on the % conversion of the lower heating value of the waste
into energy (Astrup et al 2009). In Northern Europe it is fairly common to find district heating
networks powered by waste incinerators. Areas of Central and Eastern Europe also have the
necessary infrastructure to utilise heat. The UK has examples of incinerators providing heat to
adjacent industries (i.e. a latex plant) – industrial heat usage is in many cases more attractive
than district heating. However, in many parts of the world, the infrastructure necessary to
usefully apply the heat is often not in place and prohibits building CHP plants. An alternative useof heat energy may be for absorption refrigeration in situations where cooling is more desirable
than heating; however this is not yet a common practice. The location of thermal technologies is

8/8/2019 Waste and Climate Change: Global trends and strategy framework
http://slidepdf.com/reader/full/waste-and-climate-change-global-trends-and-strategy-framework 31/79
25
therefore a crucial consideration when assessing energy efficiency and the potential for thermal
treatment to mitigate climate impact.
The GHG impact of thermal treatment of waste biomass – such as crop residue – may be very
different to that of incineration of mixed wastes. The assessment will depend on a number of
factors, including:
Alternative life-cycle for the biomass – in the case of crop residues, an important
consideration is whether they would be left in-situ, or mulched on-site, to contribute
nutrients and structure to soils, or burnt (uncontrolled)
Suitability of the biomass for anaerobic digestion – if the waste biomass has a
composition suitable for AD (i.e. minimal lignin content) then the climate benefit of AD
with energy recovery outweighs that of thermal processing with energy recovery (and
typically presents a less expensive option)11
Whether biogenic CO2 is considered relevant, particularly given the time-relevance of
climate change
An important, but often overlooked point is that crop residues, although not useful from the
perspective of human consumption or production, contain an often significant portion of theoriginal nutrient input to the crop. In combusting residues, there is the danger that these
nutrients are removed from the agricultural ecosystem, and result in a net depletion of essential
building blocks for future crops. This may perpetuate the use of ‘imported’ fertilisers and soil
amenders, with ensuing climate impact from manufacturing and transporting soil additives. A
portion of crop residues may potentially be removed in a sustainable manner (Kim and Dale
2004); therefore individual cropping systems should be carefully assessed before waste
biomass is removed to fuel power plants – even where residues are currently burnt in-situ, this
may not be the most sustainable alternative.
Pyrolysis and gasification of biomass may offer higher efficiencies (of conversion of waste to
energy) than mass-burn incineration, especially if operated in heat only or CHP mode, if the low-emissions claims of technology suppliers are accepted. However, both gasification and pyrolysis
should be considered conservatively as emerging technologies, still under development, and
with variable track records. For a number of years, centralised gasification of wood (or other
high-lignin content) biomass has been trialled primarily in Japan and Europe. Independent
emissions data is difficult to obtain from Japanese facilities to ascertain GHG performance, and
European plants have met with mixed success. Tars produced during wood pyrolysis appear to
be a major problem for gas engines attached to furnaces, causing low generating efficiencies
and down-time for maintenance, and require sophisticated technical solutions to avoid. Pyrolysis
and gasification should not be ruled-out as potential future technologies to produce relatively
clean energy from biomass waste.
Assessments of the potential GHG benefits of the thermal conversion of biomass waste toenergy should be treated with caution. Although various methods can be used to estimate the
total calorific value of the biomass (‘total biomass energy’) there is no thermal process that will
convert 100% of that calorific value into energy. Assuming 100% efficiency can lead to highly
erroneous estimations of the scale of potential energy production (and GHG benefit through
fossil fuel replacement) of waste biomass.
Thermal technologies could have a valuable role to play in the treatment of specific streams of
wastes, or carefully prepared mixed residual wastes (i.e. RDF), as part of an integrated and
11
For example, see analysis in: Eunomia Research & Consulting (2008). Greenhouse Gas Balances of Waste Management Scenarios – Report for the Greater London Authority . Although this study assessed MSW, similar
assumptions and technologies would apply to agricultural waste biomass. See also Smith et al (2001).

8/8/2019 Waste and Climate Change: Global trends and strategy framework
http://slidepdf.com/reader/full/waste-and-climate-change-global-trends-and-strategy-framework 32/79
26
future-thinking waste management system. In many countries, thermal treatment plants require
long lead-times (i.e. >10 years) to meet planning approval, financing, construction, and
commissioning. In addition, facilities will last for at least 25 years with limited flexibility for
changing waste supply, which suggests that capacity needs to be planned for carefully. This
suggests that such facilities may be part of a longer-term strategy for climate abatement.
3.3.3 Mechanical biological treatmentMBT refers to a wide range of technologies that separate incoming waste into recyclable
materials for recovery and an organic fraction for biological treatment (stabilisation). In Europe,
facilities tend to produce a refuse-derived fuel (RDF) for subsequent thermal treatment; this is
not the case in other regions (i.e. Australia). MBT – in all its various configurations – has a
strong track record in Europe, and the UK and Australia are increasingly embracing MBT as the
cost of landfilling increases in these countries. MBT is relatively scarce in the rest of the world,
therefore the majority of LCA-type studies that estimate GHG emissions from MBT are based on
European, UK, and Australian conditions.
The downstream, indirect GHG emissions/savings from MBT generally outweigh both upstream
and direct process emissions. Table 7 provides a qualitative summary of the indirect and directGHG emissions and savings associated with MBT. To provide a complete picture, all GHGs are
noted, including biogenic CO2.
Table 7: Summary of indirect and direct GHG emissions and savings from MBT (adapted from data provided in
Scheutz et al 2009)
Upstream (indirect) Direct (operating) Downstream (indirect)
CO2, CH4, and N2O emissions
from: production of fuel used
in facility, heat and electricity
consumption, andinfrastructure
CO2, CH4, N2O, trace CO and
NMVOC from fuel combustion
in equipment
Biogenic CO2, CH4, and N2Ofrom windrows
Biogenic CO2, CH4 (leakages)
and trace N2O from reactors,
and biofilters (MBT AD)
Heat and/or electricity
produced from combustion of
biogas substitutes fossil
energy (MBT AD): avoidedCO2
Front-end recovery of
materials substitutes raw
materials: avoided GHG
emissions from material
production
Use of organic compost
output to substitute soil
growth media: avoided GHG
emissions from producing
virgin growth mediaLong-term carbon stored in
landfill (organic materials
largely recalcitrant in
anaerobic conditions):avoided
CH4 and biogenic CO2
The overall climate impact of a particular MBT technology will depend on:
The efficiency of front-end sorting processes – recovered materials contribute to
potentially significant downstream GHG savings

8/8/2019 Waste and Climate Change: Global trends and strategy framework
http://slidepdf.com/reader/full/waste-and-climate-change-global-trends-and-strategy-framework 33/79
27
Energy consumption of system – more automated, sophisticated systems have a higher
energy demand
Energy generation – in the case of anaerobic digestion (AD)-type MBT facilities, energy
produced from biogas – either heat or electricity – will account for a GHG saving
Control of emissions during the maturation phase – best-practice for MBT involves the
use of air pollution control systems, such as scrubbers and biofilters, to prevent emissions
of nitrous oxide and methane
Carbon storage potential – compost derived from mixed waste is usually restricted in
application (i.e. remediation of contaminated land or landfill), but may be credited with a
GHG benefit from carbon storage
Biodegradability of final output – the biodegradability of the final composted output will
decrease with increased maturation time, and the lower the biodegradability, the less
potential for the material to generate methane (if landfilled)
The main gains in terms of climate benefit are from separation and recovery of recyclable
materials and through reduction of the amount of biodegradable waste landfilled (or medium-
long term binding of carbon where composted output is applied to soils). Less organic material
to landfill equates to fewer methane emissions. Where MBT outputs are landfilled rather than
applied to land (the use of MBT compost outputs tends to be highly regulated in OECD
countries), some methane will still be generated. Theoretically, an MBT process could reduce
methane generation by 90%, compared to landfilling the equivalent quantity of waste (Bogner et
al 2007). GHG emissions and savings associated with recycling, composting, and AD are
discussed in greater detail in the relevant sections below, although the composting and AD
discussions relate to source-separated organic waste, rather than the organic fraction derived
from mixed MSW.
MBT, with simple aerobic composting of the organic portion of the mixed waste stream, may
offer an easy, relatively inexpensive solution to reduce the climate impact of landfilling waste.
This may also be seen as an interim solution to gain rapid GHG benefit while wastemanagement systems are improved (i.e. to increase source separation and recovery).
The dried organic outputs from MBT may also be used as refuse-derived fuel (RDF) for
incineration with energy recovery or co-combustion in industrial furnaces, typically cement kilns,
paper pulp mills, and coal-fired power plants. RDF generally does not replace conventional
fossil fuel on a 1:1 ratio by weight – more RDF may be required to achieve the same energy
output. Conventional furnaces will have a limit to the amount of fuel calorific value they can
substitute with RDF (Eunomia, 2008b) and not all industrial processes can be easily adapted to
use RDF. Emissions control at industrial plants may be less stringent than at waste incinerators
– the EU has addressed this concern through the Waste Incineration Directive (WID) that
stipulates emissions requirements for any plant combusting significant quantities of waste. The
climate impacts from burning RDF in industrial furnaces depend in part on the conventional fuel
displaced.
MBT-AD technology for mixed residual waste is largely found in Europe. Many European plants
are small-scale, treating less than 20,000 tonnes per year (Kelleher, 2007). The EU Landfill
Directive creates the necessary cost and regulatory incentives to support development of both
MBT-AD and MBT-composting facilities. The performance of MBT-AD requires careful
preparation and pre-sorting of incoming waste in order to ensure a suitable mixture is introduced
to the digestion micro-organisms. European plants are equipped with sophisticated front-end
sorting equipment, which makes MBT-AD a less affordable and viable solution for developing
countries, or countries where landfilling is cheap.

8/8/2019 Waste and Climate Change: Global trends and strategy framework
http://slidepdf.com/reader/full/waste-and-climate-change-global-trends-and-strategy-framework 34/79
28
3.3.4 Composting and anaerobic digestion (of source-separatedorganic wastes)
Composting systems treat biodegradable material such as food, animal industry wastes, green
waste, wood, and agricultural residues and produce a range of organic soil amendment
products that can replace manufactured fertilisers and/or peat, reduce the need for pesticides,
improve soil structure, reduce erosion, and reduce the need for irrigation. Around 2,000composting facilities currently treat source-separated household organic waste in Europe
(Boldrin 2009). Composting and anaerobic digestion of source-separated wastes requires
significant investment in local community education (both households and commercial
enterprises) and public awareness – this is essential to ensure proper source-separation, high-
quality compost products, and secure end-use markets.
Simple composting systems are an effective, low-tech solution for developing countries to
reduce waste quantities and generate a valuable compost product for application to agriculture.
Both composting and AD systems are found throughout non-OECD regions. For example, the
UN Economic and Social Commission for Asia and the Pacific (ESCAP) has assisted cities in
Bangladesh, Pakistan, Sri Lanka, and Viet Nam to set-up simple local composting facilities fororganic wastes (UN ESCAP, 2009). There are approved methodologies for composting projects
under the CDM, such as the methodology for ‘avoided emissions from organic waste through
alternative waste treatment processes’ (AM0025). In India, the informal waste sector feeds into
both small and large-scale composting facilities. In the Defense Colony neighbourhood of Delhi,
waste pickers collect material from 1,000 households and compost it in a series of
neighbourhood composting pits. Also in Delhi, a large-scale composting plant processes 200
tonnes of separated organic waste per day (Chintan 2009). An estimated 9% of MSW in India is
composted, and compost is a valuable and marketable product for Indian agriculture (Sharholy
2008).
The climate impact of composting and AD systems is due to both direct process emissions and
indirect upstream and downstream emissions. Table 8 provides a qualitative summary of theindirect and direct GHG emissions and savings associated with composting and AD processes.
To provide a complete picture, all GHGs are noted, including biogenic CO2.
Table 8: Summary of indirect and direct GHG emissions and savings from composting and AD processes
(adapted from data provided in Scheutz et al 2009)
Upstream (indirect) Direct (operating) Downstream (indirect)
CO2, CH4, and N2O emissions
from: production of fuel used
in facility, heat and electricity
consumption, andinfrastructure
CO2, CH4, N2O, trace CO and
NMVOC from fuel combustion
in equipment
Compost processes:Biogenic CO2, CH4, and N2O
from windrows
AD processes:
Biogenic CO2, CH4 (leakages)
and trace N2O from reactors,
and biofilters
Heat and/or electricity
produced from combustion of
biogas substitutes fossil
energy (AD processes only):avoided CO2
Use of organic compost
output to substitute soil
growth media: avoided GHG
emissions from producing
virgin growth media
Direct emissions from composting facilities result from fuel combustion in equipment (i.e. front-
loaders) and from decomposition of the organic material. As composting produces CO2 from
biogenic carbon sources, it does not contribute to national GHG inventories for the waste sector
under IPCC accounting methods (IPCC 2006). CH4 and N2O emissions will depend on the type
of organic waste input, the technology used (in particular, whether the process is open or

8/8/2019 Waste and Climate Change: Global trends and strategy framework
http://slidepdf.com/reader/full/waste-and-climate-change-global-trends-and-strategy-framework 35/79
29
enclosed), and how the process is managed (Boldrin et al 2009). The IPCC default values for
reporting emissions from biological treatment processes in national GHG inventories provide an
indicative range of emissions levels (see Table 9), which are also comparable to the range of
values presented for open and enclosed composting systems in Boldrin et al (2009).
Table 9: Default emissions factors for CH4 and N2O emissions from biological treatment of waste (reproduced
from IPCC 2006)
Type of
biological
treatment
CH4 Emissions Factors
(g CH4/kg waste treated)
N2O Emissions Factors
(g N2O/kg waste treated)Remarks
On a dry weight
basis
On a wet weight
basis
On a dry weight
basis
On a wet weight
basis
Composting10
(0.08 – 20)
4
(0.03 – 8)
0.6
(0.2 – 1.6)
0.3
(0.06 – 0.6)
Assumptions on the waste
treated: 25-50% DOC in
dry matter, 2% N in dry
matter, moisture content
60%.
The emission factors for
dry waste are estimated
from those for wet waste
assuming a moisture
content of 60% in wet
waste
Anaerobic
digestion at biogas
facilities
2
(0 – 20)
1
(1 – 8)
Assumed
negligible
Assumed
negligible
Once compost is applied to land, further, minimal emissions will be generated as organic
compounds are gradually mineralised to biogenic CO2. Therefore, compost applied to soil has a
medium or long-term potential to store carbon; however, it does not represent a permanent
solution for ‘locking-up’ carbon (Smith et al 2001; Favoino and Hogg, 2008). Quantifying theclimate benefit of carbon storage is extremely difficult and will largely depend on how the soil
landscape is managed (cropping, tillage, irrigation, compost application rate, etc), climate, and
original carbon content of the compost and soil. Estimates of GHG savings range from 2 kg
CO2-e to 79 kg CO2-e per tonne of composted waste applied to land (Smith et al 2001; Boldrin
et al 2009; ROU, 2006). Compost applications to land may also result in emissions of N2O,
depending on the nitrogen content of the compost, and when the compost is applied (i.e. N2O
releases are likely if vegetation is not taking up nitrogen at the time of application) (Boldrin et al
2009). However, compared to synthetic fertilisers, compost may in fact reduce overall N2O
emissions from agricultural land by providing a more slowly released source of nitrogen
(Favoino and Hogg, 2008).
Compost applied to land replaces synthetic fertilisers and soil improvers (i.e. peat) and reduces
the need for pesticides, tillage, and irrigation (Favoino and Hogg 2008, Boldrin et al 2009, US
EPA 2006, Smith et al 2001). The manufacture of synthetic fertilisers is energy-intensive (e.g.
extraction of phosphate rock), as is the extraction of peat for use as a soil amender (note that
peat extraction also generates methane emissions). Peat use is not widespread in certain parts
of the world, including developing regions and Australasia. Where compost replaces either
synthetic fertiliser or peat, there will be a GHG benefit due to avoided energy use. GHGs are
also released during the manufacture of synthetic fertilisers: studies have reported values of 4-
13 kg CO2 per kg synthetic N, 0.5-3 kg CO2 per kg synthetic P, and 0.4-1.5 kg CO2 per kg
synthetic K (ROU 2006, Boldrin 2009). Substitution of fertiliser has been estimated to save
around 8 kg CO2-e per tonne of composted waste applied to land, and substitution of peat has
been estimated to save between 4 and 81 kg CO2-e per tonne of composted waste (PROGNOS2008, Boldrin 2009).
8/8/2019 Waste and Climate Change: Global trends and strategy framework
http://slidepdf.com/reader/full/waste-and-climate-change-global-trends-and-strategy-framework 36/79
30
Estimates of the net climate impact of both open and enclosed composting systems in Europe
are savings of around 35 kg CO2-e per tonne of wet organic waste input (Smith et al 2001,
Boldrin et al 2009), taking into consideration fertiliser and peat substitution, and carbon storage
in soil.
Anaerobic digestion (AD) of source-separated organic wastes is an alternative to aerobic
composting systems, although AD tends to accept a smaller range of materials (i.e. materials
with a high lignin content, such as woody garden wastes, are generally not suitable for AD in
large quantities). The biogas produced by AD tends to have a high methane content (around
60%, although it will depend on the process parameters) and therefore high energy content.
Energy consumption at the AD plant results in indirect, upstream GHG emissions, although the
plant’s energy requirements may be partially met through heat generated ‘in-house’ (see below).
Diesel and electricity are the main energy sources – diesel use is minimal (i.e. 1.6 L per tonne of
waste) and electricity use varies with the process. The climate impact associated with electricity
use will depend on the local mix of fuels, with coal-power resulting in a higher impact than, say,
natural gas. Møller et al (2009) suggest a range of values from 2-45 kg CO 2-e per tonne of
waste. Small quantities of fugitive emissions from leaks in the system and during maintenance
account for direct process GHG emissions – the majority of biogas is contained and used togenerate energy. Møller et al (2009) estimated the climate impact of fugitive emissions at 0-48
kg CO2-e per tonne of waste received at typical AD facilities, which is generally in line with IPCC
indicative values (see Table 9).
Indirect, downstream emissions are due to energy generation and use of the digestate/compost
output. Typical electricity production efficiencies of 35% are assumed for biogas in LCA-type
studies (Eunomia, 2002; Christensen et al 2009), and plants often operate in CHP mode, using
the heat ‘in-house’ to reach the necessary AD process temperatures. This of course assumes
sophisticated AD facilities, as are common in Europe – the climate impacts of simple, small-
scale AD systems that may be more applicable to developing regions are difficult to assess due
to lack of data. Biogenic CO2 emissions from the combustion of biogas range from 154-250 kg
CO2-e per tonne waste (Møller et al 2009). Climate impact due to the release of small quantities
of unburned methane and nitrous oxide during the combustion process result in GHG emissions
of 15-24 kg CO2-e and 0.3-0.5 kg CO2-e per tonne of waste, respectively (Møller et al 2009).
Biogas can also be cleaned and either a) used in transport, b) used to power equipment, c)
used in local ‘sour’ (i.e. impure) gas networks, or d) piped into a gas distribution network,
subject to local regulation.
Depending on facility performance, assumptions regarding energy, the end-use of energy
generated, and assumptions regarding use of digestate, an advanced, European-style AD
facility may have a net climate impact ranging from -375 to 111 kg CO2-e per tonne of wet
organic waste input (Møller et al 2009). Higher levels of biogas production, a high-CO2-e energy
mix, and use of heat rather than electricity would all contribute to greater GHG savings.
3.3.5 Recycling
After waste prevention, recycling has been shown to result in the highest climate benefit
compared to other waste management approaches. This appears to be the case not only in the
OECD (i.e. ISWA 2009, Christensen et al 2009, US EPA 2006) but also in developing countries
(i.e. Pimenteira et al 2004, Chintan 2009), although limited data is available. For example, in the
US, recycling materials found in MSW resulted in the avoidance of around 183 Mt CO2-e in
2006 (US EPA, 2009). Estimates of GHG savings are generally based on the premise that
recycled materials replace an equal – or almost equal12
– quantity of virgin materials in a closed-
12Process losses will occur during material reprocessing, and will depend in part on the individual facility. For example,
Merrild et al (2009) refer to an approximate material loss for paper reprocessing of 2.4% on a weight basis.

8/8/2019 Waste and Climate Change: Global trends and strategy framework
http://slidepdf.com/reader/full/waste-and-climate-change-global-trends-and-strategy-framework 37/79
31
loop recycling system (i.e. where material is reprocessed back into the same or a similar
product).
Recycling activities are not limited to closed-loop systems, but encompass open-loop recycling,
down-cycling, and industrial symbiosis. Open-loop recycling occurs where recycled material is
used to make a new, different product, often with a loss of material quality (which may be
referred to as ‘down-cycling’). Industrial symbiosis involves the exchange of resources including
by-products among industrial enterprises, which may form ‘recycling clusters’ to facilitate
sharing resources. Case studies of industrial symbiosis in both developed and developing
regions have shown measurable environmental and economic benefits with respect to air,
water, and waste (Chertow and Lombardi 2005, Ashton et al 2009, Harris 2007). GHG savings
may be associated with reduced use of raw materials, reduced transportation (i.e. of wastes to
landfill), and fossil fuel substitution in CHP facilities (i.e. where there is an industrial use for the
heat) (Ashton 2009, Harris 2007). Since 2005, the UK’s National Industrial Symbiosis
Programme has diverted more than five million tonnes of waste from landfill and eliminated
more than five million tonnes of carbon emissions through its activities (Chertow 2009).
Table 10 provides a qualitative summary of the indirect and direct GHG emissions and savings
associated with recycling processes. To provide a complete picture, all GHGs are noted,including biogenic CO2. Generally, emissions relating to the indirect downstream processes far
outweigh the combined operating and upstream emissions in recycling processes (for example,
see analyses in Merrild et al (2009), Larsen et al (2009), Astrup et al (2009), and Damgaard et
al (2009)).
Table 10: Summary of indirect and direct GHG emissions and savings from recycling processes (adapted from
data provided in Scheutz et al 2009)
Upstream (indirect) Direct (operating) Downstream (indirect)
CO2, CH4, and N2O emissions
from: production of fuel usedin facilities (i.e. material
recycling facilities and
reprocessing plants), heat and
electricity consumption, and
infrastructure
CO2, CH4, N2O, trace CO and
NMVOC from fuel combustionin equipment
Recovery of materials
substitutes raw materials:avoided GHG emissions from
material production
Recovery of paper avoids use
of harvested wood: wood
biomass replaces fossil fuel
as energy source (biogenic
CO2 emissions replace fossil
CO2) or unharvested wood
sequesters carbon
The GHG benefits of recycling specific materials, such as metals, plastics, glass, and paper
products, are well documented (Smith et al 2001; WRAP, 2006; US EPA 2006), and are shown
to vary with material, recovery rates, and the type of fossil fuel avoided (where energy savings
are calculated). In particular, the magnitude of estimated GHG savings from recycling is highly
dependent on the energy assumptions applied to both reprocessing facilities and substituted
virgin material plants. Recycling GHG savings have been estimated for countries and/or
regions using LCA - Table 11 compares values applied in Northern European, Australian and
US studies. The variations in the amounts of GHG credited to the materials shown in the table
will largely be due to the energy assumptions of the individual LCA studies.

8/8/2019 Waste and Climate Change: Global trends and strategy framework
http://slidepdf.com/reader/full/waste-and-climate-change-global-trends-and-strategy-framework 38/79
32
Table 11 CO2-e savings for materials recycled in N Europe, Australia, and USA (ISWA 2009; RMIT 2009; US EPA
2006).
Material Kg CO2-e saved per
tonne of material
recycled – Northern
Europe
Kg CO2-e saved per
tonne of material
recycled – Australia
Kg CO2-e saved per
tonne of material
recycled – USA
Paper 600 - 2,500 670 – 740 838 – 937
Aluminium 10,000 17,720 4,079
Steel 2,000 400 – 440 540
Glass 500 560 – 620 88
Plastic 0 -1,000 0 – 1,180 0 – 507
The range of values for paper presented in Table 11 also reflects different paper types, and
each study’s assumptions regarding unharvested wood stocks. For example, paper recycling
reduces the demand for wood – some studies assume that this ‘saved’ wood would be used asan energy source (and therefore generate energy GHG savings), whereas others assume that
the wood remains unharvested, and thus has a carbon sequestration benefit. Merrild et al
(2009) estimate that the downstream GHG impact of paper recycling in Northern Europe could
range from +1,500 kg CO2-e/tonne paper waste (i.e. emissions) to -4,400 kg CO2-e/tonne paper
waste (i.e. savings), depending on whether recycled paper is assumed to replace virgin or
recycled paper stocks, the energy assumptions, and the choice of what happens to the
unharvested wood.
The range of values for plastic (Table 11) reflects a number of possible factors, such as:
different types of plastic polymers, direct substitution of virgin plastic versus a mixed plastic
product replacing the use timber or concrete (i.e. for garden furniture and fences), assumptionsregarding energy, and reprocessing techniques. Astrup et al (2009) found that the substitution
of virgin plastic generated greater climate benefit (i.e. savings of 700 – 1,500 kg CO2-e/tonne
plastic waste) than either the substitution of wood (i.e. emissions of 70 – 500 kg CO2-e/tonne
plastic waste) or production of energy (i.e. savings of 1,200 – emissions of 50 kg CO2-e/tonne
plastic waste) using plastic recycled in Europe.
A recent investigation by the UK Waste and Resources Action Programme (WRAP) of 55 LCA
studies found that ‘across the board, most studies show that recycling offers more
environmental benefits and lower environmental impacts than other waste management options ’
(WRAP, 2006). The report’s main GHG-related conclusions for specific materials included:
On average, virgin production of paper followed by incineration with energy recoveryconsumes twice as much energy as paper recycling; however, the GHG benefit of
recycling paper depends largely on the system boundaries adopted by the individual LCA
studies (in particular, whether the GHG ‘cost’ of using timber to produce paper is
accounted for)
Closed-loop recycling of glass results in net climate benefits compared to incineration.
There is insufficient data on open-loop recycling (i.e. glass recycled into aggregate,
insulation, or other secondary product) to determine the net GHG impact
Where recycled plastic replaces virgin plastic of the same kind in ratio of 1:1 (by weight),
recycling of plastic was found to have a net environmental benefit compared to
incineration. For every kg of plastic recycled, around 1.5 – 2 kg CO2-e is saved.

8/8/2019 Waste and Climate Change: Global trends and strategy framework
http://slidepdf.com/reader/full/waste-and-climate-change-global-trends-and-strategy-framework 39/79
33
Production of virgin aluminium requires 10-20 times more energy than recycling
aluminium. Although regional differences in energy sources cause large variations in the
extent of GHG savings, there is a universal climate benefit in recycling aluminium.
Production of virgin steel requires around two times as much energy as production of
steel from recycled scrap. As above, regional differences in energy sources may cause
variations in the extent of GHG savings; however there is a universal climate benefit in
recycling steel.
China has become the major global destination for recycled materials. 50% of the UK’s
recovered paper and 80% of recovered plastics are exported to China. The UK’s WRAP
recently commissioned an investigation into the carbon impact of exporting collected recycled
materials to China in order to determine whether the climate impact of overseas transport (in
container ships) outweighed the benefits of recycling (WRAP, 2008). For the UK, the impact of
shipping was minimal, in part due to the fact that ships would otherwise return empty to China
(the majority of the shipping movement is from China to the UK – transport of recycled materials
back to China represents a marginal impact).
An alternative to recycling plastics that has received some interest recently is conversion of
plastics to synthetic diesel. An investigation into GHG impacts of a variety of waste and energymanagement scenarios for London found that the climate benefits of recycling plastics from the
city’s MSW far outweighed conversion to diesel (Eunomia, 2008).
The role of the informal recycling sector should not be underestimated in developing nations.
The World Bank estimates that around 1% of the urban population in developing countries
(approximately 15 million people) earns their livelihood from waste-picking and the informal
recycling sector (Medina 2008). Because these activities are not formally organised or often
sanctioned by government, their contribution to waste management and resource recovery (and
the economy) is often not recognised. However, there is growing appreciation of the role of
‘waste pickers’ in some countries. Governments in Brazil and Colombia now support the
informal sector, which has enabled the formation of waste picker organisations with greater
respect and ability to negotiate direct source-collection contracts (or informal agreements) with
businesses, industries, and neighbourhood associations (Medina 2008).
A recent report on the climate impact of the informal waste sector in India estimates that
activities in Delhi alone equate to savings of around 962,000 tonnes CO2-e (Chintan 2009). This
figure was calculated based on only paper, plastics, metals, and glass recovery, using material
specific emissions factors developed for the US EPA’s LCA model, WARM, in the absence of
Indian LCA tools. However, the report authors note that, due to very conservative estimates of
recycling rates and the much more coal-dependent energy mix in India, the values generated by
WARM are likely to underestimate the contribution of the informal sector. Figure 7 compares the
GHG savings attributed to the informal recycling sector with the estimated GHG reductions
anticipated from several waste-to-energy projects and a composting plant currently registeredas CDM projects for India (Chintan 2009). The comparison is highly relevant: waste-to-energy
projects generally conflict with the informal sector, limiting waste pickers’ access to recyclable
materials and negatively impacting their livelihood (Chintan 2009, Global Alliance of
Wastepickers/Recyclers and Allies 2009).

8/8/2019 Waste and Climate Change: Global trends and strategy framework
http://slidepdf.com/reader/full/waste-and-climate-change-global-trends-and-strategy-framework 40/79
34
Figure 7: Estimated average annual GHG emissions reductions for waste management scenarios in India, based
on assessment of informal recycling sector and data provided in UNFCCC CDM Project Design
Documents (Chintan 2009).
The economic contribution of waste pickers should also not be overlooked. Informal recycling in
Jakarta reduces the volume of waste by approximately 30%, thereby saving on collection and
disposal costs, and extending the life of landfills (Medina 2008). In major Indian cities such as
Delhi and Bangalore, waste pickers prevent at least 15% of MSW going to landfill, saving the
government around US$13,700 per day in waste collection and disposal costs (Sharholy 2008).
Mexican paper mills have strengthened relationships with waste picker associations in order to
secure more supply of valuable waste paper.
3.3.6 Waste prevention
Waste prevention is considered the most important action in the waste hierarchy; however it
often receives minimal priority in terms of resource allocation and effort. Waste avoidance is
critical to decoupling waste generation from economic growth. Within waste prevention there
exists a raft of mechanisms that can deliver climate benefit, such as cleaner production,
extended producer responsibility, sustainable consumption and production, etc. The SCP
Branch of UNEP is involved in a number of programmes targeting sustainable consumption and
production, including collaborations with the International Solid Waste Association (ISWA) on
waste minimisation. Various mechanisms have been developed and applied to prevent waste
arising, with most relying on concerted efforts to educate waste generators. Table 12 provides
examples of several waste prevention programmes.
A number of EU Directives, such as the Waste Electrical and Electronic Equipment (WEEE)Directive and the Directive on Packaging and Packaging Waste, have promoted extended
producer responsibility (EPR) for specific materials in Europe. Parts of Canada and Australia
also have EPR legislation in place that effectively reduces targeted waste streams, such as
beverage containers, used tyres, and car batteries.
In terms of climate change impact, the benefits of waste prevention generally outweigh benefits
derived from any other waste management practice: not only are net GHG emissions avoided
from treatment and disposal of the waste, but there is also a noteworthy benefit in avoided GHG
emissions from less raw resource extraction and manufacturing. LCA has been used to estimate
the climate benefit of avoided resource use for a limited number of scenarios – it is difficult to
quantify the impacts of a waste prevention measure. A US EPA study found that, generally, the
net GHG emissions for a given material are lowest for source reduction and highest for
landfilling (US EPA, 2006). This is especially true for prevention of paper waste where GHG

8/8/2019 Waste and Climate Change: Global trends and strategy framework
http://slidepdf.com/reader/full/waste-and-climate-change-global-trends-and-strategy-framework 41/79
35
savings are attributed to increases in forest carbon sequestration (i.e. less use of virgin forest
materials to produce paper products equates to less deforestation).
Table 12 Examples of waste prevention initiatives across different waste streams
Targeted waste stream Initiative Comments
Commercial / Industrialwaste
Cleaner Production For example, manufacturing wastes are reducedthrough systems assessment and more effective use
of raw materials
Municipal solid waste Extended product life Many products have limited lifetime for purely
commercial reasons (i.e. built-in obsolescence) –
increasing product durability and warranty has a
direct impact on waste generation
Packaging waste Light-weighting Reducing the amount of material used to produce
packaging (i.e. lighter plastic wrapping, lighter
cardboard boxes)
A recent report produced by the US EPA Office of Solid Waste and Emergency Response (US
EPA 2009) examines how GHG emissions could be prevented through alternative management
of materials (US EPA, 2009). An estimated 42% of total US GHG emissions are due to
materials management. Strategies discussed in the report include source reduction through
improved product design and cleaner production, increasing product durability, and maximising
the ease of product disassembly (for recycling). A number of scenarios were modelled to
estimate the potential GHG reductions, assuming no economic, institutional, or technological
barriers – results of several scenarios are shown in Table 13 and indicate the order-of-
magnitude impact of various activities. The scenarios were modelled using the waste LCA tool
developed by the US EPA (called WARM). The assumptions in WARM regarding LFG capture,
incinerator efficiency, etc, will impact on results – these assumptions are not presented in thereport. However, the key areas for action are clear: increasing recycling, maximising LFG
capture, and reducing packaging result in significant GHG benefits.
Table 13 Summary of selected materials management scenarios for the US (source: US EPA, 2009)
Scenario Estimated GHG
emissions benefit
(Mt CO2-e/yr)
Reduce packaging use by 50% 40 – 105*
Reduce packaging use by 25% 20 – 50
Increase the national MSW recycling and composting rate from current (32.5%)
to 50%
75
Combust 25% of currently landfilled MSW 20 – 30
Capture 50% of currently emitted methane at US landfills for electricity
generation
70
*higher benefits include GHG credit for forest sequestration

8/8/2019 Waste and Climate Change: Global trends and strategy framework
http://slidepdf.com/reader/full/waste-and-climate-change-global-trends-and-strategy-framework 42/79
36
3.4 Summary of GHG implications of waste managementpractices
Direct comparisons of the climate impacts of different waste management practices, based on
GHG estimates presented in the literature, are not possible at the global scale. The current
report does not propose to identify a single ‘best’ waste management approach, in terms ofclimate benefit, for global application. Rather, the preceding discussion is intended to inform the
development of UNEP’s international framework strategy to deliver and support initiatives in the
field of waste and climate change.
Several general conclusions can, however, be drawn from the above discussion:
The net GHG emissions estimated from any given waste management system will depend
on regional conditions, such as waste composition and energy mix, and assumptions
regarding technology performance, carbon storage/sequestration, etc. Where data is limited
or unavailable, as is often the case in developing nations, accurate estimates of GHG
emissions from waste practices are unlikely to be achievable.
Although the current report was commissioned to examine the climate implications of waste
management practices, an integrated approach to planning for waste management must
also consider the economic, social, and wider environmental aspects of technologies and
activities.
There is general consensus across the global waste sector that the greatest climate benefit
will be achieved through improved materials management leading to waste prevention.
Recycling of most materials results in the ‘next best’ GHG savings. Globally, waste
prevention and resource recovery represent the key activities by which the waste sector can
significantly contribute to climate change mitigation.
The climate benefits of composting and anaerobic digestion are attributable to carbon
binding in soil, substitution of synthetic fertilisers (and peat), reduced use of pesticides, and
improved soil structure (reduced erosion and less irrigation). These benefits are difficult to
determine and generally only the GHG savings due to soil carbon binding and fertiliser (and
peat) substitution are estimated.
GHG savings can be achieved through incineration of waste with energy recovery,
depending on waste composition, use of the generated energy (as heat and/or electricity),
the substituted energy mix, and efficiency of the technology.
Methane emissions from landfill represent the largest source of GHG emissions in the
waste sector. Landfill remains the predominant waste disposal method in most parts of theworld, and as landfill management improves in developing countries, methane emissions
are anticipated to increase. LFG capture can considerably reduce methane emissions and,
where the captured gas is used to generate energy, can lead to GHG savings.
During consultation on the draft version of the current report, numerous respondents requested
a comparison of the GHG emissions of different waste management practices. As noted above,
this is not possible at a global level. However, a series of recent publications provide
comparable data in the European context (see relevant articles, as referenced below, in Special
issue: Applied Greenhouse Gas Accounting: methodologies and cases . Waste Management &
Research: 27: 9: November 2009). A synopsis of this data is presented in Table 14 and is
intended to provide a general summary of GHG impacts of waste management practices, and to
demonstrate the range of values estimated for the various management options, in theEuropean environment. To reiterate, these values, and any comparison, are not transferable to
other regions/countries.

8/8/2019 Waste and Climate Change: Global trends and strategy framework
http://slidepdf.com/reader/full/waste-and-climate-change-global-trends-and-strategy-framework 43/79
37
Table 14: Summary of GHG emissions from waste management practices in Europe (negative values indicate GHG savings an
data sources are noted in table).
Waste management
activity
Upstream emissions (kg
CO2‐e/tonne input
waste)
Direct emissions (kg CO2‐
e/tonne input waste)
Downstream
emissions (kg CO2‐
e/tonne input
waste)
Key assumptions
Recycling paper 1.3 to 29 2.7 to 9.4 488 to 1,464 Reprocessing of 976 kg recovered
waste paper, substituting recycled
paper stocks
‐1,269 to 390 Reprocessing of 976 kg recovered
waste paper, substituting virgin
paper stocks
‐1,854 to ‐4,392 Reprocessing of 976 kg recovered
waste paper, substituting virgin
paper
stocks
and
energy
from
biomass
Recycling glass 1 to 19 0 to 10 ‐506 to ‐445 Recovered glass cullet substitutes
tonne of virgin glass
Recycling plastic 23 to 548 0 to 60 ‐1,574 to ‐108 Recovered plastic substitutes virgi
plastic or timber
2.5 to 68 1 to 60 ‐1,047 to ‐58 Recovered plastic substitutes virgi
plastic or timber
Recycling aluminium 6 to 45.8 6.8 ‐5,040 to ‐19,340 Reprocessing and avoided virgin
production of
950
kg
recovered
aluminium scrap
Recycling steel 6 to 45.8 6.8 ‐560 to ‐2,360 Reprocessing and avoided virgin
production of 980 kg recovered st
scrap
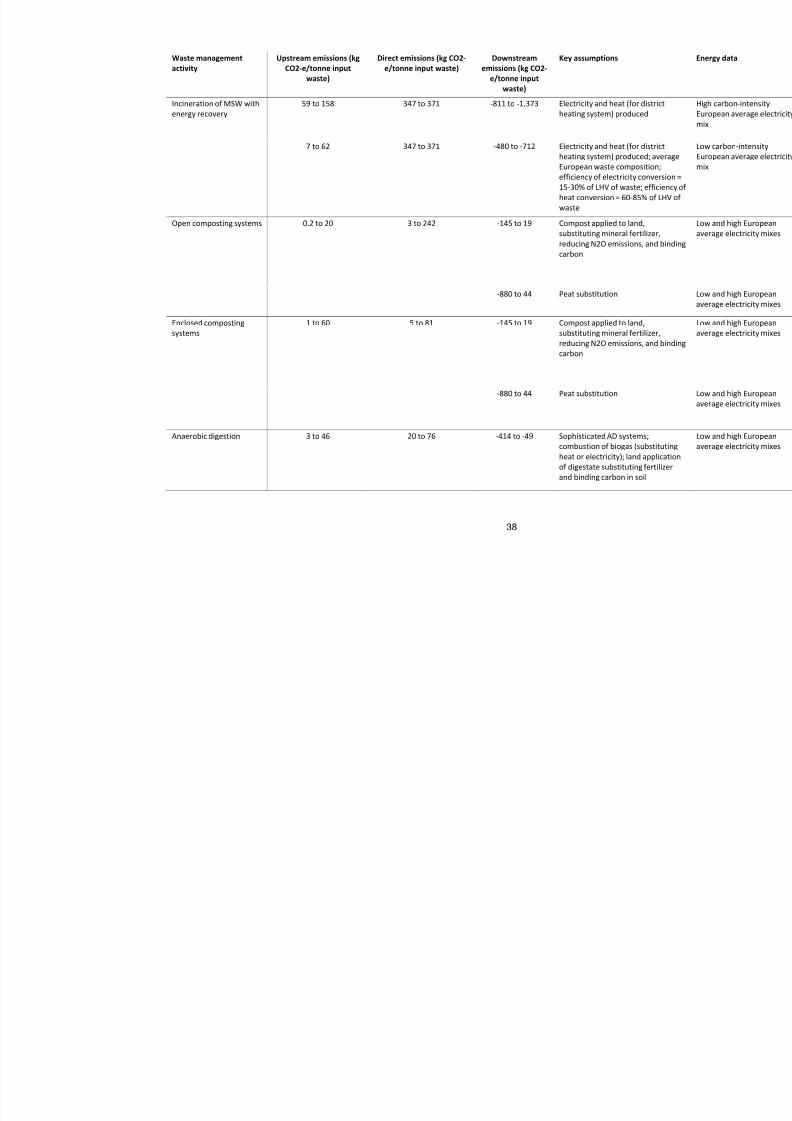
8/8/2019 Waste and Climate Change: Global trends and strategy framework
http://slidepdf.com/reader/full/waste-and-climate-change-global-trends-and-strategy-framework 44/79
38
Waste management
activity
Upstream emissions (kg
CO2‐e/tonne input
waste)
Direct emissions (kg CO2‐
e/tonne input waste)
Downstream
emissions (kg CO2‐
e/tonne input
waste)
Key assumptions
Incineration of MSW with
energy recovery
59 to 158 347 to 371 ‐811 to ‐1,373 Electricity and heat (for district
heating system) produced
7 to 62 347 to 371 ‐480 to ‐712 Electricity and heat (for district
heating system) produced; averag
European waste composition;
efficiency of electricity conversion
15‐30% of LHV of waste; efficiency
heat conversion = 60‐85% of LHV o
waste
Open composting systems 0.2 to 20 3 to 242 ‐145 to 19 Compost applied to land,
substituting mineral fertilizer,
reducing N2O emissions, and bind
carbon
‐880 to 44 Peat substitution
Enclosed composting
systems
1 to 60 5 to 81 ‐145 to 19 Compost applied to land,
substituting mineral fertilizer,
reducing N2O emissions, and bind
carbon
‐880 to 44 Peat substitution
Anaerobic digestion 3 to 46 20 to 76 ‐414 to ‐49 Sophisticated AD systems;
combustion of biogas (substituting
heat or electricity); land applicatio
of digestate substituting fertilizer
and binding carbon in soil

8/8/2019 Waste and Climate Change: Global trends and strategy framework
http://slidepdf.com/reader/full/waste-and-climate-change-global-trends-and-strategy-framework 45/79
39
Waste management
activity
Upstream emissions (kg
CO2‐e/tonne input
waste)
Direct emissions (kg CO2‐
e/tonne input waste)
Downstream
emissions (kg CO2‐
e/tonne input
waste)
Key assumptions
Dump (unmanaged
landfill)
0 561 to 786 0 Average European waste
composition; approx 46% of origin
biogenic C in waste assumed to
remain
as
stored
C
and
credited
asGHG savings
Landfill with flared LFG 2 to 12 ‐71 to 150 0 Average European waste
composition; LFG capture efficienc
over 100 yrs = 50‐80%; 48% of
original biogenic C assumed stored
Landfill with LFG capture
and utilisation
2 to 16 ‐71 to 150 ‐5 to ‐140 Average European waste
composition; LFG capture efficienc
over 100 yrs = 50‐80%; 48% of
original biogenic C assumed stored
Low organic waste landfill 2 to 10 ‐50 to ‐13 0 Low organic waste (30‐40% biogen
C); LFG capture efficiency over 100
yrs = 30
‐50%

8/8/2019 Waste and Climate Change: Global trends and strategy framework
http://slidepdf.com/reader/full/waste-and-climate-change-global-trends-and-strategy-framework 46/79
40
4 Development of international strategyframework
The following sections develop a framework for a UNEP-led strategy in the field of waste andclimate change. UNEP is already active in a number of waste and climate change programmes,
including collaborations with other UN and international organisations – these activities are
summarised in Table 15. The goal of UNEP’s strategy framework in this emerging field is to
enhance existing initiatives, identify gaps in current global activity, and catalyse the direction of
resources towards essential programmes and actions at the local, regional, and national level.
There are clear synergies with the DTIE Branch’s simultaneous proposal to launch a Global
Platform for Waste Management (GPWM).
Table 15 Current UNEP activity, at various scales, relevant to waste and climate change
Nature of activity Activity description
Technical
Policy & regulation
Institutional
Social
Recycling initiatives
Sustainable Consumption and Production (i.e. the
Marrakech Process)
International declaration on Cleaner Production
National Cleaner Production Centres Resource-Efficient
Cleaner Production Programme (RECP) (UNEP/UNIDO)
Global e-Sustainability Initiative
Integrated waste management
International Panel for Sustainable Resource
Management
Life Cycle Initiative (UNEP/ Society of EnvironmentalToxicology and Chemistry (SETAC))
Green Economy Initiative
Regional Seas Programme – marine litter
Capacity Development for Clean Development
Mechanism Project
Global Platform for Waste Management (currently being
launched)
4.1 Context – international conventionsThe most relevant international conventions in the field of waste and climate change are the
United Nations Framework Convention on Climate Change (UNFCCC) and the Basel
Convention (BC). The pertinent articles of the UNFCCC are as follows13
:
Article 4.1(c) – reference to development, application, and transfer of technologies,
practices and processes that control, reduce or prevent anthropogenic emissions of GHG
in the waste sector
13UNFCCC 1992 (FCCC/INFORMAL/84 GE.05-62220 (E) 200705)

8/8/2019 Waste and Climate Change: Global trends and strategy framework
http://slidepdf.com/reader/full/waste-and-climate-change-global-trends-and-strategy-framework 47/79
41
Article 4.3 – reference to providing financial resources to meet the full costs incurred by
developing country Parties in complying with their obligations to communicate information
related to implementing the Convention (i.e. national GHG inventories and reports)
Article 4.5 – reference to the transfer of environmentally sound technology and
knowledge from developed country Parties to developing country Parties to enable them
to implement the provisions of the Convention
Article 11 – reference to a mechanism for the provision of financial resources on a grant
or concessional basis, including for the transfer of technology
Waste is further highlighted on the UNFCCC agenda in the Bali Action Plan (2008)14
, through
the following sections, which directly impact on the waste sector:
Paragraph 1(b) – reference to enhanced national/international action on mitigation of
climate change through cooperative sectoral approaches and sector-specific actions
Paragraph 1(d) – reference to enhanced action on technology development and transfer
to support action on mitigation
Paragraph 1(e) – reference to enhanced action on the provision of financial resources
and investment to support action on mitigation and technology cooperation
The Basel Convention (BC) is the leading international agreement addressing both hazardous
and other wastes. The focus of the Convention has historically been on the trans-boundary
movement of hazardous wastes. However, the Convention’s definition of wastes is broad and
covers “substances or objects which are disposed of or are intended to be disposed of or are
required to be disposed” (Article 1). The Convention addresses both hazardous and “other”
wastes. “Other” wastes are referred to extensively throughout the Convention and include those
wastes that are referred to in Annex II (including household wastes).
The Convention calls on Parties to take “all practicable steps to ensure that hazardous and
other wastes are managed in a manner which will protect human health and the environment
against the adverse effects which may result from such wastes” (Article 1). Climate change isnecessarily included within this mandate. Indeed, the Basel Convention is arguably mandated to
examine a broad range of issues relating to wastes and waste management, including those
touching on climate issues.
The Convention’s focus on environmentally sound management provides an opportunity for
efforts both to improve the contribution of waste management to climate goals, and to realize
new and additional resources to enhance waste management and implement the Convention.
The Convention also cooperates with the Stockholm Convention on Persistent Organic
Pollutants and the Rotterdam Convention on Prior Informed Consent Procedures for Certain
Hazardous Chemicals and Pesticides that are in International Trade. Cooperation is formalisedthrough an ad hoc joint working group (the “AHJWG”) to prepare joint recommendations on
enhanced cooperation and coordination among the three conventions on chemical and waste-
related matters.
4.1.1 Need for enhanced action
There is general agreement amongst the Parties to the UNFCCC that the current levels of
action on mitigation, adaptation, technology transfer, and finance are not sufficient to meet the
requirements of the UNFCCC. Parties have identified a pressing need to enhance technology
transfer and finance.
14UNFCCC Decision 1/CP.13
8/8/2019 Waste and Climate Change: Global trends and strategy framework
http://slidepdf.com/reader/full/waste-and-climate-change-global-trends-and-strategy-framework 48/79
42
Negotiations under the Bali Action Plan are expected to yield enhanced actions in a range of
areas relevant to the nexus between climate change and waste management.
In relation to enhanced action on mitigation, the Parties are discussing how “cooperative
sectoral approaches and sector-specific actions” can enhance the development,
application, and transfer of technologies, practices and processes that control, reduce or
prevent anthropogenic emissions of GHG in all relevant sectors, including the waste
sector. Sectoral approaches to technology transfer provide one means for enhancing
cooperation on waste and climate linkages.
In relation to enhanced action on technology, the Parties are discussing technology
action plans, a multilateral technology fund and new institutional arrangements to scale-
up the development and transfer of technologies. New or enhanced arrangements may
provide a useful vehicle for supporting cooperation to address shared challenges of
climate change and waste management.
In relation to enhanced action on financing, the Parties are discussing the provision of
substantially scaled-up financing for mitigation, adaptation and technology cooperation,
an enhanced financial architecture and institutions to support national actions.
Discussions are addressing both short-term and long-term financial needs. The wastesector is one area, among others, that should be eligible for scaled-up financing.
In the negotiations, a variety of proposals have been offered in each of these areas. Several
recurring themes are evident in the proposals relevant to enhanced funding, which provide an
indication of areas where additional efforts could be made, particularly from the perspective of
developing countries15
:
Recognise, promote and strengthen engagement at the country level
Ensure a country-driven approach and direct access to funding
Enable a shift from a project-based approach to a programmatic approach to help
optimize and scale up implementation Reduce fragmentation of funding by facilitating linkages between various funding sources
and funds to promote access to a variety of available sources
Ensure activities relevant to climate change undertaken outside the framework of the
financial mechanism (including those related to funding) are consistent with the
Convention and relevant Conference of Parties decisions
Closely linked with proposals to enhance financing are those to strengthen the development
and transfer of technologies. In particular, there is strong support for a technology transfer
mechanism. Currently, there is no single focal facility through which all the various mechanisms
and programmes of the different agencies pass through. This has led to dispersed,
uncoordinated efforts, and duplication
16
. Key elements of a technology transfer mechanism mayinclude a new subsidiary body (established under Article 7.2(i) of the Convention) to enable
implementation of the Convention’s technology-related obligations to support action on
mitigation and adaptation, as well as a dedicated Technology Fund to finance efforts relating to
technology development and transfer. The mechanism would address current shortcomings in
the transfer of technology, by supporting initiatives such as:
15Important proposals on financing have also been offered by Mexico, Norway, Switzerland, China and the G77, the
United States and other countries. For example, submissions from Parties recorded in FCCC/AWGLCA/2008/MISC.5
and FCCC/AWGLCA/2008/MISC.2/Add.1
16See also comments by Sarma, K. M. (2008). Technology Transfer Mechanism for Climate Change . Draft 24 March
2008. Available from the Institute for Governance & Sustainable Development.
8/8/2019 Waste and Climate Change: Global trends and strategy framework
http://slidepdf.com/reader/full/waste-and-climate-change-global-trends-and-strategy-framework 49/79
43
Promotion, facilitation and implementation of activities along the entire technology cycle
to accelerate the rate at which environmentally sound technologies are adopted.
Support for research, development, manufacture, commercialization, deployment and
diffusion of technologies for adaptation and mitigation, in accordance with the Bali Action
Plan.
Adaptation technologies to address the adverse effects of climate change and finance the
removal of barriers to the large-scale transfer of technologies for adaptation.
Technologies to address the adverse impact of response measures , and finance the
removal of barriers to the large-scale transfer of technologies for reducing the adverse
impact of response measures.
Capacity-building to manage and generate technological change, enhance absorptive
capacity, and create enabling conditions in developing countries. This would include
costs relating to research, development and demonstration of new technologies;
enhancing human and institutional capacity; and guarantees on foreign direct investment
for environmentally sound technologies.
Commercialization of new and emerging technologies . This would include venture capital,
with public investment leveraging private capital markets for emerging technologies;
research, development, and demonstration of new technologies, financed by venture
capital and other sources; and joint technology development.
Creation of manufacturing facilities for environmentally sound technologies, including low-
GHG (greenhouse gas) emission technologies. This would include the costs of
compulsory licensing and cost associated with patents, designs, and royalties; conversion
of existing manufacturing facilities or of establishing new facilities; research and
development activities, including joint research, development, design, and demonstration;
technology adaptation; retraining and dissemination of know-how; operation (of
facilities/technologies); and monitoring and verification.
Procurement of low-greenhouse gas emission technologies , including software and
hardware. This would include cost of premature modification or of replacement of existing
equipment, as well as the cost of new equipment; cost of retraining and dissemination of
know-how; cost of technical assistance for the design, installation and stable operation of
the technology; cost of fuel and other operational costs; cost of technologies for fuel
switching; and cost of monitoring and verification.
4.2 Current international activity – waste and climatechange
The total number of current projects led by international organisations is difficult to ascertain as
there is no central clearinghouse of information, and projects range in scale from local initiatives
with limited reporting to high-profile multi-national projects17
. Comprehensive lists of
international initiatives are provided in Appendix C –. Further input from the international waste
and climate change community would help to expand this list and assist in a more thorough gap
analysis. As previously mentioned, UNEP is already a key leader in the waste and climate
change arena. The IETC Branch is particularly active in waste management and treatment,
whereas the SCP Branch focuses on overall resource efficiency, with programmes on waste
prevention.
17Numerous national government organisations offer bilateral aid for waste and climate change initiatives, but are not
within the scope of the present report.

8/8/2019 Waste and Climate Change: Global trends and strategy framework
http://slidepdf.com/reader/full/waste-and-climate-change-global-trends-and-strategy-framework 50/79
44
4.2.1 Offsetting: CDM and JI
The CDM and JI are flexible mechanisms under the Kyoto Protocol, which assist Annex 1
countries to meet their emission reduction commitments through investment in projects initiated
in either non-Annex 1 countries (in the case of CDM) or Annex 1 countries (JI projects). Details
of the CDM and JI are available from the UNFCCC website18
. In both mechanisms, Annex 1
countries offset their own emissions by reducing those of another country – at a global scale,offsetting does not equate to a reduction of emissions. Reductions are achieved through the
caps placed on emissions from Annex 1 countries.
The issue of ‘additionality’ is critical in ensuring that CDM and JI projects deliver real climate
benefit. CDM projects are only approved by the CDM Executive Board if they can demonstrate
that the planned activities and consequent emissions reductions would not occur without the
additional incentive provided by the CDM. This can be a difficult point to prove, and different
interpretations of additionality have lead to some criticism of CDM projects.
At the time of writing there are 409 active registered CDM projects related to waste handling
and disposal. This includes projects related to wastewater; however the majority deal with solid
waste – examples are provided in Appendix D – CDM waste projects. Waste projects arepredominantly involved in LFG capture and, usually, conversion to energy. Waste to energy
(incineration) and composting projects are also receiving approval. A range of baseline and
monitoring methodologies have been approved by the CDM Executive Board in order to
establish the credibility of a project19
. Alternatively, project participants can propose a new
methodology. The process of developing and receiving approval for a CDM project takes 1-2
years, or longer if a new methodology is proposed (Norsk Energi 2008).
There are approved methodologies for LFG capture (i.e. ACM0001 ‘Consolidated baseline and
monitoring methodology for landfill gas project activities’, sometimes in conjunction with
ACM0002 ‘Consolidated methodology for grid-connected electricity generation from renewable
sources’). Combustion of waste with energy recovery and organic waste composting projectsboth may use methodology AM0025 (‘Avoided emissions from organic waste through alternative
waste treatment processes’). Compost projects may also be eligible to use methodology AMS-
111.F (‘Avoidance of methane emissions through controlled biological treatment of biomass’).
The waste related projects represent around 18% of all CDM projects (Figure 8). The 11
rejected or withdrawn waste-related CDM projects this year were related to landfill gas, although
there does not appear to be a single reason for project failure (issues included methodology and
lack of additionality).
18See: http://unfccc.int/kyoto_protocol/mechanisms/items/1673.php
19
Baseline methodologies guide the preparation of credible scenarios which present the net GHG emissions/reductionsthat would occur without the project; monitoring methodologies ensure the credibility of the GHG reductions resulting
from the project.

8/8/2019 Waste and Climate Change: Global trends and strategy framework
http://slidepdf.com/reader/full/waste-and-climate-change-global-trends-and-strategy-framework 51/79
45
Figure 8 Distribution of CDM projects (source: UNFCCC website)
Several trends in the regional distribution of CDM projects are worth noting (these trends refer
to all CDM projects, not only waste-related activities). Donor countries are almost exclusively
European, with the exception of Japan and Canada. Switzerland and the UK are almost the only
countries that invest in Mexico. Most of the projects supported by Germany relate to
composting. Major host countries include India, Brazil, China, Malaysia, Mexico; however some
of the poorest regions have limited CDM projects. For example, Africa and the Middle East are
comparatively under-represented (approximately 5% and 4% of total CDM, respectively –
around one fourth of CDM projects in Africa are in South Africa).
There are significantly fewer JI projects than CDM. Of the current 243 JI initiatives, 32 (13%)
relate to landfill gas capture, and additional projects may relate to energy produced from waste
biomass. Russia and the Ukraine host 58% of all projects, and Eastern Europe hosts a further
36%. Germany, France and New Zealand host the remaining few projects. New Zealand is the
only non-European country to host a JI initiative (of the six projects currently operating, two are
LFG recovery, and the remainder are wind farms).
4.3 Gap analysis
Gaps exist in the current range of activities led by international organisations in the field of
waste and climate change. However, it is also apparent that perhaps the most significant ‘gap’ is
a cohesive, systematic approach to the global mobilisation of waste and climate change
programmes. As described in the first part of this paper, the magnitude of the climate impact

8/8/2019 Waste and Climate Change: Global trends and strategy framework
http://slidepdf.com/reader/full/waste-and-climate-change-global-trends-and-strategy-framework 52/79
46
from waste management is largely guesswork – essential information regarding waste
generation and management is simply not available in many cases, from both developed and
developing regions. Even more important is the lack of waste sector information that would
allow a more accurate assessment of the opportunities. In the waste sector, opportunities
generally equate to net GHG savings.
Without a clear idea of the problem and opportunities in each country, national waste strategies
and action plans cannot be realistically developed. And without national strategies, international
assistance will necessarily be fragmented, potentially resulting in poorly allocated resources,
lack of government support and commitment, and duplication. Fact-based national strategies,
including clear goals and targets, are critical to guide international assistance. There are indeed
evident synergies with the UNEP DTIE project ‘Waste Management: Converting Problems into
Opportunities to Improve Resource Efficiency’, which aims to develop integrated waste
management – including strategies – in developing nations.
The benefits of waste prevention, in terms of the potential to off-set GHG emissions, have not
been fully explored or exploited at the global level. Further investigations for specific materials
and at regional scales are needed to properly assess the opportunities. For example, useful
studies may include identification of carbon-intensive materials to target in ‘lightweighting’projects. Again, a cohesive effort would avoid duplication and ensure well-resourced, targeted,
high quality studies. Results of studies must inform regional and national decisions, through
government as well as industry associations. International best practice in waste prevention
policy and practice needs to be both developed and disseminated. Synergies exist with UNEP’s
SCP programme, and could be more fully explored and exploited.
The CDM and JI may offer opportunities to transfer best practice in waste prevention from
Annex 1 countries, however assistance is needed to find or apply suitable methodologies. This
is also the case for projects focussed on resource recovery. Currently, no methodologies exist
under CDM/JI that specifically recognise the value of GHG savings associated with waste
minimisation – this represents a serious gap. There are accepted methodologies appropriate for
fuel-switching and fossil fuel avoidance, which could be applied to certain waste minimisation
projects, if these projects are structured to fit the methodologies. A further shortcoming of the
current spread of CDM projects across the globe is severe regional disparity: as shown above,
many of the world’s poorest countries do not have CDM projects. UNEP’s ‘Capacity
Development for Clean Development Mechanism” Project, launched in 2002, aims to improve
understanding of CDM in potential host countries and develop the institutional and human
capacity needed to develop and implement CDM projects. The effectiveness of this initiative and
the possibility of further extending it need to be explored. In the event that the CDM is replaced
or twinned by a non-offsetting mechanism, the capacity of the least-developed countries to
access these sources of finance must still be addressed.
The role of the informal sector in resource recovery and associated climate change mitigation islargely overlooked in developing countries. Waste pickers require support to form co-operatives,
access better equipment, negotiate direct access to waste sources, and generally improve their
health, safety, and livelihood. Governments of developing nation cities need assistance to
understand the value of the informal sector and to incorporate the informal sector in waste
strategies.
From the previous analysis, there are clearly a number of waste management processes that
effectively mitigate GHG emissions or offer a net benefit. These can be generally grouped into
two categories: 1) processes that are technologically simple, rapidly deployed, and low-cost (in
relative terms), and 2) processes that involve sophisticated, expensive technology and typically
require > 5 years to deploy (i.e. due to financing, planning, and regulatory processes). Although
various international programmes identified above provide technical and/or financial support for
the development of waste processes within each category (i.e. GEF funds both LFG recovery

8/8/2019 Waste and Climate Change: Global trends and strategy framework
http://slidepdf.com/reader/full/waste-and-climate-change-global-trends-and-strategy-framework 53/79
47
and waste-to-energy projects), there is a lack of collaboration to focus resources on achieving
rapid, effective emissions reductions and gains in the waste sector.
In summary, the following gaps in international activities are apparent:
Collaborative, international focus on the rapid deployment of simple, proven waste
practices and technologies.
Development of marginal abatement cost curves to help inform funding priorities.
Production of comprehensive waste reports and strategies for developing (and EIT)
countries, with details of waste generation, management practices, and trends (UNEP-
GC. These should link-in with the existing ISWM initiative led by UNEP, and ensure that
information and goals with relevance to climate change are highlighted.
Centralised collation and dissemination of global waste sector information of relevance to
climate change.
Support for targeted LCA and CBA-type studies at the local level, to support decision-
making vis-à-vis waste prevention policy.
Development and global dissemination of international best practice in policy andprogrammes relevant to waste prevention and sustainable production and consumption.
Investigate development of new CDM and JI methodologies for waste prevention
practices, and to account for GHG savings gained through resource recovery (i.e.
recycling), and provide guidance on application of existing methodologies to recycling
and waste prevention projects.
Support for the informal recycling sector, including recognition of the sector’s role in
sustainable waste management and resource recovery, protection of waste-pickers’
livelihood, and improvement of health, safety, and general quality of life.
Capacity of the world’s poorest countries to access finance sources and technology.
Willingness of potential donor countries and organisations to fund projects in accordance
with the priorities of the waste management hierarchy.
4.4 Strategy framework
UNEP is seeking to develop a strategy framework for discussion and for action. The waste
sector, through sound resource management and resource and energy recovery, has the
potential to become a net contributor to global GHG reductions. The overall aim of the strategy
is therefore to promote sustainable waste management, in accordance with the waste
management hierarchy, and reduce greenhouse gas emissions from the waste managementsector. Objectives are intended to be achieved through cohesive delivery of projects focussed
on bridging gaps between existing activities in the context of waste and climate change.
The structure and components of the framework are relatively generic, and applicable to the
development of any organisational strategy. The vision, goals, approach, guiding principles, and
strategic directions have evolved from UNEP’s recognised leadership role in the area of waste
and climate change. Actions have been identified through a gap analysis of existing
international organisations and initiatives. Given the range of current activities and the lack of
consolidated information regarding them, a critical review of the proposed actions by the
international community will be essential to ensure resources are best applied.

8/8/2019 Waste and Climate Change: Global trends and strategy framework
http://slidepdf.com/reader/full/waste-and-climate-change-global-trends-and-strategy-framework 54/79
48
4.4.1 Vision
A vision statement must be developed in consultation with key stakeholders to ensure
ownership of the strategy. The following vision has evolved from input from the international
waste management community:
To minimise climate impact through sustainable solid waste management, with actions prioritised according to the waste management hierarchy.
4.4.2 Goals
The strategic objectives noted above sit within three over-arching goals:
Goal 1: to minimise the impact of human activities on the climate
Goal 2: to promote waste prevention and resource recovery, thereby reducing the climate
impact of raw material extraction and manufacturing processes
Goal 3: to support and promote sustainable solid waste management (SWM) practices
4.4.3 Guiding principles
‘Build on existing initiatives and strengths’ reflects that many existing initiatives and actions
are under way, and the objective is to build on and strengthen these while identifying gaps and
areas to add value. The objective is to support and augment these existing initiatives, to build
on them wherever possible and to ensure that the whole becomes more than the sum of the
parts. Building on existing strengths helps to ensure buy-in and build trust, while enabling
scarce resources to be used efficiently and effectively. This principle applies equally to the
existing informal recycling sector in developing countries.
‘Partnerships and shared responsibilities’ recognises that a large number of organisations at
international, national, and regional levels are involved in the area of waste and climate change
(as identified in previous sections of this report), and that responsibility must be shared between
these organisations to ensure swift delivery of effective GHG prevention and mitigation
measures in the waste sector.
‘Best practice – best available technologies’ is a key principle where assistance is extended
to countries where uncontrolled landfilling is the predominant practice (i.e. EIT and non-OECD
countries). Although controlled landfilling may be a better practice, there may be a ‘best
available technology’ or system that avoids disposal of untreated waste and recovers materials
and/or energy. The ‘best practice’ in terms of the waste hierarchy is decoupling of wastegeneration from GDP – this must be encouraged through sharing experiences in waste
prevention and material recovery between nations.
‘Recognise diversity – address disparity’ means that the diversity of approaches to
integrated waste management and climate protection will be embraced and built upon, and
knowledge and technology will be transferred from developed to developing nations to address
the considerable regional disparity in waste management capabilities.
4.4.4 Functions
The strategy could support a number of functions designed to achieve the vision and enhance
action to minimize the impact of human activities on the climate and to support and promote

8/8/2019 Waste and Climate Change: Global trends and strategy framework
http://slidepdf.com/reader/full/waste-and-climate-change-global-trends-and-strategy-framework 55/79
49
sustainable SWM practices in-line with the waste management hierarchy. In accordance with its
principles, the strategy would seek to build on existing initiatives and promote partnerships and
best practices while recognizing diversity in approaches.
Some of the functions could be undertaken directly by the entities participating in the strategy
(e.g. UNEP, SBC, others) while other functions would be catalysed or supported by the strategy.
The functions could also be undertaken at different levels: international, national or sub-
national. The final configuration would be developed through consultation with key stakeholders
to gain feedback and ensure buy-in. Some key functions could include:
Strengthening national institutions . The strategy will seek to identify relevant national
focal points for waste and climate activities, enhance cooperation and strengthen capacity
and knowledge through engagement of expertise within countries (e.g. national research
institutions, universities, public and private-sector bodies) and cooperation at a bilateral,
regional or international level. The informal waste sector in developing nations should not
be overlooked as a key stakeholder and often critical focal point of waste activity.
Strengthening national networks . The strategy will support the creation and/or
strengthening of relevant national networks of individuals and institutions in the public,private and non-profit sectors with relevant expertise and knowledge. Networking can
play a crucial role in identifying needs and solutions and sharing best practices.
Supporting preparation of country programmes . The strategy can provide support to the
development of national strategies on climate change, waste management and other
areas to help identify linkages and synergies. Where appropriate, the strategy can help to
identify experts with capacity to support the development of country-specific programmes
that are consistent with domestic priorities and goals.
Building awareness and capacity. The strategy can help to raise the awareness among
policy- and decision-makers at the local, regional and national levels about interplay of
waste management and climate change, as well as opportunities to benefit from financialassistance, technology transfer or other support arising from existing and emerging
arrangements to address climate change. UNEP’s work in other areas (e.g. Green
Customs initiative) provides useful models.
Supporting development of appropriate regulations and policies. National regulations and
policies shape public and business behaviour. The strategy can support the conversion of
national programmes into regulations and policies. It can also enable the development of
supportive policies in related areas. Cooperation could involve sharing of experiences
and best practices at the local, regional or national levels and between countries. A focus
of policy should be to promote decoupling of waste generation from economic indicators,
such as GDP.
Technology identification and selection. The strategy can enable the identification of
needs, and matching of needs with appropriate technologies. It can also provide an
opportunity for technology and service providers to identify un-met needs and develop
appropriate solutions. Effective cooperation and communication can reduce the likelihood
of inappropriate technology selection and lock-in. At the local level, it is important to
preserve a range of strategies for waste management and not simply promote transfer of
European, Australian, or other technologies without discussion of their affordability,
overall sustainability, and adaptability – this is particularly true for developing nations.
Funding incremental costs of hardware and operations. The strategy can support
governments to identify appropriate funding for the incremental costs of sustainablewaste management technologies and practices. This could involve identifying relevant
multilateral, regional or private sector financing options and helping governments to

8/8/2019 Waste and Climate Change: Global trends and strategy framework
http://slidepdf.com/reader/full/waste-and-climate-change-global-trends-and-strategy-framework 56/79
50
match their projects with appropriate financial assistance. Funding support for developing
nations should focus on providing or enhancing local financial resources for waste
management, including mechanisms to enable local authorities to obtain and continue
those resources into the future (i.e. administered waste disposal fee program, public-
private partnerships, etc).
Supporting international networking and cooperation. As well as supporting networking at
the national level, the strategy can support networking and cooperation at the
international level – both among governments and among stakeholders in various sectors
of the waste management industry. More systematic cooperation and networking
internationally has provided a key to success in other areas of environmental policy.
Enabling stakeholder involvement . The strategy could encourage participation by all
relevant stakeholders at appropriate levels, including local communities, non-
governmental organizations, academics and researchers and the private sector. In many
developing countries, the informal recycling sector is a key stakeholder group in the
waste sector, and should be engaged in decision-making.
4.4.5 ActionsBased on the analysis of gaps in international activity, and input received from the international
waste management community, a number of actions are proposed – the list is indicative only,
and certainly not exhaustive. Selected actions would be delivered through an international
entity, specifically tasked with the waste and climate change strategy. Within the limitations of
available financial resources, actions would be implemented in priority according to the waste
management hierarchy (i.e. actions pertaining to waste prevention and reduction would be
implemented first).
Identified gaps Proposed actions
Development and global dissemination of international
best practice in waste prevention policy and
programmes.
Establish national waste prevention networks, linking
industry with government.
Prepare and circulate a report documenting current best
practice in waste prevention policy and programmes, with
detailed case studies. Emphasis should be placed on
decoupling waste generation from, for example, GDP.
Prepare and disseminate information on product-services,
highlighting opportunities for both developed and developing
countries.
Develop integrated resource policies, spanning the life-cycle
of resources used in various goods and products (this mayalso reduce hazardousness of certain types of wastes).
CDM and JI methodologies for waste prevention
practices, and to account for GHG savings gained
through resource recovery (i.e. recycling).
Support research into viable methodologies for waste
minimisation projects (i.e. validating GHG savings from
materials recovered for recycling).
Develop guidance on structuring recycling and waste
prevention projects to fit within existing CDM methodologies.
In consultation with a panel of international experts, propose
clear guidelines for what projects should and should not be
eligible for CDM and JI (this will necessarily define a
baseline of waste management practices for developing
countries)
Promotion of best-practice resource recovery systems
and processing, especially in developing nations
Investigate climate impacts of recycling processes and
resource recovery activities in developing nations,

8/8/2019 Waste and Climate Change: Global trends and strategy framework
http://slidepdf.com/reader/full/waste-and-climate-change-global-trends-and-strategy-framework 57/79
51
particularly those importing recyclable materials for
processing.
Support for informal recycling sector in developing
nations.
Promote legalisation of the informal waste sector in
developing countries.
Provide waste pickers with resources to form associations,
access funds for improved equipment, and agree contracts
for access to waste sources.
Develop case studies of informal sector recycling that
demonstrate the resource recovery, economic, and climate
benefits of these activities.
Prepare strategies in collaboration with relevant
organisations and local authorities of developing countries to
ensure protection of livelihood and improvement of quality of
life of the informal recycling sector.
Develop guidelines for local authorities for consideration of
the informal recycling sector when assessing changes to
existing waste management systems.
Support for targeted LCA and CBA-type studies at local
levels, to support decision-making vis-à-vis waste
prevention policy.
Develop an experts list and form expert panels for
consideration and peer review of key studies.
Create a database of existing LCA and CBA-type studies
relevant to waste prevention.
Support for development of marginal abatement cost
curves
Engage expert panel to research and develop marginal
abatement cost curves to help inform funding priorities,
particularly for EIT and developing nations.
Disseminate findings to relevant funding organisations and
support their application to projects.
Develop strategies for local financing of wastemanagement activities in developing countries.
Develop strategies, in collaboration with local authorities ofdeveloping countries, for the initiation and continuation of
local financing for waste management. Priority should be
given to development of local, sustainable funding
mechanisms (i.e. waste disposal fees, public-private
partnerships, out-sourcing to private sector), with limited
initial use of international donor funds. Care should be taken
to include the informal recycling sector as key stakeholders.
Analyse the financial implications and feasibility for each
funding mechanism (i.e. timing and size of required
resources) and disseminate general information to local
authorities of developing nations.Provide technical and financial support to enable under-
represented countries to access finance sources (i.e. assist
with project identification and assessment, and funding
applications). This could include an extension of UNEP’s
Capacity Development for Clean Development Mechanism
Project.
Define and assist distribution of an enhanced UNFCCC
financial mechanism, as applied to the waste sector.
Ensure that funding emphasis is equally placed on waste
collection systems and logistics, not only capital and
infrastructure.
Support for development of comprehensive waste and
climate change reports and strategies for developing
Link with UNEP ISWM programme to ensure climate impacts
and mitigation opportunities are addressed in waste reports

8/8/2019 Waste and Climate Change: Global trends and strategy framework
http://slidepdf.com/reader/full/waste-and-climate-change-global-trends-and-strategy-framework 58/79
52
(and EIT) countries and strategies.
Provide expert advice on what information is needed, and
how it can best be incorporated into national
reports/strategies.
Centralised collation and dissemination of global waste
sector information of relevance to climate change.
Develop and lead an international strategy for the collection
of global waste and waste management data, in
collaboration with other international organisations (i.e. the
International Energy Agency, ISWA, etc).
Establish an information clearinghouse for waste and climate
change.
Use existing national and international waste networks (i.e.
ISWA and country branches) to publicise and disseminate
information.
Support development of national waste networks in countries
where these do not currently exist (link with UNEP ISWM
programme).
Collaborative, international focus on the rapiddeployment of simple, proven waste practices and
technologies.
Establish a panel of organisations involved in funding wasteand climate related projects, particularly those with relevant
experience, such as the Methane to Markets Partnership
and Waste Concern.
Develop regional databases of appropriate ‘green’ waste
technologies for different waste streams, including
technology specifications, suppliers, cost estimates, and a
general assessment of risks.
A structure for the strategy is proposed in Figure 9.

8/8/2019 Waste and Climate Change: Global trends and strategy framework
http://slidepdf.com/reader/full/waste-and-climate-change-global-trends-and-strategy-framework 59/79
53
Figure 9 Proposal for strategic framework (UNEP-lead international programme targeting waste and climate
change)
Strategy vision: To
minimise climate impactthrough sustainable solid
Goal: to minimise the
impact of human activities
on the climate
Goal: to support and
promote sustainable SWM
practices
Global-level leadership for targeted international,
national, regional, and local initiatives
Partnerships and
shared
responsibilities
Best practice –
best available
technologies
Recognise
diversity – address
disparity
Strengthening national institutions
Strengthening national networks
Supporting preparation of
country programmes
Building awareness and capacity
Supporting development of appropriate
regulations and policies
Technology identification and selection
Funding incremental costs of hardware and
operations
Supporting international networking and
cooperationEnabling stakeholder involvement
Actions
VISION:
GOALS:
APPROACH:
GUIDING
PRINCIPLES:
FUNCTIONS:
ACTION:
Goal: to promote waste
prevention and
resource recovery
8/8/2019 Waste and Climate Change: Global trends and strategy framework
http://slidepdf.com/reader/full/waste-and-climate-change-global-trends-and-strategy-framework 60/79
54
4.4.6 Approach
The elements described above could be achieved through a variety of institutional
arrangements. The ultimate design of these arrangements should take into account current
mandates and modes of cooperation, as well as opportunities to expand and build on these. Itmust also take into account political as well as practical factors. Consensus must be reached
with respect to vision, goals, and functions before an operating structure (approach) can be
designed.
A collaborative mechanism could include a core body of relevant stakeholders, expert panels,
government-industry interest groups, and regional/national programme coordinators. The form
of this mechanism must be determined by its desired function.

8/8/2019 Waste and Climate Change: Global trends and strategy framework
http://slidepdf.com/reader/full/waste-and-climate-change-global-trends-and-strategy-framework 61/79
55
4.5 Summary of framework strategy development
A range of activities focussed on waste and climate change are currently being led by
international organisations, including UNEP. However, there is a lack of a cohesive approach,
which has resulted in gaps, duplication, and regional disparity in programmes offered. A centralmechanism is needed to collaborate with existing organisations to ensure accessibility to and
dissemination of relevant information across the globe, effective use of resources to achieve
climate benefit through integrated waste management, promotion of best practice, and rapid
transfer of simple, effective, proven technologies and knowledge to developing countries.
UNEP is ideally placed to lead this global initiative, through partnerships with other international
organisations already active in the field. The development of a framework strategy to implement
the proposed mechanism requires input from a range of stakeholders. To this end, the current
report is intended as a further step in a global dialogue to engage the international waste
community, identify the key issues, and create a strategy that will deliver significant climate
benefit in the waste sector.

8/8/2019 Waste and Climate Change: Global trends and strategy framework
http://slidepdf.com/reader/full/waste-and-climate-change-global-trends-and-strategy-framework 62/79
56
5 REFERENCES
Ashton, W., M. Chertow, and M. Shenoy (2009). Industrial Ecology – Developing Systemic
Solutions to Climate Change and other Environmental Challenges in Indian Industry.
Sustainability Tomorrow, October-December 2009.
Astrup, T., T. Fruergaard, and T.H. Christensen (2009). Recycling of plastic: accounting of
greenhouse gases and global warming contributions. Waste Management & Research: 2009:
27: 763-772.
Astrup, T., J. Mollee, and T. Fruergaard (2009b). Incineration and co-combustion of waste:
accounting of greenhouse gases and global warming contributions. Waste Management &
Research: 2009: 27: 789-799.
Australian Bureau of Statistics (ABS), (2008). Australia's Environment: Issues and Trends,
2007, Human activity trends: Waste (4613.0).
Bahor, B., M. Van Brunt, J. Stovall and K. Blue (2009). Integrated waste management as a
climate change stabilization wedge. Waste Management and Research, 27:839-849.
Barlaz, M.A. (2006). Forest products decomposition in municipal solid waste landfills . Waste
Management 26 (2006): 321-333.
Bogner et al (2009). MSW Management, March/April 2009.
Bogner, J., M. Abdelrafie Ahmed, C. Diaz, A. Faaij, Q. Gao, S. Hashimoto, K. Mareckova, R.
Pipatti, T. Zhang, Waste Management, In Climate Change 2007: Mitigation. Contribution of
Working Group III to the Fourth Assessment Report of the Intergovernmental Panel on ClimateChange [B. Metz, O.R. Davidson, P.R. Bosch, R. Dave, L.A. Meyer (eds)], Cambridge
University Press, Cambridge, United Kingdom and New York, NY, USA.
Bogner J, Pipatti R, Hashimoto S, Diaz C, Mareckova K, Diaz L, et al 2008. Mitigation of global
greenhouse gas emissions from waste: conclusions and strategies from the Intergovernmental
Panel on Climate Change (IPCC) fourth assessment report. Waste Management and
Research,26:11-32.
Boldrin, A., J.K. Andersen, J. Moller, E. Favoino, and T.H. Christensen (2009). Composting and
compost utilization: accounting of greenhouse gases and global warming potentials . Waste
Management & Research: 2009: 27: 800-812.
Chertow, M.R. (2009). The Ecology of Recycling . The UN Chronicle Online, Special Climate
Change Issue 2009.
Chertow, M.R. and D.R. Lombardi (2005). Quantifying Economic and Environmental Benefits of
Co-Located Firms. Environ. Sci. Technol., 2005, 39 (17), pp 6535–6541.
Chintan (2009). Cooling Agents: An Analysis of Climate Change Mitigation by the Informal
Recycling Sector in India. Report prepared in association with The Advocacy Project,
Washington DC.
Christensen, T.H., F. Simion, D. Tonini, and J. Moller (2009). Global warming factors modelled
for 40 generic municipal waste management scenarios . Waste Management & Research: 00:1-
14.

8/8/2019 Waste and Climate Change: Global trends and strategy framework
http://slidepdf.com/reader/full/waste-and-climate-change-global-trends-and-strategy-framework 63/79
57
Christensen, T.H., E. Gentil, A. Boldrin, A.W. Larsen, B.P. Weidema, and M. Hauschild (2009).
C balance, carbon dioxide emissions and global warming potentials in LCA-modelling of waste
management systems . Waste Management & Research: 27: 707-715.
ClimSoil (2008), Review of existing information on the interrelations between soil and climate
change – Final report . European Commission.
Damgaard, A., A.W. Larsen, and T.H. Christensen (2009). Recycling of metals: accounting of
greenhouse gases and global warming contributions. Waste Management & Research: 2009:
27: 773-780.
Dehoust et al (Oko-Institut e.V.) and Vogt and Giegrich (ifeu-Heidelberg GmbH), 2005. Status
Report on the Waste Sector’s Contribution to Climate Protection and Possible Potentials.
Commissioned by the German Federal Environmental Agency, August 2005.
Eunomia Research & Consulting (2002), Economic Analysis of Options for Managing
Biodegradable Municipal Waste – Final Report to the European Commission.
Eunomia Research & Consulting (2008a). Greenhouse Gas Balances of Waste Management Scenarios – Report for the Greater London Authority.
Eunomia Research & Consulting (2008b). Meeting Ireland’s Waste Targets: The Role of MBT –
Final report to Greenstar.
European Communities, 2003. Waste generated and treated in Europe. Data 1990-2001. Office
for Official Publications of the European Communities, Luxembourg.
Eurostat, 2006. Waste Management by treatment. Environmental Data Centre on Waste,
European Commission.
Favoino, E. and Hogg, D. (2008). The potential role of compost in reducing greenhouse gases .Waste Management & Research: 2008: 26: 61-69.
Forster, P., V. Ramaswamy, P. Artaxo, T. Berntsen, R. Betts, D.W. Fahey, J. Haywood, J. Lean,
D.C. Lowe, G. Myhre, J. Nganga, R. Prinn, G. Raga, M. Schulz and R. Van Dorland, 2007:
Changes in Atmospheric Constituents and in Radiative Forcing. In: Climate Change 2007:The
Physical Science Basis. Contribution of Working Group I to the Fourth Assessment Report of
the Intergovernmental Panel on Climate Change [Solomon, S., D. Qin, M. Manning, Z. Chen, M.
Marquis, K.B. Averyt, M.Tignor and H.L. Miller (eds.)]. Cambridge University Press, Cambridge,
United Kingdom and New York, NY, USA.
Fruergaard, T., T. Astrup and T. Ekvall (2009). Energy use and recovery in waste management
and implications for accounting of greenhouse gases and global warming contributions . Waste
Management & Research: 2009: 27: 724-737.
Fuglestvedt, J.S., T.K. Berntsen, O. Godal, R. Sausen, K.P. Shine, and T. Skodvin (2001).
Assessing metrics of climate change: Current methods and future possibilities. Report to
CICERO, December 2001.
Gentil, E., T.H. Christensen, and E. Aoustin (2009). Greenhouse gas accounting and waste
management. Waste Management & Research: 2009: 27: 696-706.
German Federal Ministry for the Environment, Nature Conservation and Nuclear Safety (2008).
Waste management data 2006 - Collection of graphs published. Available online:http://www.bmu.de/english/waste_management/downloads/doc/42826.php .

8/8/2019 Waste and Climate Change: Global trends and strategy framework
http://slidepdf.com/reader/full/waste-and-climate-change-global-trends-and-strategy-framework 64/79
58
Global Alliance of Wastepickers/Recyclers and Allies (2009). Various statements issued at the
15th
Council of Parties meetings, Copenhagen, December 2009. For example, see DAKOFA
COP15 newsletter 17 December 2009.
Harris, S. (2007). The Potential Role of Industrial Symbiosis in Combating Global Warming.
Proceedings of the International Conference on Climate Change, 29-31 May 2007, Hong Kong.
Intergovernmental Panel on Climate Change (IPCC) (2006). 2006 IPCC Guidelines for National
Greenhouse Gas Inventories. Volume 5 Waste. Chapter 3, Solid Waste Disposal.
International Solid Waste Association (ISWA) (2009). Waste and Climate Change – ISWA White
Paper.
Joseph, K. (2007). Lessons from municipal solid waste processing initiatives in India .
Proceedings of the International Symposium MBT 2007.
Kelleher, M. (2007), Anaerobic digestion outlook for MSW streams . BioCycle, August 2007, Vol
48, No. 8, p. 51.
Kim, S. and B.E. Dale (2004). Global potential bioethanol production from wasted crops and
crop residues . Biomass and Bioenergy: 26:4:361-375.
Lacoste, E. and Chalmin, P. (2006). From Waste to Resource –2006 World Waste Survey ,
Economica Editions.
Larsen, A. W., H. Merrild, and T.H. Christensen (2009). Recycling of glass: accounting of
greenhouse gases and global warming contributions. Waste Management & Research: 2009:
27: 754-762.
Manfredi, S., D. Tonini, T.H. Christensen, and H. Scharff (2009). Landfilling of waste:
accounting of greenhouse gases and global warming contributions . Waste Management &Research: 2009: 27: 825-836.
Medina, M. (2008). The informal recycling sector in developing countries – Organising waste
pickers to enhance their impact . Public-Private Infrastructure Advisory Facility, Gridlines, Note
No. 44 – Oct 2008.
Merrild, H., A. Damgaard, T. H. Christensen (2009). Recycling of paper: accounting of
greenhouse gases and global warming contributions . Waste Management & Research: 2009:
27:746-753.
Møller et al (2009). Anaerobic digestion and digestate use: accounting of greenhouse gases
and global warming contribution . Waste Management & Research: 2009: 27: 813-824.
Monni, S., Syri, S. and Savolainen, I., 2004. Uncertainties in the Finnish greenhouse gas
emission inventory. Environmental Science and Policy, 7(2), 87-98.
Monni, S., Pipatti, R., Lehtilla, A., Savolainen, I. and Syri, S., 2006. Global climate change
mitigation scenarios for solid waste management. Technical Research Centre of Finland. VTT
Publications, Espoo.
Norsk Energi (2008). CDM Project Development Manual . Prepared for the Norwegian Ministry
of Foreign Affairs.
OECD, 2005. OECD Environmental data: compendium 2004. Environment and Sustainable
Development, Environmental Performance and Information Division, OECD Environment
Directorate, Working Group on Environmental Information and Outlooks (WGEIO).

8/8/2019 Waste and Climate Change: Global trends and strategy framework
http://slidepdf.com/reader/full/waste-and-climate-change-global-trends-and-strategy-framework 65/79
59
OECD (2008), Inventory of international initiatives related to sustainable materials management
– Working Group on Waste Prevention and Recycling. ENV/EPOC/WGWPR(2007)4/FINAL
Pimenteira C.A.P., A.S. Pereira, L.B. Oliveira, L.P. Rosa, M.M. Reis, and R.M. Henriques
(2004), Energy conservation and CO2 emission reductions due to recycling in Brazil . Waste
Management 24 (2004) 889-897.
PROGNOS (2008). Resource savings and CO 2 reduction potential in waste management in
Europe and its possible contribution to the CO 2 reduction target in 2020 .
Rabl, A., J.V. Spadaro, and A. Zoughaib (2008). Environmental impacts and costs of solid
waste: a comparison of landfill and incineration . Waste Management & Research 2008:26: 147-
162.
Recycled Organics Unit, The University of New South Wales (2006). Life Cycle Inventory and
Life Cycle Assessment for Windrow Composting Systems . Report for the Department of
Environment and Climate Change, NSW.
Royal Melbourne Institute of Technology (RMIT) (2009). Extended Environmental benefits ofRecycling Project.
Scheutz, C., P. Kjeldsen, E. Gentil (2009). Greenhouse gases, radiative forcing, global warming
potential and waste management – an introduction . Waste Management & Research 2009:27:
716-723.
Sharholy, M., K. Ahmad, G. Mahmood, R.C. Trivedi (2008). Municipal solid waste management
in Indian cities – A review . Waste Management 28 (2008) 459-467.
Smith et al (AEA Technology) (2001). Waste Management Options and Climate Change - Final
report to the European Commission, DG Environment; and Dehoust et al (Oko-Institut e.V.)
UNEP, 2009. RIM Background Paper for Consultations, 3rd
Draft – October 2009.
UN ESCAP (2009), Economic and Social Survey of Asia and the Pacific 2009 - Addressing
Triple Threats to Development.
UNFCCC 1992 (FCCC/INFORMAL/84 GE.05-62220 (E) 200705)
UNFCCC Decision 1/CP.13
US Environmental Protection Agency (US EPA), 2006a. Global Anthropogenic Non-CO2
Greenhouse Gas Emissions: 1990-2020. U.S. Environmental Protection Agency, Office of
Atmospheric Programs, Climate Change Division.
US Environmental Protection Agency (US EPA), 2006b. Solid Waste Management and
Greenhouse Gases - A Life-Cycle Assessment of Emissions and Sinks, 3rd
Edition; September
2006.
US EPA (2009), Opportunities to Reduce Greenhouse Gas Emissions through Materials and
Land Management Practices , September 2009.
World Bank (2005), Waste Management in China: Issues and Recommendations . Urban
Development Working Papers, East Asia Infrastructure Department, Working Paper No.9, May
2005.

8/8/2019 Waste and Climate Change: Global trends and strategy framework
http://slidepdf.com/reader/full/waste-and-climate-change-global-trends-and-strategy-framework 66/79
60
WRAP (2006), ENVIRONMENTAL BENEFITS OF RECYCLING - An international review of life
cycle comparisons for key materials in the UK recycling sector.
WRAP (2008), CO 2 impacts of transporting the UK’s recovered paper and plastic bottles to
China . August 2008.
WSN Environmental Solutions and Hyder Consulting PTY Ltd (2007). A WSN technical paper:
information about waste issues for decision makers in local government.
Yadav, D. (2009). Garbage disposal plant mired in controversy . India Times, TNN, 19 Feb 2009.

8/8/2019 Waste and Climate Change: Global trends and strategy framework
http://slidepdf.com/reader/full/waste-and-climate-change-global-trends-and-strategy-framework 67/79

8/8/2019 Waste and Climate Change: Global trends and strategy framework
http://slidepdf.com/reader/full/waste-and-climate-change-global-trends-and-strategy-framework 68/79
62

8/8/2019 Waste and Climate Change: Global trends and strategy framework
http://slidepdf.com/reader/full/waste-and-climate-change-global-trends-and-strategy-framework 69/79
63

8/8/2019 Waste and Climate Change: Global trends and strategy framework
http://slidepdf.com/reader/full/waste-and-climate-change-global-trends-and-strategy-framework 70/79
64
Appendix B – Bali Declaration
Bali declaration on waste management for human health and
livelihoodWe, the Ministers and other heads of delegation from the Parties to the Basel
Convention and from other States,
Having met in Bali, Indonesia, from 23 to 27 June 2008, on the occasion of the
ninth meeting of the Conference of the Parties to the Basel Convention on the Control of the
Transboundary Movement of Hazardous Wastes and Their Disposal, and in particular during
the World Forum on Waste Management for Human Health and Livelihood,
Mindful that the conditions of life on our planet are threatened and that the challenge for
Governments, civil society and the private sector is to protect and improve the environment
and human health and livelihood for present and future generations,
Declare that:
1. We reaffirm our commitment to the principles and purposes of the Basel
Convention adopted on 22 March 1989, including the fundamental objective to protect, by strict
control, human health and the environment against the adverse effects resulting from the
generation, transboundary movement and management of hazardous wastes and other
wastes, in a spirit of solidarity and partnership and are willing to contribute to a new
momentum to achieve the Convention’s objectives;
2. We also reaffirm our commitment to sustainable development, including those
principles set out in Agenda 21, including chapters 20 and 21, as agreed upon at the United
Nations Conference on Environment and Development in 1992;
3. We further reaffirm our commitment to the Johannesburg Declaration on
Sustainable Development and the Johannesburg Plan for Implementation, which aimed to
advance and strengthen the interdependent and mutually reinforcing pillars of sustainable
development – economic development, social progress and environmental protection – at the
local, national, regional and global levels;
4. We are convinced that full and effective action to implement the Basel Convention
will contribute to the achievement of sustainable development, notably internationally agreed
development goals, including those contained in the United Nations Millennium Declaration,
through waste prevention and minimization, the control of transboundary movements of
hazardous wastes and safe and environmentally sound management of waste. In this way,
progress can be made in the area of poverty eradication, health, education, gender equality,
environmental sustainability and the global partnership for development;
5. We are fully aware that waste, if not managed in a safe and environmentally sound
manner, may have serious consequences for the environment, human health and sustainable
livelihood, and therefore we reaffirm our commitment to preventing the illegal transboundary
movement of hazardous wastes, to minimizing the generation of hazardous wastes and to
promoting the safe and environmentally sound management of waste within each country;
6. We are convinced that if those actions are taken, there is high potential to improve
the health and livelihood of all citizens and to provide economic opportunities through the safe
and efficient reduction, re-use, recycling, recovery, treatment and disposal of waste. We
believe that we could help to realize such potential benefits by encouraging the incorporation
of sound waste management in development and sustainability strategies and throughstrengthened cooperation at all levels;

8/8/2019 Waste and Climate Change: Global trends and strategy framework
http://slidepdf.com/reader/full/waste-and-climate-change-global-trends-and-strategy-framework 71/79
65
7. We will further promote international, regional and inter-agency cooperation,
coordination and planning, including among the Basel Convention, the Rotterdam Convention
on the Prior Informed Consent Procedure for Certain Hazardous Chemicals and Pesticides in
International Trade and the Stockholm Convention on Persistent Organic Pollutants, to
facilitate capacity-building, information sharing and technology transfer in tackling hazardous
waste issues, including through the implementation of the Bali Strategic Plan for Technology
Support and Capacity-building;
8. We note that resource mobilization is an important task to be undertaken for
achieving the objectives of the Basel Convention. In this context, as set out in decision VIII/34
on resource mobilization and sustainable financing, in particular its paragraph 5, which takes
into account the co-benefits between the environmentally sound management of waste and
climate protection, we encourage raising of such resources, including from the flexible
mechanism under the United Nations Framework Convention on Climate Change and its
Kyoto Protocol;
9. We call upon international and regional partners to support and enhance the
implementation of the Basel Convention at the bilateral, regional and global levels by providing
adequate resources and assistance for the safe and environmentally sound management of
hazardous and other wastes and we believe that a public-private partnership approach couldbe an important way to advance activities for the environmentally sound management of
waste. In this context, we also recall the importance of the role played by the Basel Convention
regional centres in enhancing the implementation of the Convention and the need to support
the building of their capacity to improve their effectiveness;
10. We encourage the following actions by Parties and by relevant public and private
organizations, including international and regional organizations and programmes, to:
(a) Promote awareness-raising of the link between waste management, health andlivelihood and the environment;
(b) Strengthen subregional and regional cooperation on waste and health issues bypromoting national, regional and international human and appropriate technical capacities;
(c) Improve waste shipment and border controls to prevent illegal movements ofhazardous and other wastes, including through capacity-building, technology transfer andtechnical assistance;
(d) Improve cooperation between national authorities in the waste, chemicals andhealth sectors and, in collaboration with other relevant authorities and stakeholders, in thedevelopment and implementation of effective and sound waste management systems;
(e) Increase capacity-building and promote and, where possible, enhance, public andprivate investment for the transfer and use of appropriate technology for the safe andenvironmentally sound management of waste;
11. We invite the World Health Assembly to consider a resolution related to the improvement
of health through safe and environmentally sound waste management.
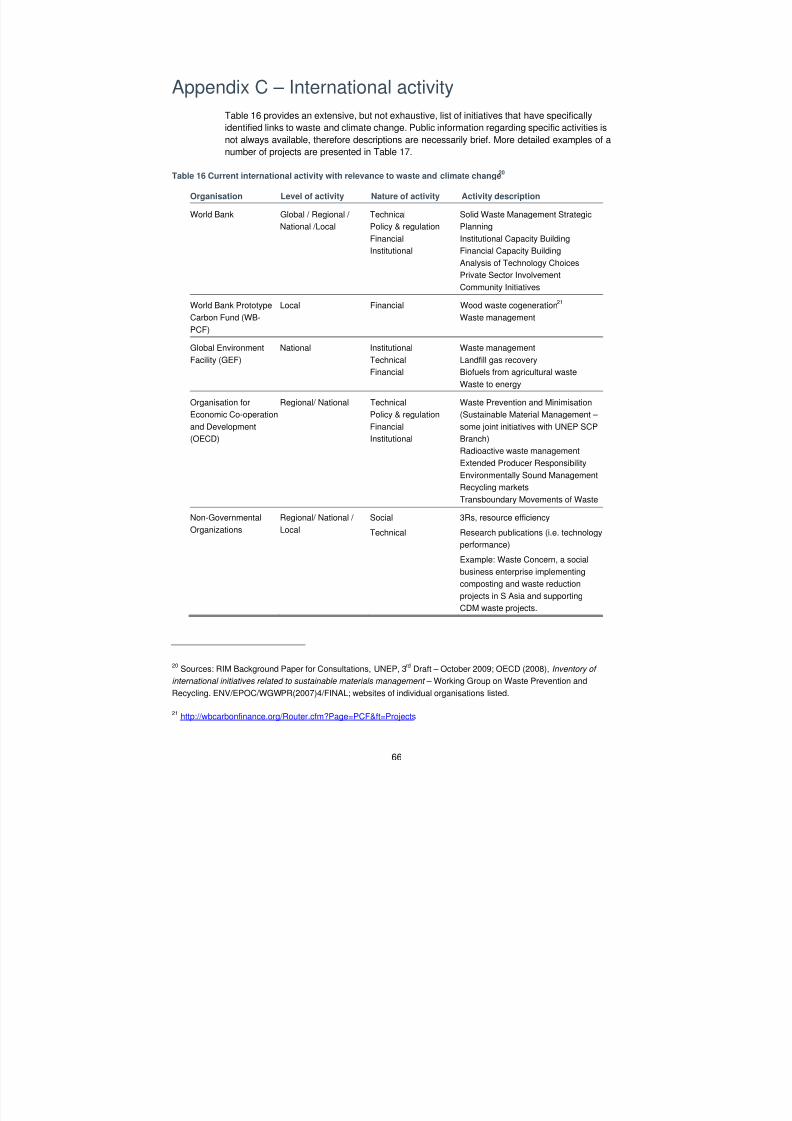
8/8/2019 Waste and Climate Change: Global trends and strategy framework
http://slidepdf.com/reader/full/waste-and-climate-change-global-trends-and-strategy-framework 72/79
66
Appendix C – International activity
Table 16 provides an extensive, but not exhaustive, list of initiatives that have specifically
identified links to waste and climate change. Public information regarding specific activities is
not always available, therefore descriptions are necessarily brief. More detailed examples of anumber of projects are presented in Table 17.
Table 16 Current international activity with relevance to waste and climate change20
Organisation Level of activity Nature of activity Activity description
World Bank Global / Regional /
National /Local
Technical
Policy & regulation
Financial
Institutional
Solid Waste Management Strategic
Planning
Institutional Capacity Building
Financial Capacity Building
Analysis of Technology Choices
Private Sector InvolvementCommunity Initiatives
World Bank Prototype
Carbon Fund (WB-
PCF)
Local Financial Wood waste cogeneration21
Waste management
Global Environment
Facility (GEF)
National Institutional
Technical
Financial
Waste management
Landfill gas recovery
Biofuels from agricultural waste
Waste to energy
Organisation for
Economic Co-operationand Development
(OECD)
Regional/ National Technical
Policy & regulationFinancial
Institutional
Waste Prevention and Minimisation
(Sustainable Material Management – some joint initiatives with UNEP SCP
Branch)
Radioactive waste management
Extended Producer Responsibility
Environmentally Sound Management
Recycling markets
Transboundary Movements of Waste
Non-Governmental
Organizations
Regional/ National /
Local
Social
Technical
3Rs, resource efficiency
Research publications (i.e. technology
performance)
Example: Waste Concern, a social
business enterprise implementing
composting and waste reduction
projects in S Asia and supporting
CDM waste projects.
20Sources: RIM Background Paper for Consultations, UNEP, 3
rdDraft – October 2009; OECD (2008), Inventory of
international initiatives related to sustainable materials management – Working Group on Waste Prevention and
Recycling. ENV/EPOC/WGWPR(2007)4/FINAL; websites of individual organisations listed.
21 http://wbcarbonfinance.org/Router.cfm?Page=PCF&ft=Projects

8/8/2019 Waste and Climate Change: Global trends and strategy framework
http://slidepdf.com/reader/full/waste-and-climate-change-global-trends-and-strategy-framework 73/79
67
Organisation Level of activity Nature of activity Activity description
Asian Development
Bank (ADB)
Regional Technical
Financial
Policy & regulation
Institutional
Social
Grants, loans and technical
assistance for (eg)22
:
Utilisation of agricultural waste
Recycling of coal waste
Hazardous waste management/
treatment
Capacity building/ training
Inter-American
Development Bank
(IADB)
Regional Financial Loans, grants, guarantees and
investments for23
:
Sanitation
Solid waste management
World Business Council
for Sustainable
Development (WBCSD)
International (national
branches)
Institutional
Technical
Eco-efficiency programme
Northern Alliance for
Sustainability (ANPED)
Regional Institutional
Technical
Sustainable Production and
Consumption Working Group
European Commission Regional Policy & regulation
Institutional
Various directives, thematic
strategies, and policy, eg: WEEE,
Waste prevention and recycling, End-
of-life vehicles
The Group of Eight
(G8)
Global Institutional
Policy & regulation
Promotion of 3Rs (reduce, reuse,
recycle) and climate change
abatement through global exchange of
information and experience.
International Climate
Initiative (ICI)
National Technical Waste treatment
Waste to energy
Methane to Markets
Partnership
Global Technical
Policy & regulation
International public-private initiative
that advances methane recovery from
sectors, including landfills.
UN Agencies (in addition to UNEP)
Secretariat of the Basel
Convention (SBS)
Global / Regional /
National
Technical
Policy & regulation
Institutional
Social
E-Waste management in SE Asia
National plans for hazardous waste
management (POPs)
UNFCCC Global / local Technical Clean Development Mechanism
(CDM) and Joint Implementation (JI) –
LFG capture, AD, composting
22 http://www.adb.org/projects/summaries.asp?browse=1&type=&query=waste
23
http://www.iadb.org/projects/searchDocs.cfm?keyword=waste&IDBOperation=&dept=&Country=&docType=&subregion=&Topic=WASA&fromMonth=&fromYear=&toMonth=&toYear=&projDocLang=&orderby=IDBIDOLSORTDATE&sort=rever
sealphabetical&recsPage=10&lang=en

8/8/2019 Waste and Climate Change: Global trends and strategy framework
http://slidepdf.com/reader/full/waste-and-climate-change-global-trends-and-strategy-framework 74/79
68
Organisation Level of activity Nature of activity Activity description
United Nations
Department of
Economic and Social
Affairs
(UN DESA)
Global Institutional Sustainable Consumption and
Production (i.e. the Marrakech
Process)
United Nations
Industrial Development
Organization (UNIDO)
Global / Regional /
National / Local
Technical
Policy & regulation
Institutional
Reuse of computer equipment in
Africa
Product and Market Development for
Sisal and Henequen
Capacity building
Energy and the Environment
International Maritime
Organisation (IMO)
Global Policy & regulation Waste management in developing
coastal countries
Specific Waste Assessment Guidance
Ship Recycling Convention
Economic and Social
Commission for Asia
and the Pacific
(UN ESCAP)
Regional / National /
Local
Technical
Policy & regulation
Institutional
Social
Financial
Sustainable waste management in
small cities
CITYNET
UN Centre for Regional
Development
(UN CRD)
Regional / Local Policy & regulation
Institutional
Social
Sustainable Production and
Consumption / 3R (Reduce, Reuse &
Recycle) project
UN Habitat Regional / National /
Local
Technical
Policy & regulation
Institutional
Waste management24
Strategy development
Capacity buildingPipeline projects
United Nations
Development
Programme (UNDP)
Regional / National /
Local
Technical
Policy & regulation
Institutional
Social
Training25
Capacity building
Sustainable waste management
Waste management strategy
United Nations
Economic and Social
Council (UNESC)
Regional / National Social Education/ Capacity building
workshops
Advisory services on policy
Food and Agriculture
Organisation (FAO)
Regional / National Technical
Policy & regulation
Bioenergy from agricultural waste26
(CDM support)
Table 17 presents examples of specific waste and climate change projects, initiated by a
number of international organisations. The majority of these projects involve energy and waste,
24http://www.unhabitat.org/list.asp?typeid=13&catid=514
25
http://webapps01.un.org/dsd/scp/public/searchProgrammesByKeyword.do?searchLine=solid+waste+management
26http://www.fao.org/bioenergy/54838/en/

8/8/2019 Waste and Climate Change: Global trends and strategy framework
http://slidepdf.com/reader/full/waste-and-climate-change-global-trends-and-strategy-framework 75/79
69
either replacing conventional fuels with waste materials (i.e. biomass waste) for heat and power
generation, or recovering landfill gas for energy generation. This appears to be a general trend
where international organisations offer assistance at a technical level, and may also be
influenced by the CDM (see section below).
Table 17 Examples of specific projects initiated by international organisations
Project description CountryAgency /Mechanism
Waste treatment centres in the Marga-Marga region Chile ICI
Biomass, Human and Animal Waste Treatment and Bioenergy
Generation
St. Vincent and the
GrenadinesICI
Support for the Brazilian government in governing and implementing a
refrigerator recycling programme and setting up a sample installationBrazil ICI
Integrated Approach to Wood Waste Combustion for Heat Production Poland GEF
Obtaining Biofuels and Non-wood Cellulose Fiber from Agricultural
Residues/Waste Peru GEF
Economic and Cost-effective Use of Wood Waste for Municipal Heating
SystemsLatvia GEF
Solid Waste Management and Landfill Gas Recovery Latvia GEF
Reduction of Methane Emissions and Utilization of Municipal Waste for
Energy in AmmanJordan GEF
Promoting Methane Recovery and Utilization from Mixed Municipal
WasteChina GEF
Year of action against waste (SCP initiative) Pacific Island states UNEP

8/8/2019 Waste and Climate Change: Global trends and strategy framework
http://slidepdf.com/reader/full/waste-and-climate-change-global-trends-and-strategy-framework 76/79
70
Appendix D – CDM waste projects
Examples of recent CDM projects: waste handling and disposal27
Project title Host Country “Donor” country(ies) Emissionsreductions
(t CO2-e per
year)
Methane capture and destruction on Las Heras landfill in
Mendoza, ArgentinaArgentina France 30599
AESA Misiones (Proactiva Group) Sanitary Landfill Gas
capture and flaring projectArgentina
Spain
France37236
Lusakert Biogas Plant (LBP), methane capture and combustion
from poultry manure treatmentArmenia Denmark 62832
Anaconda Landfill Gas Project Brazil Switzerland 120423
AWMS Methane Recovery Project BR06-S-28, Santa Catarina,
BrazilBrazil
Switzerland
United Kingdom of
Great Britain and
Northern Ireland
4228
GEEA Biomass 5 MW Power Plant Project Brazil Japan 19486
Regional landfill projects in Chile Chile France 70299
Municipal Solid Waste (MSW) Composting Project in Urumqi,
ChinaChina Germany 16065
Taiyuan Xingou Landfill Gas Recovery and Utilization Project China Switzerland 43419
Composting of organic waste in Wuzhou China Germany 41880
Shenyang Laohuchong LFG Power Generation Project China Italy 136570
Fedepalma sectoral CDM umbrella project for methane
capture, fossil fuel displacement and cogeneration of
renewable energy
Colombia 757067
Co-composting of EFB and POME project Guatemala 22940
3.66 MW poultry litter based power generation project by Raus
Power in IndiaIndia Switzerland 51353
Upgradation, Operation and Maintenance of 200 TPD
Composting facility at Okhla, DelhiIndia Germany 33461
3 MW Poultry Litter Based Power Generation Project,
HyderabadIndia
United Kingdom of
Great Britain and
Northern Ireland
65794
Gikoko-Bekasi-LFG Flaring Project Indonesia Netherlands 69987
Talia Landfill Gas Recovery Project and Electricity Production Israel Austria 73640
27 http://cdm.unfccc.int/Projects/projsearch.html

8/8/2019 Waste and Climate Change: Global trends and strategy framework
http://slidepdf.com/reader/full/waste-and-climate-change-global-trends-and-strategy-framework 77/79
71
Project title Host Country “Donor” country(ies) Emissions
reductions
(t CO2-e per
year)
Composting of solid biomass waste separated from the Palm
Oil Mill Effluent (POME) through the use of AVC Sludge
Dewatering System at Tanjung Panjang Palm Oil Mill Sdn.
Bhd.
Malaysia
United Kingdom of
Great Britain andNorthern Ireland
31058
Tecamac – EcoMethane Landfill Gas to Energy Project Mexico
United Kingdom of
Great Britain and
Northern Ireland
57196
Ecatepec – EcoMethane Landfill Gas to Energy Project Mexico
United Kingdom of
Great Britain and
Northern Ireland
209253
OULJA Landfill gas recovery and flaring Morocco 32481
Ancon – EcoMethane Landfill Gas Project PeruUnited Kingdom ofGreat Britain and
Northern Ireland
69012
Quezon City Controlled Disposal Facility Biogas Emission
Reduction ProjectPhilippines Italy 116339
Sudokwon Landfill Gas Electricity Generation Project (50MW) Republic of Korea 1210342
EnviroServ Chloorkop Landfill Gas Recovery Project South Africa Japan 188390
Cassava Waste To Energy Project, Kalasin, Thailand (CWTE
project)Thailand Japan 87586
Landfill Gas Recovery and Flaring for 9 bundled landfills inTunisia
Tunisia Italy 317909
Landfill gas recovery and electricity generation at “Mtoni
Dumpsite”, Dar Es Salaam, Tanzania
United Republic
of Tanzania202271
Montevideo Landfill Gas Capture and Flare Project Uruguay Spain 201790
8/8/2019 Waste and Climate Change: Global trends and strategy framework
http://slidepdf.com/reader/full/waste-and-climate-change-global-trends-and-strategy-framework 78/79
About the UNEP Division o Technology,
Industry and Economics
The UNEP Division o Technology, Industry and Economics (DTIE) helps
governments, local authorities and decision-makers in business and
industry to develop and implement policies and practices ocusing on
sustainable development.
The Division works to promote:
> sustainable consumption and production,
> the efcient use o renewable energy,
> adequate management o chemicals,
> the integration o environmental costs in development policies.
The Ofce o the Director, located in Paris, coordinates activities
through:
> The International Environmental Technology Centre - IETC (Osaka and
Shiga), which implements integrated waste, water and disaster management
programmes, ocusing in particular on Asia.
> Sustainable Consumption and Production (Paris), which promotes sustainable
consumption and production patterns as a contribution to human development
through global markets.
> Chemicals (Geneva), which catalyzes global actions to bring about the sound
management o chemicals and the improvement o chemical saety worldwide.
> Energy (Paris and Nairobi), which osters energy and transport policies or
sustainable development and encourages investment in renewable energy and
energy efciency.
> OzonAction (Paris), which supports the phase-out o ozone depleting substances
in developing countries and countries with economies in transition to ensure
implementation o the Montreal Protocol.
> Economics and Trade (Geneva), which helps countries to integrate environmental
considerations into economic and trade policies, and works with the fnance sector
to incorporate sustainable development policies.
UNEP DTIE activities focus on raising awareness,
improving the transfer of knowledge and information,
fostering technological cooperation and partnerships, and
implementing international conventions and agreements.
For more inormation,see www.unep.r

8/8/2019 Waste and Climate Change: Global trends and strategy framework
http://slidepdf.com/reader/full/waste-and-climate-change-global-trends-and-strategy-framework 79/79
The Governing Council o the United Nations Environment
Programme (UNEP) has directed its International Environmental
Technology Centre (IETC) branch to take action in the area o
waste management. There are substantial co-benefts o waste
management in the context o climate change. As a frst step to
realize these co-benefts, this paper seeks (a) to examine the potential
o climate impacts and benefts o dierent waste management
activities, and (b) to present a UNEP-lead ramework strategy to
assist member countries in prioritising their resources and eorts or
waste management and climate change mitigation. The ramework
strategy is intended to align with the internationally recognisedwaste management hierarchy, in which waste prevention receives
the highest priority, to optimise the co-benefts or climate change
mitigation.
UNEP DTIE
International Environmental
Technology Centre (IETC)
Osaka Ofce
2-110 Ryokuchi Koen, Tsurumi-kuOsaka 538-0036, Japan
Tel: +81 6 6915 4581
Fax: +81 6 6915 0304
Shiga Ofce
1091 Oroshimo-cho, Kusatsu City
Shiga 525-0001, Japan
Tel: +81 77 568 4581
Fax: +81 77 568 4587
E-mail: [email protected]
URL IETC: http://www.unep.or.jp/