Washoe County Consensus Forecast Tables - TMRPA WC Consensus Forecast 2014... · Truckee Meadows...
61
Washoe County Consensus Forecast 2014 - 2034 September 2014
Transcript of Washoe County Consensus Forecast Tables - TMRPA WC Consensus Forecast 2014... · Truckee Meadows...

Washoe County Consensus Forecast
2014 - 2034
September 2014

Truckee Meadows Regional Planning September 2014
WASHOE COUNTY CONSENSUS FORECAST 2014-2034 Page ii
Acknowledgments
Regional Planning Governing Board
Ed Lawson, Chair (Sparks City Council)
Dwight Dortch, Vice-Chair (Reno City Council)
Marsha Berkbigler (Washoe County Commission)
Jenny Brekhus (Reno City Council)
Mike Carrigan (Sparks City Council)
Robert A. Cashell (Reno City Council)
Oscar Delgado (Reno City Council)
Vaughn Hartung (Washoe County Commission)
Geno Martini (Sparks City Council)
Bonnie Weber (Washoe County Commission)
Dave Aiazzi , Liaison (Washoe County School District Board of Trustees)
Regional Planning Commission
Roger Edwards, Chair (Washoe County)
Doug Voelz, Vice-Chair (Sparks)
Roy Hibdon (Washoe County)
Tom Lean (Sparks)
Art Sperber (Sparks)
Dagny Stapleton (Reno)
Kevin Weiske (Reno)
D.J. Whittemore (Washoe County)
Jason Woosley (Reno)

Truckee Meadows Regional Planning September 2014
WASHOE COUNTY CONSENSUS FORECAST 2014-2034 Page iii
Truckee Meadows Regional Planning Project Staff
Kimberly H. Robinson, Executive Director
Sienna Reid, Senior Planner
Jeremy M. Smith, GIS Coordinator
Participating Agencies/Commissions
Truckee Meadows Regional Planning Agency
City of Reno
City of Sparks
Northern Nevada Water Planning Commission
Regional Transportation Commission of Washoe County
Truckee Meadows Water Authority
Washoe County
Washoe County School District
Western Regional Water Commission
Thanks To
Chad Giesinger, AICP, Senior Planner, Washoe County
Nathan Gilbert, Associate Planner, City of Reno
Armando Ornelas, City Planner, City of Sparks
Jim Rundle, Senior Planner, City of Sparks
Jim Smitherman, Northern Nevada Water Planning Commission
Fred Turnier, AICP, Director of Community Development, City of Reno
Bill Whitney, Division Director, Community Services Department, Washoe County
Truckee Meadows Regional Planning September 2014
WASHOE COUNTY CONSENSUS FORECAST 2014-2034 Page iv
Contents
Page
Acknowledgments ................................................................................................................ ii
Introduction ................................................................................................................................. 1
Population .................................................................................................................................... 4
Employment ................................................................................................................................. 10
Income ......................................................................................................................................... 14
Jurisdictional Splits ....................................................................................................................... 18
Appendix A - “Consensus Forecasts in Planning” ........................................................................ 21
Appendix B – Global Insight Forecast Methodology .................................................................... 27
Appendix C - Woods and Poole Forecast Methodology .............................................................. 43
Appendix D - Nevada State Demographer’s Forecast Methodology ........................................... 47
Appendix E - Truckee Meadows Water Authority Methodology ................................................. 49
Appendix F – Calibration of Global Insight Employment Forecast …………………………………………… 54
List of Tables
1. Washoe County Consensus Forecast Summary .................................................................... 1
2. The 2008 Nevada State Demographer’s Forecast of Washoe County Population ................ 2
3. Population by Forecast Source .............................................................................................. 4
4. Washoe County Population (Consensus Forecast), 2014 – 2034 .......................................... 5
5. Population and Percent Composition of Total Population by Generalized Age Groups ....... 7
6. Consensus Population Forecast by 5-year Age Cohort, 2014 – 2034 .................................... 8
7. Employment and Percent Composition of Total Establishment-Based Employment by
Industry Group ....................................................................................................................... 10
8. Washoe County Establishment-Based Employment 2014 – 2034 ........................................ 12
9. Washoe County Total Personal Income, 2014 – 2034 ........................................................... 14
10. Washoe County Per Capita Personal Income, 2014 – 2034 .................................................. 16

Truckee Meadows Regional Planning September 2014
WASHOE COUNTY CONSENSUS FORECAST 2014-2034 Page v
11. 2013 Governor’s Certified Population Estimates .................................................................. 18
12. 2013 Jurisdictional Percent of Total Population .................................................................... 18
13. Growth Increment Allocation ................................................................................................ 19
14. 2034 Jurisdictional Distribution of Population (of remaining growth increment) ................ 20
15. Year 2034 Jurisdiction Forecasts ........................................................................................... 20

Truckee Meadows Regional Planning September 2014
WASHOE COUNTY CONSENSUS FORECAST 2014-2034 Page vi
This page intentionally left blank.

Truckee Meadows Regional Planning September 2014
WASHOE COUNTY CONSENSUS FORECAST 2014-2034 Page 1
Introduction
The Consensus Forecast for Washoe County uses a number of leading forecasts, which has several
advantages over using a single source for forecasting population. Not only does the consensus approach
minimize the risk of large forecast errors, but consensus forecasts consistently outperform individual
forecasts across a range of variables. The consensus approach is discussed in further detail in the article
titled “Consensus Forecasts in Planning,” found in Appendix A.
Four reputable sources of long-term forecasts for Washoe County were used: Global Insight, a national
forecasting firm in Massachusetts that prepares national, state and county forecasts; Woods and Poole,
a national forecasting firm in Washington, DC, that forecasts for every county in the United States, as
well as state and national forecasts; Truckee Meadows Water Authority’s Population and Employment
Econometric Model; and the 2013 Nevada State Demographer’s Forecast.
The Washoe County Consensus Forecast 2014-2034, uses these sources and outlines the projected
population, employment and income for Washoe County through the year 2034. The forecasts in this
document are for all of Washoe County (Reno MSA) including both the cities of Reno and Sparks and the
unincorporated areas of Washoe County, including Incline Village. A summary of the consensus forecast
for Washoe County is shown in Table 1.
Table 1
Washoe County Consensus Forecast Summary
Year Total
Population Total
Employment
Total Personal
Income (2005 $)*
Per Capita Income
(2014 $)*
2014
2019
2024
2029
2034
442,123
472,380
503,140
533,507
563,779
257,759
282,822
300,020
319,241
339,306
$18,283,556,500
$22,514,000,500
$27,372,417,000
$33,436,848,500
$41,186,329,000
$44,726
$53,743
$64,468
$78,659
$98,096
*Note: Total Personal Income is reported in 2005 dollars to control for inflation and allow comparison across the 20-year
planning timeframe. Per Capita Income is reported in 2014 dollars for this summary table only.

Truckee Meadows Regional Planning September 2014
WASHOE COUNTY CONSENSUS FORECAST 2014-2034 Page 2
The population forecasts prepared by Global Insight, Truckee Meadows Water Authority, Woods and
Poole, and the 2013 Nevada State Demographer’s Forecast were compared for consistency and then
averaged to arrive at a consensus number. When comparable numbers were not available from each of
the four sources, only the numbers that were comparable were averaged. When less than four sources
were used, it is noted in the text. Only Woods and Poole and Global Insight provided data for Total
Establishment-Based Employment, Total Personal Income, and Per Capita Income.
Table 2
The 2013 Nevada State Demographer’s Forecast of Washoe County Population
(2014 – 2034)
Year Population
2014 434,853
2015 439,283
2016 444,495
2017 450,363
2018 456,556
2019 462,924
2020 469,422
2021 475,968
2022 482,563
2023 489,213
2024 495,878
2025 502,559
2026 509,216
2027 515,823
2028 522,349
2029 528,821

Truckee Meadows Regional Planning September 2014
WASHOE COUNTY CONSENSUS FORECAST 2014-2034 Page 3
2030 535,216
2031 541,541
2032 547,775
2033* 554,053
2034* 560,331
Source: Nevada State Demographer.
*Note: The Nevada State Demographer’s Forecast is only projected to the year 2032. Therefore, to match the forecast horizon
of the other sources, the last two years of the forecast depicted above were extrapolated. The number of new persons
added for each year from 2014 to 2032 was averaged (6278) and applied to this existing forecast in order to extend
the population figures from 2033 through 2034.
This space intentionally blank

Truckee Meadows Regional Planning September 2014
WASHOE COUNTY CONSENSUS FORECAST 2014-2034 Page 4
Population
Total population in Washoe County is projected to grow from 442,123 in 2014 to 563,777 in 2034. This
represents an average annual growth rate of 1.22 percent. The highest forecasted population for 2034
was 609,325 from Woods and Poole, and the lowest forecasted population was 528,509 from Global
Insight. The 2014 and 2034 forecasted population by each source is shown in Table 3. The consensus
population forecast for each year is shown in Table 4.
Table 3
Population by Forecast Source
Forecast Source 2014 Forecast
Population 2034 Population
Global Insight 441,350 528,509
Truckee Meadows Water Authority
(TMWA) 442,961 556,952
Woods and Poole 449,326 609,325
2013 State Demographer’s Forecast 434,853 560,331*
Consensus Forecast (Four Sources) 442,123 563,779
Source: Global Insight, Woods and Poole, 2013 State Demographer’s Forecast, and TMWA.
*Note: The Nevada State Demographer Forecast is only projected to the year 2032. Therefore, to match the forecast horizon
of the other sources, the last two years of this forecast was extrapolated. The number of new persons added for each
year from 2014 to 2032 were averaged and applied to the existing forecast in order to extend the population figures
to 2034.
This space intentionally blank

Truckee Meadows Regional Planning September 2014
WASHOE COUNTY CONSENSUS FORECAST 2014-2034 Page 5
Table 4
Washoe County Population (Consensus Forecast), 2014 – 2034
Year Population
2014 442,123
2015 447,906
2016 453,853
2017 459,978
2018 466,116
2019 472,380
2020 478,639
2021 485,001
2022 491,077
2023 497,176
2024 503,140
2025 509,228
2026 515,222
2027 521,342
2028 527,439
2029 533,507
2030 539,570
2031 545,627
2032 551,655
2033* 557,670
2034* 563,779
Source: Global Insight, Woods and Poole, TMWA, and 2013 State Demographer’s Forecast.
*Note: The Nevada State Demographer Forecast is only projected to the year 2032. Therefore, to match the forecast horizon
of the other sources, the last two years of this forecast were extrapolated. The number of new persons added for each
year from 2014 to 2032 were averaged and applied to the existing forecasts in order to extend the population figures
to 2034.
Truckee Meadows Regional Planning September 2014
WASHOE COUNTY CONSENSUS FORECAST 2014-2034 Page 6
The age distribution of the population is expected to shift over the next two decades, primarily in the
working and retired age groups (Table 5). Changes of note include the continued aging of the baby
boomer population, a decrease in the working group (ages 20-64) and a marked increase in the retired
group (ages 65 and older). The percentage of population in the preschool (ages under 5) and school
(ages 5-19) groups will remain relatively flat with only slight growth (.1%) or slight decline (.1%),
respectively. Population by cohort data is available from Global Insight and Woods and Poole, however,
this data is not available from TMWA or the 2013 State Demographer’s Forecast. Population by 5-year
Age Cohort for 2014 - 2034 is shown in Table 6 on pages 8-9.
This space intentionally blank

Truckee Meadows Regional Planning September 2014
WASHOE COUNTY CONSENSUS FORECAST 2014-2034 Page 7
Table 5
Population and Percent Composition of Total Population by Generalized Age Groups
Generalized Age Group
2014 2034
Population Percent of
Total
Population Percent of
Total
Preschool (Ages 0-4) 28,399 6.4% 36,887 6.5%
School (Ages 5-19) 86,825 19.5% 110,279 19.4%
Working (Ages 20-64) 267,918 60.2% 318,545 56.0%
Retired (Ages 65 and
older)
62,201 14.0% 103,209 18.1%
Totals* 445,343 100% 568,920 100%
Source: Global Insight, and Woods and Poole.
Note: *Population by cohort is not available from Truckee Meadows Water Authority or the 2013 State Demographer’s
Forecast
This space intentionally blank

Truckee Meadows Regional Planning September 2014
WASHOE COUNTY CONSENSUS FORECAST 2014-2034 Page 8
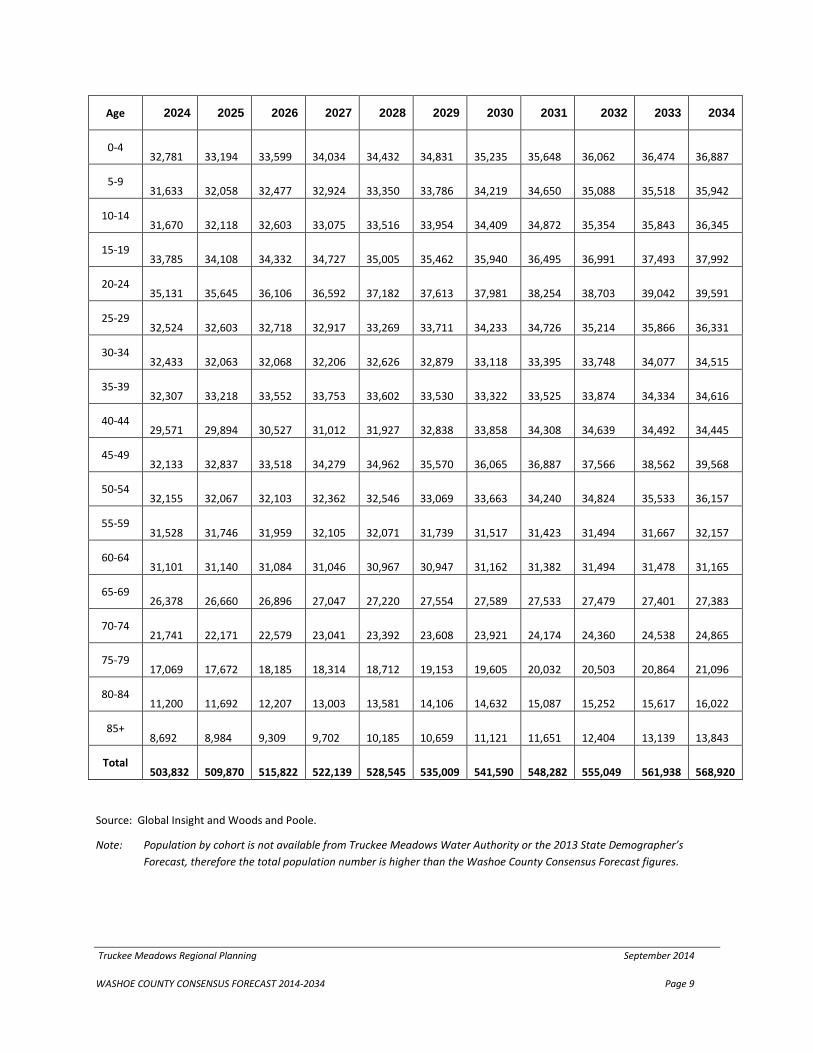
Table 6
Consensus Population Forecast by 5-year Age Cohort, 2014 – 2034
Age 2014 2015 2016 2017 2018 2019 2020 2021 2022 2023
0-4 28,399 28,806 29,259 29,720 30,189 30,646 31,090 31,539 31,952 32,372
5-9 28,423 28,569 28,657 28,904 29,110 29,507 29,923 30,403 30,816 31,235
10-14 28,362 28,755 29,115 29,464 29,908 30,218 30,496 30,701 31,017 31,272
15-19 30,040 30,277 30,535 30,866 31,179 31,606 32,072 32,532 32,926 33,441
20-24 32,882 32,596 32,668 32,911 33,268 33,510 33,725 34,007 34,362 34,705
25-29 31,212 32,105 32,472 32,683 32,436 32,258 31,939 31,994 32,159 32,442
30-34 29,077 29,252 29,745 30,140 30,849 31,594 32,449 32,786 32,960 32,666
35-39 26,756 27,278 27,754 28,227 28,786 29,254 29,594 30,247 30,728 31,525
40-44 27,694 27,254 26,970 26,885 26,916 27,301 27,746 28,188 28,609 29,147
45-49 30,627 30,877 31,127 31,306 31,358 31,147 31,033 31,058 31,230 31,524
50-54 31,564 31,589 31,517 31,462 31,412 31,452 31,746 32,072 32,282 32,376
55-59 30,534 30,878 31,142 31,313 31,476 31,827 31,849 31,781 31,681 31,577
60-64 27,572 28,055 28,525 29,064 29,459 29,711 30,071 30,380 30,569 30,746
65-69 22,552 23,203 23,723 23,743 24,072 24,494 24,938 25,379 25,851 26,193
70-74 15,851 16,561 17,274 18,355 19,071 19,711 20,353 20,903 20,972 21,332
75-79 10,462 11,018 11,668 12,265 12,976 13,660 14,255 14,883 15,839 16,490
80-84 6,917 7,176 7,455 7,845 8,256 8,663 9,108 9,622 10,087 10,656
85+ 6,419 6,748 7,064 7,305 7,473 7,625 7,805 7,996 8,204 8,432
Total 445,343 450,997 456,670 462,458 468,194 474,184 480,192 486,471 492,244 498,131
Truckee Meadows Regional Planning September 2014
WASHOE COUNTY CONSENSUS FORECAST 2014-2034 Page 9
Age 2024 2025 2026 2027 2028 2029 2030 2031 2032 2033 2034
0-4 32,781 33,194 33,599 34,034 34,432 34,831 35,235 35,648 36,062 36,474 36,887
5-9 31,633 32,058 32,477 32,924 33,350 33,786 34,219 34,650 35,088 35,518 35,942
10-14 31,670 32,118 32,603 33,075 33,516 33,954 34,409 34,872 35,354 35,843 36,345
15-19 33,785 34,108 34,332 34,727 35,005 35,462 35,940 36,495 36,991 37,493 37,992
20-24 35,131 35,645 36,106 36,592 37,182 37,613 37,981 38,254 38,703 39,042 39,591
25-29 32,524 32,603 32,718 32,917 33,269 33,711 34,233 34,726 35,214 35,866 36,331
30-34 32,433 32,063 32,068 32,206 32,626 32,879 33,118 33,395 33,748 34,077 34,515
35-39 32,307 33,218 33,552 33,753 33,602 33,530 33,322 33,525 33,874 34,334 34,616
40-44 29,571 29,894 30,527 31,012 31,927 32,838 33,858 34,308 34,639 34,492 34,445
45-49 32,133 32,837 33,518 34,279 34,962 35,570 36,065 36,887 37,566 38,562 39,568
50-54 32,155 32,067 32,103 32,362 32,546 33,069 33,663 34,240 34,824 35,533 36,157
55-59 31,528 31,746 31,959 32,105 32,071 31,739 31,517 31,423 31,494 31,667 32,157
60-64 31,101 31,140 31,084 31,046 30,967 30,947 31,162 31,382 31,494 31,478 31,165
65-69 26,378 26,660 26,896 27,047 27,220 27,554 27,589 27,533 27,479 27,401 27,383
70-74 21,741 22,171 22,579 23,041 23,392 23,608 23,921 24,174 24,360 24,538 24,865
75-79 17,069 17,672 18,185 18,314 18,712 19,153 19,605 20,032 20,503 20,864 21,096
80-84 11,200 11,692 12,207 13,003 13,581 14,106 14,632 15,087 15,252 15,617 16,022
85+ 8,692 8,984 9,309 9,702 10,185 10,659 11,121 11,651 12,404 13,139 13,843
Total 503,832 509,870 515,822 522,139 528,545 535,009 541,590 548,282 555,049 561,938 568,920
Source: Global Insight and Woods and Poole.
Note: Population by cohort is not available from Truckee Meadows Water Authority or the 2013 State Demographer’s
Forecast, therefore the total population number is higher than the Washoe County Consensus Forecast figures.

Truckee Meadows Regional Planning September 2014
WASHOE COUNTY CONSENSUS FORECAST 2014-2034 Page 10
Employment
According to the Woods and Poole forecast and the calibrated Global Insight forecast (see Appendix F
for information about calibration), total employment for all of Washoe County is projected to grow from
257,759 in 2014 to 339,306 in 2034. This represents an average annual growth rate of 1.38 percent.
The 2014 and 2034 forecasted employment and percent of total employment by industry group is
shown below in Table 7. To allow for consistency within employment sectors, only employment data
from the Woods and Poole forecast is used in this table as the methodologies of Woods and Poole and
Global Insight use different employment assumptions to generate industry sectors data.
Table 7
Employment and Percent Composition of Total
Total Employment by Industry Group
Employment by
Industry Group
2014 2034
Jobs Percent of Total Jobs Percent of Total
Natural Resources 2,256 .87% 3,260 .91%
Construction 10,616 4.11% 16,666 4.67%
Manufacturing 12,425 4.8% 12,261 3.43%
Transportation,
Communication
and Public Utilities 15,655 6.05% 19,630 5.5%
Wholesale Trade 10,130 3.92% 14,631 4.1%
Retail Trade 27,367 10.58% 41,198 11.54%
Finance, Insurance,
& Real Estate 33,417 12.92% 44,955 12.59%
Services 117,418 45.41% 163,856 45.9%
Government 29,310 11.33% 40,559 11.36%
Totals 258,594 100% 357,016 100%
Source: Woods and Poole.

Truckee Meadows Regional Planning September 2014
WASHOE COUNTY CONSENSUS FORECAST 2014-2034 Page 11
Note: The employment data include wage and salary workers, proprietors, private household employees, and miscellaneous
workers of full and part-time jobs. Because part-time workers are included, a person holding two part-time jobs would
be counted twice. Jobs are counted by place of work and not place of residence of the worker. Therefore, a job in the
Reno Metropolitan Area is counted in Washoe County, regardless of where the worker resides. Due to rounding, the
“Percent of Total” may not add up to 100%.
Industry sectors remain remarkably stable from 2014 to 2034 with less than 1.5% change projected for
all sectors. The largest growth (as a percentage of total employment) can be seen in the Retail Trade
and Construction sectors with .96% and .56% growth, respectively. The largest declines are in the
Manufacturing and the Transportation, Communication and Public Utilities sectors with declines of
1.37% and .56%, respectively. The Services sector represents by far the largest percentage of total
employment in 2034 at 45.9% followed by the Finance, Insurance and Real Estate (12.59%), Retail Trade
(11.54%), and Government (11.36%) industry sectors. The largest numeric increase is in the Services
sector where 46,438 jobs are added.
The industries that represent the smallest percentage of total employment in 2034 are Natural
Resources (.87%), Wholesale Trade (4.1%), Manufacturing (3.43%), and Construction (4.67%). The
smallest numeric change is seen in the Manufacturing sector which is projected to lose 164 jobs by
2034.
The consensus total employment forecast by year is provided on the next page in Table 8.
This space intentionally blank

Truckee Meadows Regional Planning September 2014
WASHOE COUNTY CONSENSUS FORECAST 2014-2034 Page 12
Table 8
Washoe County Consensus Total Employment 2014 – 2034
Year Employment
2014 257,759
2015 262,658
2016 268,142
2017 273,688
2018 278,617
2019 282,822
2020 286,782
2021 290,117
2022 293,639
2023 296,814
2024 300,020
2025 303,313
2026 306,841
2027 310,786
2028 314,980
2029 319,241
2030 323,515
2031 327,411
2032 331,305
2033 335,214
2034 339,306
Source: Woods and Poole and Global Insight (calibrated).

Truckee Meadows Regional Planning September 2014
WASHOE COUNTY CONSENSUS FORECAST 2014-2034 Page 13
Note: Total employment is based on Global Insight and Woods and Poole forecasts. The Truckee Meadows Water Authority
forecast and 2013 State Demographer’s Forecast do not provide data regarding employment.
The methodologies for the employment forecasts for Global Insight and Woods and Poole are located in
Appendices B and C.
This space intentionally blank

Truckee Meadows Regional Planning September 2014
WASHOE COUNTY CONSENSUS FORECAST 2014-2034 Page 14
Income
Total personal income is expected to grow from $18,283,556,500 in 2014 to $41,186,329,000 in 2034.
This represents the total personal income received by persons from wages and salaries, other labor
income, and transfer payments less personal contributions for social insurance as adjusted for place of
residence. All personal income data are presented in 2005 dollars. This is used to measure the “real”
change in earnings and income when inflation is taken into account. The consensus forecast for total
personal income for each year is shown in Table 9.
Table 9
Washoe County Total Personal Income, 2014 –2034
Year Total Personal Income (2005 $)
2014 $18,283,556,500
2015 $18,928,266,500
2016 $19,712,653,500
2017 $20,668,710,000
2018 $21,599,943,000
2019 $22,514,000,500
2020 $23,433,632,000
2021 $24,408,441,000
2022 $25,375,612,500
2023 $26,350,579,500
2024 $27,372,417,000
2025 $28,423,053,000
2026 $29,534,455,000
2027 $30,765,051,500
2028 $32,064,543,500

Truckee Meadows Regional Planning September 2014
WASHOE COUNTY CONSENSUS FORECAST 2014-2034 Page 15
2029 $33,436,848,500
2030 $34,833,975,000
2031 $36,298,519,000
2032 $37,844,866,500
2033 $39,467,242,500
2034 $41,186,329,000
Source: Global Insight and Woods and Poole.
Note: Total personal income is based on Global Insight and Woods and Poole forecasts. The Truckee Meadows Water Authority
forecast and the 2013 State Demographer’s Forecast do not provide data regarding income.
This space intentionally blank

Truckee Meadows Regional Planning September 2014
WASHOE COUNTY CONSENSUS FORECAST 2014-2034 Page 16
The consensus forecast for per capita personal income for each year is listed below:
Table 10
Washoe County Per Capita Personal Income, 2014 –2034
Year Per Capita Personal Income (2005 $)
2014 $37,419
2015 $37,644
2016 $38,180
2017 $38,929
2018 $39,426
2019 $40,018
2020 $40,400
2021 $40,806
2022 $41,246
2023 $41,745
2024 $42,137
2025 $42,557
2026 $42,979
2027 $43,467
2028 $44,110
2029 $44,736
2030 $45,298
2031 $46,047
2032 $46,807
2033 $47,559

Truckee Meadows Regional Planning September 2014
WASHOE COUNTY CONSENSUS FORECAST 2014-2034 Page 17
2034 $48,324
Source: Global Insight and Woods and Poole.
Note: Total per capita personal income is based on Global Insight and Woods and Poole forecasts. The Truckee Meadows
Water Authority forecast and the 2013 State Demographer’s Forecast do not provide data regarding income.
This space intentionally blank

Truckee Meadows Regional Planning September 2014
WASHOE COUNTY CONSENSUS FORECAST 2014-2034 Page 18
Jurisdictional Splits
Reno, Sparks and Washoe County use the Governor’s certified population estimates of 2013 as a starting
point for determining jurisdictional forecast splits for the year 2034.
Table 11
2013 Governor’s Certified Population Estimates*
Washoe County Total 2013 432,324
Reno City Total 2013 232,243
Sparks City Total 2013 91,551
Unincorporated Washoe County Total 2013 108,530
*Note: Cooperatively, Washoe County and the Nevada State Demographer prepare annual population estimates for Washoe
County for July 1 of each year.
In 2013, each jurisdiction contained the following percent of total population:
Table 12
2013 Jurisdictional Percent of Total Population
Reno Percent of Total 53.72%
Sparks Percent of Total 21.18%
Unincorporated Washoe County Percent of Total 25.10%
An analysis of historic census and estimated population figures since 1980 shows these jurisdictional
percentages have remained relatively stable over time, with little apparent impact attributable to
previous regional plans (prior to the 2012 Truckee Meadows Regional Plan Update) or conforming
jurisdiction master plans.
In this 2014 Consensus Forecast, there is a desire to reflect a potential impact of the 2012 Truckee
Meadows Regional Plan, as amended, on jurisdictional shares of population through the year 2034. The
influence of plan policies on growth and development patterns, and the possible impacts on future
settlement patterns are the subject of significant debate and reflect a different approach to forecasting
in a multi-jurisdictional environment than forecasts based on a mere reflection and continuation of
historic trends. While all forecasts reflect inherent uncertainties, especially in regions with highly

Truckee Meadows Regional Planning September 2014
WASHOE COUNTY CONSENSUS FORECAST 2014-2034 Page 19
variable decadal growth rates, forecasts associated with regional plan policies can provide a useful
guide, over time, as to the effectiveness and need for amendment of such growth policies.
The year 2034 Washoe County Consensus Forecast of 563,779 persons exceeds the 2013 Governor’s
certified estimate of 432,324 by a growth increment of 131,455 persons.
Reno, Sparks and Washoe County have decided to allocate the growth increment of 131,455 persons in
the following manner:
Table 13
Growth Increment Allocation
25% of Growth Increment (32,864 persons) at
Year 2034
Allocate to Centers, TOD Corridors, Emerging
Employment Centers in Reno and Sparks
75% of Growth Increment (98,591 persons) at
Year 2034
Allocate based on adjusted jurisdictional shares
of population of 50% City of Reno, 24% City of
Sparks and 26% Unincorporated Washoe County.
The approach that allocates 25% of the growth increment to Centers, TOD Corridors and Emerging
Employment Centers recognizes that the 2012 Regional Plan policies may have increasing impact over
time. Thus, the growth increment attributed to these policies increases from 2014 to 2034 in a linear
fashion. Interpolation of jurisdictional population forecasts from 2014 to 2034 is the responsibility of
each jurisdiction and is addressed in local population master plan elements, if desired. This consensus
forecast establishes only the beginning (2013 certified estimates) and end points (allocated 2034
consensus forecast by jurisdiction) of that forecast series for each jurisdiction through the year 2034.
Analysis of the 25% population increment (32,864 persons) allocated to each jurisdiction’s Centers, TOD
Corridors and Emerging Employment Centers (EECs) yielded the following assumptions based on
corridor, center and emerging employment center land areas and density assumptions:
21.3% (i.e. 85.2% of 32,864) of the increment will be allocated to the City of Reno (28,000
persons);
3.7% (i.e. 14.8% of 32,864) of the increment will be allocated to the City of Sparks (4,864
persons).
While the City of Sparks has major emerging employment centers in its jurisdiction, it is recognized that
these EECs have lower densities than centers and corridors and that these EECs are located in or near to
Sparks’ traditional growth areas. Spark’s EECs, however, are extremely important to jobs-housing
balance and trip reduction policies.

Truckee Meadows Regional Planning September 2014
WASHOE COUNTY CONSENSUS FORECAST 2014-2034 Page 20
Recent changes, implemented during the 2012 Regional Plan update, allow for the creation and
designation of Secondary Transit Oriented Development Corridors. Although these areas correspond
with principal transportation routes, they are typically further from core areas such as downtown Reno
and exhibit lower densities when compared to Primary Transit Corridors. Portions of the existing
Transit Oriented Development Corridors within the City of Reno were downgraded to Secondary Transit
Corridors following the adoption of the 2012 Regional Plan.
In the future, Washoe County is expected to designate at least one Secondary Transit Corridor and to
designate Infill Opportunity Areas under the policies of the 2012 Regional Plan. Under the forecast
approach of the Consensus Forecast, Washoe County may analyze the impact of these designations and
include any appropriate and related population shares in its Population Element to be submitted to the
Regional Planning Agency.
Allocation of the remaining (non-centers, corridors and EEC) growth increment (75% or 98,591 persons)
to the jurisdictions is based upon a minor modification of the historic jurisdictional distribution of
population, as follows:
Table 14
2034 Jurisdictional Distribution of Population (of remaining growth increment)
City of Reno Year 2034 Allocation 50% 49,295 persons
City of Sparks Year 2034 Allocation 24% 23,662 persons
Unincorporated Washoe County Year 2034 Allocation 26% 25,634 persons
Table 15
Year 2034 Total Jurisdiction Forecasts
Jurisdiction
2013
Certified
Estimates
Centers, Corridors
and EEC
Increment
Remaining
Increment
2034 Jurisdiction
Forecast
Reno 232,243 28,000 49,295 309,538
Sparks 91,551 4,864 23,662 120,077
Unincorporated
Washoe County 108,530 N/A 25,634 134,164
Total County 432,324 32,864 98,591 563,779

Truckee Meadows Regional Planning September 2014
WASHOE COUNTY CONSENSUS FORECAST 2014-2034 Page 21
Appendix A

Truckee Meadows Regional Planning September 2014
WASHOE COUNTY CONSENSUS FORECAST 2014-2034 Page 22

Truckee Meadows Regional Planning September 2014
WASHOE COUNTY CONSENSUS FORECAST 2014-2034 Page 23

Truckee Meadows Regional Planning September 2014
WASHOE COUNTY CONSENSUS FORECAST 2014-2034 Page 24

Truckee Meadows Regional Planning September 2014
WASHOE COUNTY CONSENSUS FORECAST 2014-2034 Page 25

Truckee Meadows Regional Planning September 2014
WASHOE COUNTY CONSENSUS FORECAST 2014-2034 Page 26
This page intentionally left blank.

Truckee Meadows Regional Planning September 2014
WASHOE COUNTY CONSENSUS FORECAST 2014-2034 Page 27
Appendix B
January 2014
Long-Term Forecast
Prepared by IHS ECONOMICS
Washoe County, NV
P R E F A C E
This analysis accompanies a forecast prepared by IHS ECONOMICS for the Washoe County Office of the County Manager. The forecast pertains to Washoe County, which comprises the cities of Reno and Sparks, and the unincorporated remainder of the county. Some sections of this document will refer to the Reno-Sparks Metropolitan area, using it as an approximation of activity in Washoe County. These sections will be clearly marked using the notation Reno MSA.
R E C E N T P E R F O R M A N C E
Growth is on the upswing here. In 2012, Washoe County registered a total employment gain of just 0.5% year-over-year (y/y), and while this was only slightly above zero, it was a welcome change from the series of declines experienced from 2007 through 2011. Growth accelerated in 2013, and while county employment history is not yet available, the Reno metropolitan area (MSA), which makes up the bulk of Washoe County, posted y/y job growth of 0.9% in November 2013, continuing a trend of moderately improving job gains that began in 2012. The unemployment rate in the metro area is receding from the painfully high rates during the recession that reached a peak of 14.6% in November 2010. By November of 2013, unemployment had edged down to 9.0%, an encouraging trend, although this rate is still more than double its 2007 pre-recession level. Looking more closely the local economy, we can see where the recession hit the hardest, and where future growth is likely to come from:
Personal Income: Personal income in Washoe County increased by 2.8% in 2011, according to the Bureau of Economic Analysis, the latest data available. It is expected to have increased at a similarly modest pace in 2012 and 2013, according to IHS Economics analysis, as the local economy slowly emerged from the recession. Income gains will pick up along with employment growth from 2014 onward.
Trade, Transportation, and Utilities: This sector, which is the largest in the Washoe County economy, at 22% of total employment, saw payroll declines from 2008 through 2011. The sector managed to turn around and squeak out a 0.2% gain in 2012 and we expect that growth accelerated to 0.7% in 2013. Job growth in the sector will pick up over the next year and remain strong over the medium term.
Tourism and Gaming: Leisure and hospitality employment, which includes jobs in accommodation and eating and drinking establishments, is the second largest employment

Truckee Meadows Regional Planning September 2014
WASHOE COUNTY CONSENSUS FORECAST 2014-2034 Page 28
sector in Washoe County and in the Reno MSA, accounting for 18% of total employment. This sector saw employment growth decline during the first recession of the decade, beginning in 2001 and reaching its lowest point in 2005. Thereafter, a strong national economy and expansion in the region’s gaming industry helped employment rebound through 2007, before the recent recession brought growth to a halt again in 2008. A subsequent decline in 2009 was a result of weak economic conditions and restrained consumer spending. Growth in leisure and hospitality then essentially remained flat from 2010-2012, as still-shaky consumer confidence sapped demand from Washoe County’s large gaming industry. Gaming revenues plunged from $1.05 billion in 2007 to $729.9 million in 2012 as consumers pulled back their spending. However, with the recession behind us, the leisure and hospitality sector took a sharp upward turn in the Reno MSA in 2013, and this past year employment surged. Indeed, payrolls were up 4.2% y/y in November 2013, though job levels remain well below pre-recession highs. Gaming revenues have also been slowing trending higher, as travel and spending begins to pick back up across the nation in tandem with a broader recovery in the national economy.
Services: At the other end of the recovery spectrum, the professional and business services sector was also hit hard by the weak economy, after having being an economic strong point for several years, but it has yet to mount a sustained rebound. The education and health services sector, accounting for 12% of total employment, was the only major sector that remained healthy during the recession, thanks to largely inelastic demand for its services. Its job growth advanced by another 1.8% y/y in November 2013.
Housing: The combined construction/mining employment sector in Washoe County grew by 2.5% y/y in 2012, gaining about 200 jobs in the process. While this is a much welcome turnaround from the painful declines during the recession, it still represents only a fraction of the jobs. Also, the construction sector is not totally out of the woods yet. Between November 2012 and November 2013, the Reno MSA construction sector contracted, with payrolls slipping 4% y/y, which suggests that Washoe will likely see a decline in total construction jobs when final data is tallied for 2013. While these declines will be much less severe than the 2007-2010 devastation to this sector, they are an indication that construction payrolls have yet to hit bottom. When that happens in 2014, the sector’s payrolls will be 64% below their 2006 peak. While strong growth in construction is on the horizon over the medium-term, it will take over a decade before construction employment levels even approach the pre-housing speculation levels.
Manufacturing: This sector accounts for almost 6% of total employment in Washoe County, and had flat-to-positive job growth between 2003 and 2007 – indeed, the Reno MSA is one of the few metro areas in the nation that did not see significant declines in manufacturing through the early years of the decade. In 2008, however, the sector felt the impacts of the recession, leading to payroll losses that topped out in 2009, although declines continued in 2010 and 2011. Things have been bumpy since: the sector then saw moderate gains in 2012, which will likely be followed by modest losses in 2013 before manufacturing activity sees a sustained period of expansion over the medium term.
Truckee Meadows Regional Planning September 2014
WASHOE COUNTY CONSENSUS FORECAST 2014-2034 Page 29
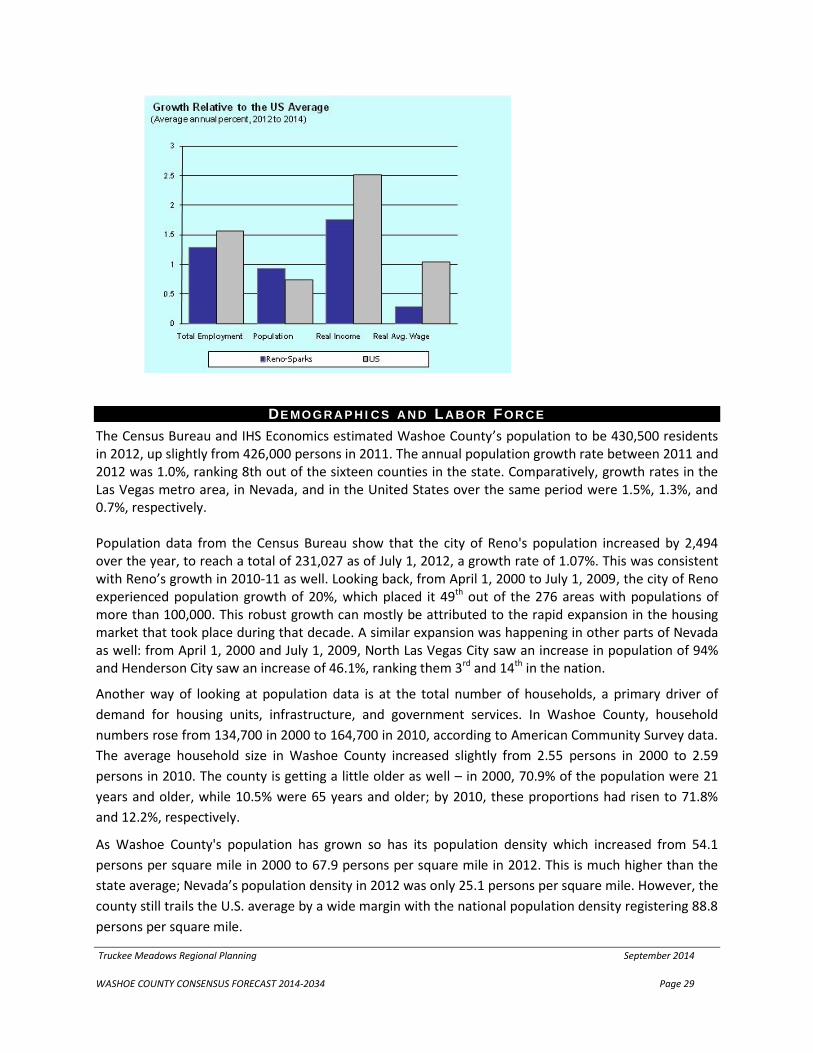
DE MO G R A P H I C S A N D LA B O R FO R C E
The Census Bureau and IHS Economics estimated Washoe County’s population to be 430,500 residents in 2012, up slightly from 426,000 persons in 2011. The annual population growth rate between 2011 and 2012 was 1.0%, ranking 8th out of the sixteen counties in the state. Comparatively, growth rates in the Las Vegas metro area, in Nevada, and in the United States over the same period were 1.5%, 1.3%, and 0.7%, respectively. Population data from the Census Bureau show that the city of Reno's population increased by 2,494 over the year, to reach a total of 231,027 as of July 1, 2012, a growth rate of 1.07%. This was consistent with Reno’s growth in 2010-11 as well. Looking back, from April 1, 2000 to July 1, 2009, the city of Reno experienced population growth of 20%, which placed it 49th out of the 276 areas with populations of more than 100,000. This robust growth can mostly be attributed to the rapid expansion in the housing market that took place during that decade. A similar expansion was happening in other parts of Nevada as well: from April 1, 2000 and July 1, 2009, North Las Vegas City saw an increase in population of 94% and Henderson City saw an increase of 46.1%, ranking them 3rd and 14th in the nation.
Another way of looking at population data is at the total number of households, a primary driver of
demand for housing units, infrastructure, and government services. In Washoe County, household
numbers rose from 134,700 in 2000 to 164,700 in 2010, according to American Community Survey data.
The average household size in Washoe County increased slightly from 2.55 persons in 2000 to 2.59
persons in 2010. The county is getting a little older as well – in 2000, 70.9% of the population were 21
years and older, while 10.5% were 65 years and older; by 2010, these proportions had risen to 71.8%
and 12.2%, respectively.
As Washoe County's population has grown so has its population density which increased from 54.1
persons per square mile in 2000 to 67.9 persons per square mile in 2012. This is much higher than the
state average; Nevada’s population density in 2012 was only 25.1 persons per square mile. However, the
county still trails the U.S. average by a wide margin with the national population density registering 88.8
persons per square mile.

Truckee Meadows Regional Planning September 2014
WASHOE COUNTY CONSENSUS FORECAST 2014-2034 Page 30
Both Reno's and Nevada's unemployment rates surged during the recession, but rates have come down
markedly over the past couple years. In the Reno MSA, the seasonally adjusted unemployment rate was
down to 9.0% in November 2013; by comparison, the rates for Nevada and the United States were 9.2%
and 7.1%, respectively, in November. Despite these declines, the stubbornly high jobless rate and tepid
job growth has led to a decline in the Reno MSA’s total labor force over the past 35 months. The metro
area labor force slipped to a total of 219,100 persons in November 2013, a decrease of 1.9% from
November 2012. Looking at longer-trend patterns, however, labor force growth tends to be weak after a
recession. Growth slowed with the recession in 2001, and then picked up during the recovery, reaching
2.7% in 2006. Growth decelerated in the years thereafter as the economy softened again; the labor
force contracted by 0.8% in 2011, 1.3% in 2012, and is on pace for another year of decline in 2013.
I N C O ME A N D WA G E S
According to the Bureau of Economic Analysis, in 2012 per capita personal income in the Reno MSA was
$43,300, the 56th highest in the United States, well above the Nevada figure of $38,200, and on par with
the U.S. ($43,700). In terms of growth rates, the Reno MSA’s 2012 per capita personal income was up
2.0% over 2011, compared to increases of 2.4% in Nevada and 3.4% for the United States. According to
the BLS, in the second quarter of 2013, the average weekly wage in Washoe County was $829, up 1.8%
from the second quarter of 2012. The average weekly wage in Clark County (Las Vegas) was similar, at
$822, while the figure for the United States was $921.
The State of Nevada has released the following average weekly wage data for industries in Washoe County and Nevada for 2012:
Average Weekly Wages, Annual 2012
Sector
Washoe
County Nevada
Natural Resources and Mining $1,569 $1,483
Construction 953 1,002
Manufacturing 1,025 1,019
Trade, Trans, & Utilities 744 736
Information 1,151 1,123
Financial Activities 1,124 1,025
Professional & Business Svcs 1,048 1,053
Education & Health Services 964 950
Leisure & Hospitality 422 593
Other Services 697 629
Government 990 1,006
Total, All Industries 838 840

Truckee Meadows Regional Planning September 2014
WASHOE COUNTY CONSENSUS FORECAST 2014-2034 Page 31
E C O N O M I C S T R U C T U R E
Washoe County's 20 largest employers are listed below (as reported by the state of Nevada for the second quarter of 2013).
Washoe County School District, elementary and secondary schools: 8,000 to 8,499 employees
University of Nevada-Reno, colleges and universities: 4,000 to 4,499 employees
Renown Regional Medical Center, general medical and surgical hospitals: 2,500 to 2,999 employees
Washoe County Comptroller, executive and legislative combined: 2,500 to 2,999 employees
Peppermill Hotel and Casino, casino hotels: 2,000 to 2,499 employees
International Game and Technology, misc. manufacturing: 2,000 to 2,499 employees
Silver Legacy Resort, casino hotels: 1,500 to 1,999 employees
Atlantis Casino Resort, casino hotels: 1,500 to 1,999 employees
City of Reno, executive and legislative combined: 1,000 to 1,499 employees
Eldorado Hotel and Casino, casino hotels: 1,000 to 1,499 employees
Grand Sierra Resort and Casino, casino hotels: 1,000 to 1,499 employees
St. Mary’s Hospital, general medical and surgical hospitals: 1000 to 1499 employees
Sierra Nevada Healthcare Systems, general medical and surgical hospitals: 1,000 to 1,499 employees
Circus Circus Casinos - Reno, casino hotels: 1,000 to 1,499 employees
Sparks Nugget, casino hotels: 1,000 to 1,499 employees
Truckee Meadows Community College, Junior Colleges: 1,000 to 1,499 employees
United Parcel Service, couriers: 900 to 999 employees
Integrity Staffing Solutions, temporary health services: 900 to 999 employees
West Business Solutions LLC, telemarketing bureaus: 800 to 899 employees
Harrah's Reno, casino hotels: 600 to 699 employees
Of the MSA's 20 largest employers, eight are casinos. Because of the dominant presence of the casino
industry, Washoe County has a unique economic structure compared to the U.S. economy. As
mentioned above, the leisure and hospitality sector, which includes accommodations and eating and
drinking establishments, accounted for 18% of Washoe County’s total employment in 2012, almost
double the U.S. economy’s 10%. The construction industry also used to be a major presence here, but
because of the large layoffs during the recession, the construction and mining sector accounted for only
5.0% of Washoe County’s total employment in 2012, down more than 50% from 10.8% in 2006. This
concentration is now near the U.S. average of 4.4%. It’s now about the same size as the metro’s
relatively small manufacturing sector, which accounts for 5.9% of Washoe County’s 2012 employment,
compared to 8.9% in the United States.
The following table compares employment distribution by major sector for Washoe County, Nevada; the
Mountain Census region (i.e., AZ, CO, ID, MT, NV, NM, UT, and WY); and the United States. The table
confirms the importance of the leisure and hospitality sector in both Washoe County and in Nevada, and
shows clearly how much the structure of their economies varies from the rest of the Mountain region
states and from the United States.

Truckee Meadows Regional Planning September 2014
WASHOE COUNTY CONSENSUS FORECAST 2014-2034 Page 32
Employment by Sector, Annual 2012 (NAICS) Sector
Washoe
County Nevada Mountain US
Construction and Mining 4.9% 5.9% 6.5% 4.8%
Manufacturing 5.9% 3.4% 6.0% 8.9%
Trade, Transportation, and Utilities 21.7% 19.1% 18.8% 19.0%
Information 1.1% 1.1% 2.0% 2.0%
Financial Activities 4.8% 4.7% 5.8% 5.8%
Professional and Business Services 13.6% 12.6% 13.4% 13.4%
Educational and Health Services 11.6% 9.3% 13.1% 15.2%
Leisure and Hospitality 18.1% 27.8% 13.1% 10.3%
Other Services 3.2% 2.9% 3.5% 4.0%
Government 15.2% 13.0% 17.7% 16.6%
To gain even greater insight in to the local economy, IHS Economics conducted a shift-share analysis to identify the changes in Washoe County's economic structure during the last 22 years. This change, as measured by the distribution of private sector employment by three-digit NAICs code, was compared to the employment changes that occurred in the United States over the same period. The purpose of the analysis was to identify four crucial types of economic sectors, enumerated below.
Type D: Competitive Advantage and Specialized. Competitive advantage means that an individual
sector's employment growth rate in Washoe County over the last 22 years was higher than its
employment growth rate at the U.S. level over the same period. Specialized means that the same
sector's percent share of total Washoe County employment is higher than the sector's percent share of
total U.S. employment (i.e., its location quotient is >1.0). Sectors in this category are major sources of
growth in a regional economy, as they have both above-average shares of regional activity, and above-
average growth rates. Higher growth rates for these sectors presumably occur because of the
competitive advantages (e.g., labor costs, agglomeration effects, skilled labor, proximity to market,
lower cost of living, etc.) that attracted them into a region in the first place. Approximately 24.2% of
Washoe County’s 2012 employment, or 37,228 workers, are in sectors classified as type D. The top-five
sectors in this category, based on total employment, are:
Administrative and Support Services (NAICS 561)
Warehousing and Storage (NAICS 493)
Miscellaneous Manufacturing (NAICS 339)
Truck Transportation (NAICS 484)
Retail Trade – Apparel & Acc. (NAICS 448)

Truckee Meadows Regional Planning September 2014
WASHOE COUNTY CONSENSUS FORECAST 2014-2034 Page 33
Type C: Competitive Advantage but not Specialized. This type consists of sectors whose employment
growth rate in Washoe County over the past 22 years was higher than the sector's growth rate at the
U.S. level, but also where the current shares of total county employment are less than their shares of
total U.S. employment. Economic sectors classified as Type C present targets of opportunity, as Washoe
County may have competitive advantages that enable these sectors to achieve above-average growth
rates. Approximately 38.6% of Washoe County’s employed persons in 2012 are classified as Type C. The
top-five private sectors in this category, based on total employment, are:
Food Services & Drinking Places (NAICS 722)
Professional, Scientific, and Technical Services (NAICS 541)
Hospitals (NAICS 622)
Retail Trade – General Merchandise Stores (NAICS 452)
Retail Trade – Food & Beverage (NAICS 445)
Type B: Competitive Disadvantage but Specialized. This type is comprised of sectors whose
employment growth rates in Washoe County over the last 22 years were below their employment
growth rates at the U.S. level, but whose share of total Washoe County employment is higher than their
shares of U.S. employment. Type B sectors often comprise major parts of a region's economy, but their
boom years are in the past. Approximately 25.8% of Washoe County’s 2012 employment is classified as
Type B. The top five private sectors in this category, based on total employment, are:
Accommodations (NAICS 721)
Specialty Trade Contractors (NAICS 238)
Amusement, Gambling and Recreation (NAICS 713)
Social Assistance (NAICS 624)
Retail Trade – Motor Vehicle and Parts (NAICS 441)
Type A: Competitive Disadvantage and not Specialized. This type is comprised of sectors whose
employment growth rates in Washoe County over the last 22 years were below their employment
growth rates at the U.S. level and whose share of total Washoe County employment is less than their
shares of U.S. employment. Type A economic sectors make little contribution to new regional economic
growth, and sectors in this class comprised only 11.5% of Washoe County’s total employment in 2012.
The top five sectors in this class are:
Ambulatory Health Care Services (NAICS 621)
Credit Intermediate and Related Activities (NAICS 522)
Religious, Civic, and Professional Organizations (NAICS 813)
Retail Trade – Gasoline Stations (NAICS 447)
Securities and Other Financial Investments (NAICS 523)

Truckee Meadows Regional Planning September 2014
WASHOE COUNTY CONSENSUS FORECAST 2014-2034 Page 34
Our IHS Economics analysis also estimated that the high-technology sector (by NAICS definition) would
be classified as Type A, accounting for 4.7% of the Reno MSA's total non-agricultural employment in
2012, below the sector’s average share of 6.2% for the United States.
Additionally, IHS Economics calculated the Hachman Index of structural diversity for the Reno MSA in
2012. The closer the index value is to 1.0, the more similar the structure of the MSA or state economy is
to the structure of the U.S. economy. In general, larger economies such as in big states or MSAs tend to
be more economically diverse and have higher index values than the economies of smaller states and
MSAs that may specialize in certain industries based on their competitive advantages. Economic
structure is measured by the distribution of an economic indicator, such as employment, income,
output, or business establishments, by NAICS code. IHS Economics used private employment at the
three-digit NAICS code level as obtained from our Business Markets Insight database.
Given its unusual dependence on the tourism and gaming industry, one would expect that Washoe
County's index of structural diversity would be low, making the structure of its economy significantly
different than the structure of the U.S. economy. Indeed, in 2012, the index of structural diversity for
Washoe County was 0.591. Similarly, the structure index value for the State of Nevada was 0.311 in
2012, the second lowest value among all the states. These results show that Washoe County's economy
is far less diverse than the nation, although it is more diverse than the state economy. As a basis of
comparison with its neighbors, the structural index value for the State of California was 0.890 in 2012,
the 15th highest value among all the states; in Utah the index was 0.902, the 8th highest in the nation;
and in Arizona the index was 0.909, the 5th highest.
RE G I O N A L EC O N O MI C OU T L O O K
Washoe County is within the Mountain region, which continues the long, slow recovery from the
recession that it began five years ago. As measured by payroll growth, the recovery decelerated
considerably over the summer and early fall, in the region as well as nationally. The construction sector
appears to have lost jobs in recent months, as the rate of housing starts has leveled off in some areas.
Short-term measures of construction payrolls can be tricky, however, since the industry is so heavily
influenced by the weather. The region still has outpaced much of the rest of the nation in job growth
over the past year. The Mountain states continue to be an attractive destination for companies due to
their relatively low costs of doing business and ample supplies of labor.
All eight states in the region have seen job growth over the past year, with most of the states above the national average. Nevada and Arizona continue to dig out from the blizzard of delinquencies and foreclosures caused by the housing bust. The significant increases seen in housing prices over the past couple of years are helping many sectors of the states’ economies, especially those dependent on consumer spending.
The region’s ample natural resources provide many outdoor recreation opportunities, drawing skiers, hikers, and other enthusiasts from a wide area. The national economic recovery has provided a huge boost the region’s tourism business, helping to spur hiring in the leisure and hospitality sector. The national parks system is a major presence in the region, which led some Mountain states to step in and provide funding to reopen several national parks during the federal government shutdown in October. The abundance of recreational opportunities is also cited as a factor in the region’s ability to attract

Truckee Meadows Regional Planning September 2014
WASHOE COUNTY CONSENSUS FORECAST 2014-2034 Page 35
young workers, playing a prominent role in the development of the region’s high-tech hubs. On the downside, the region’s robust economic growth is directly tied to robust population growth, which also translates into increasing demands for water. Allocation of the region’s water resources is the subject of ongoing debate among policymakers in the western states who are concerned about future water issues, which will rapidly become present ones unless weather and usage patterns change.
The Mountain region saw economic pain spread to nearly all sectors of its economy during the
recession, and the recovery so far has been almost equally widespread. The professional and business
services sector and the trade, transportation, and utility sector, which together account for more than
one-third of the region’s total jobs, have grown consistently and have been a major source of payroll
gains. The leisure and hospitality sector accounts for 13.3% of the regional economy, the largest share
among the nine regions, and well above the national average of 10.5%. This sector has been top
performing well, up 1.9% y/y in November despite a recent downswing in the hiring pace. Nevada,
which accounts for just 12% of the Mountain region's employment, comprises a fourth of its leisure and
hospitality payrolls. In 2009, during the height of the recession, Nevada's ever important gaming
industry was hit hard by shaky consumer confidence, which kept people away from the tourist hotspots,
in addition to people cutting back on such luxuries such as eating out and travel. However, this is
working in the opposite direction now, with tourism ramping back up as consumer sentiment improves
and pent-up demand for leisure activities is attracting people back to the Mountain region. Meanwhile,
jobs in education and health services continue to expand heartily thanks to the region's fast growing
share of residents over the age of 65.
The Mountain region is made up of states that were at the forefront of the housing boom, and have thus
were affected by the bust more so than other areas. From 2007 to 2010, the region purged 340,000
construction jobs, with more than half of those losses coming from Arizona and Nevada alone. While
these deep cuts are painful, with bubbles come extremes at the top and bottom – meaning that when
the housing market recovers over the next decade there will be more room for growth because it is
starting at such a low base. The region is also home to states that are benefiting from the natural
resource boom.
Over the next five years, employment gains in the region will outpace the national average. We expect Utah, Nevada, Arizona, and Colorado to be among the leading states nationally though 2018 in terms of payroll employment growth rates. These employment gains will be accompanied by continuing robust population expansion.
Between 2013 and 2018, the region will see 2.3% average annual job gains, compared with the national average of 1.6%. The housing recovery, combined with robust development in commercial real estate development and infrastructure, will boost average annual payroll growth in the construction sector by 7.8%, while professional and business services grow by 3.9% annually.

Truckee Meadows Regional Planning September 2014
WASHOE COUNTY CONSENSUS FORECAST 2014-2034 Page 36
Nevada
Economy in 2014: As the recovery continues to take hold in Nevada, we expect that payroll growth will
accelerate this year, increasing 2.2%. Having a long way to go to make up for losses during the recession
and a rapidly expanding population, the state’s employment gains will outpace much of the nation in
2014, when Nevada will rank seventh in the country in total payroll growth. Service sector gains will
dominate hiring this year. Professional/business services, education/health services, and
leisure/hospitality services will add 3.0%, 2.0%, and 2.2%, respectively, to total payrolls. Retail will also
continue to heat up, with payrolls climbing an additional 6.6%. Of the nearly 25,500 new jobs that the
state labor market will create this year, almost 23,000 will come from these four sectors alone.
Construction employment will pick up slightly, adding 1.9%. The uptick in payroll growth will help to
propel the unemployment rate downward to 8.4% by the end of the year.
Economy through the Next Five Years:
Nevada took a huge hit during the Great Recession and the housing bust, but it will experience strong
growth in the coming years as it climbs back out of that massive hole. Although the influx of new
residents will not return to its pace prior to the collapse, the state will nevertheless rank fifth in the US
in terms of population growth over the next five years, at 1.4%. These two factors will drive employment
growth here, which will easily outpace the nation, increasing 2.6% on an average annual basis through
2018. This pace of payroll expansion will place Nevada first in the nation.
With the exception of mining, all sectors of the state economy will undergo expansion in the next five
years. The state’s prominent service sector will play a key role in its recovery. Professional and business
services will come roaring back to life, adding 4.3% to payrolls, on average, each year. Strong population
gains will fuel demand for education and health services, and this sector will add jobs at a 2.3% annual
pace. The all-important leisure and hospitality services segment will expand by 2.3%. Construction gains,
meanwhile, will be huge. It will add 8.1% to payrolls on average, although the current oversupply of
existing homes, the pace of hiring will not really pick up until 2015.

Truckee Meadows Regional Planning September 2014
WASHOE COUNTY CONSENSUS FORECAST 2014-2034 Page 37
The state still has quite a long way to go before it recovers all of the jobs lost in the downturn – a deficit
of over 134,000 from its peak in 2007. Despite rapid payroll growth, we do not expect Nevada to reach
prerecession levels of employment until the end of 2017. The unemployment rate will continue to
decline, but remain elevated relative to the nation.
Housing:
Thanks to the abysmal decline in home values during and after the mortgage crisis and housing bust, the
residential real estate market in Nevada has been on a tear now that home prices have reversed course.
After turning the corner in mid-2012, year-over-year (y/y) home values have been appreciating at
double-digit rates. According to the Federal Housing Finance Agency’s purchase-only home price index,
home values here were up 25.3% y/y in the third quarter of 2013. This was the fifth straight quarter in
which gains were in the double digits. This is welcome news for a state that leads the nation in the share
of mortgages that are in negative equity. Rising values are lifting many homeowners out from
underwater mortgages, and helping stem the tide of new foreclosure activity. Nevada was one of the
hardest-hit states in the nation when it comes to foreclosures. Although the situation is on the mend, it
still ranks near the top, seventh, in terms of the share of total loans in foreclosure.
Builders broke ground on more homes in 2013 than in 2012, with starts reaching 11,400. That is still a far cry from the pace of construction set prior to the housing bust. We expect new construction to ramp up this year, with total starts hitting almost 19,000. Because so much excess homebuilding occurred during the years of the housing boom, we do not expect new construction to reach those levels again during the forecast period.

Truckee Meadows Regional Planning September 2014
WASHOE COUNTY CONSENSUS FORECAST 2014-2034 Page 38
Las Vegas
Economy in 2014:
On the heels of 2.3% job growth in 2013, we forecast a modest acceleration to 2.6% job growth in 2014.
Strong gains in leisure and hospitality services (2.6% growth), education and health services (2.9%), and
professional and business services (4.0%) will significantly boost the metro economy this year and
represent the vast majority of gains. Professional and business services will show consistent, increasing
payroll additions and will be one of the city's fastest-growing sectors in the near and mid-term.
Education and health, which is typically a consistent source of new jobs, will continue to perform well
over the medium term. Ultimately, however, the Las Vegas economy will only go as far as the leisure
and hospitality sector can take it. Representing 33% of total employment, sustained growth in leisure
and hospitality is essential to an employment recovery in Vegas. Fortunately, increasing consumer
confidence is helping to bring tourists back to the metro and driving the strong payroll growth this year.
However, the construction sector has yet to mount a sustained recovery. Construction employment will
decline again in 2014 after meager growth in 2013, although over the medium term the sector’s
prospects look much better.
Economy through the Next Five Years:
Good times are ahead. The metro will average 2.2% employment gains annually during 2014–18, a
performance well above the country's average 1.6% growth. Although employment gains in the leisure
and hospitality sector will decelerate over the coming years, the education/health services and
professional/business services segments will generate a substantial number of new jobs, averaging 2.4%
and 5.4% annual job gains, respectively, during 2014–18. The recently devastated construction sector,
meanwhile, will come roaring back to life in 2015, averaging 9.3% annual employment growth during
2015–18.

Truckee Meadows Regional Planning September 2014
WASHOE COUNTY CONSENSUS FORECAST 2014-2034 Page 39
Housing:
The real estate downturn was a major economic blow for many metros in this past recession, and Las Vegas was no exception. The metro's housing market has very slowly been recovering—from its pre-recession peak of $295,000, the median home price plummeted 65% to less than $103,000 by the end of 2011. But signs of a bottom were finally seen in 2012, and by the third quarter of 2013 home prices were up 29.1% from a year earlier. This left them still 16.3% lower than five years earlier, but it is a good start. The housing boom left the metro area with an excess inventory of housing that will need to be burned off before the market can return to a consistently positive growth trend. The metro area was a hotspot for speculative activity, and as these investors pulled out of the market, inventory buildup occurred. Foreclosure activity, which soared in the state, has also left many homes on the market. As a result of the excess supply of homes, construction activity has slowed, with housing starts down substantially.
There is something big happening in the heart of the city, however. Downtown Las Vegas, long overshadowed by the casinos of the Strip, is the focus of a bold development plan by Zappos.com founder Tony Hsieh. In 2010, Hsieh announced a $350-million investment in the city – with $200 million for real estate investments; $50 million for tech startups; $50 million for arts, healthcare, and education; and $50 million for small businesses. The plan, dubbed the Downtown Project, is intended to foster entrepreneurship and innovation, especially in technology, and create a family-friendly live/work community in a city generally known for seedier pursuits. Between 2010 and 2013, Hsieh wooed 60 tech startups to the city, and in mid-2013 Zappos moved its headquarters from the Vegas suburbs to the heart of downtown. To foster the growth of community, the project includes charter schools, new parks, music festivals, and a health clinic that operates on a flat fee.

Truckee Meadows Regional Planning September 2014
WASHOE COUNTY CONSENSUS FORECAST 2014-2034 Page 40
FO R E C A S T SU MMA R Y
Economy in 2014:
Payroll growth in Reno remained relatively weak in 2013, following an equally soft performance the
prior year. The metro area has struggled more than most in regaining jobs lost during the Great
Recession. Key sectors including professional/business services, manufacturing, and construction/mining
slipped again in 2013, after seeing some gains in 2012. Still, some other sectors of the local economy
perked up last year. The metro’s sizable leisure and hospitality sector expanded by a promising 3.9%.
Education and health services added 1.0%. Trade/transportation/utilities, Reno’s largest sector, tacked
an additional 1.4% onto payrolls. A lackluster overall labor market performance, however, has kept
unemployment particularly high, at 9.0% in November. Job gains have nonetheless been sufficient to
reduce the jobless rate from 9.7% at the beginning of 2013. We expect that 2014 will be a better year
for the Reno area’s labor market. Employment growth will perk up to 1.8%. Retail, professional/business
services, and education/health services will lead the charge.
Economy through the Next Five Years:
Reno’s long-term economic growth will be led by its services sectors. Leisure and hospitality services has
been a major employment generator in recent years and will continue to create jobs at a 2.5% pace over
the forecast period. We expect professional and business services to lead gains, adding an average of
3.6% annually to payrolls from 2014 through 2018. The education and health services sector will see
solid growth as it keeps up with a population that is progressively getting older, averaging 1.5% job gains
annually during 2014–18. The manufacturing and the trade/transportation/utilities sectors will both
produce average employment gains of 1.3% and 2.2% annually through 2018. We expect the
construction sector to come roaring back to life in 2015, boosting payrolls by 7.4% annually, on average.

Truckee Meadows Regional Planning September 2014
WASHOE COUNTY CONSENSUS FORECAST 2014-2034 Page 41
Housing:
After taking a severe beating during the housing crisis, home prices in Reno, like the rest of the state, are
rebounding. Indeed, home values have been appreciating at double-digit year-on-year (y/y) rates since
the middle of 2012. According to data from the Federal Housing Finance Agency, prices climbed 25.4%
y/y in the third quarter of 2013. Despite only anemic growth in the local labor market, dwindling
supplies of for-sale existing homes and limited new construction are pushing values up rapidly. Housing
starts picked up in 2013, when nearly 1,700 new homes were constructed, double the pace of 2012. This
year, we expect demand to quicken the pace of new homebuilding again to more than 2,500.
LO N G - T E R M O U T L O OK
Table 1 shows that we forecast employment growth in Washoe County to expand by an average rate of
2.2% between 2013 and 2018, with employment growth decelerating to 0.9% annually after 2023 as the
post recession boost tapers off. The highest long-term employment growth will be seen in the service
sectors. The personal income growth rate will remain steady over the 25-year forecast horizon at about
5%, although it could rise if economic development policies are able to attract additional high-paying
jobs to the region. Finally, we forecast that real gross county-level product will grow at an annual rate of
3.2% over the next five years. By comparison, the growth rate for Nevada's real GSP during that time will
be faster at 3.6%.
Table 2 presents a special population forecast prepared by IHS Economics for 2013 through 2038. Over
the next five years, we forecast an annual population growth rate of 0.8%, which is a departure from the
2.3% annual growth rate recorded between 1990 and 2013. Over the longer term, we forecast that total
population will also grow at an annual rate of 0.8% over the next 10 years, and by 1.0% over the 25-year
period between 2013 and 2038. The fastest-growing age cohorts over the next 25 years will be the over
85 years old, 80 to 84 years old, 75 to 79 years old, and 70 to 74 years old cohorts. By contrast, annual
population growth rates in the cohorts containing working age population between the ages of 25 and
55 will be much lower, with the highest growth rates in the 45 to 49 years old, and 50 to 54 years old
cohorts.

Truckee Meadows Regional Planning September 2014
WASHOE COUNTY CONSENSUS FORECAST 2014-2034 Page 42
As shown in Table 2, over the 25-year forecast period, we forecast that Reno's annual household growth
rate will be 1.1%, close to the population growth rate over the same period. However, between 2013
and 2018, the differential between the household and population growth rates will be greatest, with
households growing at 1.4% during this period compared to annual population growth of 0.8%. This
differential is due to the household size decreasing following the Great Recession. An improving housing
market will spur pent up demand for new units and in turn drive household growth as young adults
move out of their parent’s house, roommates disband to get their own residence, and homelessness
eases. After 2023, we forecast an average annual household growth rate of 1.1%, with the largest
growth rates occurring in the 65 years and older cohorts.
This space intentionally blank

Truckee Meadows Regional Planning September 2014
WASHOE COUNTY CONSENSUS FORECAST 2014-2034 Page 43
Appendix C
Woods and Poole Background Data

Truckee Meadows Regional Planning September 2014
WASHOE COUNTY CONSENSUS FORECAST 2014-2034 Page 44

Truckee Meadows Regional Planning September 2014
WASHOE COUNTY CONSENSUS FORECAST 2014-2034 Page 45

Truckee Meadows Regional Planning September 2014
WASHOE COUNTY CONSENSUS FORECAST 2014-2034 Page 46
The remainder of the Woods and Poole technical documentation is available upon
request.

Truckee Meadows Regional Planning September 2014
WASHOE COUNTY CONSENSUS FORECAST 2014-2034 Page 47
Appendix D
The Nevada State Demographer’s projections are developed using the Regional Economic Models,
Incorporated (REMI) model through 2032.
The REMI model is a comprehensive model that encompasses a wide range of demographic and
economic activity. It relates a region or set of regions to each other and the nation as whole. It also
comes with differing levels of industrial detail. The model is used by the Nevada Commission on
Economic Development, the Nevada Department of Administration, and the University of Nevada, Las
Vegas. The model used in producing these projections is a 17 region model with a breakdown into 23
industrial sectors. Documentation about the model can be found at
http://www.remi.com/support/documents.shtml.
The overall linkages of the REMI model are shown in Figure 1.

Truckee Meadows Regional Planning September 2014
WASHOE COUNTY CONSENSUS FORECAST 2014-2034 Page 48
The REMI model comes with a baseline forecast, what has come to be referred to as an out of the box
projection (see Appendix pages). The user can do things such as update employment for all sectors and
by specific sectors through what are called policy variables. For the most part, those kinds of changes
were made to the model in producing the projections. One area of concern in looking at the model was
the performance of the Population and Labor Supply Block which is illustrated in Figure 2.
Figure 2:
LIMITATIONS TO THE PROJECTIONS
REMI has a number of strengths. The model is under constant research and has been available for over
25 years. It has been examined and reviewed through peer-reviewed articles. The User Guide and other
information is available to anyone with a computer, that is much of the detail of their methodology is
publicly available. One of the major limitations with the model is that there is currently limited historic
data from which it is built. This is because of the change from the Standard Industrial Classification (SIC)
to the North American Industrial Classification System (NAICS) in 2001. Limited history limits the
amount of information that a model can be constructed from for portraying the area that is being
modeled. Another limit is that Nevada has a number of small counties as well as areas with limited
numbers of employees or employers in various economic sectors. This leads to missing information
through data suppression which REMI and this office has to then estimate values to substitute for that
missing information.
Also, REMI is built on federal data including the annual estimates that are done by the Census Bureau.
So any projections done within the model have to be re-based off of Nevada’s generated estimates.

Truckee Meadows Regional Planning September 2014
WASHOE COUNTY CONSENSUS FORECAST 2014-2034 Page 49
Appendix E
TMWA Forecast Memorandum – additional documentation should be requested from TMWA.

Truckee Meadows Regional Planning September 2014
WASHOE COUNTY CONSENSUS FORECAST 2014-2034 Page 50

Truckee Meadows Regional Planning September 2014
WASHOE COUNTY CONSENSUS FORECAST 2014-2034 Page 51

Truckee Meadows Regional Planning September 2014
WASHOE COUNTY CONSENSUS FORECAST 2014-2034 Page 52

Truckee Meadows Regional Planning September 2014
WASHOE COUNTY CONSENSUS FORECAST 2014-2034 Page 53

Truckee Meadows Regional Planning September 2014
WASHOE COUNTY CONSENSUS FORECAST 2014-2034 Page 54
Appendix F August 25, 2014
Calibration of Global Insight Employment Forecast
Jeremy M. Smith, GIS Coordinator - TMRPA
Background: The Global Insight Forecast is a key input to the Consensus Forecast (CF) as it provides a second
projection of job growth by sector when combined with data sourced from Woods and Poole. Local sources (e.g.
NV State Demographer) have only recently begun to publish sector-level employment forecasts and these will
likely be of great benefit in the next version of the CF. Nevertheless, for this rendition of the CF we have opted to
follow historic protocols largely due to the fact that this is the first time TMRPA has been responsible for the CF
process and document. Historically, these two outside sources of employment information have been more
closely aligned, however in this most recent delivery from Global Insight the disparities with Woods and Poole and
other 3rd
party employment data sources (e.g. Infogroup business points) were quite wide (c. 60k jobs).
After discussion with the NV State Demographer and staff from Global Insight it was determined that the base year
(2014) value for number of employees was principally determined using data from the U.S. Bureau of Labor and
Statistics Quarterly Census of Employment and Wages (BLS). Job counts done by BLS tally only covered employees
(i.e. jobs where unemployment insurance is paid) which leads to underestimation of total employment by omitting
many job types that are not required to pay into unemployment. Some notable examples include sole
proprietorships and part-time positions. Since this CF will be used to inform traffic demand modeling and other
regional planning efforts, it is imperative that we have an accounting of all jobs. Both Woods and Poole and the
NV State Demographer retrieve base data from the Bureau of Economic Analysis (BEA). The BEA uses a more
inclusive methodology, not limited to covered employment, for tallying jobs by sector and is therefore more
indicative of total jobs in the region.
Since the Consensus Forecast approach is basically an average of totals, we determined that averaging a subset of
jobs (i.e. Global Insight based on BLS) with a forecast based on all potential jobs would provide a spurious output
average. Thus, we concluded that a calibration process was required to factor up the base year estimation from
Global Insight to account for the disparity.
Methodology: In order to calibrate the Global Insight forecast we examined employee counts from both the
Bureau of Labor and Statistics (BLS) and Bureau of Economic Analysis (BEA) by sector for 2012, the most recently
available common year of reporting between the 2 sources (Table 1). Data listing employee counts by 2-digit (or
groups of 2-digit) NAICS sectors were acquired from both sources and compared by first calculating an absolute
difference and then by calculating the ratio of BLS jobs reported to those reported by BEA. Only NAICS 22
(Utilities) showed a negative relationship with the BEA count such that the BEA reported a fraction of jobs in that
sector when compared to the BLS count. The BEA counts were consistently higher and up to 4 times greater than
employee counts reported by BLS (e.g. NAICS 53 – Real estate and rental leasing).
We then used two approaches to determine a reasonable calibration factor from the comparison of these two
datasets. Our first approach factored the Global Insight data sector by sector using the included NAICS
designations and factors listed in Table 1. This created a calibrated total employment value of 262,621 jobs in
2014. We then created a second, calibrated value of 256,923 for year 2014 by applying a factor of 1.34 to the total
employment reported by Global Insight. The factor of 1.34 represents the ratio of total BEA employees to total BLS
employees reported in 2012.

Truckee Meadows Regional Planning September 2014
WASHOE COUNTY CONSENSUS FORECAST 2014-2034 Page 55
We opted to use the second approach because the ratio of total employment produced a more conservative
calibrated value for Global Insight employment in 2014. This more calibrated value was closer in numeric space to
the 2014 value reported by Woods and Poole as well as to the total employment values for 2013 from both the NV
State Demographer and our Infogroup business data points. We applied the 1.34 factor to the annual projection
values from Global Insight across the 20-year CF projection horizon. We then averaged the calibrated Global
Insight employment values with the employment values reported by Woods and Poole for each year until 2034 to
derive the yearly employment values to be reported in the 2014-2034 Consensus Forecast document. Since each
year was factored by the same value we expect very little change to the employment growth rate forecasted by
Global Insight and therefore maintain its validity in the consensus forecasting approach.
Table 1. Comparison of employment counts by industry sector from the Bureau of Labor and Statistics (BLS) and Bureau of Economic Analysis (BEA) for Washoe County, NV in 2012.
Washoe County, NV - North American Industry Classification System (NAICS) sectors
BLS Employee Count (2012)
1 BEA Employee Count (2012)
2 Difference Factor
NAICS 11 Agriculture, forestry, fishing and hunting 116 245 129 2.11
NAICS 21 Mining, quarrying, and oil and gas extraction 217 1160 943 5.35
NAICS 22 Utilities 711 491 -220 0.69
NAICS 23 Construction 8890 11618 2728 1.31
NAICS 31-33 Manufacturing 10949 11799 850 1.08
NAICS 42 Wholesale trade 8661 9661 1000 1.12
NAICS 44-45 Retail trade 21014 25303 4289 1.20
NAICS 48-49 Transportation and warehousing 11252 11849 597 1.05
NAICS 51 Information 2030 2832 802 1.40
NAICS 52 Finance and insurance 5386 14310 8924 2.66
NAICS 53 Real estate and rental and leasing 3306 15280 11974 4.62
NAICS 54 Professional and technical services 9660 16847 7187 1.74
NAICS 55 Management of companies and enterprises 2802 3015 213 1.08
NAICS 56 Administrative and waste services 13025 16640 3615 1.28
NAICS 61 Educational services 1867 2872 1005 1.54
NAICS 62 Health care and social assistance 20993 23119 2126 1.10
NAICS 71 Arts, entertainment, and recreation 5454 8059 2605 1.48
NAICS 72 Accommodation and food services 28559 29838 1279 1.04
NAICS 81 Other services, except public administration 5469 12064 6595 2.21
NAICS 92 Public administration 23172 28555 5383 1.23
Total 183608 245557 61949 1.34 1 http://www.bls.gov/cew/
2 http://www.bea.gov/itable
For more information please contact Jeremy M. Smith at Truckee Meadows Regional Planning Agency ([email protected], 775-321-8390)