Washoe County Behavioral Health Summary -...
43
Behavioral Health Summary – Healthy Communities Coalition December 2016 Office of Public Health Informatics and Epidemiology Division of Public and Behavioral Health Department of Health and Human Services Brian Sandoval Governor State of Nevada Richard Whitley, MS Director Department of Health and Human Services Cody L. Phinney, MPH Administrator Division of Public and Behavioral Health John M. DiMuro, DO Chief Medical Officer Division of Public and Behavioral Health
-
Upload
nguyenxuyen -
Category
Documents
-
view
214 -
download
0
Transcript of Washoe County Behavioral Health Summary -...

Behavioral Health Summary – Healthy Communities Coalition
December 2016
Office of Public Health Informatics and Epidemiology Division of Public and Behavioral Health
Department of Health and Human Services
Brian Sandoval Governor
State of Nevada
Richard Whitley, MS Director
Department of Health and Human Services
Cody L. Phinney, MPH Administrator
Division of Public and Behavioral Health
John M. DiMuro, DO Chief Medical Officer
Division of Public and Behavioral Health

1
Prepared By and Additional Information:
Division of Public and Behavioral Health
State of Nevada 4126 Technology Way, Suite 201 Carson City, Nevada 89706 (775) 684.5282
Thank you to following for providing leadership, data and technical support for this report:
Kyra Morgan, MS Chief Biostatistician Department of Health and Human Services State of Nevada
James Kuzhippala, MPH Biostatistician Division of Public and Behavioral Health State of Nevada
Andrea R. Rivers Health Program Manager II Division of Public and Behavioral Health State of Nevada
Joseph Rand, BA Health Resource Analyst Division of Public and Behavioral Health State of Nevada
2
Contents
Table 1. Selected demographics for Healthy Communities Coalition, and Nevada. ...................... 5
Figure 1. Healthy Communities Coalition, and Nevada populations by age group, 2015. ............ 6
Figure 2. Healthy Communities Coalition, and Nevada racial/ethnic breakdowns for 2015. ........ 7
Figure 3. Top 5 mental health clinic services for Healthy Communities Coalition residents with
number of patients served, 2010-2014. ........................................................................................... 8
Figure 4. Most Common Diagnosis among Healthy Communities Coalition residents, 2010-
2014................................................................................................................................................. 9
Figure 5. Healthy Communities Coalition residents who access mental health clinics city of
residence, 2010-2014. ................................................................................................................... 10
Table 2. Demographics of Healthy Communities Coalition residents who accessed state funded
adult mental health clinics, 2010-2014. ........................................................................................ 11
Figure 6. Number of Visits per Year for Select Mental Disorders, Healthy Communities
Coalition, 2009-2014. ................................................................................................................... 13
Table 3. Demographics of Healthy Communities Coalition resident visits to the ER for select
behavioral disorders 2009-2014. ................................................................................................... 14
Figure 7. Trend of Healthy Communities Coalition residents’ visits to ER for alcohol and drug-
related issues, 2009-2014. ............................................................................................................. 15
Table 4. Demographics of Healthy Communities Coalition resident visits to the ER for alcohol
and drug-related disorders, 2009-2014. ........................................................................................ 16
Figure 8. Trend of Healthy Communities Coalition visits to the ER for Suicides, 2009-2014. ... 17
Figure 9. Percentages of Healthy Communities Coalition resident visits to the ER for mental
health and substance-related disorders by payment source, 2009-2014. ...................................... 18
Figure 10. Trend of Healthy Communities Coalition inpatient admissions for select mental health
disorders, 2009-2014..................................................................................................................... 19
Table 5. Demographics of Healthy Communities Coalition resident inpatient admissions for top
four mental health disorders, 2009-2014. ..................................................................................... 21
Table 6. Demographics of Healthy Communities Coalition resident’s inpatient admissions by
suicide attempts, 2009-2014. ........................................................................................................ 22
Figure 11. Percentages of Healthy Communities Coalition resident inpatient admissions for
mental health and substance-related disorders by payment type, 2010-2014. .............................. 23
Figure 12. Average length of stay for Healthy Communities Coalition resident inpatient
admissions for mental health and substance-related disorders, 2009-2014. ................................. 24
3
Table 7. Top 5 substances by admissions to Nevada substance abuse treatment facilities, Lyon,
Mineral, and Storey County residents, 2010-2014. ...................................................................... 25
Figure 13. Trends of Healthy Communities Coalition residents in Nevada state funded substance
abuse treatment facilities by select substances, 2010-2014. ......................................................... 26
Table 8. Demographics of Healthy Communities Coalition residents in Nevada substance abuse
treatment facilities, 2010-2014. .................................................................................................... 27
Figure 14. Prenatal substance abuse birth rate (self-reported), Healthy Communities Coalition,
2010-2014. .................................................................................................................................... 28
Figure 15. Immediate cause of death by suicide, Healthy Communities Coalition, 2010-2014
(n=96). ........................................................................................................................................... 29
Figure 16. Trend of Mental and Behavioral Disorders Deaths, Healthy Communities Coalition,
2010-2014. .................................................................................................................................... 30
Figure 17. Trend of substance-related deaths, Healthy Communities Coalition, 2010-2014. ...... 30
Table 9. Demographics of Substance Related Deaths, Healthy Communities Coalition, 2010-
2014............................................................................................................................................... 31
Figure 18. 2011-2014 BRFSS: Percentage of adult Lyon, Mineral, and Storey County residents
who used illegal substances, or painkillers ‘to get high,’ in the last 30 days (aggregate 2011-2014
data)............................................................................................................................................... 32
Figure 19. 2011-2014 BRFSS: Percentages of adult Lyon, Mineral, and Storey County residents
who are considered “heavy drinkers” - more than one drink (females) or two drinks (males) per
day. ................................................................................................................................................ 33
Figure 20. Percentages of how often adult Lyon, Mineral, and Storey County residents have felt
depressed in the past 30 days, 2012-2014. .................................................................................... 33
Figure 21. 2012-2014 BRFSS: Percentages of adult Lyon, Mineral, and Storey residents who
agree that with treatment, people with a mental illness can live normal lives. ............................. 34
Figure 22. 2012-2014 BRFSS: Percentages of adult Lyon, Mineral, and Storey residents who
have experienced the following mental health concerns in the past 30 days. ............................... 35
Figure 23. 2012-2014 BRFSS: Percentages of adult Lyon, Mineral, and Storey residents who
experienced that a mental health condition or emotional problem kept them from doing their
work or other usual activities, by number of days. ....................................................................... 36
Figure 24. 2012-2014 BRFSS: Percentages of adult Lyon, Mineral, and Storey residents who are
taking medication or receiving treatment for any type of mental health condition or emotional
problem. ........................................................................................................................................ 36
4
Figure 25. Percentages of high school students’ mental health status (last 12 months), Healthy
Communities Coalition, 2015. ...................................................................................................... 37
Figure 26. Percentages of High School Students Current Tobacco Use, Healthy Communities
Coalition, 2015. ............................................................................................................................. 38
Figure 27. Percentages of High School Students - Alcohol Behavior Summary, Healthy
Communities Coalition, 2015. ...................................................................................................... 38
Figure 28. Percentages of High School Students - Marijuana Behavior Summary, Healthy
Communities Coalition, 2015. ...................................................................................................... 39
Figure 29. Percentages of High School Students Nonprescription Substance Use Summary,
Healthy Communities Coalition, 2015. ........................................................................................ 39
Figure 30. Percentages of High School Students - Substance Abuse Summary, Healthy
Communities Coalition, 2015. ...................................................................................................... 40
Figure 31. High School Graduation Rates, Lyon, Mineral, and Storey County, 2011 – 2015 by
Class Cohort. ................................................................................................................................. 41

5
Demographic Snapshot
Table 1. Selected demographics for Healthy Communities Coalition, and Nevada.
Lyon Mineral Storey Nevada
Population, 2015 estimate* 54,078 4,610 4,044 2,874,075
Population, 2010 estimate* 52,274 4,765 4,017 2,705,845
Population, percent change* 3.5% -3.3% 0.7% 6.2%
Male persons, estimated percent 2015* 50.3% 50.2% 50.4% 50.3%
Female persons, estimated percent 2015* 49.7% 49.8% 49.6% 49.7%
Land area (square miles), 2010** 2,001 3,753 263 109,781
Median household income** $47,143 $38,664 $64,835 $52,800
Persons below poverty level, percent** 13.7% 19.0% 8.4% 15.0%
*Source: Nevada State Demographer’s Office
**Source: US Census Bureau
In 2015, the estimated population for Lyon County, Nevada was 54,078, a 3.5% increase from
the 2010 estimated population. The population is made up of approximately 50% males and
50% females. The median household income is $47,143 with approximately 14% of the
population living below the poverty level. Lyon County’s land area is approximately 2,001
square miles and represents 1.8% of Nevada’s total land area.
In 2015, the estimated population for Mineral County, Nevada was 4,610, a 3.3% decrease from
the 2010 estimated population. The population is made up of approximately 50% males and
50% females. The median household income is $38,664 with approximately 19% of the
population living below the poverty level. Mineral County’s land area is approximately 3,753
square miles and represents 3.4% of Nevada’s total land area.
In 2015, the estimated population for Storey County, Nevada was 4,044, a 0.7% increase from
the 2010 estimated population. The population is made up of approximately 50% males and
50% females. The median household income is $64,835 with approximately 8.4% of the
population living below the poverty level. Storey County’s land area is approximately 263
square miles and represents 0.2% of Nevada’s total land area.
6
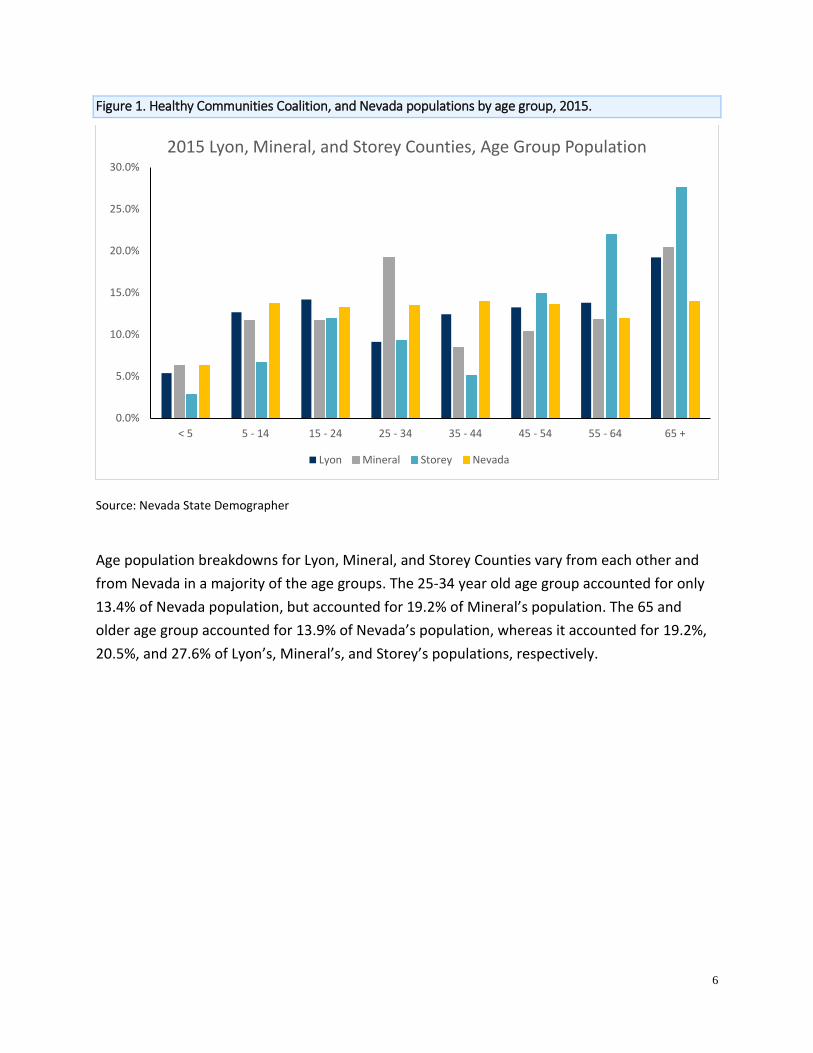
Figure 1. Healthy Communities Coalition, and Nevada populations by age group, 2015.
Source: Nevada State Demographer
Age population breakdowns for Lyon, Mineral, and Storey Counties vary from each other and
from Nevada in a majority of the age groups. The 25-34 year old age group accounted for only
13.4% of Nevada population, but accounted for 19.2% of Mineral’s population. The 65 and
older age group accounted for 13.9% of Nevada’s population, whereas it accounted for 19.2%,
20.5%, and 27.6% of Lyon’s, Mineral’s, and Storey’s populations, respectively.
0.0%
5.0%
10.0%
15.0%
20.0%
25.0%
30.0%
< 5 5 - 14 15 - 24 25 - 34 35 - 44 45 - 54 55 - 64 65 +
2015 Lyon, Mineral, and Storey Counties, Age Group Population
Lyon Mineral Storey Nevada
7
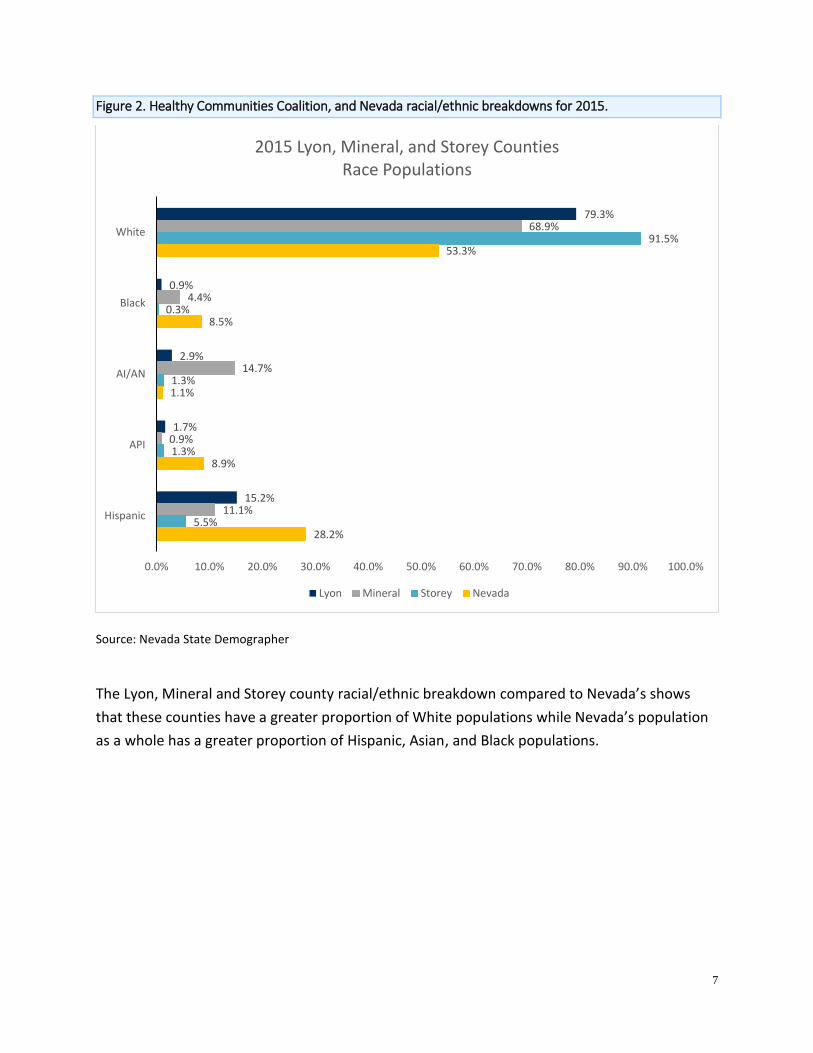
Figure 2. Healthy Communities Coalition, and Nevada racial/ethnic breakdowns for 2015.
Source: Nevada State Demographer
The Lyon, Mineral and Storey county racial/ethnic breakdown compared to Nevada’s shows
that these counties have a greater proportion of White populations while Nevada’s population
as a whole has a greater proportion of Hispanic, Asian, and Black populations.
79.3%
0.9%
2.9%
1.7%
15.2%
68.9%
4.4%
14.7%
0.9%
11.1%
91.5%
0.3%
1.3%
1.3%
5.5%
53.3%
8.5%
1.1%
8.9%
28.2%
0.0% 10.0% 20.0% 30.0% 40.0% 50.0% 60.0% 70.0% 80.0% 90.0% 100.0%
White
Black
AI/AN
API
Hispanic
2015 Lyon, Mineral, and Storey CountiesRace Populations
Lyon Mineral Storey Nevada
8
Mental Health Clinics The data in this section comes from Avatar, an electronic mental health medical record system
used by the Division of Public and Behavioral Health (DPBH). DPBH is the largest provider of
mental health services in Nevada. In northern Nevada, DPBH clinics are categorized as Northern
Nevada Adult Mental Health Services (NNAMHS).
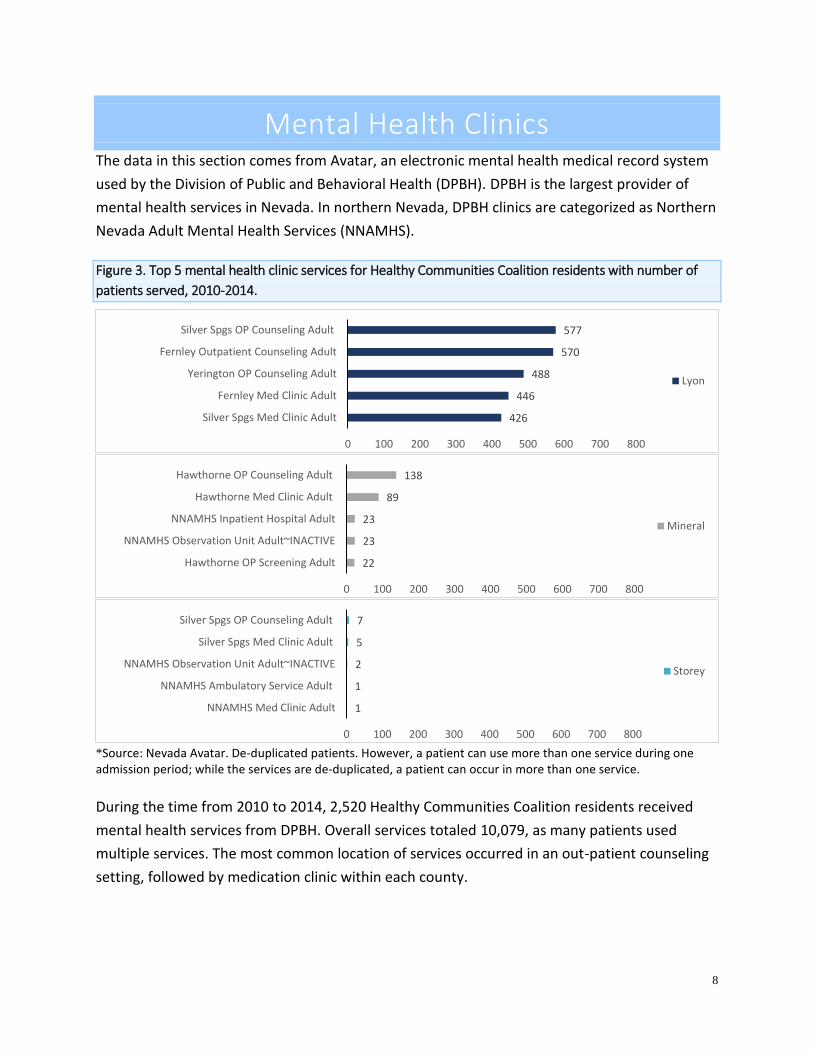
Figure 3. Top 5 mental health clinic services for Healthy Communities Coalition residents with number of
patients served, 2010-2014.
*Source: Nevada Avatar. De-duplicated patients. However, a patient can use more than one service during one admission period; while the services are de-duplicated, a patient can occur in more than one service.
During the time from 2010 to 2014, 2,520 Healthy Communities Coalition residents received
mental health services from DPBH. Overall services totaled 10,079, as many patients used
multiple services. The most common location of services occurred in an out-patient counseling
setting, followed by medication clinic within each county.
577
570
488
446
426
0 100 200 300 400 500 600 700 800
Silver Spgs OP Counseling Adult
Fernley Outpatient Counseling Adult
Yerington OP Counseling Adult
Fernley Med Clinic Adult
Silver Spgs Med Clinic Adult
Lyon
138
89
23
23
22
0 100 200 300 400 500 600 700 800
Hawthorne OP Counseling Adult
Hawthorne Med Clinic Adult
NNAMHS Inpatient Hospital Adult
NNAMHS Observation Unit Adult~INACTIVE
Hawthorne OP Screening Adult
Mineral
7
5
2
1
1
0 100 200 300 400 500 600 700 800
Silver Spgs OP Counseling Adult
Silver Spgs Med Clinic Adult
NNAMHS Observation Unit Adult~INACTIVE
NNAMHS Ambulatory Service Adult
NNAMHS Med Clinic Adult
Storey
9
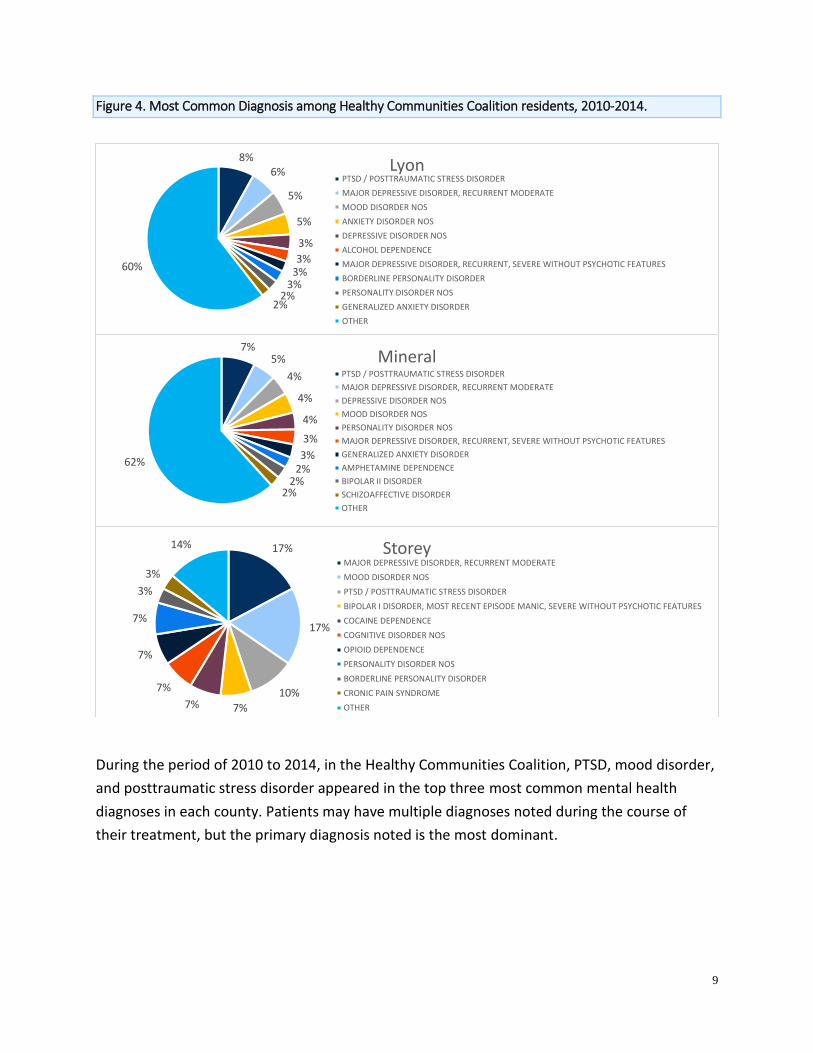
Figure 4. Most Common Diagnosis among Healthy Communities Coalition residents, 2010-2014.
During the period of 2010 to 2014, in the Healthy Communities Coalition, PTSD, mood disorder,
and posttraumatic stress disorder appeared in the top three most common mental health
diagnoses in each county. Patients may have multiple diagnoses noted during the course of
their treatment, but the primary diagnosis noted is the most dominant.
8%6%
5%
5%
3%
3%3%
3%2%
2%
60%
LyonPTSD / POSTTRAUMATIC STRESS DISORDER
MAJOR DEPRESSIVE DISORDER, RECURRENT MODERATE
MOOD DISORDER NOS
ANXIETY DISORDER NOS
DEPRESSIVE DISORDER NOS
ALCOHOL DEPENDENCE
MAJOR DEPRESSIVE DISORDER, RECURRENT, SEVERE WITHOUT PSYCHOTIC FEATURES
BORDERLINE PERSONALITY DISORDER
PERSONALITY DISORDER NOS
GENERALIZED ANXIETY DISORDER
OTHER
7%5%
4%
4%
4%
3%
3%2%
2%2%
62%
MineralPTSD / POSTTRAUMATIC STRESS DISORDER
MAJOR DEPRESSIVE DISORDER, RECURRENT MODERATE
DEPRESSIVE DISORDER NOS
MOOD DISORDER NOS
PERSONALITY DISORDER NOS
MAJOR DEPRESSIVE DISORDER, RECURRENT, SEVERE WITHOUT PSYCHOTIC FEATURES
GENERALIZED ANXIETY DISORDER
AMPHETAMINE DEPENDENCE
BIPOLAR II DISORDER
SCHIZOAFFECTIVE DISORDER
OTHER
17%
17%
10%
7%7%
7%
7%
7%
3%
3%
14% StoreyMAJOR DEPRESSIVE DISORDER, RECURRENT MODERATE
MOOD DISORDER NOS
PTSD / POSTTRAUMATIC STRESS DISORDER
BIPOLAR I DISORDER, MOST RECENT EPISODE MANIC, SEVERE WITHOUT PSYCHOTIC FEATURES
COCAINE DEPENDENCE
COGNITIVE DISORDER NOS
OPIOID DEPENDENCE
PERSONALITY DISORDER NOS
BORDERLINE PERSONALITY DISORDER
CRONIC PAIN SYNDROME
OTHER

10
Figure 5. Healthy Communities Coalition residents who access mental health clinics city of residence, 2010-
2014.
Of the county residents in the Healthy Communities Coalition accessing DPBH mental health
services between 2010 and 2014, populations reside within multiple cities in each county. 36%
of Lyon residents resided in Fernley, 87% of Mineral resided in Hawthorne, and 50% of Storey
resided in Virginia City.
36%23% 18% 15%
8%
87%
6% 3% 1% 3%
50%
25% 25%
0%
20%
40%
60%
80%
100%Fe
rnle
y
Yeri
ngt
on
Silv
er S
pri
ngs
Day
ton
Oth
er/
Un
kno
wn
Haw
tho
rne
Sch
urz
Wal
ker
Lake
Min
a
Oth
er/
Un
kno
wn
/In
valid
Vir
gin
ia C
ity
Day
ton
Go
ld H
ill
Lyon Mineral Storey

11
Table 2. Demographics of Healthy Communities Coalition residents who accessed state funded adult mental
health clinics, 2010-2014.
2010 2011 2012 2013 2014
Sex
Female 572 582 518 570 697
Male 349 349 342 365 437
Unknown 4 1 3 4 2
Total 925 932 863 939 1136
Age
0-17 173 174 169 192 239
18-30 162 168 153 172 214
31-50 348 362 299 317 391
51-65 208 203 213 227 243
66-100 34 25 29 31 49
Unknown 0 0 0 0 0
Total 925 932 863 939 1136
Race
White 746 736 691 711 792
Black 13 14 10 14 14
Asian 5 6 8 8 6
Alaskan Native/American Indian 11 13 10 16 16
Native Hawaiian/Pacific Islander 5 3 4 4 4
Two or more races 22 29 27 31 43
Other 34 29 23 29 35
Unknown 89 102 90 126 226
No Entry 0 0 0 0 0
Total 925 932 863 939 1136
Ethnicity
Hispanic or Latino 54 47 45 43 46
Not Hispanic or Latino 728 741 691 716 641
Unknown/No Entry 143 144 127 180 449
Total 925 932 863 939 1136
Education
=< 12th Grade - No Diploma 266 247 234 248 275
High School Graduate 194 188 197 218 256
GED 79 86 68 82 75
Some College 150 155 142 133 157
Undergraduate Degree 28 24 20 11 18
Graduate Degree 16 21 16 18 14
No Formal Education 8 11 7 10 16
Other 184 200 179 219 325
Total 925 932 863 939 1136
12
During the 5-year period of 2010 to 2014, there were 2,520 Healthy Communities Coalition adult
residents that accessed mental and/or behavioral health services from DPBH state funded facilities.
The totals in Table 2 above equal 4,795, reflecting that the some individuals used DPBH services
during more than one year. Females comprised 61% of the patient population and males comprised
38%. White non-Hispanic made up 77% of the population. The most populous age group was the 31-
50 year olds, accounting for 36% of the patients. Patients with less than 12th grade education or no
diploma accounted for 27% of the patients, followed by “Other” (23%).
Hospital Emergency Room Data The data provided in this section are from the hospital emergency room (ER) billing data compiled by
the University of Nevada, Las Vegas, Center for Health Information Analysis (CHIA). The data are
based on visits, not patients, therefore a single person may represent multiple visits. The ER data are
broken into three parts: mental conditions (anxiety, PTSD, suicidal ideations, etc.), suicide attempts by
method (hanging, jumping, firearms, etc.) and alcohol and drug-related visits.
The following ICD-9 codes were used for analysis of mental disorders: anxiety 300.00-300.09;
depression 296.20-296.36, and 311.00; bipolar disorder 296.40-296.89; PTSD 309.81; schizophrenia
295.00-295.90 and V11.0; suicidal tendencies 300.90; suicidal ideation V62.84.
The following ICD-9 codes were used for analysis of suicide attempts by method: suicide by solid or
liquid E950-E950.9; suicide by gases in domestic use E951-E951.8; suicide by other gases and vapors
E952-E952.9; suicide by hanging, strangulation and suffocation E953-E953.9; suicide by drowning
E954; suicide by firearms, air guns and explosives E955-E955.9; suicide by cutting and piercing
instrument E956; suicide by jumping from high place E957-E957.9; suicide by other unspecified means
E958-E958.9.
The following ICD-9 codes were used for analysis of alcohol-related admissions: 291-291.9, 303-
303.93, 305.0-305.03, 535.3-353.31, 571-571.3, 980-980.9, 357.5, 425.5, 790.3, and E860-E860.9.
The following ICD-9 codes were used for analysis of substance-related admissions: 292-292.9, 304-
304.93, 305.2-305.93, 965-965.99, and 967-970.99
There were a total of 10,440 visits related to mental health and substance use disorders among
Healthy Communities Coalition residents between 2009 and 2014 for the reasons listed above. Since
an individual can have more than one diagnosis during a single ER visit, the following numbers reflect
the number of times a diagnosis in each of these categories was given, and therefore the following
numbers are not mutually exclusive. Diagnoses related to mental disorders occurred in 7,057 ER
13
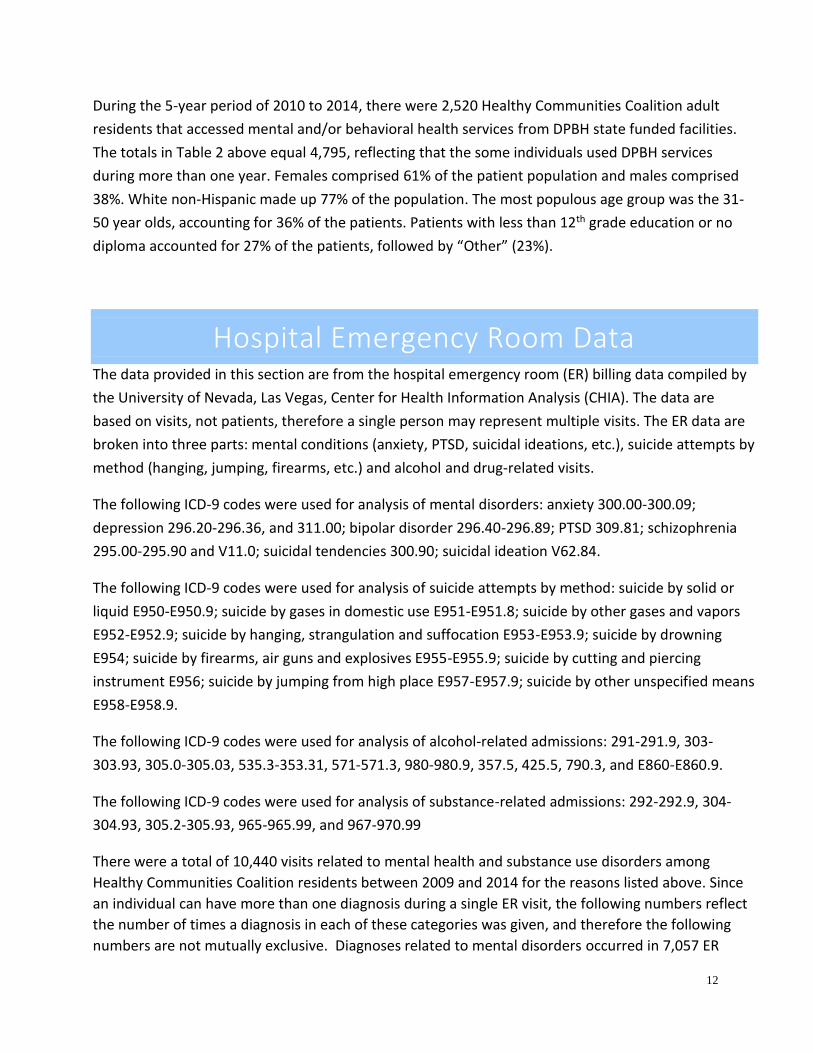
visits, there were 2,513 ER visits related to alcohol-related issues, 2,152 ER visits with diagnoses for
drug-related issues, and 326 ER visit with diagnoses codes related to suicide attempts.
Figure 6. Number of Visits per Year for Select Mental Disorders, Healthy Communities Coalition, 2009-2014.
Anxiety is the most common mental disorder seen in the emergency rooms (ER) among Healthy
Communities Coalition residents, related to for 49.4% of the 7,052 visits in the categories listed in
Figure 6. The number of anxiety-related ER visits increased 136% from 2009 to 2014. The largest
percent increase was among patient visits for issues related to PTSD which increased 429% with 17
visits in 2009 to 90 in 2014. All visits for the selected mental disorders increased over the six year
period.
0
100
200
300
400
500
600
700
800
900
2009 2010 2011 2012 2013 2014
Anxiety Disorder Depression Bipolar Disorder PTSD
Schizophrenia Suicidal Tendencies Suicidal Ideation

14
Table 3. Demographics of Healthy Communities Coalition resident visits to the ER for select behavioral disorders
2009-2014.
Condition* Female Male Unknown Total
N Row % N Row % N Row %
Anxiety 2,507 72.0% 977 28.0% 0 0.0% 3,484
Depression 1,767 70.5% 740 29.5% 0 0.0% 2,507
Bipolar 774 69.6% 338 30.4% 0 0.0% 1,112
PTSD 182 62.1% 111 37.9% 0 0.0% 293
Schizophrenia 195 59.1% 135 40.9% 0 0.0% 330
Suicidal Tendencies 120 57.1% 90 42.9% 0 0.0% 210
Suicidal Ideation 293 53.4% 256 46.6% 0 0.0% 549
Alcohol Related 952 37.9% 1,561 62.1% 0 0.0% 2,513
Substance Abuse Related 1,166 54.2% 986 45.8% 0 0.0% 2,152
Suicide - Solid or Liquid 127 75.6% 41 24.4% 0 0.0% 168
Suicide - Gases in Domestic Use 0 0.0% 1 100.0% 0 0.0% 1
Suicide - Other Gases and Vapors 0 0.0% 1 100.0% 0 0.0% 1
Suicide - Hanging, Strangulation, & Suffocation
2 22.2% 7 77.8% 0 0.0% 9
Suicide - Cutting & Piercing Instrument 78 67.2% 38 32.8% 0 0.0% 116
Suicide - Firearms, Air Guns, & Explosives 1 16.7% 5 83.3% 0 0.0% 6
Suicide - Jumping from High Place 1 100.0% 0 0.0% 0 0.0% 1
Suicide - Other Unspecified Means 16 57.1% 12 42.9% 0 0.0% 28
*Categories are not mutually exclusive
Females made up the majority of Healthy Communities Coalition residents who visited the ER for
anxiety (72%), depression (70%), bipolar (70%), PTSD (62%), and schizophrenia (59%).
15
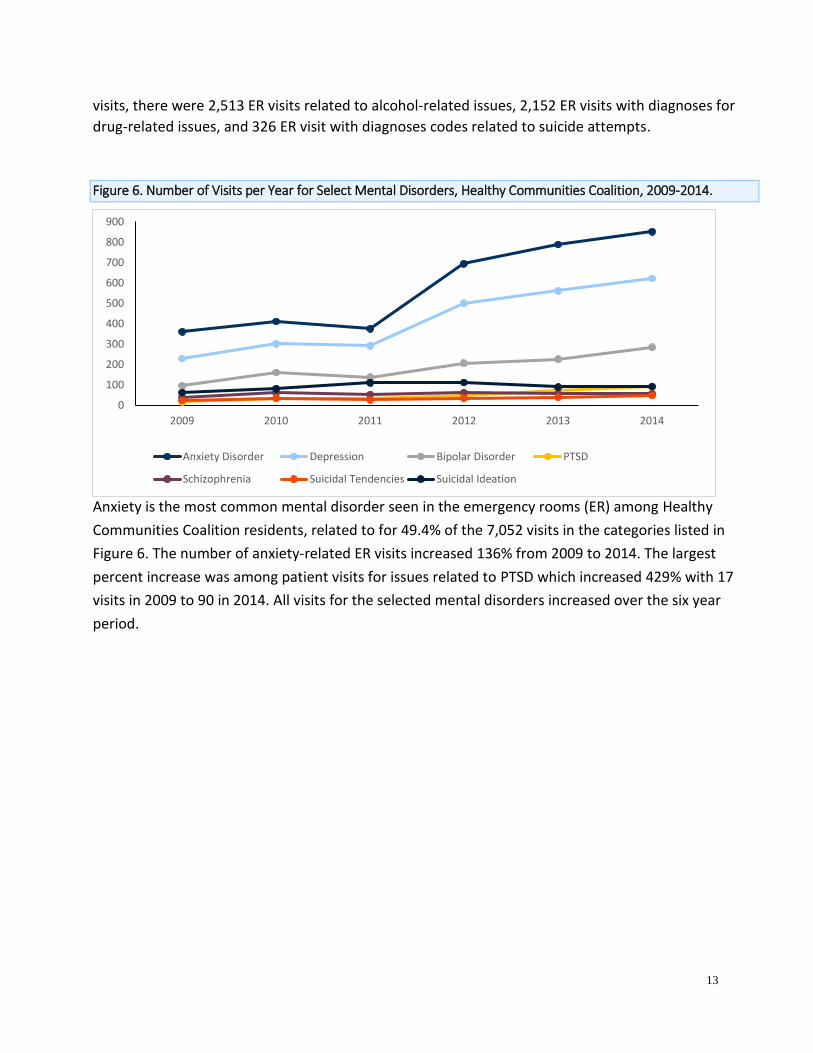
Figure 7. Trend of Healthy Communities Coalition residents’ visits to ER for alcohol and drug-related issues, 2009-
2014.
Healthy Communities Coalition ER visits increased for both alcohol-related and substance
abuse-related issues from 2009 to 2014. Alcohol-related visits increased from 408 visits in
2009 to 486 visits in 2014, a 19% increase. Drug-related increased from 263 visits in 2009 to a
high of 564 visits in 2014, a 114% increase.
0
100
200
300
400
500
600
2009 2010 2011 2012 2013 2014
Alcohol-Related Substance Abuse-Related
16
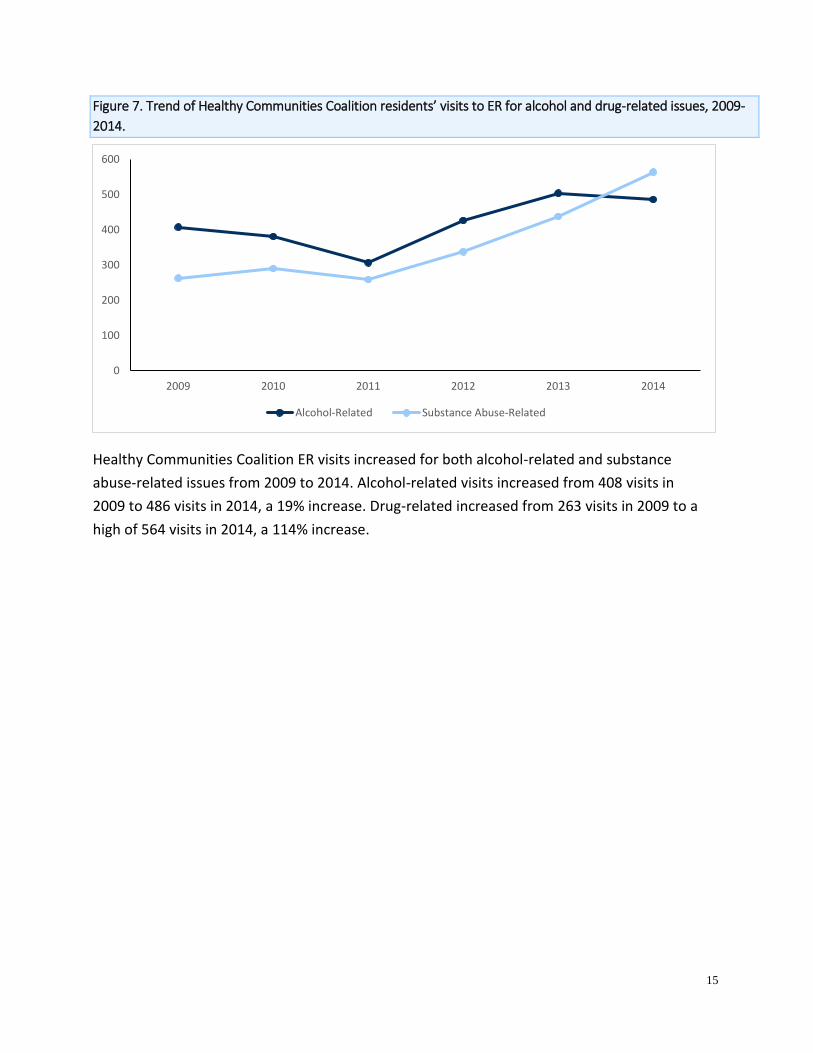
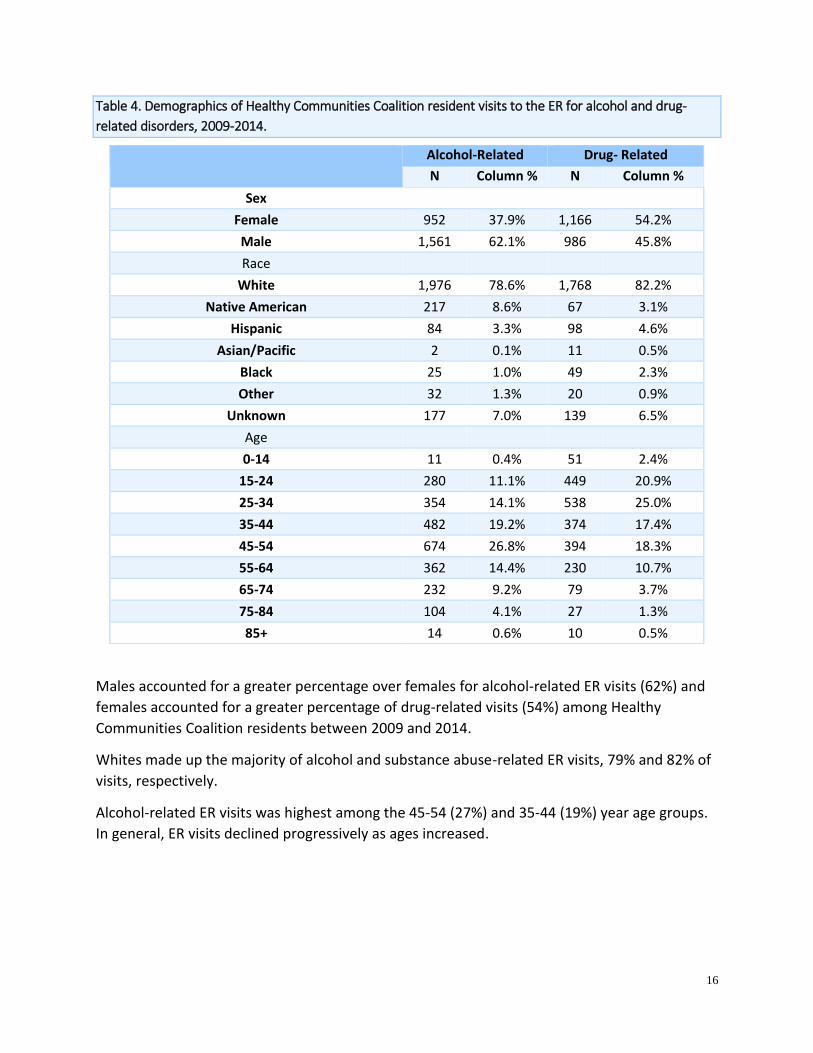
Table 4. Demographics of Healthy Communities Coalition resident visits to the ER for alcohol and drug-
related disorders, 2009-2014.
Males accounted for a greater percentage over females for alcohol-related ER visits (62%) and
females accounted for a greater percentage of drug-related visits (54%) among Healthy
Communities Coalition residents between 2009 and 2014.
Whites made up the majority of alcohol and substance abuse-related ER visits, 79% and 82% of
visits, respectively.
Alcohol-related ER visits was highest among the 45-54 (27%) and 35-44 (19%) year age groups.
In general, ER visits declined progressively as ages increased.
Alcohol-Related Drug- Related
N Column % N Column %
Sex
Female 952 37.9% 1,166 54.2%
Male 1,561 62.1% 986 45.8%
Race
White 1,976 78.6% 1,768 82.2%
Native American 217 8.6% 67 3.1%
Hispanic 84 3.3% 98 4.6%
Asian/Pacific 2 0.1% 11 0.5%
Black 25 1.0% 49 2.3%
Other 32 1.3% 20 0.9%
Unknown 177 7.0% 139 6.5%
Age
0-14 11 0.4% 51 2.4%
15-24 280 11.1% 449 20.9%
25-34 354 14.1% 538 25.0%
35-44 482 19.2% 374 17.4%
45-54 674 26.8% 394 18.3%
55-64 362 14.4% 230 10.7%
65-74 232 9.2% 79 3.7%
75-84 104 4.1% 27 1.3%
85+ 14 0.6% 10 0.5%

17
Figure 8. Trend of Healthy Communities Coalition visits to the ER for Suicides, 2009-2014.
Overall number of visits to the ER for suicide among Healthy Communities Coalition residents
has decreased by 17% from 2009-2014, from 59 visits in 2009 to 49 in 2014. The lowest number
was in 2012 with 43 visits.
Suicide by solid or liquid was the top method of suicide and suicide attempts resulting in an ER
visit in Healthy Communities Coalition, accounting for 52% of all suicide-related ER visits from
2009-2014. In 2009, there were 46 ER visits resulting from suicide by solid or liquid and 20
visits in 2014, a decrease of 53%. The high was in 2009 with 43 visits. Suicide by solid or liquid
includes all suicides where an individual entered liquid into his or her body, such as alcohols
(ethanol, butanol, propanol, and methanol), fuel oil, petroleum, pesticides, herbicides, paints,
dyes, and glues; or solids such as prescription pills and illegal drugs.
The second most common suicide ER visit was for those involving cutting and piercing
instruments, accounting for 36% of all suicide-related visits from 2009-2014. The high 28 visits
in 2013 and the low was 12 visits in 2009 and 2012.
0
5
10
15
20
25
30
35
40
45
50
2009 2010 2011 2012 2013 2014
Nu
mb
er o
f ER
Vis
its
Suicide - Solid or Liquid Suicide - Gases in Domestic Use
Suicide-Other Gases and Vapors Suicide - Hanging, Strangulation, Suffocation
Suicide - Cutting & Piercing Instrument Suicide - Firearms, Air Guns, Explosives
Suicide - Jumping from High Place Suicide - Other Specified Means

18
Figure 9. Percentages of Healthy Communities Coalition resident visits to the ER for mental health and
substance-related disorders by payment source, 2009-2014.
Nevada Medicare accounted for 25% of sources of payment for ER visits among Healthy
Communities Coalition residents with mental health and substance-related disorders. Medicaid
accounted for 20% of payment types, Self-Pay represented 15%, and PPO represented 14%.
22%
4%
2%
19%
1%
15%
2%
8%
14%
4%
2%1%
3%
0% 0%
3%
Medicare
Charity
CHAMPUS OR CHAMPVA
Nevada Medicaid
Other Medicaid
Self Pay
Miscellaneous
Commercial Insurer
Negotiated Discounts e.g. PPO
HMO
County Indigent Referral
All Workers Compensation e.g. (SIIS)
Medicare HMO
Nevada Medicaid HMO
Unknown
Not Provided
19
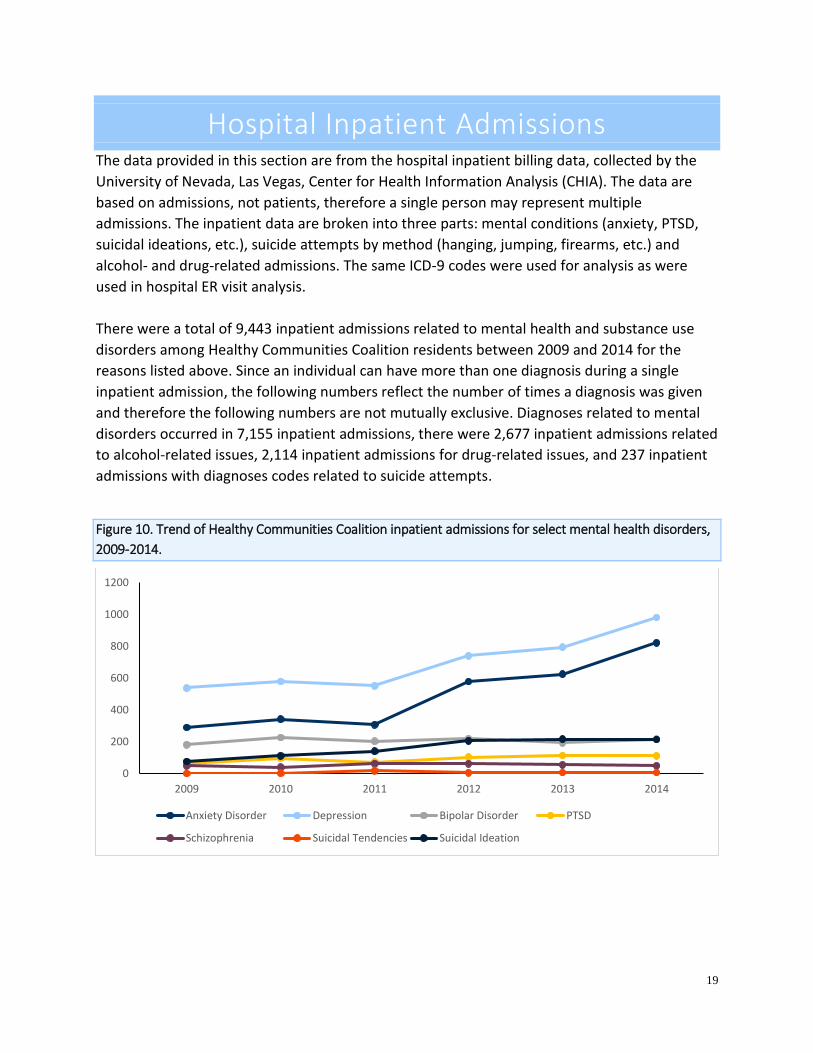
Hospital Inpatient Admissions The data provided in this section are from the hospital inpatient billing data, collected by the
University of Nevada, Las Vegas, Center for Health Information Analysis (CHIA). The data are
based on admissions, not patients, therefore a single person may represent multiple
admissions. The inpatient data are broken into three parts: mental conditions (anxiety, PTSD,
suicidal ideations, etc.), suicide attempts by method (hanging, jumping, firearms, etc.) and
alcohol- and drug-related admissions. The same ICD-9 codes were used for analysis as were
used in hospital ER visit analysis.
There were a total of 9,443 inpatient admissions related to mental health and substance use
disorders among Healthy Communities Coalition residents between 2009 and 2014 for the
reasons listed above. Since an individual can have more than one diagnosis during a single
inpatient admission, the following numbers reflect the number of times a diagnosis was given
and therefore the following numbers are not mutually exclusive. Diagnoses related to mental
disorders occurred in 7,155 inpatient admissions, there were 2,677 inpatient admissions related
to alcohol-related issues, 2,114 inpatient admissions for drug-related issues, and 237 inpatient
admissions with diagnoses codes related to suicide attempts.
Figure 10. Trend of Healthy Communities Coalition inpatient admissions for select mental health disorders,
2009-2014.
0
200
400
600
800
1000
1200
2009 2010 2011 2012 2013 2014
Anxiety Disorder Depression Bipolar Disorder PTSD
Schizophrenia Suicidal Tendencies Suicidal Ideation
20
Depression was the most common mental health disorder for inpatient admissions for Healthy
Communities Coalition residents between 2009 and 2014, related to for 58% of the admissions
from the disorders listed above in Figure 10. Depression inpatient admissions has increased
from 538 admissions in 2009 to 981 in 2014, an 82% increase.
Anxiety was the second most common mental health disorder seen in inpatient admissions.
Inpatient admissions has increased steadily over the six year period, from 290 admissions in
2009 to 822 in 2014, a 183% increase.
Bipolar disorder is the third most common mental health disorder seen in inpatient admissions
among Healthy Communities Coalition residents, related to 17% of admissions for the mental
health conditions listed in Figure 10. There was a 19% increase from 2009 to 2014.
Inpatient admissions for suicidal tendencies experienced the greatest percent change from
2009 to 2014 with a 500% increase. The inpatient admission counts increased from 1 in 2009 to
6 in 2014.
21
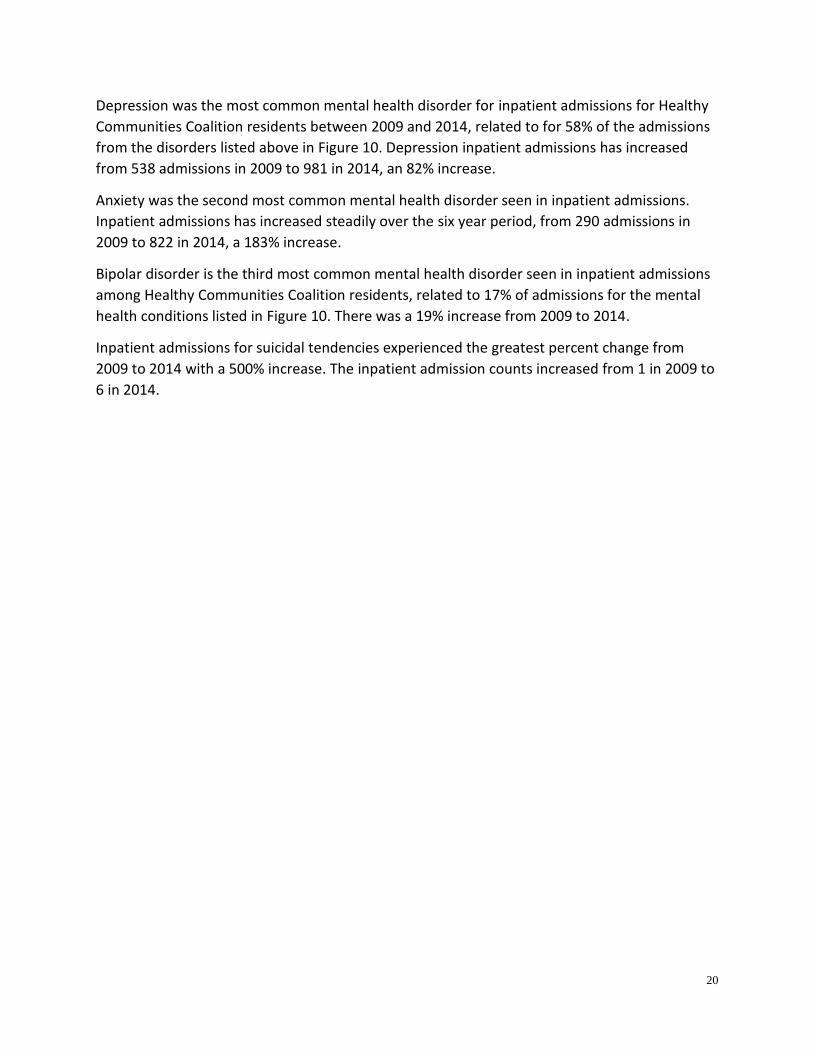
Table 5. Demographics of Healthy Communities Coalition resident inpatient admissions for top four mental
health disorders, 2009-2014.
Inpatient Depression Anxiety Bipolar Suicidal Ideation
N Column %
N Column %
N Column %
N Column %
Sex
Female 2,765 66.1% 2,078 70.1% 922 74.3% 590 61.3%
Male 1,416 33.9% 886 29.9% 319 25.7% 373 38.7%
Race
White 3,308 79.1% 2,445 82.5% 854 68.8% 455 47.2%
Black 38 0.9% 26 0.9% 4 0.3% 5 0.5%
Native American 81 1.9% 49 1.7% 18 1.5% 27 2.8%
Asian/Pacific 14 0.3% 11 0.4% 4 0.3% 3 0.3%
Hispanic 93 2.2% 65 2.2% 30 2.4% 15 1.6%
Other 48 1.1% 36 1.2% 17 1.4% 31 3.2%
Unknown 599 14.3% 332 11.2% 314 25.3% 427 44.3%
Age
0-14 91 2.2% 40 1.3% 44 3.5% 67 7.0%
15-24 390 9.3% 186 6.3% 164 13.2% 271 28.1%
25-34 301 7.2% 254 8.6% 151 12.2% 118 12.3%
35-44 407 9.7% 313 10.6% 215 17.3% 140 14.5%
45-54 620 14.8% 478 16.1% 241 19.4% 152 15.8%
55-64 849 20.3% 600 20.2% 267 21.5% 125 13.0%
65-74 835 20.0% 603 20.3% 119 9.6% 55 5.7%
75-84 488 11.7% 347 11.7% 36 2.9% 29 3.0%
85+ 200 4.8% 143 4.8% 4 0.3% 6 0.6%
Females accounted for a greater percent of inpatient admissions over males for the top mental
health disorders in Healthy Communities Coalition, ranging from 62% of admissions for suicidal
ideations to 75% of bipolar admissions.
A majority of inpatient admissions are white, such as with depression admissions (79%), anxiety
admissions (83%), and bipolar (69%). There is a relatively large portion of “unknown” races for
all selected mental health disorders, especially for admissions for suicidal ideation where
unknown accounts for 44% of all admissions.
The largest age groups varied depending on the mental health disorder. Residents 55-74
accounted for the most admissions in depression and anxiety, 45-64 in bipolar, and 15-24 in
suicidal ideation.

22
Table 6. Demographics of Healthy Communities Coalition resident’s inpatient admissions by suicide
attempts, 2009-2014.
Inpatient
Solid or Liquid Cutting and Piercing Instrument
Firearms, Air Guns and Explosives
N Column %
N Column %
N Column %
Sex
Female 116 61.4% 24 75.0% 2 18.2%
Male 73 38.6% 8 25.0% 9 81.8%
Race
White 158 83.6% 24 75.0% 8 72.7%
Black 4 2.1% 0 0.0% 0 0.0%
Native American 8 4.2% 3 9.4% 1 9.1%
Asian/Pacific 2 1.1% 0 0.0% 0 0.0%
Hispanic 11 5.8% 2 6.3% 0 0.0%
Other 3 1.6% 0 0.0% 0 0.0%
Unknown 3 1.6% 3 9.4% 2 18.2%
Age
0-14 3 1.6% 0 0.0% 0 0.0%
15-24 28 14.8% 4 12.5% 0 0.0%
25-34 31 16.4% 9 28.1% 2 18.2%
35-44 26 13.8% 5 15.6% 3 27.3%
45-54 45 23.8% 7 21.9% 4 36.4%
55-64 37 19.6% 5 15.6% 0 0.0%
65-74 16 8.5% 1 3.1% 0 0.0%
75-84 3 1.6% 1 3.1% 1 9.1%
85+ 0 0.0% 0 0.0% 1 9.1%
Females led in suicide attempts by solid or liquid (61%) and attempts by cutting and piercing
instrument (75%). Whites represent 84% of suicide inpatient admissions by solid or liquid,
about 75% of suicide by cutting and piercing instrument and 73% of suicide by firearms, air
guns and explosives.
The largest age group representing suicide-related inpatient admissions by solid or liquid is 45
to 54 (24%). The age group representing the most admissions due to suicide attempts by
cutting and piercing instrument was the 25-34 age group (28%).
23
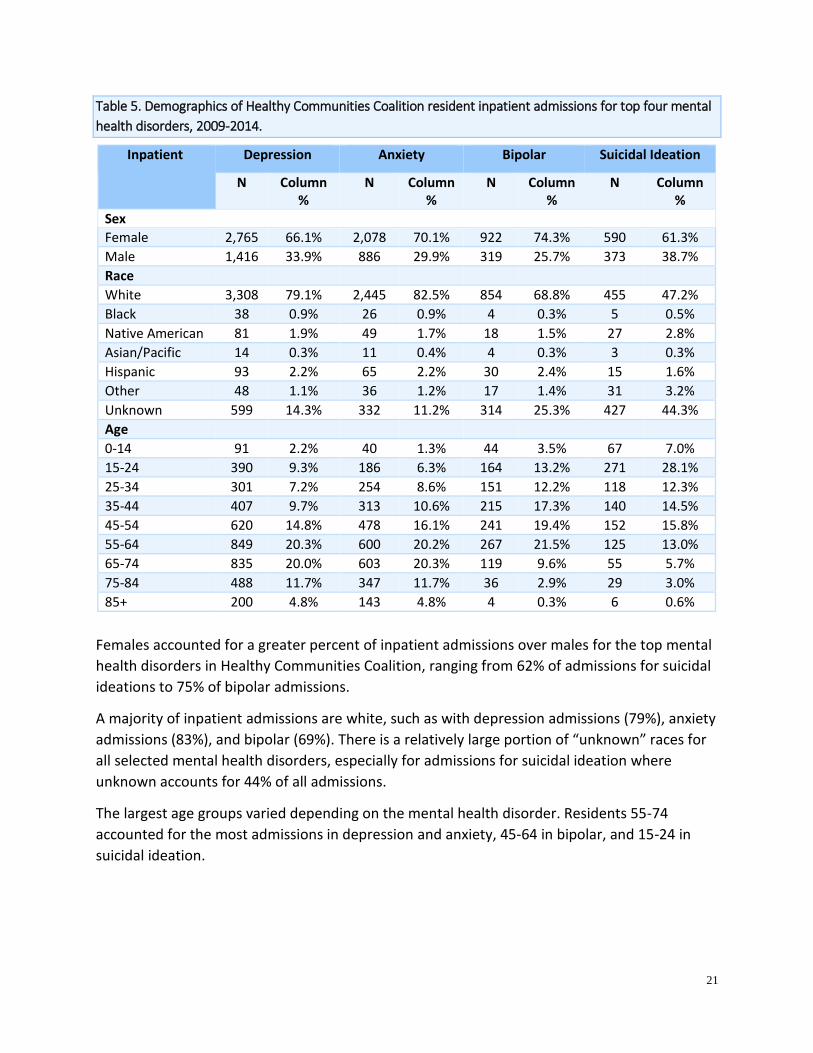
Figure 11. Percentages of Healthy Communities Coalition resident inpatient admissions for mental health
and substance-related disorders by payment type, 2010-2014.
The most common payment source of mental health and substance-related inpatient
admissions for Healthy Communities Coalition residents was Medicare (43%). Negotiated
Discounts accounted for 17%, and Nevada Medicaid accounted for 14%. The remainder of
payment methods are each 8% or less of inpatient admissions.
39%
1%3%
14%0%
8%
1%
7%
17%
3%
1% 0%
4%
0%0%
0% Medicare
Charity
CHAMPUS OR CHAMPVA
Nevada Medicaid
Other Medicaid
Self Pay
Miscellaneous
Commercial Insurer
Negotiated Discounts e.g. PPO
HMO
County Indigent Referral
All Workers Compensation e.g. (SIIS)
Medicare HMO
Nevada Medicaid HMO
Unknown
24
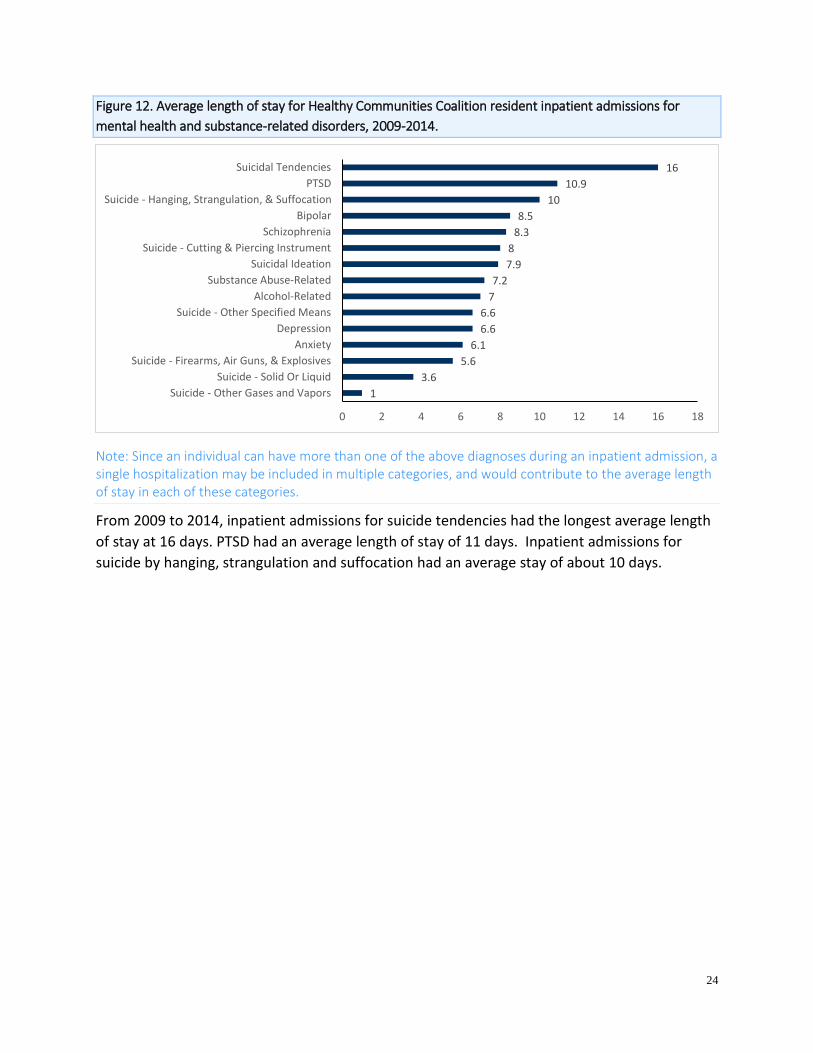
Figure 12. Average length of stay for Healthy Communities Coalition resident inpatient admissions for
mental health and substance-related disorders, 2009-2014.
Note: Since an individual can have more than one of the above diagnoses during an inpatient admission, a single hospitalization may be included in multiple categories, and would contribute to the average length of stay in each of these categories.
From 2009 to 2014, inpatient admissions for suicide tendencies had the longest average length
of stay at 16 days. PTSD had an average length of stay of 11 days. Inpatient admissions for
suicide by hanging, strangulation and suffocation had an average stay of about 10 days.
1
3.6
5.6
6.1
6.6
6.6
7
7.2
7.9
8
8.3
8.5
10
10.9
16
0 2 4 6 8 10 12 14 16 18
Suicide - Other Gases and Vapors
Suicide - Solid Or Liquid
Suicide - Firearms, Air Guns, & Explosives
Anxiety
Depression
Suicide - Other Specified Means
Alcohol-Related
Substance Abuse-Related
Suicidal Ideation
Suicide - Cutting & Piercing Instrument
Schizophrenia
Bipolar
Suicide - Hanging, Strangulation, & Suffocation
PTSD
Suicidal Tendencies
25
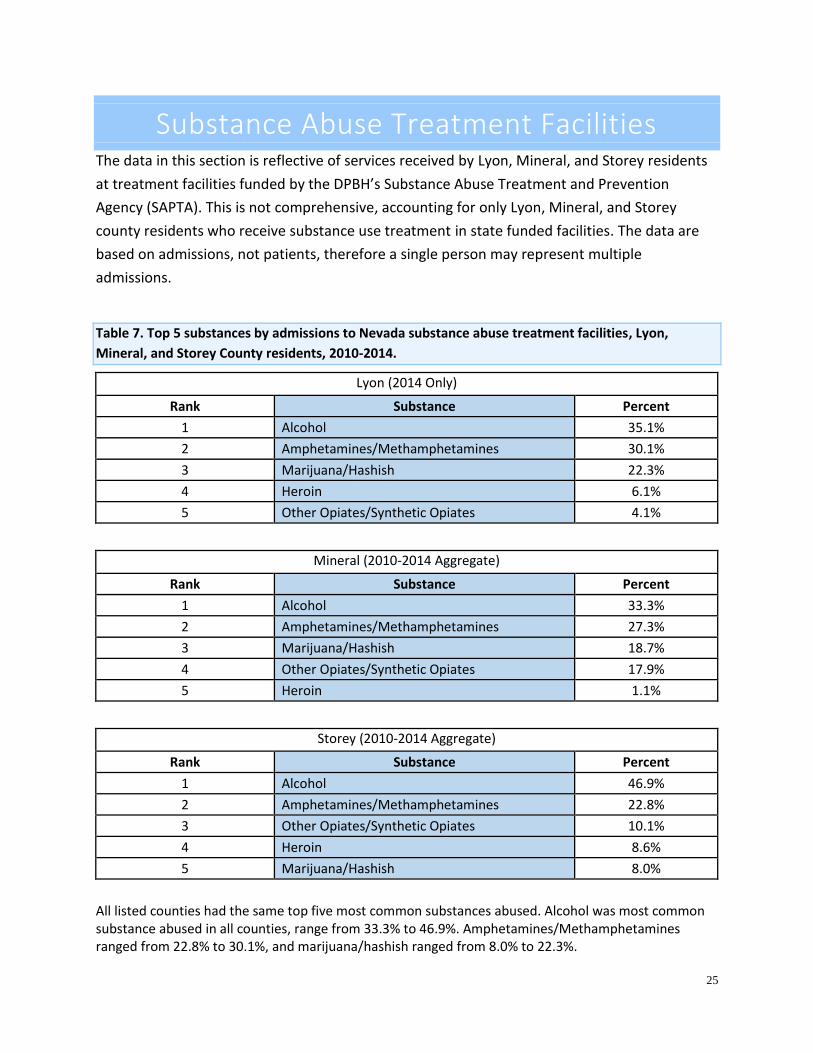
Substance Abuse Treatment Facilities The data in this section is reflective of services received by Lyon, Mineral, and Storey residents
at treatment facilities funded by the DPBH’s Substance Abuse Treatment and Prevention
Agency (SAPTA). This is not comprehensive, accounting for only Lyon, Mineral, and Storey
county residents who receive substance use treatment in state funded facilities. The data are
based on admissions, not patients, therefore a single person may represent multiple
admissions.
Table 7. Top 5 substances by admissions to Nevada substance abuse treatment facilities, Lyon,
Mineral, and Storey County residents, 2010-2014.
Lyon (2014 Only)
Rank Substance Percent
1 Alcohol 35.1%
2 Amphetamines/Methamphetamines 30.1%
3 Marijuana/Hashish 22.3%
4 Heroin 6.1%
5 Other Opiates/Synthetic Opiates 4.1%
Mineral (2010-2014 Aggregate)
Rank Substance Percent
1 Alcohol 33.3%
2 Amphetamines/Methamphetamines 27.3%
3 Marijuana/Hashish 18.7%
4 Other Opiates/Synthetic Opiates 17.9%
5 Heroin 1.1%
Storey (2010-2014 Aggregate)
Rank Substance Percent
1 Alcohol 46.9%
2 Amphetamines/Methamphetamines 22.8%
3 Other Opiates/Synthetic Opiates 10.1%
4 Heroin 8.6%
5 Marijuana/Hashish 8.0%
All listed counties had the same top five most common substances abused. Alcohol was most common substance abused in all counties, range from 33.3% to 46.9%. Amphetamines/Methamphetamines ranged from 22.8% to 30.1%, and marijuana/hashish ranged from 8.0% to 22.3%.
26
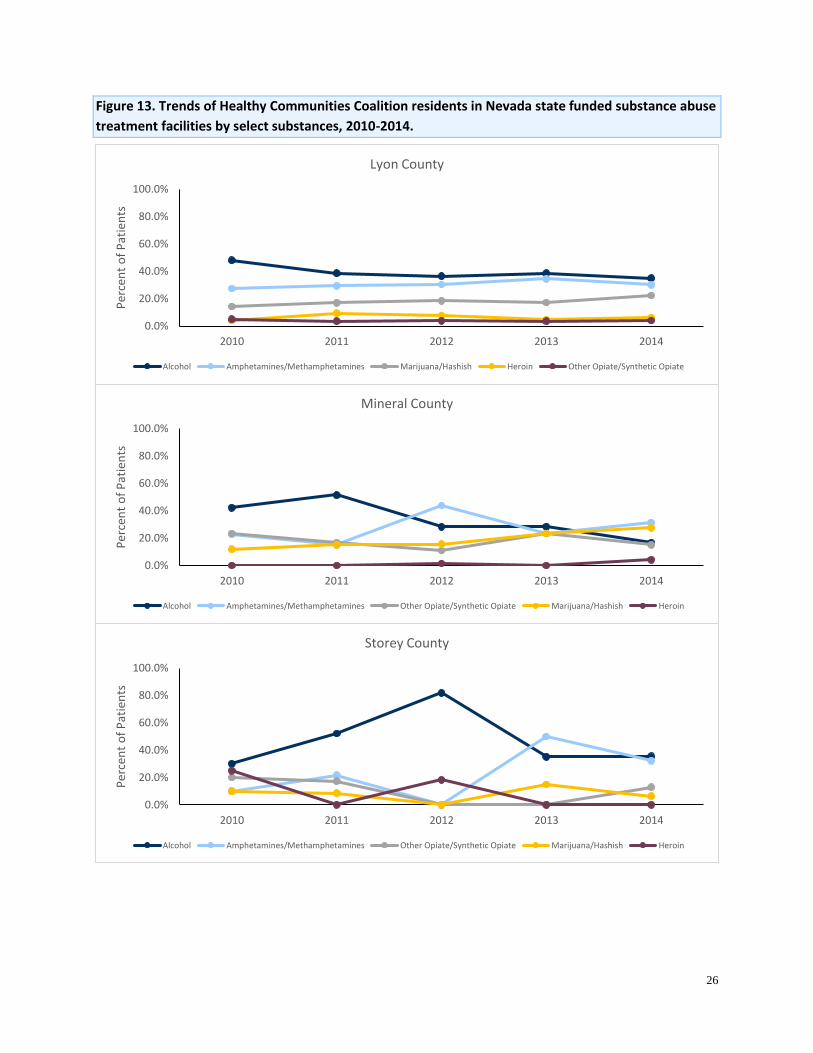
Figure 13. Trends of Healthy Communities Coalition residents in Nevada state funded substance abuse
treatment facilities by select substances, 2010-2014.
0.0%
20.0%
40.0%
60.0%
80.0%
100.0%
2010 2011 2012 2013 2014
Per
cen
t o
f P
atie
nts
Lyon County
Alcohol Amphetamines/Methamphetamines Marijuana/Hashish Heroin Other Opiate/Synthetic Opiate
0.0%
20.0%
40.0%
60.0%
80.0%
100.0%
2010 2011 2012 2013 2014
Per
cen
t o
f P
atie
nts
Mineral County
Alcohol Amphetamines/Methamphetamines Other Opiate/Synthetic Opiate Marijuana/Hashish Heroin
0.0%
20.0%
40.0%
60.0%
80.0%
100.0%
2010 2011 2012 2013 2014
Per
cen
t o
f P
atie
nts
Storey County
Alcohol Amphetamines/Methamphetamines Other Opiate/Synthetic Opiate Marijuana/Hashish Heroin

27
Table 8. Demographics of Healthy Communities Coalition residents in Nevada substance abuse treatment
facilities, 2010-2014.
N Column %
Sex
Female 999 41.5%
Male 1,407 58.5%
Age
0-14 51 2.1%
15-24 883 36.7%
25-34 690 28.7%
35-44 360 15.0%
45-54 291 12.1%
55-64 101 4.2%
65+ 30 1.2%
Unknown 0 0.0%
Race/Ethnicity
White non-Hispanic 1,760 73.2%
Black non-Hispanic 46 1.9%
Hispanic 351 14.6%
American Indian/Native Am/Alaska Native non-Hispanic
89 3.7%
Asian, Hawaiian, PI non-Hispanic 12 0.5%
Other/Unknown 148 6.2%
Tobacco Use
Yes 1,446 60.1%
No 755 31.4%
Unknown 205 8.5%
There were a total of 2,406 admissions for Healthy Communities Coalition residents to Nevada
state funded substance abuse treatment facilities from 2010-2014. This number is exclusive to
SAPTA-funded facilities and does not include privately funded facilities. By age group, the most
common groups that received treatment were between 15 to 34 years (65%). More than half
were male patients (59%). For race/ethnicity, white non-Hispanics made up the largest
proportion of admissions, with 73%. Tobacco use was indicated on 60% of admissions.
Since this data is exclusive to only SAPTA-funded providers, the data may not reflect statewide
trends.

28
Prenatal Substance Use The data in this section is reflective of self-reported information provided by the mother on the
birth record.
Figure 14. Prenatal substance abuse birth rate (self-reported), Healthy Communities Coalition, 2010-2014.
Of the Healthy Communities Coalition mothers who gave birth between 2010 and 2014 that
self-reported using a substance while pregnant, alcohol has the highest prenatal substance
abuse birth rate at 6.9 per 1,000 births. A rate of 4.1 per 1,000 self-reported using marijuana,
3.8 per 1,000 reported using amphetamines/methamphetamines, and 1.9 per 1,000 births
reported polysubstance. These numbers are grossly underestimated because data is self-
reported by the mothers, and they may be reluctant to be forthcoming on the birth record for
many reasons.
6.9
4.1 3.8
1.9
0.3
0.0
2.0
4.0
6.0
8.0
10.0
Per
1,0
00
Bir
ths
Births Per 1,000 to Mothers Who Report Using Substances During Pregnancy
29
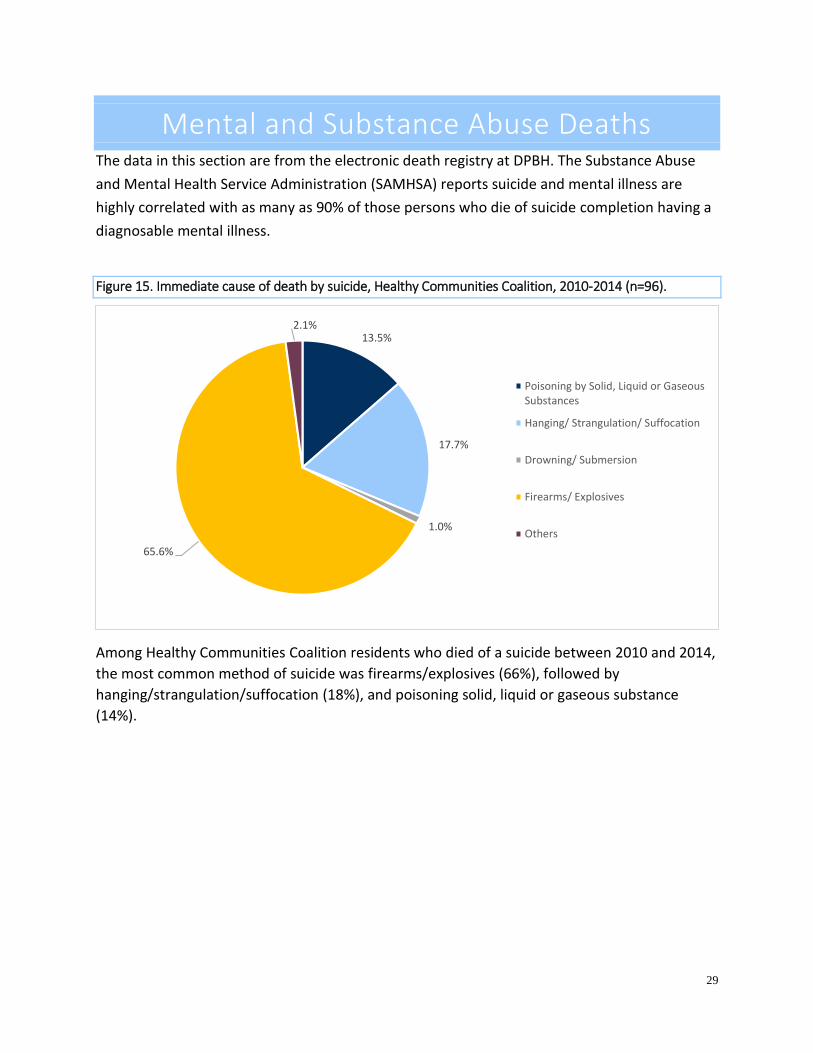
Mental and Substance Abuse Deaths The data in this section are from the electronic death registry at DPBH. The Substance Abuse
and Mental Health Service Administration (SAMHSA) reports suicide and mental illness are
highly correlated with as many as 90% of those persons who die of suicide completion having a
diagnosable mental illness.
Figure 15. Immediate cause of death by suicide, Healthy Communities Coalition, 2010-2014 (n=96).
Among Healthy Communities Coalition residents who died of a suicide between 2010 and 2014,
the most common method of suicide was firearms/explosives (66%), followed by
hanging/strangulation/suffocation (18%), and poisoning solid, liquid or gaseous substance
(14%).
13.5%
17.7%
1.0%
65.6%
2.1%
Poisoning by Solid, Liquid or GaseousSubstances
Hanging/ Strangulation/ Suffocation
Drowning/ Submersion
Firearms/ Explosives
Others
30
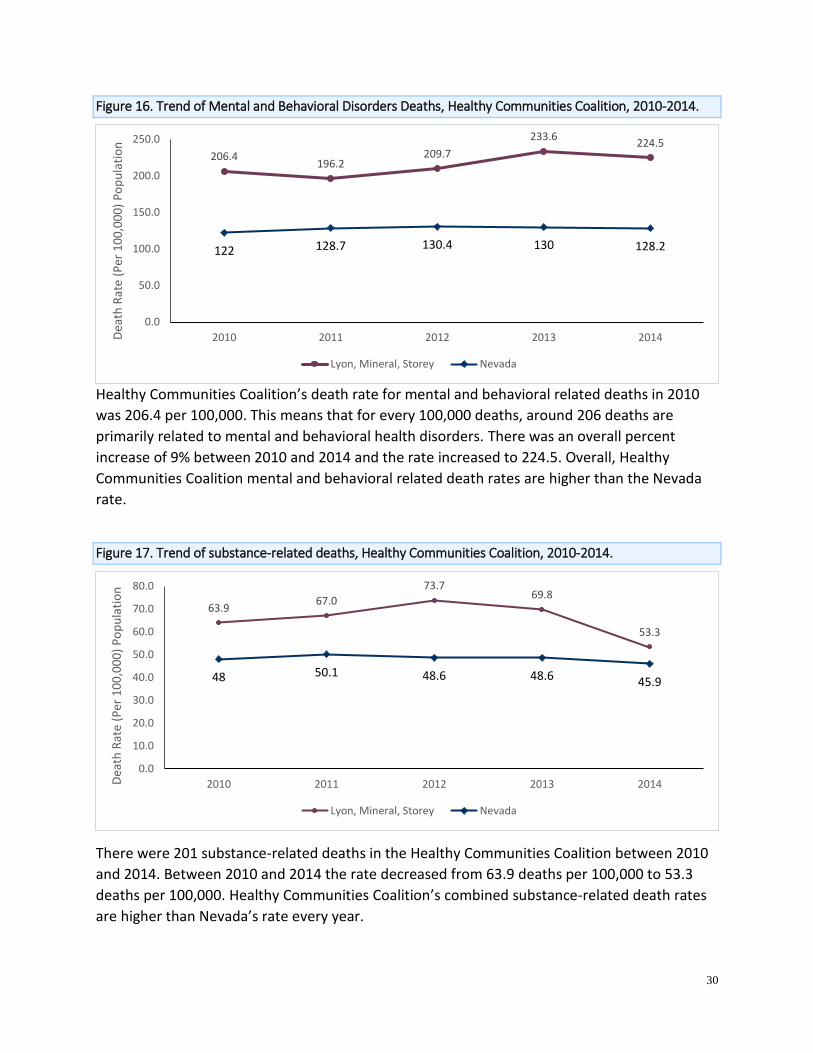
Figure 16. Trend of Mental and Behavioral Disorders Deaths, Healthy Communities Coalition, 2010-2014.
Healthy Communities Coalition’s death rate for mental and behavioral related deaths in 2010
was 206.4 per 100,000. This means that for every 100,000 deaths, around 206 deaths are
primarily related to mental and behavioral health disorders. There was an overall percent
increase of 9% between 2010 and 2014 and the rate increased to 224.5. Overall, Healthy
Communities Coalition mental and behavioral related death rates are higher than the Nevada
rate.
Figure 17. Trend of substance-related deaths, Healthy Communities Coalition, 2010-2014.
There were 201 substance-related deaths in the Healthy Communities Coalition between 2010
and 2014. Between 2010 and 2014 the rate decreased from 63.9 deaths per 100,000 to 53.3
deaths per 100,000. Healthy Communities Coalition’s combined substance-related death rates
are higher than Nevada’s rate every year.
206.4196.2
209.7
233.6224.5
122 128.7 130.4 130 128.2
0.0
50.0
100.0
150.0
200.0
250.0
2010 2011 2012 2013 2014Dea
th R
ate
(Per
10
0,0
00
) P
op
ula
tio
n
Lyon, Mineral, Storey Nevada
63.967.0
73.769.8
53.3
48 50.1 48.6 48.6 45.9
0.0
10.0
20.0
30.0
40.0
50.0
60.0
70.0
80.0
2010 2011 2012 2013 2014Dea
th R
ate
(Per
10
0,0
00
) P
op
ula
tio
n
Lyon, Mineral, Storey Nevada
31
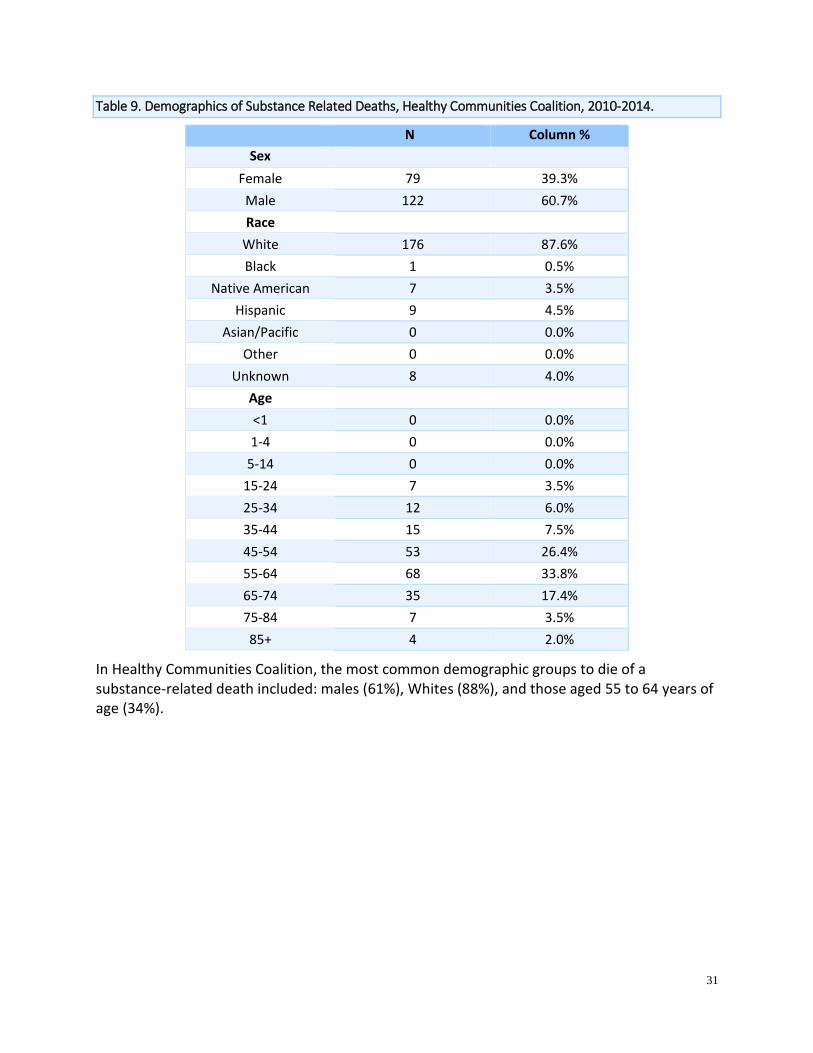
Table 9. Demographics of Substance Related Deaths, Healthy Communities Coalition, 2010-2014.
N Column %
Sex
Female 79 39.3%
Male 122 60.7%
Race
White 176 87.6%
Black 1 0.5%
Native American 7 3.5%
Hispanic 9 4.5%
Asian/Pacific 0 0.0%
Other 0 0.0%
Unknown 8 4.0%
Age
<1 0 0.0%
1-4 0 0.0%
5-14 0 0.0%
15-24 7 3.5%
25-34 12 6.0%
35-44 15 7.5%
45-54 53 26.4%
55-64 68 33.8%
65-74 35 17.4%
75-84 7 3.5%
85+ 4 2.0%
In Healthy Communities Coalition, the most common demographic groups to die of a substance-related death included: males (61%), Whites (88%), and those aged 55 to 64 years of age (34%).

32
Behavioral Risk Factor Surveillance System Data in this section are from Behavioral Risk Factor Surveillance System (BRFSS). The BRFSS is
the nation's premier system of health-related telephone surveys that collect state data about
U.S. residents regarding their health-related risk behaviors, chronic health conditions, and use
of preventive services. BRFSS collects data for adults aged 18 years and older. It allows for
representative data to be analyzed at the county-level for many indicators.
Figure 18. 2011-2014 BRFSS: Percentage of adult Lyon, Mineral, and Storey County residents who used
illegal substances, or painkillers ‘to get high,’ in the last 30 days (aggregate 2011-2014 data).
Although 5.5% of adults in Nevada and 3% of adults in Lyon and Mineral County reported using
marijuana illegally in the last 30 days, over 17.5% of Storey County residents reported doing the
same.
5.5%1.1% 0.7%3.2% 0.5% 0.9%3.3% 0.5% 1.2%
17.5%
2.5% 2.4%
0.0%
20.0%
40.0%
60.0%
80.0%
100.0%
Marijuana Illegal Drugs Painkillers
Per
cen
tage
of
Res
iden
ts
Nevada Lyon Mineral Storey

33
Figure 19. 2011-2014 BRFSS: Percentages of adult Lyon, Mineral, and Storey County residents who are
considered “heavy drinkers” - more than one drink (females) or two drinks (males) per day.
Nevada adult males and females more often reported being heavy drinkers compared to males
and females in both all counties. Heavy drinking consists of males consuming more than two
alcoholic beverages a day and females consuming more than one alcoholic beverage a day.
Figure 20. Percentages of how often adult Lyon, Mineral, and Storey County residents have felt depressed
in the past 30 days, 2012-2014.
From 2012 to 2014, adult residents in Lyon, Mineral, and Storey, and Nevada almost equally
reported not experiencing depression in the last 30 days (81%-89%). The rest of the residents
reported experiencing a little depression (6%-17%), experiencing depression some of the time
(2%-8%), most of the time (0%-2%), and all of the time (<1%).
21.7%
10.5%15.9%
4.3%#N/A
3.7%#N/A
8.1%
0.0%
10.0%
20.0%
30.0%
40.0%
50.0%
60.0%
70.0%
80.0%
90.0%
100.0%
Male Female
Per
cen
tage
of
Res
iden
ts
Nevada Lyon Mineral Storey
0.0%
10.0%
20.0%
30.0%
40.0%
50.0%
60.0%
70.0%
80.0%
90.0%
100.0%
All of the Time Most of the Time Some of the Time A Little None
Per
cen
t o
f R
esid
ents
Nevada Lyon Mineral Storey

34
Figure 21. 2012-2014 BRFSS: Percentages of adult Lyon, Mineral, and Storey residents who agree that with
treatment, people with a mental illness can live normal lives.
From 2012 to 2014, BRFSS data was collected on perception related to the efficacy of mental
health treatment. In Nevada, Lyon, and Mineral, approximately 89%-92% of adults agreed in
some capacity that those with mental disorders can live a normal life with treatment, but only
69% of adult residents in Storey agreed.
0.0%
10.0%
20.0%
30.0%
40.0%
50.0%
60.0%
70.0%
80.0%
90.0%
100.0%
Agree Strongly Agree Slightly Neither Agree NorDisagree
Slightly Disagree No Response
Per
cen
t o
f R
esid
ents
Nevada Lyon Mineral Storey
35
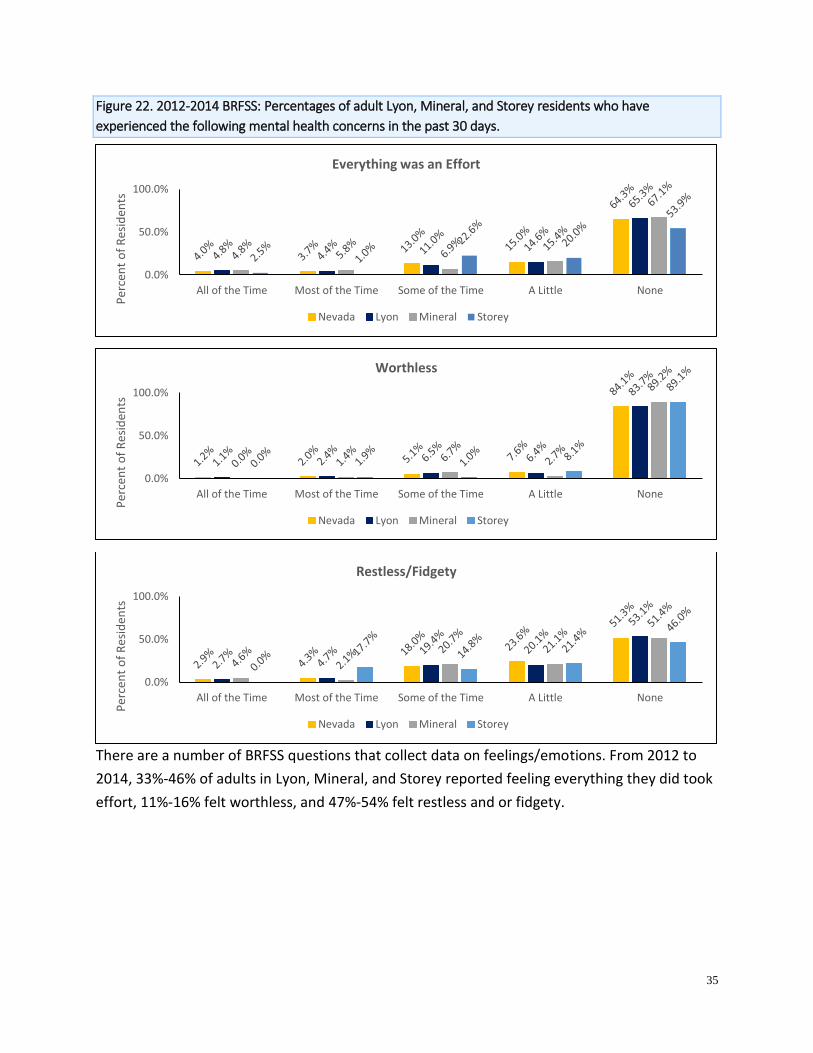
Figure 22. 2012-2014 BRFSS: Percentages of adult Lyon, Mineral, and Storey residents who have
experienced the following mental health concerns in the past 30 days.
There are a number of BRFSS questions that collect data on feelings/emotions. From 2012 to
2014, 33%-46% of adults in Lyon, Mineral, and Storey reported feeling everything they did took
effort, 11%-16% felt worthless, and 47%-54% felt restless and or fidgety.
0.0%
50.0%
100.0%
All of the Time Most of the Time Some of the Time A Little None
Per
cen
t o
f R
esid
ents
Everything was an Effort
Nevada Lyon Mineral Storey
0.0%
50.0%
100.0%
All of the Time Most of the Time Some of the Time A Little None
Per
cen
t o
f R
esid
ents
Worthless
Nevada Lyon Mineral Storey
0.0%
50.0%
100.0%
All of the Time Most of the Time Some of the Time A Little None
Per
cen
t o
f R
esid
ents
Restless/Fidgety
Nevada Lyon Mineral Storey
36
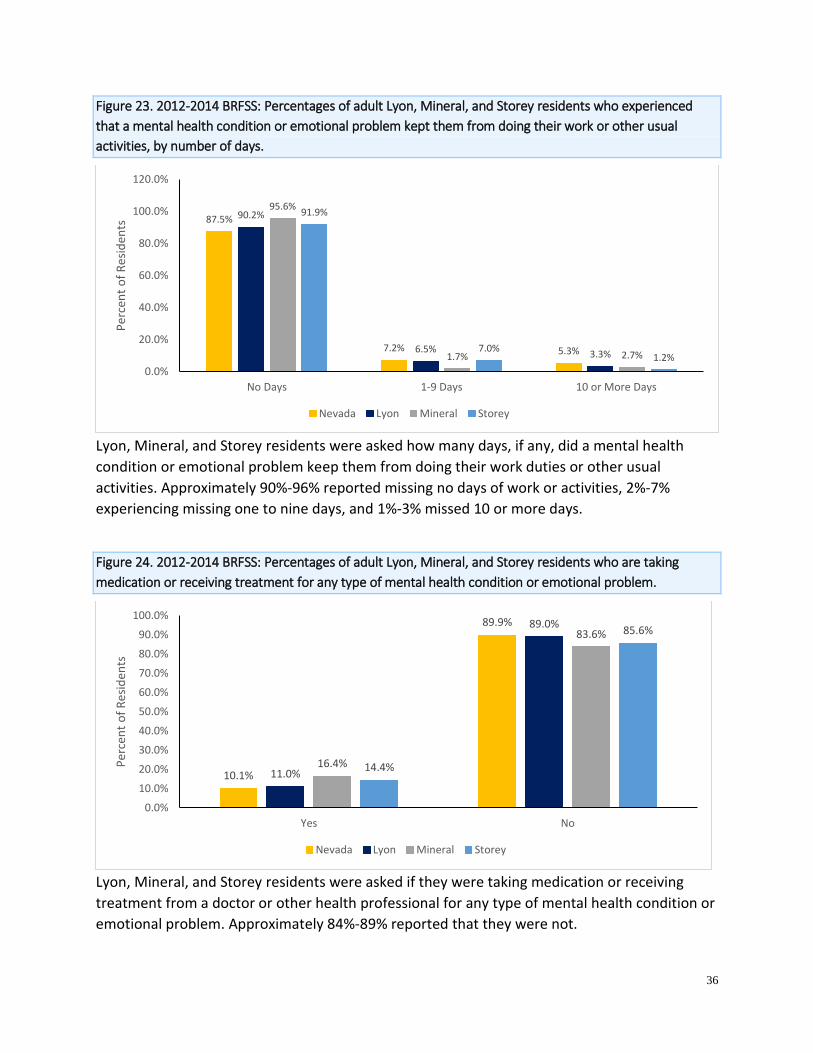
Figure 23. 2012-2014 BRFSS: Percentages of adult Lyon, Mineral, and Storey residents who experienced
that a mental health condition or emotional problem kept them from doing their work or other usual
activities, by number of days.
Lyon, Mineral, and Storey residents were asked how many days, if any, did a mental health
condition or emotional problem keep them from doing their work duties or other usual
activities. Approximately 90%-96% reported missing no days of work or activities, 2%-7%
experiencing missing one to nine days, and 1%-3% missed 10 or more days.
Figure 24. 2012-2014 BRFSS: Percentages of adult Lyon, Mineral, and Storey residents who are taking
medication or receiving treatment for any type of mental health condition or emotional problem.
Lyon, Mineral, and Storey residents were asked if they were taking medication or receiving
treatment from a doctor or other health professional for any type of mental health condition or
emotional problem. Approximately 84%-89% reported that they were not.
87.5%
7.2% 5.3%
90.2%
6.5% 3.3%
95.6%
1.7% 2.7%
91.9%
7.0%1.2%
0.0%
20.0%
40.0%
60.0%
80.0%
100.0%
120.0%
No Days 1-9 Days 10 or More Days
Per
cen
t o
f R
esid
ents
Nevada Lyon Mineral Storey
10.1%
89.9%
11.0%
89.0%
16.4%
83.6%
14.4%
85.6%
0.0%
10.0%
20.0%
30.0%
40.0%
50.0%
60.0%
70.0%
80.0%
90.0%
100.0%
Yes No
Per
cen
t o
f R
esid
ents
Nevada Lyon Mineral Storey
37
Youth Risk Behavior Surveillance System The data in this section is provided through a survey from the Youth Risk Behavioral
Surveillance System (YRBSS) at a regional level for Lyon, Mineral, and Storey high school
students. YRBSS is a national surveillance system that was established in 1991 by the Centers
for Disease Control (CDC) and Prevention to monitor the prevalence of health risk behaviors
among youth. It is an anonymous and voluntary survey of students in grades 9 through 12.
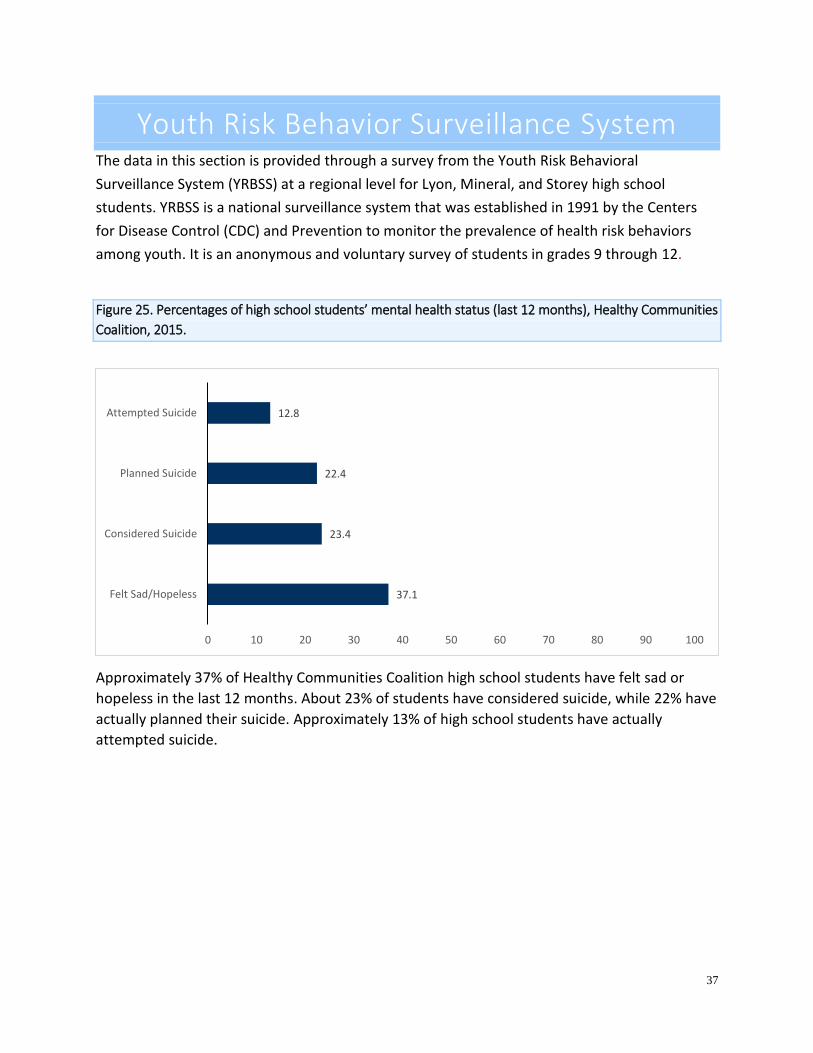
Figure 25. Percentages of high school students’ mental health status (last 12 months), Healthy Communities
Coalition, 2015.
Approximately 37% of Healthy Communities Coalition high school students have felt sad or
hopeless in the last 12 months. About 23% of students have considered suicide, while 22% have
actually planned their suicide. Approximately 13% of high school students have actually
attempted suicide.
37.1
23.4
22.4
12.8
0 10 20 30 40 50 60 70 80 90 100
Felt Sad/Hopeless
Considered Suicide
Planned Suicide
Attempted Suicide
38
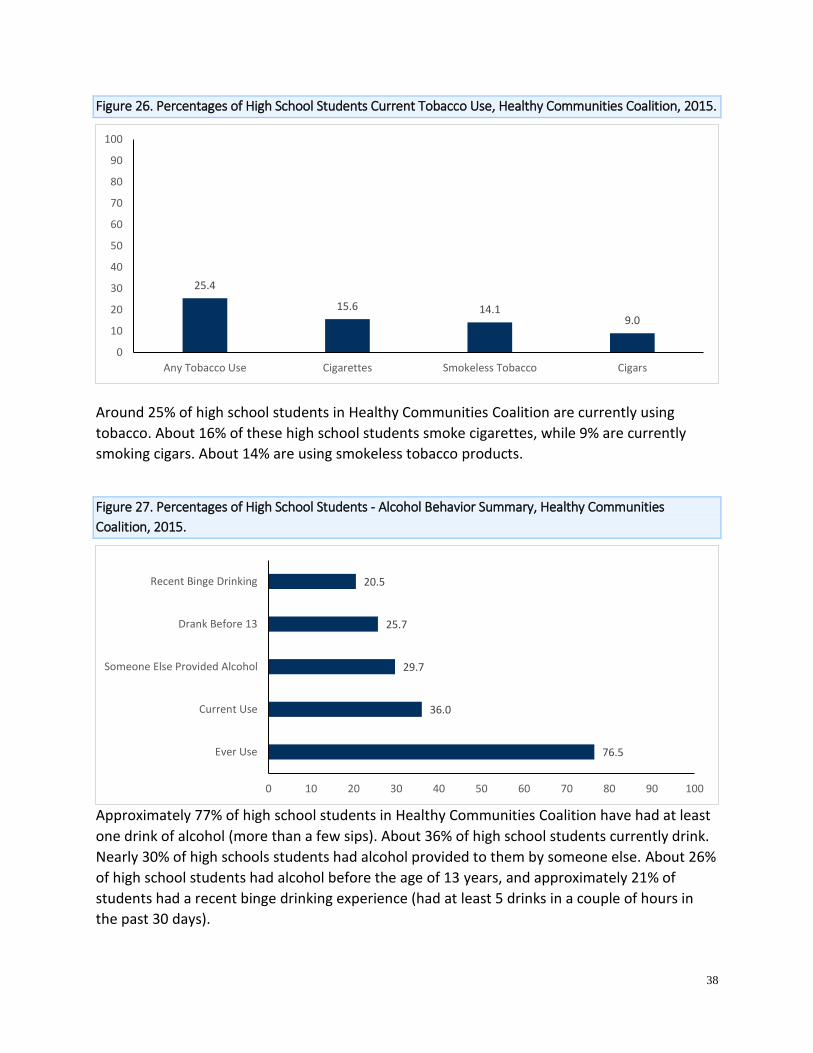
Figure 26. Percentages of High School Students Current Tobacco Use, Healthy Communities Coalition, 2015.
Around 25% of high school students in Healthy Communities Coalition are currently using
tobacco. About 16% of these high school students smoke cigarettes, while 9% are currently
smoking cigars. About 14% are using smokeless tobacco products.
Figure 27. Percentages of High School Students - Alcohol Behavior Summary, Healthy Communities
Coalition, 2015.
Approximately 77% of high school students in Healthy Communities Coalition have had at least
one drink of alcohol (more than a few sips). About 36% of high school students currently drink.
Nearly 30% of high schools students had alcohol provided to them by someone else. About 26%
of high school students had alcohol before the age of 13 years, and approximately 21% of
students had a recent binge drinking experience (had at least 5 drinks in a couple of hours in
the past 30 days).
25.4
15.6 14.19.0
0
10
20
30
40
50
60
70
80
90
100
Any Tobacco Use Cigarettes Smokeless Tobacco Cigars
76.5
36.0
29.7
25.7
20.5
0 10 20 30 40 50 60 70 80 90 100
Ever Use
Current Use
Someone Else Provided Alcohol
Drank Before 13
Recent Binge Drinking

39
Figure 28. Percentages of High School Students - Marijuana Behavior Summary, Healthy Communities
Coalition, 2015.
Approximately 46% of high school students in Healthy Communities Coalition reported trying
marijuana, and 16% are currently using. Approximately 12% of high school students have tried
marijuana before the age of 13 years.
Figure 29. Percentages of High School Students Nonprescription Substance Use Summary, Healthy
Communities Coalition, 2015.
Approximately 22% of high school students have already tried prescription drugs that were not
prescribed to them in their lifetime. About 3% have tried non-prescribed steroids.
45.9
15.7
11.7
0 10 20 30 40 50 60 70 80 90 100
Ever Use
Current Use
Used Before 13
21.7
11.3
3.1
0
10
20
30
40
50
60
70
80
90
100
Ever Used Prescription Drugs Currently Use Prescription Drugs Ever Used Steroids
40
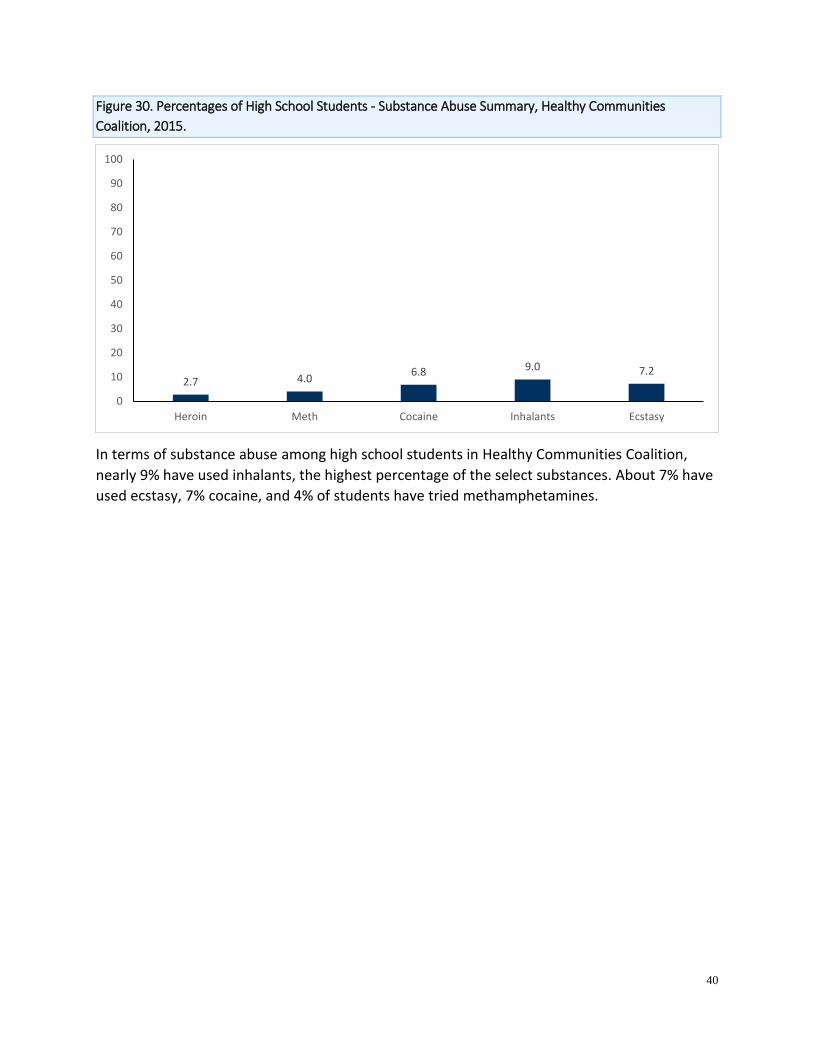
Figure 30. Percentages of High School Students - Substance Abuse Summary, Healthy Communities
Coalition, 2015.
In terms of substance abuse among high school students in Healthy Communities Coalition,
nearly 9% have used inhalants, the highest percentage of the select substances. About 7% have
used ecstasy, 7% cocaine, and 4% of students have tried methamphetamines.
2.7 4.06.8 9.0 7.2
0
10
20
30
40
50
60
70
80
90
100
Heroin Meth Cocaine Inhalants Ecstasy
41
School Success When students’ behavioral health needs are not identified, they are more likely to experience
difficulties in school, including higher rates of suspensions, expulsions, dropouts, and truancy,
as well as lower grades. Nationally, 50% of students age 14 and older who are living with a
mental illness drop out of high school. This is the highest dropout rate of any disability group.
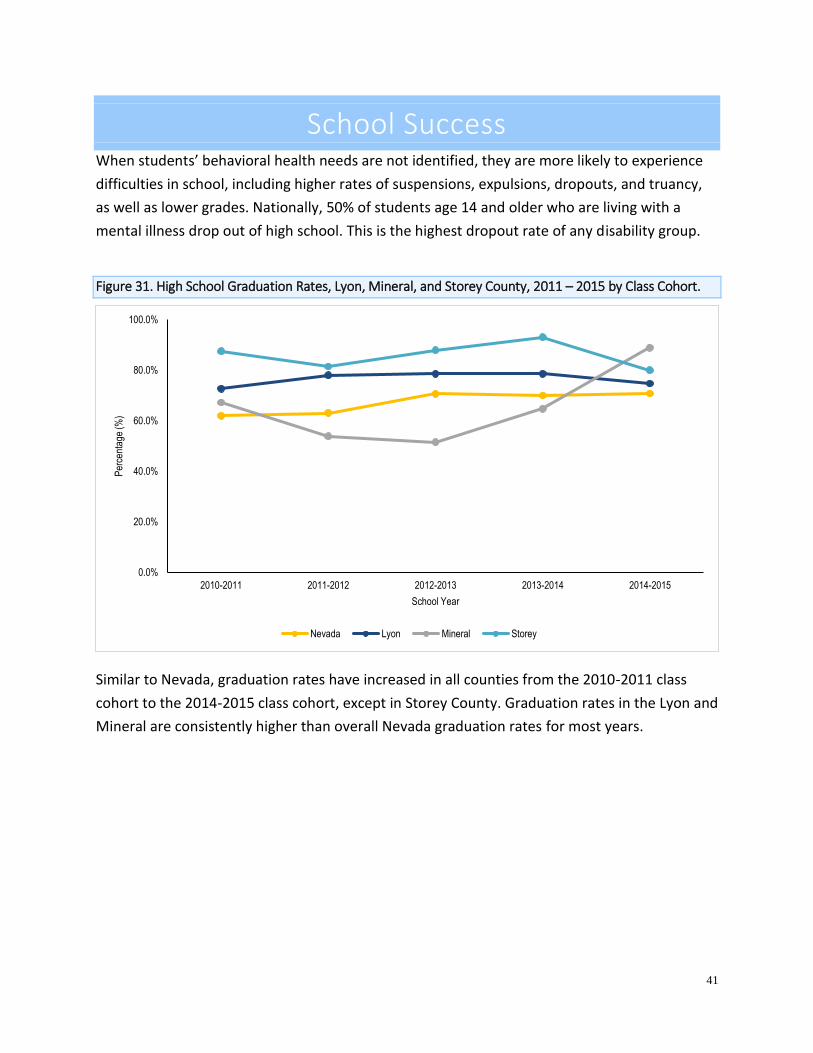
Figure 31. High School Graduation Rates, Lyon, Mineral, and Storey County, 2011 – 2015 by Class Cohort.
Similar to Nevada, graduation rates have increased in all counties from the 2010-2011 class
cohort to the 2014-2015 class cohort, except in Storey County. Graduation rates in the Lyon and
Mineral are consistently higher than overall Nevada graduation rates for most years.
0.0%
20.0%
40.0%
60.0%
80.0%
100.0%
2010-2011 2011-2012 2012-2013 2013-2014 2014-2015
Per
cent
age
(%)
School Year
Nevada Lyon Mineral Storey
42
Conclusion This report is intended to provide an overview of behavioral health in Lyon, Mineral, and Storey
Counties. The analysis could be used to identify issues of concern and areas that may need to
be addressed.
One finding is the number of visits to the ER by residents of the Healthy Communities Coalition
for all mental disorders, and alcohol and drug-related issues have all increased during the time
period from 2009 to 2014. Visits for PTSD had a percent change of 429%, the largest increase
among the seven disorders. The ER visits for mental health disorders and treatment in SAPTA
facilities appear to be sex-specific. For example, females made up a majority of ER visits for
anxiety, depression, bipolar disorder, PTSD, and schizophrenia.
From 2009 to 2014, the trend for death rates in mental health-related deaths has increased.
Similar to Nevada, mental and behavioral health-related deaths have increased from 206.4 to
224.5 deaths per 100,000 in the Healthy Communities Coalition.
For more information and additional publications, please visit Nevada Division of Public and
Behavioral Health at http://dpbh.nv.gov/.


