WASHINGTON STATEECONOMIC AND REVENUE FORECAST COUNCIL Economic & Revenue Outlook Presented to...
36
WASHINGTON STATE ECONOMIC AND REVENUE FORECAST COUNCIL Economic & Revenue Outlook Presented to Washington State National Institute of Government Procurement Steve Lerch Executive Director January 21, 2014 Seattle, Washington
-
Upload
deirdre-edwards -
Category
Documents
-
view
217 -
download
2
Transcript of WASHINGTON STATEECONOMIC AND REVENUE FORECAST COUNCIL Economic & Revenue Outlook Presented to...

WASHINGTON STATEECONOMIC AND REVENUE FORECAST COUNCIL
Economic & Revenue Outlook
Presented toWashington State National Institute of Government
Procurement
Steve LerchExecutive Director
January 21, 2014Seattle, Washington

Economic OutlookJanuary 21, 2014
Slide 2WASHINGTON STATE ECONOMIC AND REVENUE FORECAST COUNCIL
Summary
• The U.S. and Washington economies continue to grow, although at a slow pace
• Construction activity has been a big contributor to Washington employment growth; employment is rising in most Washington industries except aerospace and the federal government
• Risks to the forecast are generally from factors outside the state, including a weaker Chinese economy, uncertain federal fiscal policy and possible disruptions to the housing recovery
• State revenue collections have returned to pre-recession levels

Economic OutlookJanuary 21, 2014
Slide 3WASHINGTON STATE ECONOMIC AND REVENUE FORECAST COUNCIL
ERFC Forecast Process
National Economic Forecast
Preliminary Washington State Economic Forecast
Review by Work Group
Review by Governor’s Council of Economic Advisors &
Economic and Revenue Forecast Council
Final National and Washington Economic Forecast
Review by Forecast Council
Final Washington General Fund Revenue Forecast
ERFC and Revenue-Generating Agencies Create Revenue Forecasts
The national economic forecast is based on the Global Insight model

Economic OutlookJanuary 21, 2014
Slide 4WASHINGTON STATE ECONOMIC AND REVENUE FORECAST COUNCIL
Three major risks to the forecast
Europe & China
• Hard Landing for China
• Slow growth in Europe
• Reduced Exports
Fiscal Policy
• Debt Ceiling• Budget
Housing• Affordability• Household
formation
Baseline Forecast

Economic OutlookJanuary 21, 2014
Slide 5WASHINGTON STATE ECONOMIC AND REVENUE FORECAST COUNCIL
China’s Economic Growth has Slowed
2005-2011 avg 2012 20130%
2%
4%
6%
8%
10%
12%
14%
China Real GDP Growth
Blue Chip IMF ISI History
Source: Blue Chip, IMF, ISI; data through 2013

Economic OutlookJanuary 21, 2014
Slide 6WASHINGTON STATE ECONOMIC AND REVENUE FORECAST COUNCIL
Exports have weakened outside of China
2011 2012 20130%
2%
4%
6%
8%
10%
12%
14%
16%
18%
Annual growth in U.S. exports
China All other countries
Source: WISERTrade; 2013 data through November

Economic OutlookJanuary 21, 2014
Slide 7WASHINGTON STATE ECONOMIC AND REVENUE FORECAST COUNCIL
Government expenditures remain weak
2011 2011 2011 2011 2012 2012 2012 2012 2013 2013 2013-2
-1
0
1
2
3
4
5Contributions to Percent Change in Real GDP
Personal Consumption Private Investment Net Exports Govt Exp & Investment
Perc
enta
ge P
oin
ts
Source: BEA; data through 2013 Q3

Economic OutlookJanuary 21, 2014
Slide 8WASHINGTON STATE ECONOMIC AND REVENUE FORECAST COUNCIL
Debt ceiling debate created uncertainty
Source: U.S. Treasury; data through January 16, 2014
Jan-13 Mar-13 May-13 Jul-13 Sep-13 Nov-13 Jan-140.00
0.05
0.10
0.15
0.20
0.25
0.30
0.35
0.40
Yield on 1-Month Treasure BillsPerc
ent

Economic OutlookJanuary 21, 2014
Slide 9WASHINGTON STATE ECONOMIC AND REVENUE FORECAST COUNCIL
Consumer confidence slowly improves
1980 1985 1990 1995 2000 2005 20100
25
50
75
100
125
150
Index Mich: 1966Q1 = 100, SA
Conf Board: 1985 =100, SA
U Mich Conf Board
Source: University of Michigan; Conference Board, data through December 2013

Economic OutlookJanuary 21, 2014
Slide 10WASHINGTON STATE ECONOMIC AND REVENUE FORECAST COUNCIL
Housing affordability is high but falling
1994
1995
1996
1997
1998
1999
2000
2001
2002
2003
2004
2005
2006
2007
2008
2009
2010
2011
2012
2013
50
75
100
125
150
175
200
225
Housing Affordability Index, SA
U.S. Washington
Index
Source: Global Insight, WA Center Real Estate Research, ERFC; data through 2013Q3
Affordability is 100 when the median income can just afford the median priced home. Above 100 means the median income can afford more than the median priced home

Economic OutlookJanuary 21, 2014
Slide 11WASHINGTON STATE ECONOMIC AND REVENUE FORECAST COUNCIL
Mortgage rates are increasing
2001 2003 2005 2007 2009 2011 20133
4
5
6
7
8
30-Year Fixed Mortgage RatePerc
ent
Source: Freddie Mac; data through December 2013

Economic OutlookJanuary 21, 2014
Slide 12WASHINGTON STATE ECONOMIC AND REVENUE FORECAST COUNCIL
Many adults continue to live at home with their parents
1983
1985
1987
1989
1991
1993
1995
1997
1999
2001
2003
2005
2007
2009
2011
10
11
12
13
14
41
43
45
47
49
51
Homeownership Rate vs. % Living with Parents25-34 year olds
% living w/parents Homeownership rate
% L
ivin
g w
/ Pare
nts
Hom
eow
ners
hip
Rate
Source: U.S. Census, ERFC, data through 2012

Economic OutlookJanuary 21, 2014
Slide 13WASHINGTON STATE ECONOMIC AND REVENUE FORECAST COUNCIL
Euro area GDP has returned to positive growth but risks remain
2010
2010
2010
2010
2011
2011
2011
2011
2012
2012
2012
2012
2013
2013
2013
-6
-4
-2
0
2
4
6
8
10
Quarterly GDP Growth
Italy Germany Euro area
Perc
ent
Change S
AA
R
Source: Eurostat; data through 2013Q3
Eurozone Forecast:
2013: -0.4%
2014: 0.9%
2015: 1.3%

Economic OutlookJanuary 21, 2014
Slide 14WASHINGTON STATE ECONOMIC AND REVENUE FORECAST COUNCIL
U.S. GDP is growing
2000
2001
2002
2003
2004
2005
2006
2007
2008
2009
2010
2011
2012
2013
2014
2015
2016
2017
5,000
7,000
9,000
11,000
13,000
15,000
17,000
19,000
21,000
U.S. Gross Domestic Product
Actuals November forecast
Billions
of
Dollars
Source: ERFC November 2013 forecast; historical data through 2012

Economic OutlookJanuary 21, 2014
Slide 15WASHINGTON STATE ECONOMIC AND REVENUE FORECAST COUNCIL
Oil prices are expected to be slightly lower in the near term
2005
2005
2005
2005
2006
2006
2006
2006
2007
2007
2007
2007
2008
2008
2008
2008
2009
2009
2009
2009
2010
2010
2010
2010
2011
2011
2011
2011
2012
2012
2012
2012
2013
2013
2013
2013
2014
2014
2014
2014
2015
2015
2015
2015
2016
2016
2016
2016
2017
2017
2017
2017
25
50
75
100
125
Average Price of Crude Oil
September November
Dollars
per
barr
el
Forecast
Source: DOE, ERFC November 2013 forecast; historical data through 2013Q3

Economic OutlookJanuary 21, 2014
Slide 16WASHINGTON STATE ECONOMIC AND REVENUE FORECAST COUNCIL
Washington personal income is expected to increase by 5.2% in 2014
2000
2001
2002
2003
2004
2005
2006
2007
2008
2009
2010
2011
2012
2013
2014
2015
2016
2017
100
150
200
250
300
350
400
450
Washington Personal Income
Actuals November forecast
Billions
of
Dollars
Source: ERFC November 2013 forecast; historical data through 2012

Economic OutlookJanuary 21, 2014
Slide 17WASHINGTON STATE ECONOMIC AND REVENUE FORECAST COUNCIL
Washington housing permits forecast is lower in the near term
2012 2013 2014 2015 2016 201710
15
20
25
30
35
40
45
50
Washington Housing Permits
September November
Thousa
nds
Source: U.S. Census, ERFC November 2013 forecast; historical data through 2012
Economic OutlookJanuary 21, 2014
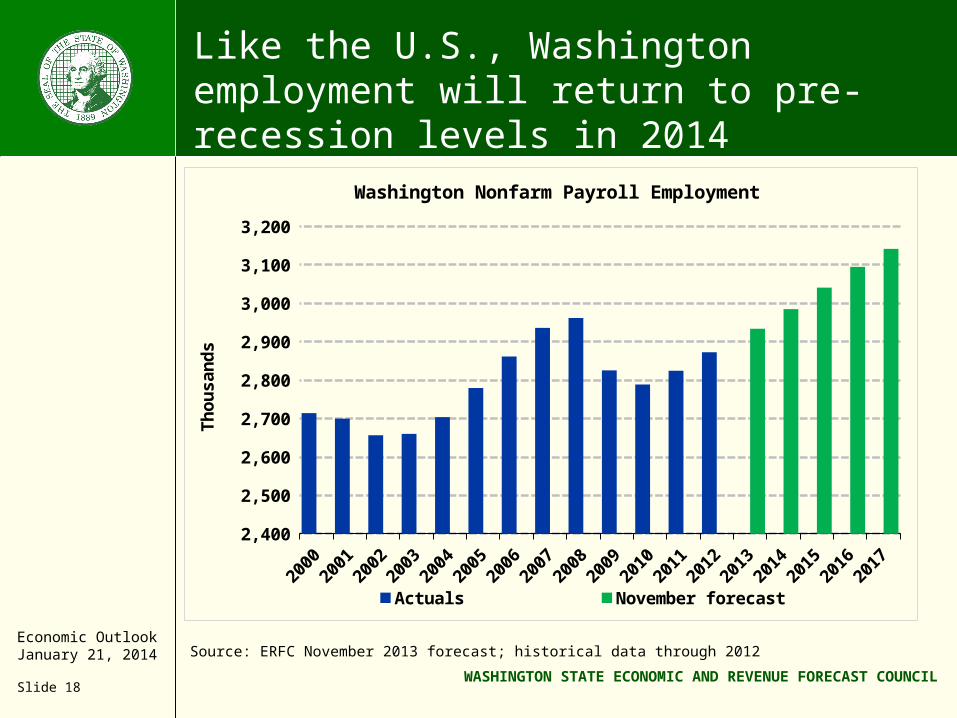
Slide 18WASHINGTON STATE ECONOMIC AND REVENUE FORECAST COUNCIL
Like the U.S., Washington employment will return to pre-recession levels in 2014
2000
2001
2002
2003
2004
2005
2006
2007
2008
2009
2010
2011
2012
2013
2014
2015
2016
2017
2,400
2,500
2,600
2,700
2,800
2,900
3,000
3,100
3,200
Washington Nonfarm Payroll Employment
Actuals November forecast
Thousa
nds
Source: ERFC November 2013 forecast; historical data through 2012

Economic OutlookJanuary 21, 2014
Slide 19WASHINGTON STATE ECONOMIC AND REVENUE FORECAST COUNCIL
Washington nonfarm employment is up 45,100 so far this year
Whol
e & re
tail
trad
e
Leisure
& h
ospita
lity
Const
ruct
ion
Hea
lth car
e
Emplo
ymen
t ser
vice
s
Man
uf ex
aero
spac
e
Loca
l gov
ernm
ent
Finan
cial
act
iviti
es
Prof/s
cien
tific/te
chnic
al
Softw
are
Aeros
pace
Feder
al g
over
nmen
t
All ot
her-4
-2
0
2
4
6
8
10
12
14
16
2013 YTD employment change
Thousa
nds
Source: Employment Security Dept., ERFC; data through November 2013

Economic OutlookJanuary 21, 2014
Slide 20WASHINGTON STATE ECONOMIC AND REVENUE FORECAST COUNCIL
Initial unemployment claims are declining
20062006200720072008200920092010201120112012201320130.5
1.0
1.5
2.0
2.5
Weekly initial claims, 4 week moving average (SA)
Washington U.S.
January
2006 =
1.0
Source: U.S. Dept of Labor/BLS; data through January 4 2014

Economic OutlookJanuary 21, 2014
Slide 21WASHINGTON STATE ECONOMIC AND REVENUE FORECAST COUNCIL
Washington manufacturing activity has turned up
2001 2003 2005 2007 2009 2011 201330
35
40
45
50
55
60
65
70
75
80
Institute of Supply Management Index
U.S. Washington
Source: Institute of Supply Management; data through December 2013
An index greater than 50, implies growth

Economic OutlookJanuary 21, 2014
Slide 22WASHINGTON STATE ECONOMIC AND REVENUE FORECAST COUNCIL
After nearly 6 years, Washington employment has still not recovered
0123456789101112131415161718192021222324252627282930313233343536373839404142434445464748495051525354555657585960616263646566676869
-200
-150
-100
-50
0
50
100
150
200
250
Washington Employment after Business Cycle Peak
1990-91 2001 2007-09Months
Thousands
Source: WA ESD, ERFC; data through November 2013
Washington remains 20,000 jobs below the start of the recession

Economic OutlookJanuary 21, 2014
Slide 23WASHINGTON STATE ECONOMIC AND REVENUE FORECAST COUNCIL
Washington employment will recover slightly faster than the U.S.
2005
2005
2005
2005
2006
2006
2006
2006
2007
2007
2007
2007
2008
2008
2008
2008
2009
2009
2009
2009
2010
2010
2010
2010
2011
2011
2011
2011
2012
2012
2012
2012
2013
2013
2013
2013
2014
2014
2014
2014
2015
2015
2015
2015
2016
2016
2016
2016
2017
2017
2017
2017
0.94
0.96
0.98
1.00
1.02
1.04
1.06
1.08
1.10
Nonfarm Payroll Employment
Washington U.S.
Index, 2013Q
3 =
1.0
Forecast
Date of regaining peak:
WA:
2014Q2
U.S.:
2014Q3
Source: ERFC November 2013 forecast; historical data through 2013Q3

Economic OutlookJanuary 21, 2014
Slide 24WASHINGTON STATE ECONOMIC AND REVENUE FORECAST COUNCIL
…and state personal income will recover slightly faster than the U.S.
2005
2005
2005
2005
2006
2006
2006
2006
2007
2007
2007
2007
2008
2008
2008
2008
2009
2009
2009
2009
2010
2010
2010
2010
2011
2011
2011
2011
2012
2012
2012
2012
2013
2013
2013
2013
2014
2014
2014
2014
2015
2015
2015
2015
2016
2016
2016
2016
2017
2017
2017
2017
0.80
0.85
0.90
0.95
1.00
1.05
1.10
1.15
1.20
Real Personal Income
Washington U.S.
Index, 2013Q
2 =
1.0
Forecast
Source: ERFC November 2013 forecast; historical data through 2013Q2

Economic OutlookJanuary 21, 2014
Slide 25WASHINGTON STATE ECONOMIC AND REVENUE FORECAST COUNCIL
Aerospace employment is declining
2012 2013 2014 2015 2016 201780
85
90
95
100
Washington Aerospace Employment
Thousa
nds
Source: ERFC November 2013 forecast; historical data through 2012

Economic OutlookJanuary 21, 2014
Slide 26WASHINGTON STATE ECONOMIC AND REVENUE FORECAST COUNCIL
Boeing has over 7 years of commercial orders on its books
03 04 05 06 07 08 09 10 11 12 130
400
800
1200
1600
0
1250
2500
3750
5000
Net Orders Deliveries Backlog
Ord
ers
& D
eliveri
es
Back
log
Source: Boeing, data through December 2013
Excludes the military’s new refueling tanker

Economic OutlookJanuary 21, 2014
Slide 27WASHINGTON STATE ECONOMIC AND REVENUE FORECAST COUNCIL
Washington construction employment is recovering
1990199019901990199119911991199119921992199219921993199319931993199419941994199419951995199519951996199619961996199719971997199719981998199819981999199919991999200020002000200020012001200120012002200220022002200320032003200320042004200420042005200520052005200620062006200620072007200720072008200820082008200920092009200920102010201020102011201120112011201220122012201220132013201320132014201420142014201520152015201520162016201620162017201720172017100
125
150
175
200
225
Washington Construction Employment
Trend, 1990-2012 Employment
Thousa
nds
Forecast
Source: ERFC November 2013 forecast; historical data through 2013Q3

Economic OutlookJanuary 21, 2014
Slide 28WASHINGTON STATE ECONOMIC AND REVENUE FORECAST COUNCIL
Single-family home prices continue to increase
2001 2003 2005 2007 2009 2011 2013-25
-20
-15
-10
-5
0
5
10
15
20
25
Case Shiller Home Price Index, SAYear–over-year percent Change
Seattle Composite 20
Perc
ent
Oct 2013
U.S. is up 13.6%
Seattle is up 13.1%
Source: S&P/Case-Shiller; data through October 2013
Economic OutlookJanuary 21, 2014
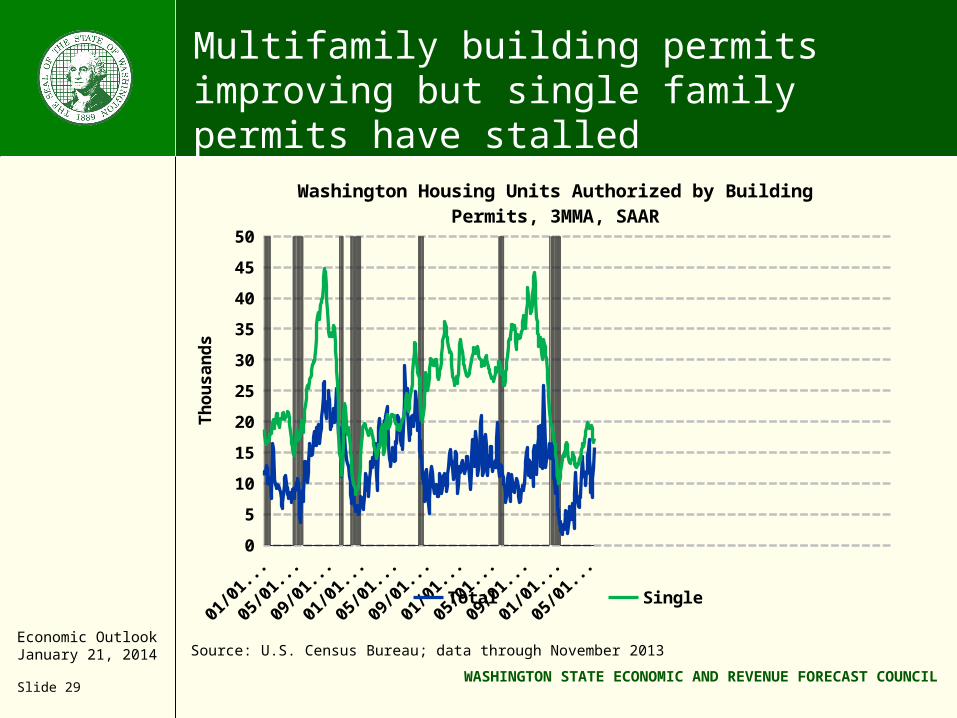
Slide 29WASHINGTON STATE ECONOMIC AND REVENUE FORECAST COUNCIL
Multifamily building permits improving but single family permits have stalled
1970 1975 1980 1985 1990 1995 2000 2005 20100
5
10
15
20
25
30
35
40
45
50
Washington Housing Units Authorized by Building Permits, 3MMA, SAAR
Multiple Single
Thousa
nds
Source: U.S. Census Bureau; data through November 2013

Economic OutlookJanuary 21, 2014
Slide 30WASHINGTON STATE ECONOMIC AND REVENUE FORECAST COUNCIL
Nonresidential activity is trending up but remains volatile
2000 2002 2004 2006 2008 2010 20120
1
2
3
4
5
6
7
8
0
10
20
30
40
50
60
70
80
Nonresidential construction contracts, SAAR, 3MMA
value square feet
Billions
$
Millions
sq. ft
.
Source: Dodge, ERFC; data through November 2013

Economic OutlookJanuary 21, 2014
Slide 31WASHINGTON STATE ECONOMIC AND REVENUE FORECAST COUNCIL
Revenue collections have recovered slowly after the last recession
0 1 2 3 4 5 6 7 8 9 10
11
12
13
14
15
16
17
18
19
20
21
22
23
24
-15
-10
-5
0
5
10
15
20
25
30
35
Revenue Act Collections after Business Cycle Peak
1990 2001 2007-09Quarters
Cum
ula
tive G
row
th (
perc
ent)
Source: ERFC; data through 2013 Q3
Revenue Act collections have now exceeded their previous peak reached in Q1 2008

Economic OutlookJanuary 21, 2014
Slide 32WASHINGTON STATE ECONOMIC AND REVENUE FORECAST COUNCIL
Revenue from liquor sales has been volatile since privatization
2007 2008 2009 2010 2011 2012 201314,000
16,000
18,000
20,000
22,000
24,000
26,000
Liquor Sales and Liter Taxes, SA
Collections Pre-Privitization Trend
M il li o n s o f d o ll a r s
Source: DOR, ERFC; data through December 2013

Economic OutlookJanuary 21, 2014
Slide 33WASHINGTON STATE ECONOMIC AND REVENUE FORECAST COUNCIL
REET base strengthening along with spikes of large commercial sales
1996 1998 2000 2002 2004 2006 2008 2010 20120
1
2
3
4
5
6
7
8
9
10
Seasonally Adjusted Taxable Real Estate Excise Activity
$Billions
Source: ERFC; Monthly data through December 2013 preliminary
Even after last year’s rush in sales of commercial property due to federal tax changes, large commercial sales are still occurring at an above-average rate
Residential prices and sales volume grew in 2013 but have flattened in recent months

Economic OutlookJanuary 21, 2014
Slide 34WASHINGTON STATE ECONOMIC AND REVENUE FORECAST COUNCIL
FY07 FY08 FY09 FY10 FY11 FY12 FY13 FY14 FY15 FY16 FY1710000
11000
12000
13000
14000
15000
16000
17000
18000
19000
20000$billions
Forecast
8.0% 1.2%
General Fund-State* forecast by fiscal year
(9.6%)(4.1 %)
7.9%
*General Fund-State & Related Funds for FY 07-09, General Fund-State new definition for FY 10-17Source: ERFC forecast, November 2013
1.5%
6.1%
General Fund-State Revenue
2.8%
3.2%
4.1%4.2%

Economic OutlookJanuary 21, 2014
Slide 35WASHINGTON STATE ECONOMIC AND REVENUE FORECAST COUNCIL
Conclusion
• We expect the slow pace of economic recovery to continue in both the U.S. and Washington economies
• Washington is still likely to outperform the nation, but by a small margin
• Washington construction activity has been strong but rising mortgage rates could slow the housing recovery
• Other threats to economic recovery include slowing Asian economies and uncertainty around federal fiscal issues

Economic OutlookJanuary 21, 2014
Slide 36WASHINGTON STATE ECONOMIC AND REVENUE FORECAST COUNCIL
Questions
Economic & Revenue Forecast Council1025 E. Union Avenue, Suite 544Olympia WA 98504-0912
www.erfc.wa.gov360-534-1560