Washington State Institute for Public Policy - wsipp.wa.gov · In a policy scenario in which a...
66
The 2015 Washington State Legislature directed the Washington State Institute for Public Policy (WSIPP) to conduct a benefit-cost analysis of the state’s ferry vessel procurement practices. 1 The legislature also directed WSIPP to: Compare in-state construction to construction at shipyards across the United States, Identify barriers to receiving three or more in-state bids to a request for proposals, and Recommend policies to encourage three or more in-state bidders to respond to a request for proposals. This report presents the results of our analysis, which is organized into four parts. I. Background on study methods, recent Washington State Ferries (WSF) vessel purchasing history, and major state purchasing requirements. II. Comparison of major public ferry systems’ fleet size, route length, and purchasing patterns; shipbuilding employment and pay; ferry construction cost dicussion; and case studies. III. Identification of barriers to increasing number of in-state bids. IV. Analysis of constructing ferries out-of- state using benefit-cost and economic impact approaches. 1 Second Engrossed Substitute Senate Bill 5992, Chapter 14, Laws of 2015. December 2016 Washington State Ferry Vessel Procurement 110 Fifth Avenue SE, Suite 214 ● PO Box 40999 ● Olympia, WA 98504 ● 360.664-9800 ● www.wsipp.wa.gov Washington State Institute for Public Policy Summary Washington State Ferries (WSF) operates the largest ferry system in the U.S., maintaining 22 ships in its fleet, with over 1,800 employees. Washington State law requires new ferries be constructed in state and at shipyards with state- sponsored apprenticeship programs. The state has received only one to two bids on all new ferries constructed in the last 30 years. This report identifies barriers to increasing the number of in- state bidders but makes no policy recommen- dations to increase this number due to data limitations. This report presents the results of a benefit-cost analysis (BCA) and economic impact analysis (EIA) of a change in policy that shifts construction of ferries out of state. Neither analysis predicts a significant impact on Washington’s economy (either positively or negatively) from building ferries out of state. In a policy scenario in which a single ferry is built out-of-state, the BCA showed, on average, a positive net benefit of $3.25 million or about 2.5% of the total ferry purchase price. However, there was a great deal of uncertainty in our analysis. The EIA predicted an average yearly loss of about 650 jobs and about $68 million to the state gross domestic product over a two-year period. The EIA suggested that building a ferry out-of-state would have only a short-term impact on the shipbuilding industry. Suggested citation: Barch, M., & Bania, N. (2016). Washington State ferry vessel procurement. (Document Number 16-12- 4102). Olympia: Washington State Institute for Public Policy
Transcript of Washington State Institute for Public Policy - wsipp.wa.gov · In a policy scenario in which a...

The 2015 Washington State Legislature directed
the Washington State Institute for Public Policy
(WSIPP) to conduct a benefit-cost analysis of the
state’s ferry vessel procurement practices.1 The
legislature also directed WSIPP to:
Compare in-state construction to
construction at shipyards across the
United States,
Identify barriers to receiving three or
more in-state bids to a request for
proposals, and
Recommend policies to encourage
three or more in-state bidders to
respond to a request for proposals.
This report presents the results of our analysis,
which is organized into four parts.
I. Background on study methods, recent
Washington State Ferries (WSF) vessel
purchasing history, and major state
purchasing requirements.
II. Comparison of major public ferry
systems’ fleet size, route length, and
purchasing patterns; shipbuilding
employment and pay; ferry
construction cost dicussion; and case
studies.
III. Identification of barriers to increasing
number of in-state bids.
IV. Analysis of constructing ferries out-of-
state using benefit-cost and economic
impact approaches.
1 Second Engrossed Substitute Senate Bill 5992, Chapter 14, Laws
of 2015.
December 2016
Washington State Ferry Vessel Procurement
110 Fifth Avenue SE, Suite 214 ● PO Box 40999 ● Olympia, WA 98504 ● 360.664-9800 ● www.wsipp.wa.gov
Washington State Inst itute for Publ ic Pol icy
Summary
Washington State Ferries (WSF) operates the
largest ferry system in the U.S., maintaining 22
ships in its fleet, with over 1,800 employees.
Washington State law requires new ferries be
constructed in state and at shipyards with state-
sponsored apprenticeship programs. The state
has received only one to two bids on all new
ferries constructed in the last 30 years. This report
identifies barriers to increasing the number of in-
state bidders but makes no policy recommen-
dations to increase this number due to data
limitations.
This report presents the results of a benefit-cost
analysis (BCA) and economic impact analysis (EIA)
of a change in policy that shifts construction of
ferries out of state. Neither analysis predicts a
significant impact on Washington’s economy
(either positively or negatively) from building
ferries out of state.
In a policy scenario in which a single ferry is built
out-of-state, the BCA showed, on average, a
positive net benefit of $3.25 million or about 2.5%
of the total ferry purchase price. However, there
was a great deal of uncertainty in our analysis.
The EIA predicted an average yearly loss of about
650 jobs and about $68 million to the state gross
domestic product over a two-year period. The EIA
suggested that building a ferry out-of-state
would have only a short-term impact on the
shipbuilding industry.
Suggested citation: Barch, M., & Bania, N. (2016). Washington
State ferry vessel procurement. (Document Number 16-12-
4102). Olympia: Washington State Institute for Public Policy

This report uses a variety of methods, including
the following:
1) data analysis of the shipbuilding
industry using a variety of labor data
sources;
2) verification and expansion of a dataset
of ferry procurers, shipyards, and ferries
built since 1980;2
3) extensive literature search on ferry cost
estimation and the state of the
shipbuilding industry;
4) interviews with experts (shipyards, ferry
purchasers, federal regulators, and
industry);3 and
5) benefit-cost and economic impact
analyses.
2 WSIPP expanded and verified the dataset developed for the
following report: State Auditor’s Office. (2013). Washington
State Ferries: Vessel construction costs. (Report No. 1008884).
Olympia, WA. This was completed through searching news
articles and the public records of a variety of public ferry
purchasers. 3 These semi-structured interviews were conducted via
telephone. Contacts were identified from three sources: the
maritime literature; the dataset of public ship purchasers and
shipyards; and via a snowball sampling method.
I. Background
Washington State Ferries (WSF) is the largest
ferry system4 in the U.S., maintaining 22 ships5
in its fleet, with over 1,800 employees.6 The
ferries carry 23 million passengers annually7 to
20 different ports of call.8 Administered as part
of the state highway system, WSF connects
island communities to the state’s mainland and
links the state transportation system across the
Puget Sound. Over the last ten years, WSF has
retired 11 ships from service9 and added
another five10 to its fleet. Four of the 144-car
ferries are reaching the end of their 60-year
service life, and WSF predicts replacements are
needed by 2027 to maintain the current level
of service.11
4 According to the National Census of Ferry Operators, ferries
are defined as providing itinerant, fixed route, common
carrier passenger, and/or vehicle ferry service. This excludes
railroad car float operations and excursion services (e.g.,
whale watches, casino boats, day cruises, dinner cruises, etc.),
passenger only water taxi services not operating on a fixed
route, LoLo (Lift-on/Lift-off) freight/auto carrier services, or
long distance passenger only cruise ship services. For details,
see:
https://www.rita.dot.gov/bts/sites/rita.dot.gov.bts/files/subje
ct_areas/ncfo/ncfo_methods.html. 5 WSF recently put two of its retired vessels up for auction.
6 http://www.wsdot.wa.gov/Ferries/yourwsf/ourfleet/
7http://www.wsdot.wa.gov/ferries/traffic_stats/annualpdf/201
5.pdf 8 http://www.wsdot.wa.gov/Ferries/yourwsf/ourfleet/
9 Four of these were passenger-only ferries, which WSF has
discontinued, and four were the Steel Electric class. The
remaining three (the MV (Motorized Vessel) Rhododendron,
MV Evergreen State, and MV Hiyu) operated primarily as
back-up ferries for the fleet but were used more regularly
after the Steel Electric class ferries were retired. Both the MV
Evergreen State and the MV Hiyu have recently been put up
for auction (see http://www.kitsapsun.com/news/local/old-
state-ferries-put-up-for-auction-3e21953d-ad14-72ff-e053-
0100007f3529-396066561.html). 10
The MV Samish, MV Tokitae, MV Salish, MV Kennewick,
and MV Chetzemoka. 11
M. von Ruden, WSF Director of Vessels (personal
communication, July 12, 2016).
2

Recent History of WSF Vessel Procurement
The state’s 22 ships were built between 1958
and 2016 and range in capacity from 750 to
2,500 passengers and 64 to 202 cars. Thirteen
of the 22 ships were rebuilt subsequent to their
initial launch, most recently in 2005 (see
Exhibit 1). All but five ships were built in
Seattle. Over the last 20 years, new WSF ferry
construction has been led by the Seattle-based
Todd Pacific Shipyards, acquired in 2011 by
Vigor Industrial (see Exhibit 2, next page).12 13
While other shipyards have served as
subcontractors, Vigor Industrial has been the
lead shipyard in the construction of the last
eight ships and three classes of ferries, starting
with the Jumbo Mark II class ferries
constructed in the 1990s.
12
http://www.bizjournals.com/seattle/news/2011/02/15/vigor
-completes-130m-purchase-of-todd.html 13
Vigor Industrial consists of several subsidiary companies.
Vigor Fab is the subsidiary responsible for building the 144-
car ferries. http://vigor.net/projects/project/144_car_ferries
The first vessel in the Kwa-di Tabil class
experienced cost overruns and delays (see
Exhibit 3, next page). Vigor Industrial has
delivered the later ferries in both the Kwa-di
Tabil class and in the Olympic class of vessels
(the 144-car) on-time and closer to or under
budget, especially after allowing for the
contingency that WSF adds to the awarded
contract.14 WSF reserves a contingency fund
set aside to cover unexpected costs not
covered in the budget. For a more in-depth
discussion of recent WSF procurement
including the events surrounding the
construction of the Kwa-di Tabil ferries (see
Appendix IX).
14
According to the Washington State Auditor’s Office (2013)
Performance Audit, WSF sets an additional 10-20% of the
awarded shipyard contract as contingency funding (p. 44)
with the higher amount reserved for the first vessel in a new
class.
Exhibit 1
WSF Fleet Details
Class # of vessels Car capacity Passenger capacity Years built (rebuilt)
Evergreen State* 2 87 792 1958-59 (1994-95)
Issaquah 6 90-124 1,076-1,200 1980-82 (1989-2005)***
Jumbo 2 188 2,000 1972-1973 (2003-2004)
Jumbo Mark II 3 202 2,500 1997-1999
Kwa-di Tabil 3 64 750 2010-2011
Olympic 2** 144 1,500 2014-2016
Super 4 144 1,069-2,000 1967 (1991, 2005)***
Source: http://www.wsdot.wa.gov/ferries/vesselwatch/Vessels.aspx
Notes:
* One of the Evergreen State class ferries is a backup vessel for the fleet and is not in regular service.
** Two additional Olympic class ferries are under construction with anticipated delivery dates of 2017 and 2018.
*** One of the Issaquah class vessels, the Sealth, and one of the Super class vessels, the Hyak, have not been rebuilt.
3

Exhibit 3
Construction Contract Award and Total Spent on Recent WSF Ferry Construction
(unadjusted dollars in millions)
Kwa-di Tabil Class (64-car) Olympic Class (144-car)
Chetzemoka Salish Kennewick Tokitae Samish Chimacum Suquamish
Year built 2010 2011 2012 2014 2015 2017
(in progress)
2018
(in progress)
Contract award $65.48 $60.00 $54.11 $115.35 $109.42 $112.65 $111.56
Estimated final
shipyard cost $76.37 $63.63 $55.55 $116.60 $110.37 $112.66 $111.56
Difference ($10.89) ($3.63) ($1.44) ($1.26) ($0.95) ($0.01) $0.00
Source: Data on Kwa-di Tabil Class ferries is from: SAO (2013) pg. 39. Data on Olympic class ferries is from: R. Wohlfrom, WSF
Vessel Project Engineer (personal communication, November 21, 2016).
Note:
Numbers may not add due to rounding.
Exhibit 2
Recent WSF Vessel Construction
1997-1999: Three Jumbo Mark II class ferries were built (202-car)
Two qualified bidders
Todd Pacific Shipyards won the bid
2009-2012: Three Kwa-di Tabil class ferries were built (64-car)
Todd Pacific Shipyards submitted the only winning bid, as the lead shipyard in a winning consortium of
other shipyards in state
2012-2018 (in progress): Four Olympic class ferries were built (144-car)
One bid by Vigor Industrial (formerly Todd Shipyards) as lead contractor of a consortium of in-state
shipyards
Two of four are already in service (Tokitae and Samish)
Chimacum is due in 2017, and Suquamish is due in 2018
4
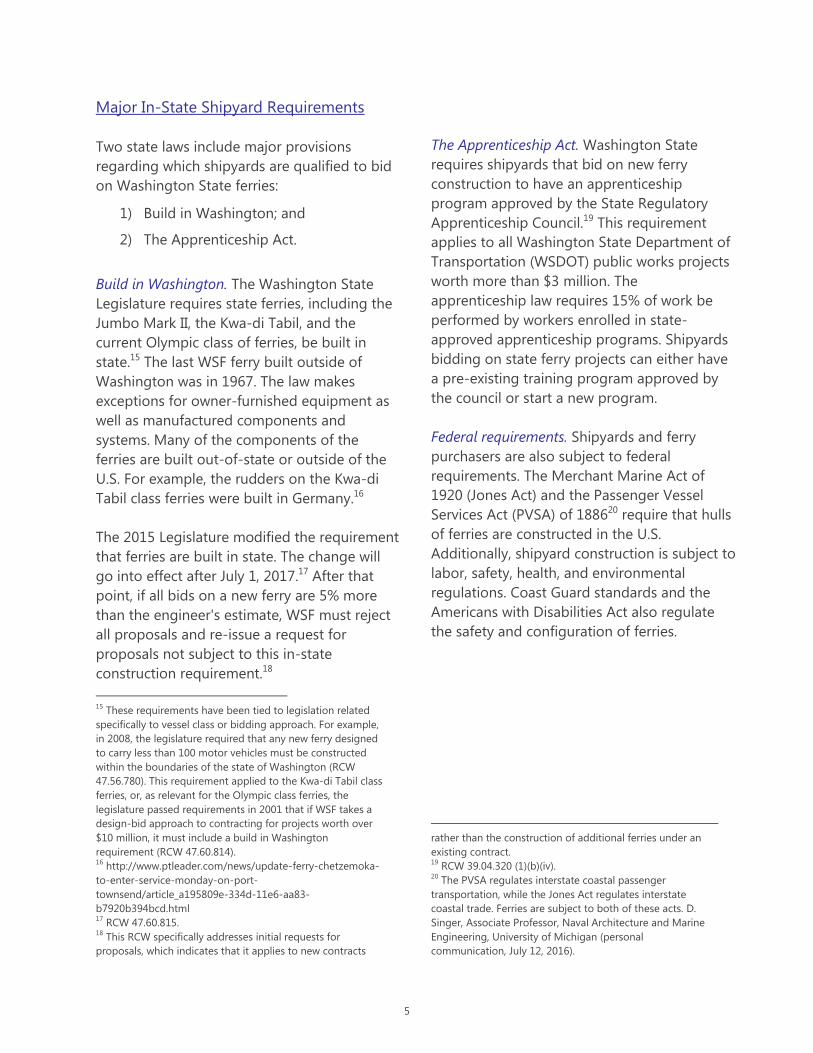
Major In-State Shipyard Requirements
Two state laws include major provisions
regarding which shipyards are qualified to bid
on Washington State ferries:
1) Build in Washington; and
2) The Apprenticeship Act.
Build in Washington. The Washington State
Legislature requires state ferries, including the
Jumbo Mark II, the Kwa-di Tabil, and the
current Olympic class of ferries, be built in
state.15 The last WSF ferry built outside of
Washington was in 1967. The law makes
exceptions for owner-furnished equipment as
well as manufactured components and
systems. Many of the components of the
ferries are built out-of-state or outside of the
U.S. For example, the rudders on the Kwa-di
Tabil class ferries were built in Germany.16
The 2015 Legislature modified the requirement
that ferries are built in state. The change will
go into effect after July 1, 2017.17 After that
point, if all bids on a new ferry are 5% more
than the engineer's estimate, WSF must reject
all proposals and re-issue a request for
proposals not subject to this in-state
construction requirement.18
15
These requirements have been tied to legislation related
specifically to vessel class or bidding approach. For example,
in 2008, the legislature required that any new ferry designed
to carry less than 100 motor vehicles must be constructed
within the boundaries of the state of Washington (RCW
47.56.780). This requirement applied to the Kwa-di Tabil class
ferries, or, as relevant for the Olympic class ferries, the
legislature passed requirements in 2001 that if WSF takes a
design-bid approach to contracting for projects worth over
$10 million, it must include a build in Washington
requirement (RCW 47.60.814). 16
http://www.ptleader.com/news/update-ferry-chetzemoka-
to-enter-service-monday-on-port-
townsend/article_a195809e-334d-11e6-aa83-
b7920b394bcd.html 17
RCW 47.60.815. 18
This RCW specifically addresses initial requests for
proposals, which indicates that it applies to new contracts
The Apprenticeship Act. Washington State
requires shipyards that bid on new ferry
construction to have an apprenticeship
program approved by the State Regulatory
Apprenticeship Council.19 This requirement
applies to all Washington State Department of
Transportation (WSDOT) public works projects
worth more than $3 million. The
apprenticeship law requires 15% of work be
performed by workers enrolled in state-
approved apprenticeship programs. Shipyards
bidding on state ferry projects can either have
a pre-existing training program approved by
the council or start a new program.
Federal requirements. Shipyards and ferry
purchasers are also subject to federal
requirements. The Merchant Marine Act of
1920 (Jones Act) and the Passenger Vessel
Services Act (PVSA) of 188620 require that hulls
of ferries are constructed in the U.S.
Additionally, shipyard construction is subject to
labor, safety, health, and environmental
regulations. Coast Guard standards and the
Americans with Disabilities Act also regulate
the safety and configuration of ferries.
rather than the construction of additional ferries under an
existing contract. 19
RCW 39.04.320 (1)(b)(iv). 20
The PVSA regulates interstate coastal passenger
transportation, while the Jones Act regulates interstate
coastal trade. Ferries are subject to both of these acts. D.
Singer, Associate Professor, Naval Architecture and Marine
Engineering, University of Michigan (personal
communication, July 12, 2016).
5

II. Comparing WSF to Other
Major U.S. Public Ferry Systems
Ferries are unusual ships to produce. Most
non-recreational shipbuilding in the U.S. is for
the navy or for oil and gas exploration and
production.21 Generally, shipyards are
concentrated in Virginia and Florida because of
their large naval facilities as well as other
southeastern states because of their proximity
to oil and gas production.22 WSIPP identified
21 shipyards in the U.S. that have experience
building ferry ships since 1980 (see
Exhibit 4).23 These include mid-sized to large
shipyards (or groups of shipyards), building
high-complexity, mid-sized vessels and
medium or small shipyards with some
experience building ferries—predominantly
passenger ferries. The majority of these
shipyards are located in the southeastern U.S.
in the Gulf States.
21
Eisenhower School for National Security and Resource
Strategy (2015). Industry study: Final report shipbuilding,
Washington, D.C. Available at:
http://es.ndu.edu/Portals/75/Documents/industry-
study/reports/2015/es-is-report-shipbuilding-2015.pdf, p. 2. 22
Ibid, pp. 2-3. 23
www.shipbuildinghistory.com
Comparing Ferry Systems
Exhibit 5 (next page) provides an overview of
other major ferry systems in the U.S.24 The ferry
purchasers addressed in this section, and
throughout the report, represent public or
public-private ferry services provided by states,
counties, and cities. Washington serves by far
the largest number of passengers and cars—
about 16 million more passengers and 8
million more cars annually than any other
state.
24
These data are an aggregation of all public or public-
private ferry services provided in each state from the 2014
National Census of Ferry Operators (NCFO). The data include
county, city, and state ferries. We did not include Maine in
Exhibit 5 (even though it is a top ferry system) because the
NCFO had to aggregate its data with Virginia due to data
disclosure rules.
Exhibit 4
U.S. Shipyards with Experience in Ferry
Construction since 1980
Region Count of
shipyards
Southeast (Alabama, Florida, Louisiana, Mississippi,
and Texas) 11
Midwest (Wisconsin)
2
New England (Maine, Massachusetts, and Rhode Island)
3
West (California, Oregon, and Washington)
5
6

Ferry fleets in the U.S. differ on a number of
features including:
Route length. The length of ferry routes
can have significant implications for
vessel construction. For example, the
Alaska Marine Highway System (AMHS)
serves far-flung communities linked
together by some overnight ferries. As
a result, some vessels have quarters to
accommodate two crews and are
designed to operate in relatively
unprotected water.
Cars/passengers served. With its system
part of the state highway system, WSF
purchases only car ferries. However, this
is not universal across fleets. For
example, in New York, a primarily
passenger-only fleet runs via public-
private partnership around
Manhattan.25
25
The public agencies engaged in these partnerships include
agencies such as the Port Authority of New York and New
Jersey, New Jersey Transit, New York City Department of
Operating environment. The nature of
the waterway also affects the types of
vessels purchased by ferry systems.
Some Washington routes need ferries
capable of operating in less protected
areas of the Puget Sound. Alternatively,
North Carolina has ferries for the
relatively protected areas of the Outer
Banks.
Number of routes. The number of
routes can increase the variety of
vessels needed in a fleet, especially
when the routes are in different
operating environments. For example,
Texas has only two short routes in the
Gulf of Texas, which makes streamlining
its fleet easier.
Transportation, and the Metropolitan Transportation
Authority.
Exhibit 5
Route Characteristics of Major U.S. Ferry Systems, 2013
State
# of annual
passengers
(millions)
# of annual cars
(millions) Route miles
Alaska 8.47 3.34 13,386
California 10.13 0.34 1,170
Florida 0.65 0.22 6
Illinois 3.09 0.74 12
Massachusetts 4.86 0.68 433
New Jersey 4.40 0.13 372
New York 13.38 1.50 612
North Carolina 4.15 0.85 165
South Carolina 0.92 0.00 40
Texas 6.12 2.14 7
Washington (Includes non-WSF ferries) 26.00 10.73 2,443
Source: 2013 NCFO Survey. https://www.rita.dot.gov/bts/sites/rita.dot.gov.bts/files/subject_areas/ncfo/ncfo_methods.html
Note:
Includes city, county, and state ferries.
7
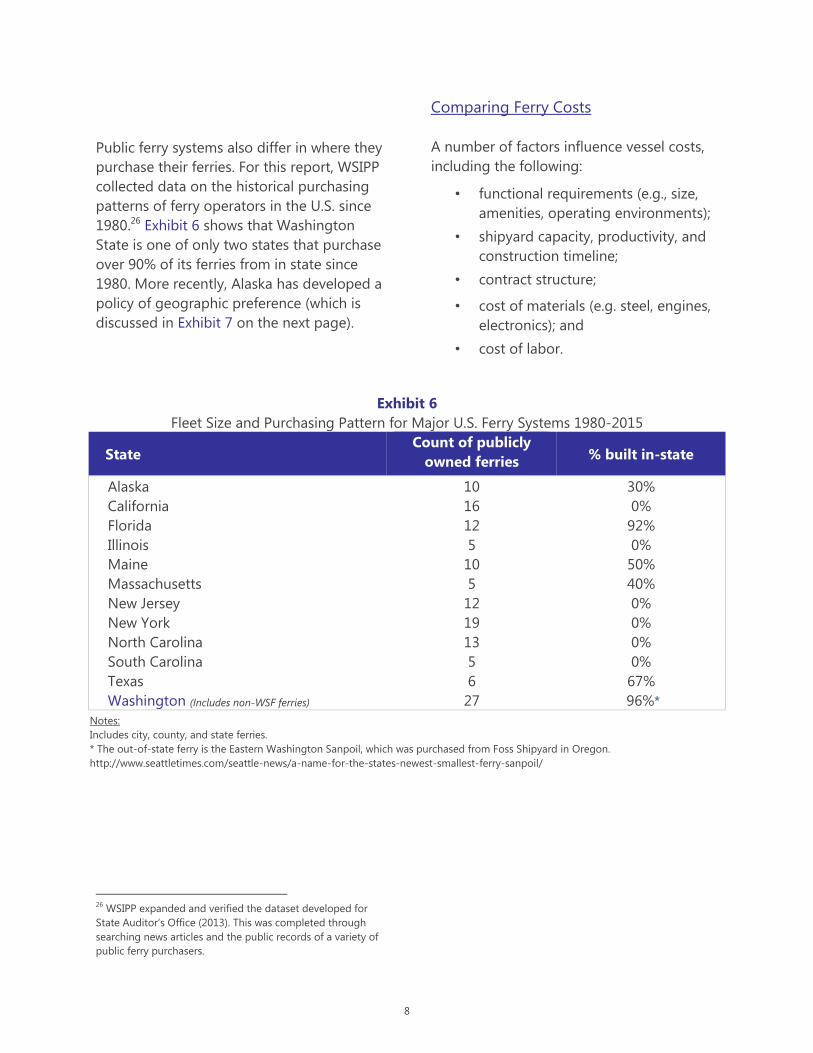
Public ferry systems also differ in where they
purchase their ferries. For this report, WSIPP
collected data on the historical purchasing
patterns of ferry operators in the U.S. since
1980.26 Exhibit 6 shows that Washington
State is one of only two states that purchase
over 90% of its ferries from in state since
1980. More recently, Alaska has developed a
policy of geographic preference (which is
discussed in Exhibit 7 on the next page).
26
WSIPP expanded and verified the dataset developed for
State Auditor’s Office (2013). This was completed through
searching news articles and the public records of a variety of
public ferry purchasers.
Comparing Ferry Costs
A number of factors influence vessel costs,
including the following:
• functional requirements (e.g., size,
amenities, operating environments);
• shipyard capacity, productivity, and
construction timeline;
• contract structure;
• cost of materials (e.g. steel, engines,
electronics); and
• cost of labor.
Exhibit 6
Fleet Size and Purchasing Pattern for Major U.S. Ferry Systems 1980-2015
State Count of publicly
owned ferries % built in-state
Alaska 10 30%
California 16 0%
Florida 12 92%
Illinois 5 0%
Maine 10 50%
Massachusetts 5 40%
New Jersey 12 0%
New York 19 0%
North Carolina 13 0%
South Carolina 5 0%
Texas 6 67%
Washington (Includes non-WSF ferries) 27 96%*
Notes:
Includes city, county, and state ferries.
* The out-of-state ferry is the Eastern Washington Sanpoil, which was purchased from Foss Shipyard in Oregon.
http://www.seattletimes.com/seattle-news/a-name-for-the-states-newest-smallest-ferry-sanpoil/
8

Exhibit 7
Case Studies
Below are two case studies on the procurement practices of British Columbia Ferry Services Inc. (BC
Ferries) and Alaska Marine Highway System (AMHS). Full case studies and citations can be found in
Appendix VIII.
BC Ferries
BC Ferries operates ferry services in British Columbia, Canada. It is the largest ferry operator in the
world, with a fleet of 34 vessels that serves 47 terminals. In 2003, the ferry system was restructured as a
private corporation, with the provincial government as the single shareholder. This restructuring came
on the heels of an unsuccessful enterprise to locally construct three ferries, designed to meet local
transportation needs and bolster the local shipbuilding industry. The cost for the ferries stretched from
a projected $210 million to $463 million, and the schedule fell over two years behind. The ferries
experienced many problems and were sold at a loss shortly after entering service.
After 2003, BC Ferries opened its bidding process for ferry construction. Unlike U.S. ferry operators, BC
Ferries can purchase internationally constructed ships, but with a 25% import duty. In 2004, BC Ferries
awarded a three-ship contract worth $325 million ($267 million U.S.) to a German shipyard. BC Ferries
estimated that even with the import duty, construction in Germany would save almost $80 million. In
2014, BC Ferries again awarded another three-ship contract to a European shipyard, this time in Poland.
Alaska Marine Highway System
While BC Ferries moved toward an open bidding process, AMHS began using a contract process that
involves working more closely with a single in-state shipyard. AMHS serves the longest routes of any
ferry system in the U.S. and has specific construction needs because of overnight routes and rough sea
conditions.
In 2006, AMHS began a design process for a day shuttle ferry that was originally estimated to cost
between $25 million and $30 million. Many design changes resulted in the estimate climbing to $120
million. In 2010, AMHS returned $68 million in federal funds the state received for the ferry and
scrapped the designs developed so far. AMHS instead is in the process of constructing two small ships
for the same $120 million budget. By returning federal grant funds, AMHS had more control over the
bidding process, and was able to limit bidding to in-state shipyards.
To negotiate the price of the new ferries, AMHS used a "construction manager/general contractor"
(CMGC) process. Unlike a traditional “low-bid” process, the shipyard is involved early in the design
process. When the shipyard is familiar with the design, the shipyard negotiates a guaranteed maximum
price. Because of its early involvement, the shipyard can assist in developing a design that aims to
reduce construction costs. The only shipyard to participate in the CMGC bidding process was Vigor
Alaska, which leases the Ketchikan shipyard owned by the state. AMHS was able to negotiate with Vigor
Alaska to construct the two day ferries for the $120 million maximum agreed upon price.
9

Functional requirements. A wide variety of ship
design decisions affect construction costs. This
includes a single- or double-ended design; the
amount of steel necessary for the vessel’s
projected lifespan; designing the ferry to
operate in the appropriate waterways;
compatibility with terminals; and the provision
of food or other amenities for passengers.
For example, WSF use a double-ended
configuration that increases the speed of on-
and off-loading passengers and cars but may
also add to construction costs. WSF staff report
trying to maintain a high degree of uniformity
among its ferries. Standardization may
reduce the costs and complexity of
operation, maintenance, and crew training
but may also raise costs by making it
difficult for shipyards to negotiate for best
prices.
Shipyard capacity, productivity, and timeline.
The capacity of the shipyard can also impact
ferry construction costs. As discussed
previously, ferries are a small part of the
shipbuilding industry, with larger contacts
for ships generated by oil and natural gas
exploration or the navy. When oil prices are
high, shipyards are less likely to bid on ferry
construction, and the ferry construction
prices are likely higher.
When shipyards have slack capacity, they
may decide to bid competitively on ferry
projects in order to maintain their work
force. For example, the AMHS negotiated
with Vigor Alaska to construct its ferries
during the summer months when the
shipyard is less busy.27
27
https://www.adn.com/business/article/new-ferry-contract-
part-effort-create-shipbuilding-industry-alaska/2014/10/06/
The efficiency with which a shipyard can
build a vessel can also affect construction
costs. Many variables could affect efficiency,
including skill of the labor force, extent of
pre-outfitting of the vessel, technological
sophistication of the shipyard, etc. There are
standard metrics for the number of labor
hours it takes a shipyard to produce a ship,
after adjusting for the complexity of the
vessel; however, information on shipyard
efficiency is proprietary.28
Timelines can also impact cost. WSF cites
the compressed timeline as an important
factor in cost overruns for Washington’s
Chetzemoka ferry.29 The Chetzemoka was
built after the Steel Electric class ferries were
unexpectedly retired. The final cost of the
ferry exceeded the initial contract due in
part to the large number of change orders
used to correct and change the design after
construction had already begun. For a full
discussion, see Appendix IX.
The U.S. Coast Guard must inspect and
provide passenger ferries with a certificate of
inspection prior to operation. WSF has
involved the Coast Guard early in the design
phase to prevent delays or changes.30 When
the design phase overlaps with the building
phase of the ships, the result can be costly
change orders and delays as well as limiting
the degree of pre-outfitting of the ships,
which reduces building efficiency.31 Research
28
For example, Compensated Gross Tonnage (CGT) is a
standard method for comparing shipyard output, both
nationally and internationally. It is calculated by multiplying
the tonnage of a ship by a coefficient that captures the
complexity of the vessel. 29
State Auditor’s Office (2013), p. 26. 30
https://www.uscg.mil/proceedings/archive/2005/Vol62_No
4_Wint2005-06.pdf, p. 6-8. 31
Moyst, H., & Das, B. (2005). Factors affecting ship design
and construction lead time and cost. Journal of ship
production, 21(3), 186-194.
10
shows that pre-outfitting the components of
the ship is less expensive than adding systems
later in the construction process.32 However,
pre-fitting requires clear design plans from
the beginning.
Contract structure. The way contracts structure
payment schedules, responsibility for change
orders and risk for delays and overruns can
also impact final costs to ferry purchasers.33
The number of ships in a contract can also
affect construction costs. Multi-ship contracts
can reduce the per-vessel ship cost. With the
greater predictability that comes with multi-
ship agreements, shipyards have greater
incentive to bid, which can increase
competition. According to maritime experts,
this predictability and scale can also
incentivize shipyards to provide up-front
capital investment in their yards for these
specific ships.34 This greater predictability
allows shipyards to plan to utilize the capacity
of their yards and maintain their workforce.
Multi-ship contracts also provide an incentive
for shipbuilders to invest in the engineering
and planning functions, leading to more
efficient construction processes and lower
costs.
Materials. The cost of materials also can
significantly affect vessel cost. Most material
costs are the same regardless of shipyard
location. For example, U.S. steel prices are the
same nationwide, although transportation
costs for steel to the shipyard may vary.
Similarly, shipyards often purchase the
components for their vessels (propulsion
systems, electronics, etc.) from the same
32
http://www.marineinsight.com/naval-
architecture/advanced-outfitting-in-shipbuilding/ 33
D. Singer, Associate Professor, Naval Architecture and
Marine Engineering, University of Michigan (personal
communication, May 3, 2016). 34
Miroyannis, A. (2006). Estimation of ship construction costs.
Master’s thesis, Massachusetts Institute of Technology (MIT).
providers, so there is little geographic
difference in cost, according to experts
interviewed for this study.
Labor. In interviews, maritime experts, shipyard
representatives, and ferry operators pointed to
regional differences in labor costs as a
potentially significant driver in ferry construction
costs. To compare shipbuilding labor costs in
Washington State to costs throughout the U.S.,
we examined several national data sources. The
full methodology and results are provided in
Appendix VI.
We focused on the nine states with the largest
number of shipbuilding employees—Alabama,
California, Connecticut, Louisiana, Maine,
Mississippi, Texas, Virginia, and Washington. In
2012, average pay in Washington State shipyards
was slightly above the other eight states.35
Shipbuilding labor costs in Washington were
between 3% to 13% higher than the comparison
states.
Regional labor cost differences as measured here
can result from a number of factors. They can
reflect differences in worker skill and productivity
levels, competitive conditions in regional labor
markets, different state-by-state sub-industry
mixes within the aggregate ship and boat
building industry. In 2012, Washington
employed 3.8% of the U.S. ship building and
repair workforce with about 4,000 workers.36 The
number of establishments has been relatively
stable from 2000 to 2012—160 in 2007 and 150
in 2012.37 Exhibit 8 (next page) illustrates the size
of Washington’s industry compared to the other
eight major shipbuilding states.
35
Average pay is calculated using the total payroll divided by
number of employees. See Appendix VI for details. 36
This includes only civilian employees. 37
Mefford, C. (2013). Washington State maritime cluster:
Economic impact study. Seattle, WA: Community Attributes
Inc. Available online at:
http://www.psrc.org/assets/10304/Maritime-Impact.pdf.
11

Exhibit 8
Employment in the Ship Building and Repair Industry,
Nine Largest Ship Building States
Source: 1997, 2002, 2007, and 2012 Economic Census.
Note:
Some data is imputed at the midpoint of reported range due to data suppression.
12

III. Identification of Barriers to
More In-State Bids
As part of the legislative assignment, WSIPP
was asked to identify barriers to receiving
three or more in-state bids on WSF ferry
construction. WSF ferry contracts for the last
three classes of ferries have had one to two
bids on new construction contracts
(see Exhibit 2 on page 4).
We identified barriers in three categories:
1) industry,
2) statutory, and
3) contractual.
Industry
Two shipyards in Washington State have
capacity to build the Olympic class ferries.
WSF evaluates shipyard qualifications to bid on
new ferry construction. Prospective yards are
evaluated based on a number of factors,
including physical assets, workforce, financial
status/bonding capacity, and past
performance.38
Exhibit 9 provides some information on major
Washington shipyards. According to WSF, only
Vigor Industrial and Dakota Creek are currently
known to be qualified to bid on the 144-car
ferries. However, Dakota Creek presently does
not have a state-sponsored apprenticeship
program. Nichols Brothers has a state-
sponsored apprenticeship program, but it does
38
M. von Ruden, WSF Director of Vessels (personal
communication, September 2, 2016).
not currently have the capacity to be the lead
shipyard in constructing the 144-car ferries
(see Exhibit 9 on the next page). At this time,
Vigor Industrial is the sole in-state bidder that
meets all state requirements.
Consolidation of the American
Shipbuilding Industry
Following World War II and intensifying through
the 1970s, the American shipbuilding industry has
contracted. Where previously multiple firms had
clustered around an advantageous geographic
location, regional markets frequently have
consolidated to a single firm.* As of August 2014,
only two companies held over 50% of the domestic
national shipbuilding market share.** Shipyards
increasingly tend to specialize in specific vessel
types, further reducing potential competition.
During the same time period, few new medium or
large shipyards have been established. With the
exception of Austal U.S.A., founded in 1999, major
American shipyards are many decades old.***
There
are high barriers to entry in the form of capital
requirements that deter new shipbuilding yards.
Also, maritime experts we interviewed stated that
there are only a limited number of viable physical
locations in the U.S. generally, and in Puget Sound
specifically, for new shipyards. These industrially-
zoned areas are sometimes crowded out by
commercial or residential zones.
* Walters, W.W. (2000). Geographic record: American naval
shipbuilding, 1890-1989. Geographical Review, 90(3), 424-426.
** Eisenhower School for National Security and Resource
Strategy (2015), p. 2.
*** Ibid. p. 20.
13

Exhibit 9
Major Washington State Shipyards
Name Location Founded # of
employees Note
Dakota Creek Anacortes, WA 1975 600 No state-approved
apprenticeship program
Nichols Brothers Freeland, WA 1964 265 Past partner in constructing
Olympic class ferries
Vigor Industrial Seattle, WA
Acquired Todd
Shipyard in
2011
2000 Leading shipyard on the
last eight WSF ferries
Source: Information on founding dates and number of employees is from Mefford (2013), p. 29.
The oil and natural gas industry can also
impact the number of bids. When oil prices are
high, shipyards are busy building for these
industries. When oil prices fall, ferry purchasers
reported to WSIPP in interviews as having
greater interest from shipyards looking to use
up their extra capacity.
Contractual
As discussed previously, as the number of
ships in a contract increases, so does the
potential for cost-savings through shipyard
learning and infrastructure investment. Ship
purchasers interviewed for this study also
reported that interest from shipyards
increased along with the number of ships in
a contract.
Statutory
State law requires bidders on state ferry
construction have a state-approved
apprenticeship program and be located in
state.
It is possible the apprenticeship program
does affect the number of in-state bids. The
program could potentially bolster the
shipbuilding industry through training the
workforce. Alternatively, the program could
potentially deter shipyards without qualified
apprenticeship programs from either
bidding on contracts or discourage smaller
yards from developing their capacity to bid
on larger projects. WSIPP was unable to
empirically evaluate this policy due to
insufficient data about how shipyards would
behave if this requirement were removed.
The build-in-Washington requirement
prevents only non-Washington shipyards
from bidding on new ferry construction;
therefore, the requirement does not have a
direct influence on the number of in-state
bidders. The next section of the report will
conduct a benefit-cost analysis to evaluate
the net policy impact of removing that
requirement and shifting ferry construction
out of state.
14

Why We Make No Policy
Recommendations Regarding Barriers to
In-State Bidders
WSIPP was asked to make policy
recommendations to increase the number of
in-state bids to three. In Washington State,
the fundamental barrier to achieving three in-
state bids is the small number of capable
shipyards. The number of qualified yards
could potentially increase to two if Dakota
Creek satisfied the Apprenticeship Act
requirements or if those requirements were
removed or altered.
Other policy practices we discussed,
particularly increasing the number of ships in
a contract, might encourage shipyards to
satisfy state apprenticeship requirements
and/or increase their capabilities to compete
for the new contracts. However, WSIPP does
not have sufficient empirical evidence to
recommend those policy changes.
15

IV. Analysis of Constructing Ferries
Out of State
The legislature directed WSIPP to perform a
benefit-cost analysis (BCA) of the state’s ferry
procurement practices. The current policy is
relatively unique among public entities in the
U.S. and requires WSF to solicit and accept
bids for the construction of new ferries only
from shipyards located within Washington
State. We examine a possible change in
current procurement practice: moving
construction to an out-of-state shipyard. To
be clear, this analysis is about procurement
policy, acquisition costs, and the location of
shipbuilding activity, not about changes to
the state’s transportation system.
The following section describes the
methodology and results of WSIPP’s analysis
of ferry procurement policy: detail is provided
in Appendix I. In addition to a BCA, WSIPP
conducted a supplementary economic impact
analysis (EIA). While a BCA helps determine
whether the benefits of a policy change
outweigh its costs, an EIA is intended to
determine how a policy affects the economic
activity in a region.
For both of these analyses, WSIPP uses an
identical scenario—the purchase of a single
Olympic class ferry. The Tokitae and Samish,
completed in 2014 and 2015, respectively, are
examples of this type of ship. These ships
have a displacement of 4,384 tons, are
equipped with two 3,000 horsepower engines,
and have a passenger capacity and
a vehicle capacity of 1,500 and 144,
respectively.39 WSF’s expected acquisition
39
See WSDOT Ferries Division Fleet Guide,
http://www.wsdot.wa.gov/NR/rdonlyres/AB031249-16EE-4422-
BBEA-
8D2C50A17D9C/0/FerryFleetGuideMarch2015FinalDraft.pdf.
cost for one of these ships constructed under
the current build-in-Washington policy is
approximately $130 million (in 2015 dollars).40
The purchase year is 2021, based on WSF’s
adjust long-range plan. We adjusted prices to
future values using a shipyard inflation rate
(see Appendix I).
WSIPP staff also considered conducting a BCA
of the apprenticeship program. WSIPP would
need access to a wide variety of proprietary
information in order to do so. The costs of
such a program to a shipyard could include
start-up costs, ongoing overhead from
reporting, and presumably lowered
productivity due to less experienced workers
and increased supervision requirements.
Benefits could include lower employee
acquisition and retention costs. WSIPP
attempted but were unable to obtain data on
labor hours for the construction of the
Olympic class vessels.
An evaluation of the apprentice program
requires information on how the program
affects shipyard workers. For example,
tracking the career paths of shipyard worker
apprentices might provide the state with
better insight on the program’s contribution
to Washington’s labor force. This type of
program evaluation is beyond the scope of
this study.
40
Washington State Department of Transportation, Ferries
Division. (2009). Final long-range plan. Available at:
http://www.wsdot.wa.gov/Ferries/Planning/. Information on
WSF’s updated procurement plan was provided to WSIPP via
email (M. von Ruden, WSF Director of Vessels (personal
communication, June 28, 2016)).
16

Overview of BCA
BCA is an analytical tool developed by
economists to estimate the monetary value of
benefits and costs resulting from a government
program or policy. BCA enables a comparison
of a proposed policy change relative to a
“counterfactual,” usually existing policy,41 where
the net benefit of each policy alternative is
calculated separately as its benefits, minus its
costs.
BCA has several other distinctive features,
including the discounting of the future stream
of benefits and costs to present value;
measurement of costs in terms of foregone
opportunities; exclusion of benefits and costs
that represent transfers between individuals;42
and focusing largely on primary effects to
41
Vining, A.R., Greenberg, D.H., Boardman, A.E., & Weimer, D.L.
(2011). Cost-benefit analysis: concepts and practice. Boston
[etc.]: Prentice Hall points out that implicit in this comparison is
the establishment of a cause-and-effect relationship between
the impacts of a policy or program change and the expected
benefits and costs (pp. 8-9). That is, BCA must not attribute
benefits and costs to a particular policy change if these
outcomes would have occurred regardless of the policy
adopted. 42
Transfers are excluded from BCA of government policies and
programs. For example, taxes raised to fund an income transfer
program represent a transfer from one group (taxpayers) to
another group (program recipients) and as such are not
counted as either a program cost or benefit. However, the
administrative costs of collecting taxes and managing the
income transfers would be counted as a cost. In addition, the
distortionary effects of taxes on economic activity would be
counted as a cost.
avoid the potential for double counting of
benefits or costs.43 BCA assumes that productive
inputs such as capital, labor, and natural
resources are fully employed, and as such,
reallocating those resources to implement a new
policy will typically incur an opportunity cost.44
The conceptual framework is displayed
in Exhibit 10.
Determining net benefits requires the calculation
of a number of intermediate parameters,
including, for example, the proportion of
shipyard workers who live in Washington State.
The true values of these parameters are
unknown. Appendix I describes our
43
Vining et al. (2011) explain that primary effects should always
be included in BCA while the secondary effects (often referred
to as second-round, spillover, side, pecuniary, or indirect
effects) can and should be ignored to avoid double counting of
benefits and costs (p. 115). Such secondary effects should only
be included in BCA if secondary markets are distorted and
prices in secondary markets change (p. 116). The focus on
primary markets also means that multiplier effects are excluded
from BCA (p. 20). 44
The exception would be the case in which unemployed
resources are used to implement a government program or
policy. See Vining et al. (2011) for a discussion of alternative
methods of evaluating the cost of using unemployed workers
to implement a government program or policy (pp. 105-108).
Exhibit 10
Conceptual Framework of the Benefit-Cost Analysis
Benefits:
Expected acquisition
cost savings to
Washington State
taxpayers
Costs:
Loss of earned
income to
Washington shipyard
workers and
shipyards
Net policy impact
17

methodology for estimating the values along
with an estimate of their uncertainty. WSIPP
incorporates uncertainty around these estimates
by running many statistical simulations of the
BCA. In each of these runs, the exact value of
each of the parameters can vary within a range.
This yields both an estimate of the overall net
benefit based on the average of the simulation
runs and a distributional measure—the
percentage of cases in which the net benefit
exceeds zero.
BCA focuses on measuring benefits and costs
for individual persons who have “standing” in
the analysis.45 Although BCA results in a single
measure of net benefits, WSIPP’s approach to
BCA breaks down benefits and costs from the
perspectives of different groups, such as
those directly affected by a policy (e.g.,
shipyard employees) and taxpayers. The BCA
presented in this report differs from WSIPP’s
standard approach;46 we developed a
standalone benefit-cost model for the current
analysis.47
Calculation of benefits. For this analysis,
Washington State taxpayers have standing as
potential beneficiaries affected by changes in
45
It is important to note that BCA is concerned with the well-
being of individual persons who have standing. Entities such as
businesses, organizations, and governmental units are not
persons and therefore do not have standing in BCA (however,
the owners of businesses have standing if they are persons). In
conducting studies for the Washington Legislature, WSIPP’s
approach is that all current Washington State residents have
standing in the BCA. 46
See
http://www.wsipp.wa.gov/TechnicalDocumentation/WsippBenef
itCostTechnicalDocumentation.pdf. 47
Over the last 20 years, WSIPP has developed a custom
benefit-cost model that addresses the benefits and costs of
individually; based interventions (e.g., tutoring programs in K–
12 education, programs to reduce recidivism for individuals in
prison, substance abuse treatment, etc.). The policy question
posed in this report is much broader than an individual
intervention; rather than rely on our existing benefit-cost model
for this analysis, we developed a new model specifically for the
purpose of this assignment.
taxes from an increase or decrease in ferry
acquisition price. We estimate change in
acquisition price from constructing a ferry out
of state based on a historical ferry price
analysis discussed in-depth in Appendix II. We
compare Washington State’s historical ferry
purchase price to ferry purchases by other
state, county, and city governments in the
U.S., controlling for a variety of factors,
including the following:
passenger and vehicle capacity,
horsepower,
hull material,
Washington’s regulatory environment (by
including ferries purchased in
Washington by non-WSF ferry operators),
and
vessel tonnage.
The analysis suggests that other ferry
purchasers pay on average about 9% less than
WSF for a similarly equipped vessel. However,
our estimate has a large margin of error
(between about -40% to +13%), which is not
surprising given the small population of
ferries and high level of variation. The 9%
difference, when applied to the price of the
$130 million ferry, results in a $12.7 million
benefit, adjusted to a present discounted
value of $10.5 million. The BCA incorporates
the uncertainty associated with the estimate.
Washington State is very restricted in its
ability to use federal funds for new ferry
vessel construction due to its in-state
geographic preference. Even if policy was
changed to open bidding, it is unlikely that
Washington could secure significant sources
of funding for new ferry construction from
current federal funds.48 However, the U.S.
48
Most federal funding for ferry systems comes from the Ferry
Boat Discretionary Fund, administered by Federal Highway
Administration. The fund is distributed via formula, and
18
Department of Transportation announced in
October 2016 that it would accept
applications for infrastructure grants under a
new program that could potentially fund new
vessel construction.49 WSIPP had insufficient
notice of this new program to incorporate it
into the calculation of benefits. It is unclear
whether WSF would win the competition for
such a grant, and there is uncertainty over the
program’s future in light of the change in
presidential administration.50 However,
securing federal grant funds could
significantly increase the benefits from a
policy change to open bidding.51
Calculation of costs. In-state shipyard workers
and owners have standing in the calculation
of costs because a policy change could
directly affect their income. We estimate a
number of intermediate factors to determine
how shifting the construction of a $130
million ferry out-of-state would affect these
two groups. For each parameter in our
analysis, we include a range of possible values
in order to incorporate the margin of error
(see Appendix I for a full discussion).
After adjusting for shipbuilding specific
inflation, we expect the future cost of the ferry
to be $135.72 million (in 2015 dollars). We
calculate that 60% of the ferry cost would be
spent on labor (rather than materials)
Washington State would not likely be able to increase its
funding from this source if its geographic preference were
removed. The Federal Transit Administration (FTA) also
administers a smaller fund, which WSF currently has secured for
preservation of its terminals and vessels. WSIPP spoke with two
ferry purchasers that have qualified for FTA funding. Shipyards
have to satisfy many requirements in order to be a qualified
builder under that FTA funding, which discourages some
bidders. 49
https://www.transportation.gov/build-
america/fastlane/fastlane-ii-notice-funding-opportunity 50
http://www.infrainsightblog.com/2016/11/articles/financing/u
-s-department-of-transportation-solicits-project-applications-
for-850-million-in-fastlane-grants/ 51
Opening up bidding would not require construction to occur
out-of-state, which is the policy scenario evaluated in the BCA
and EIA.
resulting in a total of $81.47 million of
foregone income earned from ferry
construction. We divide that amount between
workers and owners based on a proportion
derived from the 2012 Economic Census. We
also subtract the proportion of income likely
earned by workers or owners living outside of
Washington State.
Workers and owners would not lose the
entirety of the $81.5 million because they
would be gaining income in other ways. Our
additional analyses (see Appendix IV) suggest
that historically there has not been a strong
and direct connection between in-state ferry
construction and the size of the Washington
shipbuilding labor force.
We account for the likelihood that shipyard
workers would be able to get jobs in other
industries (see Appendix V) and that shipyards
could fill up their slack capacity (see Appendix
IV). We estimate shipyard employment will fall
by 1.2% when ferry construction is shifted out of
state and that 14.3% of resources (both shipyard
workers and the shipyard’s capital resources) will
not be able to shift to other activities. This results
in a loss of income of $5.66 million to
Washington shipyard workers and $3.09 million
to Washington shipyard owners.
As is standard economic practice, we discount
those numbers to represent the present value of
the lost income, which gives us an estimate of
$4.69 million of lost income for Washington
shipyard workers and $2.56 million in lost
income for Washington shipyard owners.
19

Exhibit 11
Some Intermediate Variables Used in the Calculation of Costs of Building a Ferry Out of State
Expected cost of ferry in future (2015 dollars) $135.72 million
Share of shipyard revenue spent on materials, labor 40%, 60%
Income earned during ferry construction $81.47 million
Percentage of income earned by shipyard workers 54%
Percentage of income earned by shipyard owners 46%
Income earned by shipyard workers $44.32 million
Income earned by shipyard owners $37.15 million
Percentage of shipyard workers living in WA 97.8%
Percentage of shipyard owners living in WA 59.8%
Income earned by shipyard workers living in WA $43.33 million
Income earned by shipyard owners living in WA $22.21 million
Impact of ferry construction on shipyard employment 1.25%
Transitional unemployment share 14.3%
Income lost by shipyard workers living in WA $5.66 million
Income lost by shipyard owners living in WA $3.09 million
Income lost by WA shipyard workers (present discounted value) $4.69 million
Income lost by WA shipyard owners (present discounted value) $2.56 million
Discussion of the results. Subtracting the
costs of the policy change from the benefits
results in an estimated present value of
about $3.25 million for out-of-state
construction (see Exhibit 12). Of course,
there is uncertainty around all of our
parameter estimates. To account for this
uncertainty, we ran our benefit-cost model
500,000 times while allowing our estimates
to vary. This results in positive net benefits
54% of the time (see Exhibit A3 in Appendix
I for more detail).
20
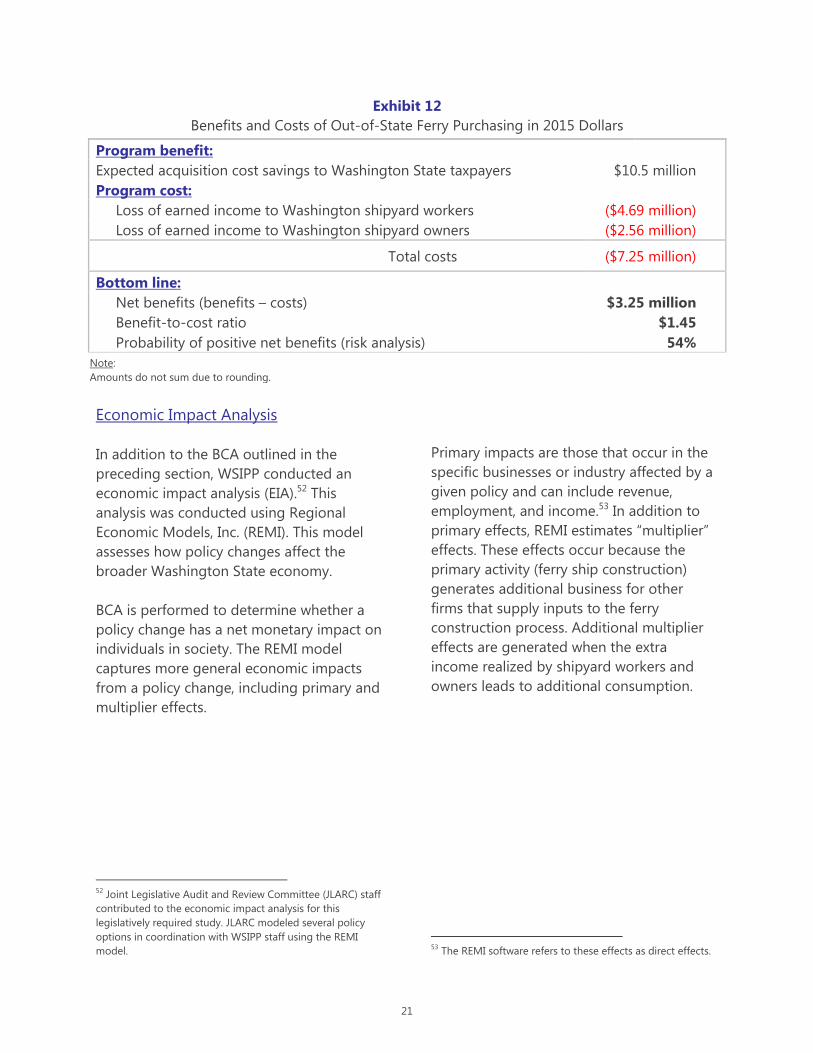
Exhibit 12
Benefits and Costs of Out-of-State Ferry Purchasing in 2015 Dollars
Program benefit:
Expected acquisition cost savings to Washington State taxpayers $10.5 million
Program cost:
Loss of earned income to Washington shipyard workers ($4.69 million)
Loss of earned income to Washington shipyard owners ($2.56 million)
Total costs ($7.25 million)
Bottom line:
Net benefits (benefits – costs) $3.25 million
Benefit-to-cost ratio $1.45
Probability of positive net benefits (risk analysis) 54%
Note:
Amounts do not sum due to rounding.
Economic Impact Analysis
In addition to the BCA outlined in the
preceding section, WSIPP conducted an
economic impact analysis (EIA).52 This
analysis was conducted using Regional
Economic Models, Inc. (REMI). This model
assesses how policy changes affect the
broader Washington State economy.
BCA is performed to determine whether a
policy change has a net monetary impact on
individuals in society. The REMI model
captures more general economic impacts
from a policy change, including primary and
multiplier effects.
52
Joint Legislative Audit and Review Committee (JLARC) staff
contributed to the economic impact analysis for this
legislatively required study. JLARC modeled several policy
options in coordination with WSIPP staff using the REMI
model.
Primary impacts are those that occur in the
specific businesses or industry affected by a
given policy and can include revenue,
employment, and income.53 In addition to
primary effects, REMI estimates “multiplier”
effects. These effects occur because the
primary activity (ferry ship construction)
generates additional business for other
firms that supply inputs to the ferry
construction process. Additional multiplier
effects are generated when the extra
income realized by shipyard workers and
owners leads to additional consumption.
53
The REMI software refers to these effects as direct effects.
21

REMI reports on a wide array of outcomes,
but in Exhibit 13 we focus on non-farm
private employment and “value added,”
which is similar to Gross Domestic Product
(GDP)54 (detailed definitions for these are in
Appendix VII). The main impacts of the
analyzed policy change occur in the years
2021 and 2022 (when construction would
occur). As a result of building a $130 million
ferry out of state, we expect a decrease in
Washington’s shipyard employment (an
54
We use value added instead of GDP for impact outcomes
to facilitate the analysis of direct and indirect impacts in
Exhibit 13. The two accounting concepts are virtually
identical as can be seen from this definition provided by the
Bureau of Economic Analysis (BEA): “The value added of an
industry, also referred to as gross domestic product (GDP)-
by-industry, is the contribution of a private industry or
government sector to overall GDP. The components of value
added consist of compensation of employees, taxes on
production and imports less subsidies, and gross operating
surplus. Value added equals the difference between an
industry’s gross output (consisting of sales or receipts and
other operating income, commodity taxes, and inventory
change) and the cost of its intermediate inputs (including
energy, raw materials, semi-finished goods, and services that
are purchased from all sources).” See
http://www.bea.gov/faq/index.cfm?faq_id=184.
average of about 280 jobs or about 4% of
the forecasted shipbuilding and
maintenance jobs in both 2021 and 2022).55
The value that shipbuilding directly adds to
the state GDP would also fall by an average
of about $25 million in 2021 and 2022. After
2022, the selected outcome variables
quickly resume a path that closely matches
the baseline forecast.
55
Note these are total jobs rather than employed persons.
The same employed person could hold several jobs
simultaneously.
Exhibit 13
Policy Simulation Results, Economic Impact Analysis:
Yearly Outcomes Averaged Over 2021-2022 (2015 Dollars)
Outcome Baseline
scenario
Alternate
scenario
Total policy impact
(= direct effect + multiplier effect)
Direct effect Multiplier
effect
Total policy
impact
Private non-farm
employment 3,599,945 3,599,286 -280 -379 -659
Value added $492,068
million
$492,000
million ($25 million) ($43 million) ($68 million)
22

V. Conclusion
The BCA and EIA provide somewhat
contradicting information on the impact of
moving ferry construction out of state. The
BCA shows a small net positive benefit
($3.25 million). The EIA shows a negative
impact on the state economy using a variety
of different measures including a two-year
average loss of about 659 jobs and about
$68 million in value added to the state GDP.
It is important to keep in mind the two
types of analyses are not directly
comparable, as they incorporate different
assumptions and look at different
information. The BCA is focused specifically
on the direct impact of a policy change to
specific groups in Washington State, while
the EIA attempts to assess the indirect and
long-term impacts of such a change to the
entire state economy.
Neither analysis predicts a substantial
impact on Washington’s economy (either
positively or negatively) from keeping ferry
construction in state or moving construction
to out-of-state shipyards. The BCA showed
a positive net benefit only slightly more
than half of the time in our simulations, and
the average effect was only 2.5% of the total
ferry purchase price. The EIA suggested that
building a ferry out-of-state would have
only a short term impact on the
shipbuilding industry.
23
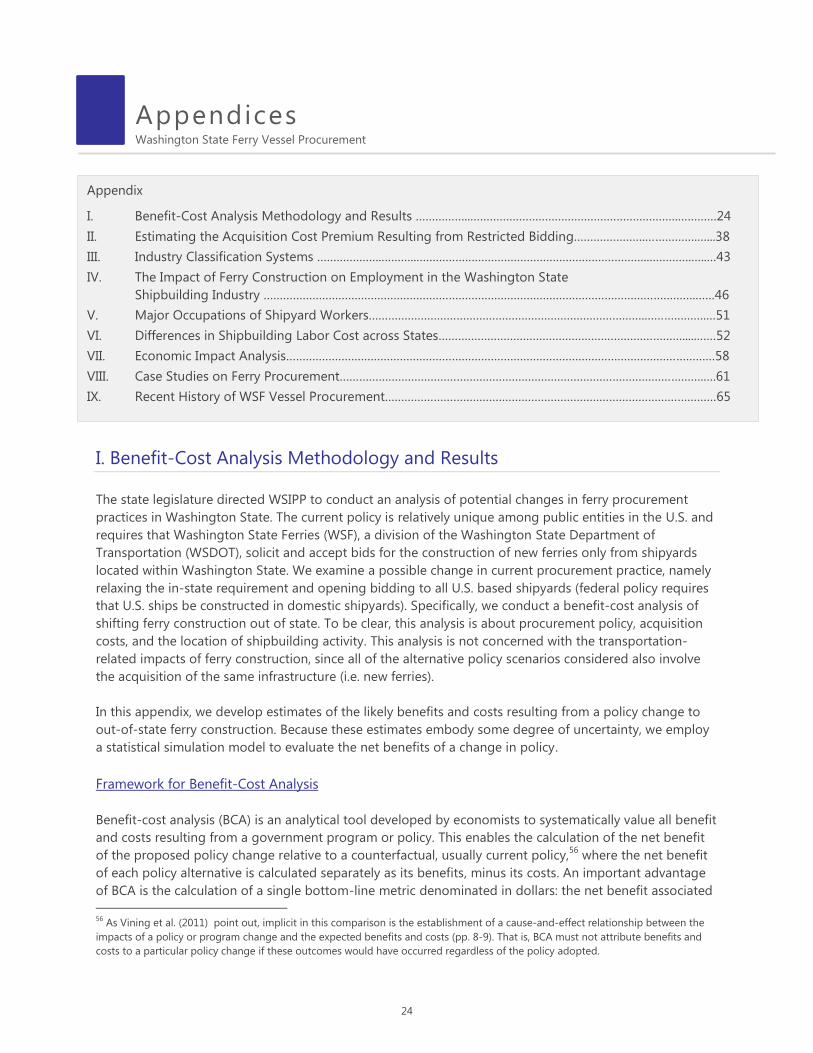
Appendix
I. Benefit-Cost Analysis Methodology and Results ……………..……………………………………………………….…………24
II. Estimating the Acquisition Cost Premium Resulting from Restricted Bidding………………….…………….…...38
III. Industry Classification Systems ………………..………..……………….……………………………………………..………….…..…43
IV. The Impact of Ferry Construction on Employment in the Washington State
Shipbuilding Industry …………………………………………………………………………………………………………………….……46
V. Major Occupations of Shipyard Workers………………………………………………………………………….……………….…51
VI. Differences in Shipbuilding Labor Cost across States………………………………………………………………….....……52
VII. Economic Impact Analysis……………………………………………………………………………………………………………………58
VIII. Case Studies on Ferry Procurement………………………………………………………………………………………………….….61
IX. Recent History of WSF Vessel Procurement…………………………………………………………………………………………65
Appendices
Washington State Ferry Vessel Procurement
I. Benefit-Cost Analysis Methodology and Results
The state legislature directed WSIPP to conduct an analysis of potential changes in ferry procurement
practices in Washington State. The current policy is relatively unique among public entities in the U.S. and
requires that Washington State Ferries (WSF), a division of the Washington State Department of
Transportation (WSDOT), solicit and accept bids for the construction of new ferries only from shipyards
located within Washington State. We examine a possible change in current procurement practice, namely
relaxing the in-state requirement and opening bidding to all U.S. based shipyards (federal policy requires
that U.S. ships be constructed in domestic shipyards). Specifically, we conduct a benefit-cost analysis of
shifting ferry construction out of state. To be clear, this analysis is about procurement policy, acquisition
costs, and the location of shipbuilding activity. This analysis is not concerned with the transportation-
related impacts of ferry construction, since all of the alternative policy scenarios considered also involve
the acquisition of the same infrastructure (i.e. new ferries).
In this appendix, we develop estimates of the likely benefits and costs resulting from a policy change to
out-of-state ferry construction. Because these estimates embody some degree of uncertainty, we employ
a statistical simulation model to evaluate the net benefits of a change in policy.
Framework for Benefit-Cost Analysis
Benefit-cost analysis (BCA) is an analytical tool developed by economists to systematically value all benefit
and costs resulting from a government program or policy. This enables the calculation of the net benefit
of the proposed policy change relative to a counterfactual, usually current policy,56
where the net benefit
of each policy alternative is calculated separately as its benefits, minus its costs. An important advantage
of BCA is the calculation of a single bottom-line metric denominated in dollars: the net benefit associated
56
As Vining et al. (2011) point out, implicit in this comparison is the establishment of a cause-and-effect relationship between the
impacts of a policy or program change and the expected benefits and costs (pp. 8-9). That is, BCA must not attribute benefits and
costs to a particular policy change if these outcomes would have occurred regardless of the policy adopted.
24

with a particular policy change.57
BCA focuses on measuring benefits and costs for individual persons who
have standing in the analysis.58
BCA has several other distinctive features including the discounting of the future stream of benefits and
costs to present value; measurement of costs in terms of foregone opportunities; exclusion of benefits
and costs that represent transfers between individuals;59
and focusing largely on primary effects to avoid
the potential for double counting of benefits or costs.60
In addition, BCA assumes that productive inputs
such as capital, labor, and natural resources are fully employed and, as such, reallocating those resources
to implement a new policy will typically incur an opportunity cost.61
The estimation of benefits and costs almost always involves uncertainty, and WSIPP’s approach to BCA is
to directly model uncertainty by running multiple statistical simulations of the BCA, yielding both an
estimate of the overall net benefit based on the average of the individual simulations and a distributional
measure—the percentage of cases in which the net benefit exceeds zero. Although BCA results in a single
measure of net benefits, our approach to BCA breaks down benefits and costs from the perspectives of
different groups of persons, such as those directly affected by a policy and taxpayers more generally.
57
Future streams of benefits and costs are measured in 2015 dollars, so the effects of general price inflation are removed from the
analysis. Because ship construction costs have been rising faster than the general rate of inflation, we develop a shipyard specific
price index for the analysis. 58
It is important to note that BCA is concerned with the well-being of individual persons who have standing. Entities such as
businesses, organizations, and governmental units are not persons and therefore do not have standing in BCA (however, the owners
of businesses have standing if they are persons). In conducting studies for the Washington Legislature, WSIPP’s approach is that all
current Washington State residents have standing in the CBA. 59
Transfers are excluded from BCA of government policies and programs. For example, taxes raised to fund an income transfer
program represent a transfer from one group (taxpayers) to another group (program recipients) and as such are not counted as
either a program cost or benefit. However, the administrative costs of collecting taxes and managing the income transfers would be
counted as a cost. In addition, the distortionary effects of taxes on economic activity would be counted as a cost. 60
Vining et al. (2011) explain that primary effects should always be included in BCA while the secondary effects (often referred to as
second-round, spillover, side, pecuniary, or indirect effects) can and should be ignored to avoid double counting of benefits and
costs (p. 115). Such secondary effects should only be included in BCA if secondary markets are distorted and prices in secondary
markets change (pg 116). The focus on primary markets also means that multiplier effects are excluded from BCA (p. 20). 61
The exception would be the case in which unemployed resources are used to implement a government program or policy. See
Vining et al. (2011) for a discussion of alternative methods of evaluating the cost of using unemployed workers to implement a
government program or policy (pp. 105-108). In the present analysis, we develop a methodology to account for the possibility of
unemployed resources in the shipyard industry.
Exhibit A1
Conceptual Framework—Calculating Net Benefits of Out-of-State Ferry Construction
Benefits Stakeholders
Expected acquisition cost savings Washington State taxpayers
Costs
Loss of earned income Shipyard workers living in WA
Shipyard owners living in WA
Net benefits
Expected acquisition cost savings minus loss of earned income
25

The conceptual framework for the calculation of the net benefits of changing to out-of-state ferry
construction is displayed in Exhibit A1. To determine net benefits as described in Exhibit A1 requires the
calculation of a number of intermediate parameters which are necessary for the analysis. The true values
of these parameters are unknown. In this section we describe our methodology for estimating the
parameter values. We also provide estimates of the degree of uncertainty that might be expected in our
parameter estimates. The estimated parameter values and their associated variability are the inputs into
our statistical simulation model to determine net benefits.
Benefits. Regardless of the procurement policy and the eventual location of ferry construction, our analysis
assumes that an identical ship is acquired under any policy scenario.62
Under the current policy, new
ferries will be constructed in Washington State. We presume in this analysis that ferry construction shifts
to an out-of-state shipyard under the change to an open bidding policy. However, no matter where a new
ferry is constructed, the main benefit of a more inclusive bidding process is the potential for lower ferry
acquisition costs. That is, under a revised procurement policy shipbuilders in other states may under-bid
shipyards based in Washington State, resulting in a benefit for Washington State taxpayers. Alternatively,
shipyards based in Washington State may adjust their behavior and offer more competitive bids when
faced with a wider pool of potential competitors. Either way, a benefit is derived from lower acquisition
costs.63
Thus, the only differential in the future benefits is associated with the acquisition costs.64
Because the acquisition cost differential discussed above cannot be observed directly, we develop a
statistical estimate based on regression models using historical data on ferry acquisition contracts in the
U.S.65
The estimate incorporates both the expected differential as well as the uncertainty associated with
the estimate (see Appendix II for details). The BCA is based on statistical simulations calculating benefits
based on myriad possible values of the acquisition differential.
Costs. We assume that the change in procurement policy would result in the acquisition of new ferries
from outside of Washington State.66
Such a shift would certainly result in a loss of in-state economic
activity associated with ferry construction. However, whether or not there is a net loss of economic activity
depends on the ease with which productive resources can be shifted to other economic activities. It is
possible that productive inputs (capital, labor, and natural resources) engaged in ferry construction might
easily move into other economic activities such as the construction of other types of ships or into other
industries (e.g. other transportation industries or commercial building construction).67
Another possibility
is that transitioning away from ferry construction will be impossible and that resources that would have
been employed building ferries will be permanently unemployed resulting in a loss of economic activity in
62
Because we assume that acquired ships will be identical under either procurement scenario, it follows that the future maintenance
costs will also be identical under either procurement scenario. 63
If ferry acquisition costs are lower, we assume the resulting savings are returned to individual taxpayers in proportion to taxes
currently paid. An alternative to redistributing savings to taxpayers would be to increase other types of government spending.
However, we have no guidance on specific areas where savings should be spent—should the savings be spent on highway
construction or expanded early childhood education? Even with specific guidance, an estimate of the benefits resulting from this
additional spending would require additional analysis beyond the scope of the present study. 64
Ideally, the acquisition cost of a ferry would include both the initial cost of acquiring a new ferry and the present discounted
stream of all future maintenance costs. However, if ferries are identical regardless of construction location, the stream of future
maintenance costs will also be identical under both policy scenarios and the relevant comparison will depend solely on the initial
acquisition costs. 65
Our statistical estimates are subjected to extensive sensitivity analysis to determine the stability of the estimates under alternative
statistical models. 66
While a policy change may or may not result in ferry construction outside of Washington State, it will certainly increase the
probability of construction outside of Washington State. 67
In addition, workers may transition to entirely new occupations in other industries. The difficulty of doing so depends on the
degree to which their specific occupational skills are transferable to other occupations.
26

Washington State. Perhaps more likely is an outcome that falls somewhere between these two extremes:
some fraction of the productive resources will immediately transition into other economic activities, while
other productive resources will not easily make the transition, resulting in some lost economic activity.68
In the discussion above, the ease with which productive resources can be shifted to other activities is a key
determinant of the costs associated with out-of-state ferry construction. It is worth noting that if
productive resources have been engaged in a particular economic activity (e.g. ferry construction) for a
relatively long period of time, then the shift to new activities may be more difficult and slow. Conversely, if
the industry is generally more dynamic, with shifts in production among various products occurring
frequently, then the economic transitions of the type discussed above may occur more quickly and easily.
Further, if the industry norm is characterized by variable activity over time—for example, relatively
infrequent but large contracts for ships (both ferries and non-ferries) generating swings in economic
activity and employment—then one might expect that productive resources used in this industry might be
more flexible and able to shift to other activities fairly easily. To gauge the transition of labor and
shipyards to other non-ferry activities, we estimate the relationship between past ferry construction and
changes in the shipyard employment in Washington State (see Appendix IV for details).
Exhibit A2 presents a more detailed description of our methodology for computing net benefits along
with the parameters necessary to make the calculation. As noted in the Exhibit, some of the values are
estimated using a variety of data sources and methods, while other values are calculated. In the following
section, we define in detail each input parameter and document our method for estimating the parameter
value. In addition, since each parameter estimate has some inherent uncertainty we also provide estimates
of the variability of each parameter.
68
Bartik, T.J. (2012). Including jobs in benefit-cost analysis. Annual Review of Resource Economics, 4(1), 55–73 describes a conceptual
framework for BCA under less than full employment conditions.
27

Exhibit A2
Parameters Needed to Calculate Net Benefits of Changing to Out-of-State Ferry Construction
Parameter Formula
Benefits
Expected cost of ferry (2015 dollars) 1 C
Ship inflation rate (relative to all prices) 1 g
Years until construction begins1 t
Expected cost of ferry in future (2015 dollars) C* = Ce
gt
Ferry acquisition costs relative to restricted bidding (percentage) 1 s
Expected acquisition cost differential due to restricted bidding (dollars) C’ = sC*
Costs
Share of shipyard revenue spent on materials1 m
Income earned during ferry construction (1-m)C*
Share of income earned by shipyard workers1 w
Share of income earned by shipyard owners (1-w)
Income earned by shipyard workers Y = w(1-m)C*
Income earned by shipyard owners O = (1-w)(1-m)C*
Share of income earned by shipyard workers living in WA1 r
Share of income earned by shipyard owners living in WA1 k
Income earned by shipyard workers living in WA rY
Income earned by shipyard owners living in WA kO
Number of years to build a ferry1 d
Fringe benefit rate for shipyard workers in WA1 b
Payroll per WA shipyard worker1 P
Annual employment per WA ferry build A = Y/[d(1+b)P]
Shipyard employment impact of ferry construction (percentage) 1 f
WA shipyard industry employment1 E
Transitional unemployment share u = fE/A
Income lost by shipyard workers living in WA urY
Income lost by shipyard owners living in WA ukO
Discounted net benefits
Discount rate1 i
Present discounted values
Expected acquisition cost differential (dollars) PDV(C’)
Income lost by shipyard workers living in WA PDV(urY)
Income lost by shipyard owners living in WA PDV(ukO)
Net benefit PDV(C’) – PDV(urY) –
PDV(ukO)
Notes: 1 These parameters were estimated using the data and methods established in the Model Parameter Estimates section (pgs. 29-32). All
non-marked parameters were calculated using the listed formulas.
28

Model Parameter Estimates
Expected cost of ferry (2015 dollars) = C. To facilitate our analysis we begin with an estimate of the cost of
a prototypical Olympic-class ferry which is consistent with the most recently constructed ferries for WSF.
The Tokitae and Samish, completed in 2014 and 2015, respectively, are examples of this type of ship.
These ships have a displacement of 4,384 tons, are equipped with 6,000 horsepower engines, and have a
passenger capacity and a vehicle capacity of 1,500 and 144, respectively.69
The acquisition cost for these
ships, constructed under the current restricted bidding policy, is approximately $130 million (in 2015
dollars).70
While our analysis is specific for these prototypical ships, the results can be proportionally
scaled up or down for ships with larger or smaller acquisition costs.
Ship inflation rate (relative to all prices) = g. Historically, the cost of ship construction has increased faster
than prices in general. To measure shipyard inflation, we compile two price indices—one for labor costs in
shipyards and the other for steel prices used in ship construction.71
We form a single shipyard price index
as a weighted average of these indices, using the share of labor and materials costs in the shipyard
industry as weights.72
Based on this index, we find that between 1988 and 2014, shipyard costs have
increased 0.86% faster than prices in general.73
In our analysis, we express all results in 2015 dollars, but
we adjust future ferry construction costs by this rate to account for future shipyard-specific cost
escalation. We cannot be certain that shipyard costs will follow these historical patterns, however, so we
set the variation in the shipyard inflation rate to be equal to 25% of the point estimate: 0.21%.
Years until construction begins = t. New ferries will be constructed at some indeterminate point in the
future. Because benefits and costs must be discounted to present value, we need to specify a time period
for ferry construction. In our analysis, we expect ship construction to be spread equally over a two-year
period, beginning t years in the future. Based on the current WSF long-range plan, we analyze the impact
of a prototypical Olympic-class ship beginning construction in 2021.
Ferry acquisition cost relative to restricted bidding (percentage) = s. This parameter measures the
percentage differential in acquisition costs that are expected if ferries are constructed out of state.
Negative values imply that acquisition costs will decrease under the alternate policy. We estimate this
parameter using historical data on ferry ship acquisition. We use ordinary least squares (OLS) regression
analysis to compare the costs paid by WSF for ferries with the costs of other ferry acquisitions in the U.S.
since 1991, controlling statistically for ship size and characteristics. The full analysis is presented in
69
See WSDOT Ferries Division Fleet Guide, http://www.wsdot.wa.gov/NR/rdonlyres/AB031249-16EE-4422-BBEA-
8D2C50A17D9C/0/FerryFleetGuideMarch2015FinalDraft.pdf. 70
Washington State Department of Transportation, Ferries Division (2009). Final Long-Range Plan. Available at:
http://www.wsdot.wa.gov/Ferries/Planning/. Information on WSF’s updated procurement plan were provided to WSIPP via email (M.
von Ruden (personal communication, June 28, 2016). 71
Keating, E.G., Murphy, R., Schank, J.F., & Birkler, J. (2008), Using the steel-vessel material-cost index to mitigate shipbuilder risk.
http://www.rand.org/pubs/technical_reports/TR520.html. For details on the price indices see these links:
http://www.navsea.navy.mil/Home/05C/ShipbuildingIndices.aspx and
http://www.navsea.navy.mil/Portals/103/Documents/05C/BLSIndex.xlsx. 72
This information is available from the 2012 Economic Census and can be extracted from the Census Bureau’s American Fact Finder
web site (http://factfinder.census.gov). For the U.S. as a whole, labor costs and material costs represent 34.7% and 32.0% of total ship
yard revenue, respectively (see table EC1231SG1: Manufacturing: Summary Series: General Summary: Detailed Statistics by
Subsectors and Industries: 2012). We weight the shipyard labor price index by 34.7/(34.7+32.0) and the material price index by
32.0/(34.7+32.0). 73
The rate of increase in general prices (measured by the implicit price deflator for GDP) between 1988 and 2014 was 2.09%. The
rate of increase in our constructed price index for shipyards was 2.95%.
29

Appendix II.74
We take the cost differential associated with WSF acquisition to represent all factors unique
to WSF procurement practices, including the impact of restricted bidding. The median estimate for this
figure is a cost savings of 9.37%. This methodology is not necessarily approximate but represents the best
possible method given limitations of available data.75
Because OLS estimates are probabilistic in nature,
we also explicitly model the variability of our estimate using the median standard error from the
regression model: 30.37%.76
Share of shipyard revenue spent on materials = m. A significant portion of shipyard revenue resulting from
ferry construction will be spent on materials such as steel and various components (paint, engines,
electrical components, etc.). In our benefit-cost analysis, we follow standard analytical practice and include
impacts that occur in primary markets only. Thus, we focus on income earned by shipyard workers and
shipyard owners, excluding the portion of revenue spent on materials. To this end, we need an estimate of
the portion of revenue spent on materials which we derive from the 2012 Economic Census data for
Washington State shipyards.77
In 2012, this figure was 39.92%. We model the variability of this estimate
using the standard deviation of values for Washington and the other six states for which there is
comparable data; in 2012 this figure was 12.63%.78
Share of income earned by shipyard workers = w. Subtracting the cost of materials from shipyard revenue
yields shipyard value added or the total income earned by shipyard workers and owners. This parameter is
the share earned by workers, with the residual share going to shipyard owners. As with the share of
revenue spent on materials, we derive this parameter using data for Washington State shipyards from the
2012 Economic Census. The share of labor income for Washington State shipyards in 2012 was 54.39%.
The standard deviation for this parameter is computed across the Washington State value, plus the values
for six states for which there is comparable data; the standard deviation for these seven states was
10.31%.79
Share of income earned by shipyard workers living in WA = r. Most, but not all shipyard workers will reside
in Washington State. For the benefit-cost-analysis, we count benefits and costs that accrue to Washington
State residents only. We obtained an estimate for this parameter using data from the Public Use Micro
Sample (PUMS) of the America Community Survey (ACS). This is a household-based survey conducted by
the Census Bureau. We use data for workers who reported working at a shipyard located in Washington
74
As a complementary analysis we also examined differences in shipyard labor costs across U.S. states with a major shipbuilding
industry. This analysis is presented in Appendix VI. 75
A preferred scenario for estimating the impact of restrictive bidding practices would require more data and more heterogeneous
data. For example, our ability to produce better statistical estimates would be enhanced if multiple states had both restrictive and
open bidding practices at different points in time with the timing of state policy regime changes varying across states. 76
Thus, the 95% confidence interval for this variable is 9.37 ± 1.96 × 30.37%, or a range from −50.2% to 68.9%. 77
Data from the 2012 Economic Census can be extracted from the Census Bureau’s American Fact Finder web site
(http://factfinder.census.gov). The shipyard industry is defined by NAICS code 336611. See Appendix III for a full definition of
relevant industry classifications. The 2012 Economic Census provides state-level data for total shipyard revenue and value added.
The proportion spent on materials can be obtained as 1 minus the ratio of value added to total revenue. 78
Data describing the portion of total shipyard (based on NAICS code 336611) revenue spent on materials was available for six
states other than Washington: 57.1% in Alabama, 40.9% in California, 52.4% in Florida, 72.2% in Louisiana, Oregon 54.2%, and 19.4%
in Virginia. The random variable for this parameter is top-coded to not exceed 99% and bottom-coded to remain above 1%. 79
Data describing payroll as a percent of total shipyard (NAICS code 336611) income (value added) was available for six states in
addition to Washington. Since data on fringe benefits was not available at the state level for any states, we inflated all state-level
payroll figures by 37.73% (the ratio of fringe benefits to payroll for the U.S. as a whole). Our resulting estimates of labor income
earned relative to total shipyard income are: 76.3% in Alabama, 54.1% in California, 52.4% in Florida, 72.2% in Louisiana, Oregon
54.2%, and 51.7% in Virginia. In the simulations, this parameter is top-coded at 99% and bottom-coded at 1%.
30
State and tabulate their state of residence.80
For the years 2001 through 2009 (the most recently
completed business cycle), we find that 97.8% of these workers both worked and lived in Washington
State. We compute this value separately for each of the nine years covered in the data and find that the
standard deviation of this estimate is 1.4%.81
Share of income earned by shipyard owners living in WA = k. Some shipyard owners will reside in
Washington State and others will be located in other states or countries. However, data on company
ownership does not provide detailed information on owner’s state of residence.82
Therefore, we assume
that 60% of the shipyard owners reside in Washington State. To reflect the large degree of uncertainty
surrounding this estimate we assume a standard deviation of 20%.83
Number of years to build a ferry = d. Commonly, ferry construction requires two years and this parameter
value is set to 2. However, this is easily adjusted if a ferry build is expected to have a longer or shorter
duration. This parameter does not have any variability associated with it.
Fringe benefit rate = b. Worker compensation in the shipyard industry is comprised of both worker pay
and fringe benefits. The ratio of fringe benefits to pay is available from the U.S. 2012 Economic Census
data for the U.S. shipyard industry in aggregate (NAICS code 336611) but not separately for Washington
State, thus the U.S. figure of 37.73% is used as a proxy for the rate in Washington State.
Payroll per WA Shipyard Worker = P. To estimate payroll per worker we use data for NAICS industry
336611 from the Economic Census for 2012 and the Business Patterns state summary file for 2012 and
2014. The 2012 values from Economic Census and Business Patterns state summary files were 55,456 and
59,316, respectively. Payroll per worker in the 2014 Business Pattern data was 57,026 but there is no
comparable 2014 Economic Census data. Therefore, we use the ratio between the 2012 values to impute a
2014 value for the missing 2014 Economic Census data. The calculation is as follows—
(55,456/59,316)×57,026 = 53,315.02. Finally, we use the actual Business Pattern data (57,026) and the
imputed Economic Census data (53,315.02) to compute the mean and standard deviation for 2014. The
mean is 55,170.5 and the standard deviation is 2624.06. 84
Shipyard employment impact of ferry construction = f. A key parameter in the benefit-cost model is the
extent to which employment in Washington State shipyards is increased or decreased by the presence or
absence of a build contract from WSF. One the one hand, it is common to imagine that shipyard
employment would decline as a result of the loss of a significant business contract such as a ferry
procurement.85
On the other hand, in-state shipyards may have many significant business opportunities to
build and repair other ships.86
Furthermore, many workers in the Washington shipyard industry are
80
The ACS survey does not identify industry codes at the six-digit level—the most detailed industry classification available is NAICS
code 3366, which includes ship building and repair (NAICS code 336611) as well as boat building and repair (NAICS code 336612).
See Appendix III for a discussion of industry classification codes. 81
In the simulations, this parameter is top-coded at 100% and bottom-coded at 0%. 82
For example, Todd Shipyards, a prominent Washington State business establishment, which has previously built ferries for WSF,
was recently acquired by Vigor Industrial, a privately held company based in Portland. Given the available data on shipyard
ownership, it is generally not possible to determine the state of residence for owners. 83
In the simulations, this parameter is top-coded at 100% and bottom-coded at 0%. 84
It is worth noting that this is very close to the estimate produced by Mefford (2013). 85
For a discussion of the issues surrounding jobs in benefit-cost analysis see Bartik (2012). 86
For example a news report (http://www.seattletimes.com/business/todd-shipyards-agrees-to-be-acquired-by-portland-firm/)
about the shipyard industry in Washington State indicates that Todd Shipyards had renewed a five-year contract with the U.S. Navy
for repair of aircraft carriers.
31

employed in a wide range of skilled occupations and likely to be highly employable elsewhere.87
In this
case, no unemployment of labor or shipyard capacity would result from the loss of a ferry project to an
out-of-state shipyard.
We develop a detailed methodology to compute the value and variability of this parameter from OLS
regression equations relating Washington State shipyard employment to the history of WSF ferry
construction contracts from 1977 to 2014. This methodology is outlined in Appendix IV. The estimated
value of this parameter is taken to be the median of coefficients estimated across four competing
specifications and is -0.0295. This median estimate is negative, suggesting that Washington shipyard
employment was typically 2.95% lower in years with WSF ferry builds than in years without. However, the
coefficients in these models are estimated imprecisely and are associated with a high level of variability
(meaning that the effect is not statistically different from zero and could be either positive or negative).
Taking a cautious approach, whenever the simulation yields a negative value for this coefficient we
assume that there is no relationship between ferry construction and industry employment. This results in
an estimated 1.25% impact of ferry construction on shipyard employment. Our estimate for the variability
of this parameter is 6.15%, and is based on the median standard error from the four specifications.
Washington State shipyard industry employment = E. To estimate industry employment we used data for
NAICS industry 336611 from the Economic Census for 2012 and the Business Patterns state summary file
for 2012 and 2014. The 2012 values from Economic Census and Business Patterns state summary files
were 4,033 and 3,829, respectively. Employment in the 2014 Business Pattern data was 3,268 but there is
no comparable 2014 Economic Census data. Therefore, we use the ratio between the 2012 values to
impute a 2014 value for the missing 2014 Economic Census data. The calculation is as follows—
(4,033/3,829)×3,268 = 3,442.11. Finally, we use the actual Business Pattern data (3,268) and the imputed
Economic Census data (3,442.11) to compute the mean and standard deviation for 2014. The mean is
3,355.06 and the standard deviation is 123.12.
Discount rate = i. Because a ferry build could occur at any point in the future, the value of final costs and
benefits associated with a ferry acquisition must be converted to present day values using present
discounted values. All costs and benefits associated with ferry construction are divided equally across the
number of years in which the ferry build is expected to be completed and then discounted to present
values. The current model is parameterized with a discount rate equal to 3.5%, the modal rate used in the
WSIPP benefit-cost model.88
The discount rate is allowed to vary randomly across simulations with a
standard deviation of 0.75%, which yields a distribution of discount rates in the WSIPP specified range of
2% to 5%.89
Benefit-Cost Results
The estimation of benefits and costs almost always involves uncertainty and our approach is to directly
model uncertainty by employing multiple statistical simulations, yielding both an estimate of the overall
net benefit based on the average of the individual simulations as well as a distributional measure—the
percentage of cases in which the net benefit exceeds zero. Although BCA results in a single measure of
net benefits, our approach to BCA typically breaks down benefits and costs from the perspectives of
87
Appendix V for the occupational distribution of ship and boat industry workers in Washington State and in other major
shipbuilding states. 88
Washington State Institute for Public Policy (June 2016). Benefit-cost technical documentation. Olympia: WA: Author.
(http://www.wsipp.wa.gov/TechnicalDocumentation/WsippBenefitCostTechnicalDocumentation.pdf) 89
In the simulations, this parameter is bottom-coded at 0%.
32
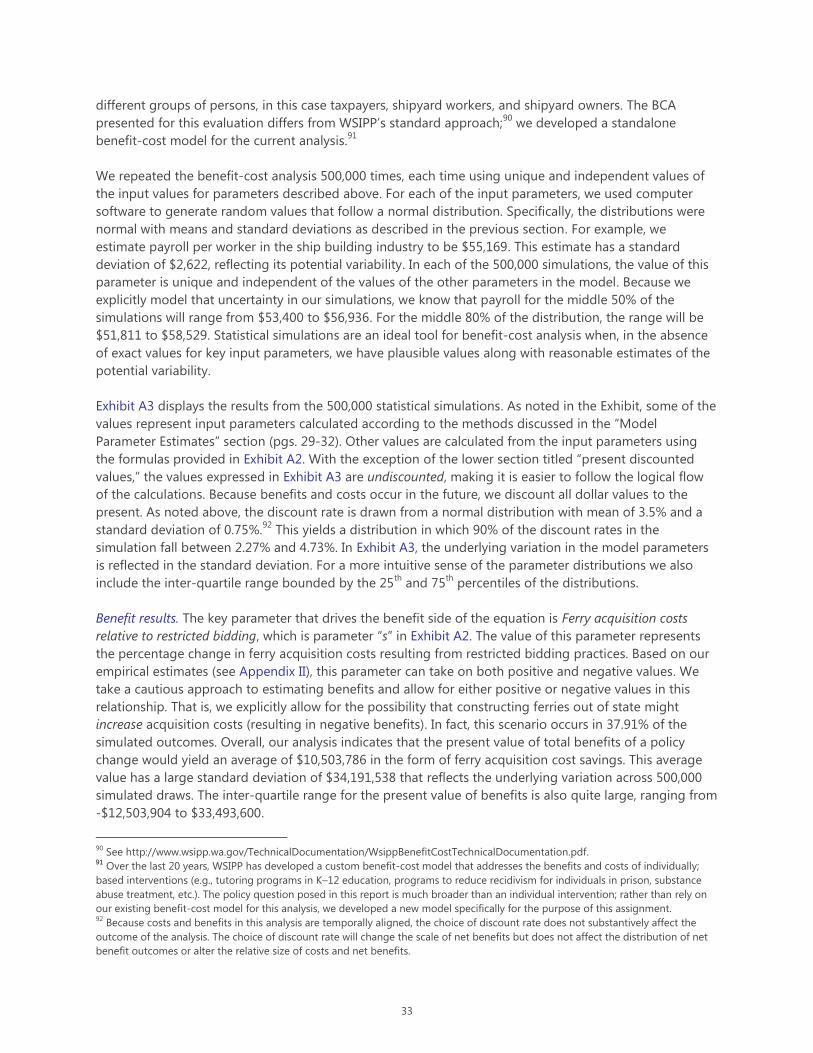
different groups of persons, in this case taxpayers, shipyard workers, and shipyard owners. The BCA
presented for this evaluation differs from WSIPP’s standard approach;90
we developed a standalone
benefit-cost model for the current analysis.91
We repeated the benefit-cost analysis 500,000 times, each time using unique and independent values of
the input values for parameters described above. For each of the input parameters, we used computer
software to generate random values that follow a normal distribution. Specifically, the distributions were
normal with means and standard deviations as described in the previous section. For example, we
estimate payroll per worker in the ship building industry to be $55,169. This estimate has a standard
deviation of $2,622, reflecting its potential variability. In each of the 500,000 simulations, the value of this
parameter is unique and independent of the values of the other parameters in the model. Because we
explicitly model that uncertainty in our simulations, we know that payroll for the middle 50% of the
simulations will range from $53,400 to $56,936. For the middle 80% of the distribution, the range will be
$51,811 to $58,529. Statistical simulations are an ideal tool for benefit-cost analysis when, in the absence
of exact values for key input parameters, we have plausible values along with reasonable estimates of the
potential variability.
Exhibit A3 displays the results from the 500,000 statistical simulations. As noted in the Exhibit, some of the
values represent input parameters calculated according to the methods discussed in the “Model
Parameter Estimates” section (pgs. 29-32). Other values are calculated from the input parameters using
the formulas provided in Exhibit A2. With the exception of the lower section titled “present discounted
values,” the values expressed in Exhibit A3 are undiscounted, making it is easier to follow the logical flow
of the calculations. Because benefits and costs occur in the future, we discount all dollar values to the
present. As noted above, the discount rate is drawn from a normal distribution with mean of 3.5% and a
standard deviation of 0.75%.92
This yields a distribution in which 90% of the discount rates in the
simulation fall between 2.27% and 4.73%. In Exhibit A3, the underlying variation in the model parameters
is reflected in the standard deviation. For a more intuitive sense of the parameter distributions we also
include the inter-quartile range bounded by the 25th
and 75th
percentiles of the distributions.
Benefit results. The key parameter that drives the benefit side of the equation is Ferry acquisition costs
relative to restricted bidding, which is parameter “s” in Exhibit A2. The value of this parameter represents
the percentage change in ferry acquisition costs resulting from restricted bidding practices. Based on our
empirical estimates (see Appendix II), this parameter can take on both positive and negative values. We
take a cautious approach to estimating benefits and allow for either positive or negative values in this
relationship. That is, we explicitly allow for the possibility that constructing ferries out of state might
increase acquisition costs (resulting in negative benefits). In fact, this scenario occurs in 37.91% of the
simulated outcomes. Overall, our analysis indicates that the present value of total benefits of a policy
change would yield an average of $10,503,786 in the form of ferry acquisition cost savings. This average
value has a large standard deviation of $34,191,538 that reflects the underlying variation across 500,000
simulated draws. The inter-quartile range for the present value of benefits is also quite large, ranging from
-$12,503,904 to $33,493,600.
90
See http://www.wsipp.wa.gov/TechnicalDocumentation/WsippBenefitCostTechnicalDocumentation.pdf. 91
Over the last 20 years, WSIPP has developed a custom benefit-cost model that addresses the benefits and costs of individually;
based interventions (e.g., tutoring programs in K–12 education, programs to reduce recidivism for individuals in prison, substance
abuse treatment, etc.). The policy question posed in this report is much broader than an individual intervention; rather than rely on
our existing benefit-cost model for this analysis, we developed a new model specifically for the purpose of this assignment. 92
Because costs and benefits in this analysis are temporally aligned, the choice of discount rate does not substantively affect the
outcome of the analysis. The choice of discount rate will change the scale of net benefits but does not affect the distribution of net
benefit outcomes or alter the relative size of costs and net benefits.
33
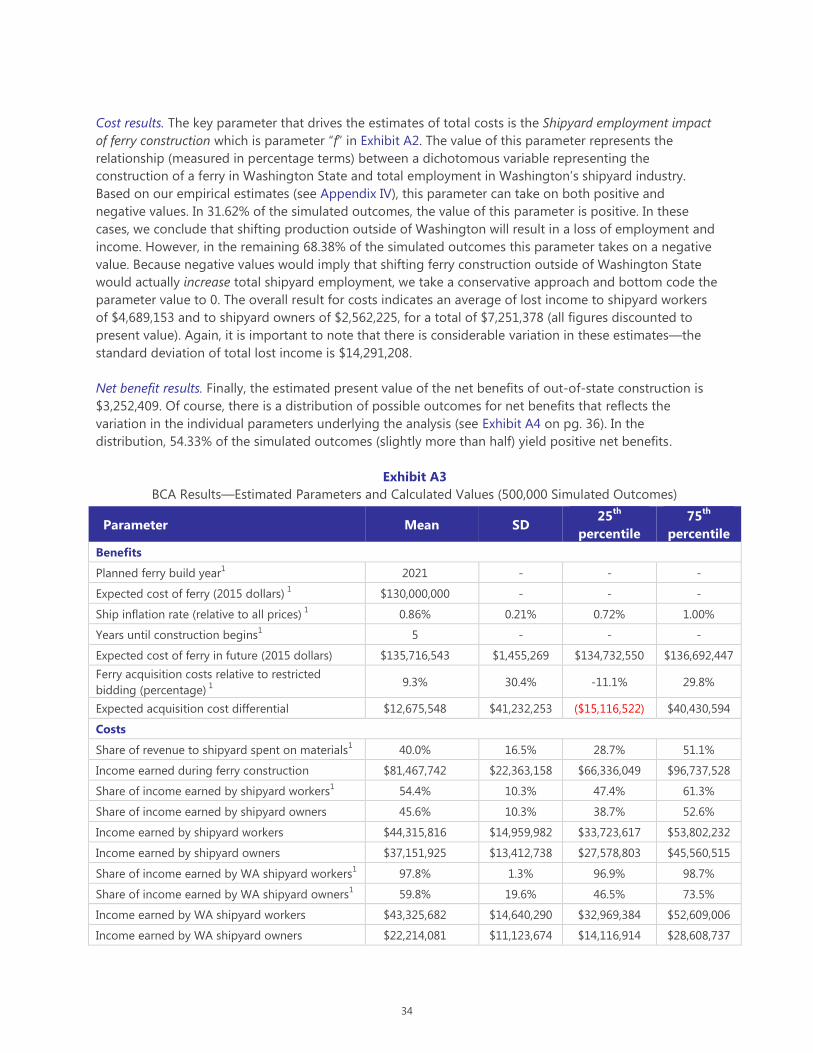
Cost results. The key parameter that drives the estimates of total costs is the Shipyard employment impact
of ferry construction which is parameter “f” in Exhibit A2. The value of this parameter represents the
relationship (measured in percentage terms) between a dichotomous variable representing the
construction of a ferry in Washington State and total employment in Washington’s shipyard industry.
Based on our empirical estimates (see Appendix IV), this parameter can take on both positive and
negative values. In 31.62% of the simulated outcomes, the value of this parameter is positive. In these
cases, we conclude that shifting production outside of Washington will result in a loss of employment and
income. However, in the remaining 68.38% of the simulated outcomes this parameter takes on a negative
value. Because negative values would imply that shifting ferry construction outside of Washington State
would actually increase total shipyard employment, we take a conservative approach and bottom code the
parameter value to 0. The overall result for costs indicates an average of lost income to shipyard workers
of $4,689,153 and to shipyard owners of $2,562,225, for a total of $7,251,378 (all figures discounted to
present value). Again, it is important to note that there is considerable variation in these estimates—the
standard deviation of total lost income is $14,291,208.
Net benefit results. Finally, the estimated present value of the net benefits of out-of-state construction is
$3,252,409. Of course, there is a distribution of possible outcomes for net benefits that reflects the
variation in the individual parameters underlying the analysis (see Exhibit A4 on pg. 36). In the
distribution, 54.33% of the simulated outcomes (slightly more than half) yield positive net benefits.
Exhibit A3
BCA Results—Estimated Parameters and Calculated Values (500,000 Simulated Outcomes)
Parameter Mean SD 25
th
percentile
75th
percentile
Benefits
Planned ferry build year1 2021 - - -
Expected cost of ferry (2015 dollars) 1 $130,000,000 - - -
Ship inflation rate (relative to all prices) 1 0.86% 0.21% 0.72% 1.00%
Years until construction begins1 5 - - -
Expected cost of ferry in future (2015 dollars) $135,716,543 $1,455,269 $134,732,550 $136,692,447
Ferry acquisition costs relative to restricted
bidding (percentage) 1
9.3% 30.4% -11.1% 29.8%
Expected acquisition cost differential $12,675,548 $41,232,253 ($15,116,522) $40,430,594
Costs
Share of revenue to shipyard spent on materials1 40.0% 16.5% 28.7% 51.1%
Income earned during ferry construction $81,467,742 $22,363,158 $66,336,049 $96,737,528
Share of income earned by shipyard workers1 54.4% 10.3% 47.4% 61.3%
Share of income earned by shipyard owners 45.6% 10.3% 38.7% 52.6%
Income earned by shipyard workers $44,315,816 $14,959,982 $33,723,617 $53,802,232
Income earned by shipyard owners $37,151,925 $13,412,738 $27,578,803 $45,560,515
Share of income earned by WA shipyard workers1 97.8% 1.3% 96.9% 98.7%
Share of income earned by WA shipyard owners1 59.8% 19.6% 46.5% 73.5%
Income earned by WA shipyard workers $43,325,682 $14,640,290 $32,969,384 $52,609,006
Income earned by WA shipyard owners $22,214,081 $11,123,674 $14,116,914 $28,608,737
34
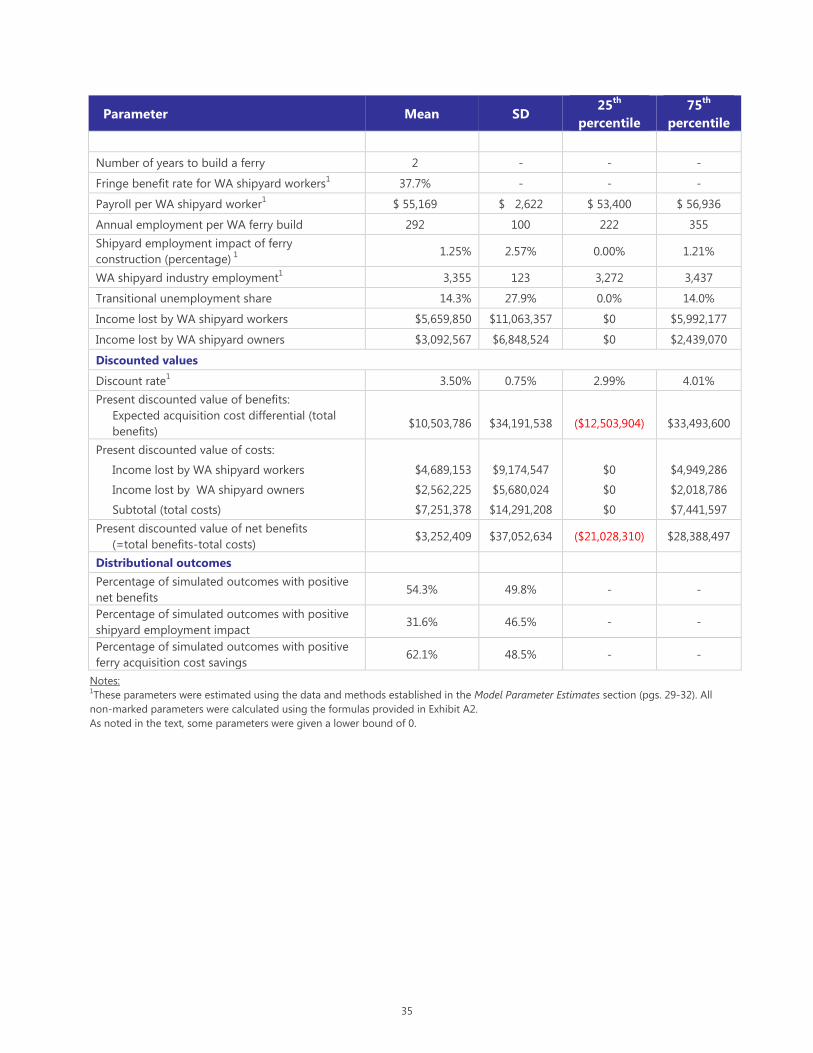
Parameter Mean SD 25
th
percentile
75th
percentile
Number of years to build a ferry 2 - - -
Fringe benefit rate for WA shipyard workers1 37.7% - - -
Payroll per WA shipyard worker1 $ 55,169 $ 2,622 $ 53,400 $ 56,936
Annual employment per WA ferry build 292 100 222 355
Shipyard employment impact of ferry
construction (percentage) 1
1.25% 2.57% 0.00% 1.21%
WA shipyard industry employment1 3,355 123 3,272 3,437
Transitional unemployment share 14.3% 27.9% 0.0% 14.0%
Income lost by WA shipyard workers $5,659,850 $11,063,357 $0 $5,992,177
Income lost by WA shipyard owners $3,092,567 $6,848,524 $0 $2,439,070
Discounted values
Discount rate1 3.50% 0.75% 2.99% 4.01%
Present discounted value of benefits:
Expected acquisition cost differential (total
benefits)
$10,503,786
$34,191,538
($12,503,904)
$33,493,600
Present discounted value of costs:
Income lost by WA shipyard workers $4,689,153 $9,174,547 $0 $4,949,286
Income lost by WA shipyard owners $2,562,225 $5,680,024 $0 $2,018,786
Subtotal (total costs) $7,251,378 $14,291,208 $0 $7,441,597
Present discounted value of net benefits
(=total benefits-total costs) $3,252,409 $37,052,634 ($21,028,310) $28,388,497
Distributional outcomes
Percentage of simulated outcomes with positive
net benefits 54.3% 49.8% - -
Percentage of simulated outcomes with positive
shipyard employment impact 31.6% 46.5% - -
Percentage of simulated outcomes with positive
ferry acquisition cost savings 62.1% 48.5% - -
Notes: 1These parameters were estimated using the data and methods established in the Model Parameter Estimates section (pgs. 29-32). All
non-marked parameters were calculated using the formulas provided in Exhibit A2.
As noted in the text, some parameters were given a lower bound of 0.
35

Exhibit A4
Distribution of Present Value of Net Benefits (500,000 Simulated Outcomes)
36

References
Bartik, T.J. (2012). Including jobs in benefit-cost analysis. Annual Review of Resource Economics, 4(1), 55–73.
Dasgupta, P., & Stiglitz, J.E. (1974). Benefit-cost analysis and trade policies. The Journal of Political Economy, 1–33.
Fan, W., Treyz, F., & Treyz, G. (2000). An evolutionary new economic geography model. Journal of Regional Science,
40(4), 671–695.
Greenwood, M.J., Hunt, G.L., Rickman, D.S., & Treyz, G.I. (1991). Migration, regional equilibrium, and the estimation of
compensating differentials. The American Economic Review, 81(5), 1382–1390.
Monaco, R. (1994). Regional economic modeling: A systematic approach to economic forecasting and policy analysis.
International Journal of Forecasting, 10(3), 461–463.
Morgan, J.Q. (2010). Analyzing the benefits and costs of economic development projects. Community and Economic
Development Bulletin, University of North Carolina.
Rickman, D.S., Shao, G., & Treyz, G.I. (1993). Multiregional stock adjustment equations of residential and
nonresidential investment in structures. Journal of Regional Science, 33(2), 207–220.
Rickman, D.S. & Trez, G.I. (1993). Alternative labor market closures in a regional model. GROW Growth and Change,
24(1), 32–50.
Trachtman, J.P. (1998). Trade and… problems, cost-benefit analysis and subsidiarity. European Journal of International
Law, 9(1), 32–85.
Treyz, G. (1993). Regional economic modeling: a systematic approach to economic forecasting and policy analysis.
Boston: Kluwer Academic.
Treyz, G.I. (1995). Policy analysis applications of remi economic forecasting and simulation models. International
Journal of Public Administration, 18(1), 13–42.
Treyz, G.I., Rickman, D.S., Hunt, G.L., & Greenwood, M.J. (1993). The dynamics of U.S. internal migration. The Review of
Economics and Statistics, 75(2), 209.
Vining, A.R., Greenberg, D.H., Boardman, A.E., & Weimer, D.L. (2011). Cost-benefit analysis: concepts and practice.
Boston [etc.]: Prentice Hall.
Waters, W.G. (1976). Impact studies and the evaluation of public projects. The Annals of Regional Science : An
International Journal of Urban, Regional and Environmental Research and Policy, 10(1), 98–103.
West, C.T. (1994). Book review: Regional economic modeling: A systematic approach to economic forecasting and policy
analyses.
37

II. Estimating the Acquisition Cost Premium Resulting from Restricted
Bidding
In this Appendix, we develop an estimate of the percentage cost premium that WSF incurs due to the
restricted bidding options in place in Washington State. Our method builds upon an approach first used
by the State Auditor’s office in 2013.93
This approach is to use U.S. historical data on ferry costs,
statistically adjusted for differences in ship size and characteristics, to estimate the average premium paid
by WSF for ferry construction relative to other ferry purchasers around the U.S. The methodological details
of this analysis and detailed results are discussed below.
Using this regression-based approach we estimate that, as a result of the restricted bidding process, WSF
pays a premium ranging from –12.57% to +39.81%. The median estimate is +9.37%. This means that, on
average, we expect WSF to pay 9.37% more for ferry construction due to restricted bidding. However, this
premium could be as high as 39.81% or as low –12.57%. Negative estimates imply that bids from out-of-
state shipyards would be higher than in-state shipyards by as much as 12.57%. In the case of negative
estimates, we assume WSF would accept the low bid from in-state shipyards, hence, the relevant range for
our estimates is +39.81% to 0%. Because this estimate is uncertain, in subsequent analysis we consider a
range of plausible values for this estimate. Specifically, for use in the benefit-cost analysis, we employ a
statistical simulation model (called Monto Carlo analysis) in which we explicitly model the possibility that
this estimate will vary. In particular, we assume that the estimated premium will follow a normal
distribution with a mean of +9.37% and a standard deviation of +30.37%. In the simulation model, we
truncate estimates at a lower bound of zero.
Historical ferry cost data—Regression method
This approach relies on a data set provided to WSIPP by the State Auditor’s office including detailed
information on ferry acquisition costs and ferry characteristics for 39 ferries procured nationally between
1991 and 2012. We use this data to estimate an ordinary least squares (OLS) regression model using the
following specification:
Ln(C) = β0 + β1 WSFDummy + β2 Built_WA + β3 X
Where,
C is the total cost of ship construction (adjusted for inflation),
WSFDummy is a binary dummy variable indicating that the ferry purchaser is WSF,
Built_WA is a binary dummy variable indicating construction in WA State for a purchaser other than
WSF, and
X is a vector of control variables including ship size and detailed ship characteristics.
Our specification is similar, but not identical, to the analysis presented in the state auditor’s report. In
particular, because the model is expressed in semi-log form the estimated coefficient on WSFDummy is
easily converted to the percentage differential associated with ferry acquisitions by WSF.94
It is important
to note the variable WSFDummy captures all factors associated with WSF acquisition practices including
restricted bidding. For example, WSF may be more or less efficient in procurement practices than other
purchasers and these impacts will be measured by WSFDummy as well. Alternatively, WSF might request
certain ship characteristics that we are unable to measure and observe in our data set. If these
93
State Auditor’s Office (2013). 94
The percentage difference is exp(WSFDummy)—1. See Halvorsen, R., & Palmquist, R. (1980). The interpretation of dummy variables
in semilogarithmic equations. American economic review, 70(3), 474-75.
38

unmeasured characteristics are unique to WSF and affect costs, then the variable WSFDummy will capture
the impact of these factors. In this case, our estimate of the impact of restricted bidding will be
contaminated by these other factors and moreover, the direction of bias will be unknown. Because of
uncertainty about the precise interpretation of the coefficient on WSFDummy, we will conduct our
benefit-cost analysis using a range of plausible estimates for the effect of restricted bidding.
Since we do not know the direction or magnitude of these other impacts, we cannot say whether the
coefficient on WSFDummy represents a lower or upper bound estimate of the restricted bidding premium.
Therefore we will consider our estimate to be a central point in a probabilistic distribution of possible
outcomes. It is worth noting that any impacts associated with construction practices in Washington which
are independent of restricted bidding and other Washington-specific purchasing practices will be
measured by the coefficient on the variable Built_WA. This variable will capture the costs specific to ferry
construction in the state. Since other (non-Washington) purchasers do not practice restricted bidding, this
estimate does not include any of the impacts associated with Washington State’s procurement
restrictions. Thus, the coefficient on Built_WA can be interpreted as the construction cost differential for
WA state shipyards when ferries are built for non-WSF purchasers (who are free of the restricted bidding
policy).
The data set provided by the state auditor’s office includes ship characteristics such as size (measured in
tons) and capacity of passengers and vehicles as well as other ship characteristics. The variable definitions
along with descriptive statistics for each variable are provided in Exhibit A5.
The state auditor’s data included information for a selected list of 39 ferries constructed in the U.S. from
1991 to 2012. We attempted to augment this data set by extending the data window farther into the
past—including data for the pre-1980 period—and by filling in missing ships constructed since 1980.
While we were able to gather some information for additional ships we are not able to replicate the
complete set of information on the ship characteristics included in the auditor’s data set. Because of this
limited data availability, we are unable to expand the analysis beyond the original data collected by the
state auditor’s office.
39
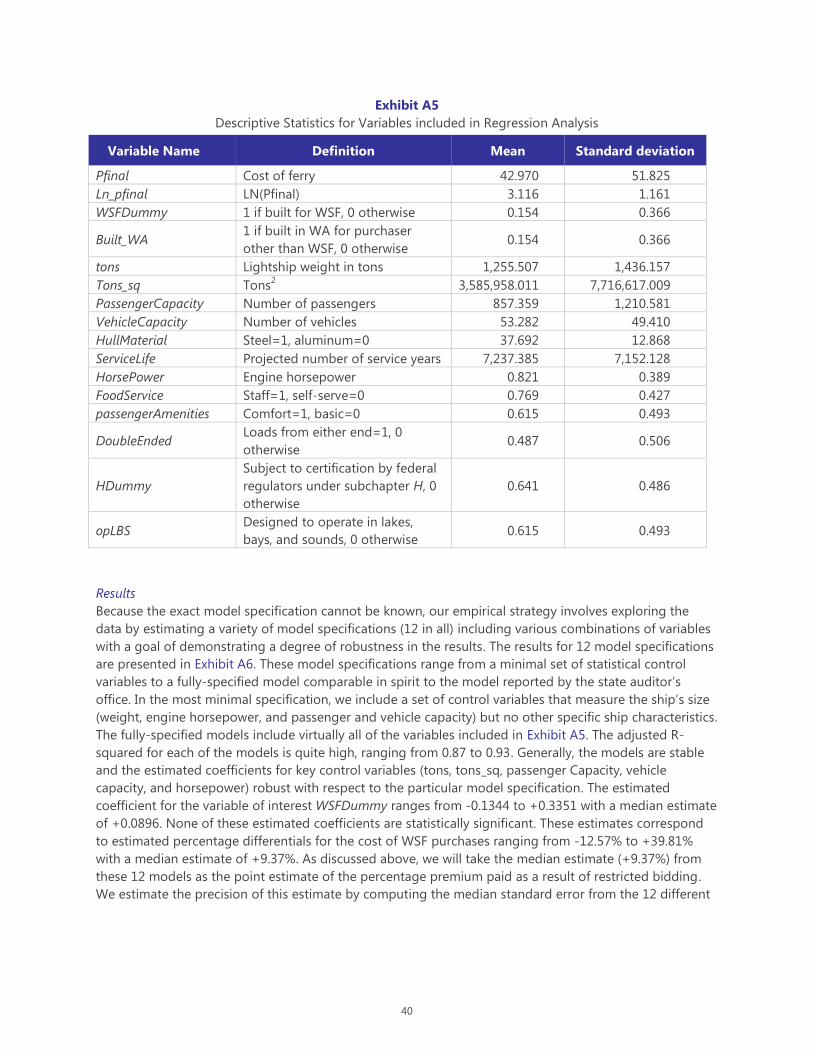
Exhibit A5
Descriptive Statistics for Variables included in Regression Analysis
Variable Name Definition Mean Standard deviation
Pfinal Cost of ferry 42.970 51.825
Ln_pfinal LN(Pfinal) 3.116 1.161
WSFDummy 1 if built for WSF, 0 otherwise 0.154 0.366
Built_WA 1 if built in WA for purchaser
other than WSF, 0 otherwise 0.154 0.366
tons Lightship weight in tons 1,255.507 1,436.157
Tons_sq Tons2 3,585,958.011 7,716,617.009
PassengerCapacity Number of passengers 857.359 1,210.581
VehicleCapacity Number of vehicles 53.282 49.410
HullMaterial Steel=1, aluminum=0 37.692 12.868
ServiceLife Projected number of service years 7,237.385 7,152.128
HorsePower Engine horsepower 0.821 0.389
FoodService Staff=1, self-serve=0 0.769 0.427
passengerAmenities Comfort=1, basic=0 0.615 0.493
DoubleEnded Loads from either end=1, 0
otherwise 0.487 0.506
HDummy
Subject to certification by federal
regulators under subchapter H, 0
otherwise
0.641 0.486
opLBS Designed to operate in lakes,
bays, and sounds, 0 otherwise 0.615 0.493
Results
Because the exact model specification cannot be known, our empirical strategy involves exploring the
data by estimating a variety of model specifications (12 in all) including various combinations of variables
with a goal of demonstrating a degree of robustness in the results. The results for 12 model specifications
are presented in Exhibit A6. These model specifications range from a minimal set of statistical control
variables to a fully-specified model comparable in spirit to the model reported by the state auditor’s
office. In the most minimal specification, we include a set of control variables that measure the ship’s size
(weight, engine horsepower, and passenger and vehicle capacity) but no other specific ship characteristics.
The fully-specified models include virtually all of the variables included in Exhibit A5. The adjusted R-
squared for each of the models is quite high, ranging from 0.87 to 0.93. Generally, the models are stable
and the estimated coefficients for key control variables (tons, tons_sq, passenger Capacity, vehicle
capacity, and horsepower) robust with respect to the particular model specification. The estimated
coefficient for the variable of interest WSFDummy ranges from -0.1344 to +0.3351 with a median estimate
of +0.0896. None of these estimated coefficients are statistically significant. These estimates correspond
to estimated percentage differentials for the cost of WSF purchases ranging from -12.57% to +39.81%
with a median estimate of +9.37%. As discussed above, we will take the median estimate (+9.37%) from
these 12 models as the point estimate of the percentage premium paid as a result of restricted bidding.
We estimate the precision of this estimate by computing the median standard error from the 12 different
40

regression models.95
This yields an estimated standard error of 30.37%. Because the point estimate is
uncertain, in subsequent analysis we consider a range of plausible values. Specifically, in the benefit-cost
analysis, we employ a statistical simulation model (called a Monte Carlo analysis) in which we explicitly
model this uncertainty. In particular, we assume that the estimated premium will follow a normal
distribution with a mean of +9.37% and a standard deviation of +30.37%. In the simulation model, we
truncate estimates at a lower bound of zero—that is, WSF will never pay more for an out-of-state shipyard
bid when there is a lower bid from an in-state shipyard.
Another variable of interest is Built_WA. This variable captures the cost differential (either positive or
negative) of ferries built in Washington State for buyers other than WSF. The estimated coefficients for
this variable range from -0.3468 to +0.3047 with a median coefficient of -0.1143. Again, none of these
coefficients passes the test of statistical significance. These estimates correspond to percentage
differentials ranging from -29.31% to +35.63% with a median estimate of -10.80%. The implication of the
median estimate is that when the purchaser is not WSF, the cost of ferries constructed in shipyards in
Washington State is, on average, 10.8% less than if constructed in elsewhere in the U.S. However this
estimate is not statistically significant and the range of estimates across the models is quite variable and
includes both positive and negative values.
95
This calculation involves two steps. First, we compute the median t-statistic associated with the coefficient on WSFDummy in each
of the 12 models. Using this value, we then compute the median standard error as the median coefficient divided by the median t-
statistic (0.0896/0.2950 = 0.3037).
41

Exhibit A6
Regression Analysis, Ferry Costs
variable Model 1 Model 2 Model 3 Model 4 Model 5 Model 6 Model 7 Model 8 Model 9 Model 10 Model 11 Model 12
Intercept 1.3415 *** 2.6404 *** 2.2153 *** 2.6301 *** 2.0206 *** 2.2581 *** 2.0713 *** 2.0778 *** 2.2998 *** 2.3387 *** 1.7699 ** 1.6789 ***
(0.1916) (0.2039) (0.4237) (0.5201) (0.4991) (0.6044) (0.5493) (0.5702) (0.5007) (0.5205) (0.6771) (0.4336)
WSFDummy 0.2253 0.2817 0.2351 0.3351 0.0064 0.1022 0.0405 0.0481 0.0769 0.1188 -0.1073 -0.1344
(0.2815) (0.2624) (0.2642) (0.2713) (0.2617) (0.3334) (0.3015) (0.3323) (0.2713) (0.2992) (0.4077) (0.3710)
WA_built_not_WSF -0.3468 -0.2610 -0.3276 -0.2344 -0.1148 -0.2282 -0.1105 -0.1137 0.3047 0.2935 0.1305 0.1001
(0.2343) (0.2133) (0.2201) (0.2281) (0.2046) (0.2266) (0.2088) (0.2193) (0.2417) (0.2478) (0.3116) (0.2552)
tons 0.0021 *** 0.0026 *** 0.0025 *** 0.0024 *** 0.0026 *** 0.0022 *** 0.0027 *** 0.0027 *** 0.0031 *** 0.0030 *** 0.0022 *** 0.0022 ***
(0.0004) (0.0004) (0.0004) (0.0004) (0.0003) (0.0004) (0.0004) (0.0006) (0.0004) (0.0006) (0.0006) (0.0005)
tons_sq -2.7E-07 *** -3.1E-07 *** -3.0E-07 *** -3.1E-07 *** -3.3E-07 *** -2.9E-07 *** -3.4E-07 *** -3.3E-07 *** -4.2E-07 *** -4.0E-07 *** -3.2E-07 *** -3.2E-07 ***
(5.3E-08) (5.2E-08) (5.2E-08) (5.1E-08) (4.6E-08) (5.3E-08) (5.1E-08) (7.6E-08) (5.4E-08) (7.3E-08) (7.2E-08) (6.7E-08)
PassengerCap -3.2E-04 ** -3.4E-04 *** -3.4E-04 *** -2.3E-04 -2.7E-04 ** -2.5E-04 * -2.7E-04 ** -2.6E-04 * -3.4E-04 *** -3.2E-04 ** -1.8E-04 -1.8E-04
(1.3E-04) (1.2E-04) (1.2E-04) (1.4E-04) (1.3E-04) (1.4E-04) (1.3E-04) (1.5E-04) (1.2E-04) (1.4E-04) (1.6E-04) (1.5E-04)
VehicleCapacity -3.0E-03 -3.7E-03 -3.4E-03 -1.0E-03 -2.9E-03 8.4E-04 -3.4E-03 -3.2E-03 -1.5E-03 -7.4E-04 3.0E-03 2.8E-03
(0.0028) (0.0026) (0.0026) (0.0031) (0.0028) (0.0035) (0.0035) (0.0042) (0.0032) (0.0039) (0.0030) (0.0028)
ServiceLife 0.0115 0.0124
(0.0140) (0.0129)
Horsepower 7.1E-05 *** 2.6E-05 -1E-06 1.3E-06 -1.3E-06 1.5E-06 1.6E-06 -1.8E-05 -1.8E-05 -4.9E-06
(1.2E-05) (2.3E-05) (3.0E-05) (2.7E-05) (3.0E-05) (2.7E-05) (2.8E-05) (2.5E-05) (2.6E-05) (2.8E-05)
HullMaterial -1.4249 *** -0.9952 ** -0.7017 -0.7643 * -0.2804 -0.8570 -0.8384 -0.8277 -0.7257
(0.2236) (0.4370) (0.4836) (0.4262) (0.5975) (0.5789) (0.6667) (0.5203) (0.5995)
DoubleEnded -0.7917 -0.3764 -0.8322 -0.3483 -0.3714 -0.7484 -0.8801 -1.2601 ** -1.1838 ***
(0.5904) (0.5371) (0.5873) (0.5586) (0.6871) (0.5230) (0.6444) (0.5353) (0.3129)
AmnPass 0.4780 *** 0.5004 ** 0.4863 0.6760 *** 0.6018 ** 0.4345 * 0.4363 *
(0.1558) (0.1836) (0.3006) (0.1771) (0.2730) (0.2326) (0.2280)
AmFood 0.4009 -0.0854 -0.0742 -0.1254 -0.0653 0.2733 0.2673
(0.3382) (0.3533) (0.4052) (0.3179) (0.3635) (0.2516) (0.2445)
HDummy 0.0189 0.1031 0.2299 0.2253
(0.3157) (0.2849) (0.2589) (0.2527)
OpLBS -0.4643 ** -0.4712 ** -0.4517 ** -0.4405 **
(0.1703) (0.1743) (0.1813) (0.1668)
R_Square 0.893 0.905 0.909 0.914 0.936 0.918 0.936 0.936 0.950 0.950 0.949 0.949
Adj_R_Sq 0.869 0.884 0.885 0.888 0.913 0.889 0.910 0.906 0.927 0.925 0.922 0.925
Sample size is 39. Standard errors in parenthesis.
Statistical significance indicated by *** (.01), ** (.05) and * (0.10).
42

43
III. Industrial Classification Systems
In 1997, data collection by the U.S. federal government for classifying data on U.S. business
establishments transitioned from the Standard Industrial Classification (SIC) code system to the North
American Industry Classification System (NAICS). While the NAICS system is the primary system relevant
to the data used in the report, some pre-1997 data is classified according to the older SIC system. For the
purposes of examining the shipbuilding industry, this change is of little consequence. The correspondence
between the two different classification systems for this industry is exact and is shown below in Exhibit A7.
Both classifications systems include the same two sub-industry groups—“ship building and repair,” and
“boat building and repair.” Detailed descriptions of each of these classifications are given below. 96
Exhibit A7
Industry classification SIC (pre-1997) NACIS (1998 – present)
Ship and boat building and repair 3730 3366
Ship building and repair 3731 336611
Boat building and repair 3732 336612
The industrial classification system is hierarchical in nature, thus, the more highly disaggregated industries
(NAICS 336611 and 336612 or SIC 3731 and 3732) combine to form the totals for the more aggregated
industries (NAICS 3366 or SIC 3730). The first of these groupings (NAICS 336611 or SIC 3731)
encompasses commercial ship building and is the industry most relevant to the full analysis in the report.
However, some data sources (such as the American Community Survey) only include the broader industry
classification (NAICS 3366 or SIC 3730), which is the aggregation of the two underlying sub-industries— it
is noted when this is the case.
These industrial codes correspond to all privately-owned business establishments engaged in ship
building and repair. Government-owned shipyards are not included in the industry classification. Ship
repair conducted in floating dry docks is classified elsewhere in NAICS 488390—this has been consistent
under both the SIC and NAICS classification systems. Referring to the more recent NAICS classifications,
each sub-industry category is described in the next section.97
96
http://www.census.gov/eos/www/naics/concordances/concordances.html and http://www.census.gov/cgi-
bin/sssd/naics/naicsrch?chart=2012. 97
http://www.census.gov/cgi-bin/sssd/naics/naicsrch?code=336611&search=2012%20NAICS%20Search and
http://www.census.gov/cgi-bin/sssd/naics/naicsrch?code=336612&search=2012%20NAICS%20Search.
43

44
336611 Ship building and repairing
This U.S. industry comprises establishments primarily engaged in operating a shipyard. Shipyards are fixed
facilities with drydocks and fabrication equipment capable of building a ship, defined as watercraft
typically suitable or intended for other than personal or recreational use. Activities of shipyards include
the construction of ships, repair of ships, conversion and alteration, the production of prefabricated ship
and barge sections, and specialized services, such as ship scaling. A detailed listing of types of
establishments follows.
Exhibit A8
NAICS Ship Classifications by Sub-Industry Category
2012 NAICS Corresponding index
336611 Barge building
336611 Cargo ship building
336611 Container ship building
336611 Dredge building
336611 Drilling and production platforms, floating, oil and gas, building
336611 Drydock, floating, building
336611 Ferryboat building
336611 Fireboat building
336611 Fishing boat, commercial, building
336611 Hydrofoil vessel building and repairing in shipyard
336611 Naval ship building
336611 Oil and gas offshore floating platforms manufacturing
336611 Passenger ship building
336611 Patrol boat building
336611 Sailing ships, commercial, manufacturing
336611 Ship dismantling at shipyards
336611 Ship repair done in a shipyard
336611 Ship scaling services done at a shipyard
336611 Ships (i.e., not suitable or intended for personal use) manufacturing
336611 Shipyard (i.e., facility capable of building ships)
336611 Submarine building
336611 Towboat building and repairing
336611 Tugboat building
336611 Yachts built in shipyards
44

45
336612 Boat building
This U.S. industry comprises establishments primarily engaged in building boats. Boats are defined as
watercraft not built in shipyards and typically of the type suitable or intended for personal use. Included in
this industry are establishments that manufacture heavy-duty inflatable rubber or inflatable plastic boats
(RIBs).
Exhibit A9
NAICS Boat Classifications by Sub-Industry Category
2012 NAICS Corresponding index
336612 Air boat building
336612 Boat yards (i.e., boat manufacturing facilities)
336612 Boats (i.e., suitable or intended for personal use) manufacturing
336612 Boats, inflatable plastics (except toy-type), manufacturing
336612 Cabin cruiser
336612 Dories building
336612 Hovercraft building
336612 Inflatable plastic boats, heavy-duty, manufacturing
336612 Inflatable rubber boats, heavy-duty, manufacturing
336612 Motorboat, inboard or outboard, building
336612 Pleasure boats manufacturing
336612 Rigid inflatable boats (RIBs) manufacturing
336612 Rowboats manufacturing
336612 Sailboat building, not done in shipyards
336612 Underwater remotely operated vehicles (ROVs) manufacturing
336612 Yacht building, not done in shipyards
45

46
IV. The Impact of Ferry Construction on Employment in the Washington
State Shipbuilding Industry
It might seem obvious that building ferries in Washington State will increase total employment in
Washington State shipyards. However, economic theory tells us that in an economy in which labor and
capita are fully employed, or nearly so, there will necessarily be offsetting decreases in economic activity
elsewhere in the economy as resources are shifted to ferry construction. Thus, it is possible that the
construction of a ferry might simply displace the construction of another non-ferry ship project. If so, we
would expect to observe no net increase in employment in the shipyard industry. A related possibility is
that increases in shipyard employment may reduce employment in other industries. For example, workers
in some highly skilled occupations, such as welding, may be drawn to employment in the shipyards when
economic activity in the shipyards increases, resulting in decreases in employment in other industries such
as construction.
The main benefit of adopting an open bidding policy would be the potential for reduced ferry acquisition
costs. These savings represent a benefit to Washington State taxpayers. Open bidding is likely (but not
certain) to shift the production of ferries from in-state shipyards to out-of-state shipyards. In this analysis,
we specifically look at the impact of shifting ferry construction out-of-state. This shift may entail a loss of
income for Washington State residents—both workers in the shipyards, as well as the owners of the
shipyards. Such a loss of income would represent costs imposed on some Washington State residents.
The size of this effect will depend on how quickly shipyard workers and owners are able to transition to
other economic activity in response to the loss of ferry building activity. For shipyard owners this will
entail finding new customers; shipyard workers have the additional option of finding new employment in
other industries. The net benefit of a change to out-of-state construction is equal to the benefits from the
acquisition savings realized by Washington taxpayers minus the loss of income to shipyard workers and
owners.
In this section, we use historical data to look for evidence of an empirical relationship between total
employment in Washington State’s ship building industry and the construction of Washington State
Ferries. We estimate a time-series regression for total employment in the Washington State shipbuilding
industry for a 38-year period from 1977 to 2014. The model is simple and parsimonious: we explain
shipyard employment as function of a long-run time-trend and binary variables indicating the
construction of a Washington State ferry. We find that employment growth in the shipbuilding industry
has declined an average of 2.3% annually between 1977 and 2014. This result is extremely stable across a
variety of model specifications.
To ensure that our results were robust, we explore a variety of model specifications. We do not find any
empirical evidence of a relationship between ferry construction and shipyard employment in Washington
State. Indeed, in various specifications of the model, we find that the percentage change corresponding to
median point estimate of the impact of ferry construction on employment is -2.98% with a range that
included both positive and negative values (-13.03% to 0.98%). Negative values imply that ferry
construction results in lower total employment in the shipyard industry. Using the median estimated
impact (-2.98%) implies that there would be approximately 97 fewer Washington State shipyard jobs as a
result of ferry construction. It is worth noting that our empirical analysis typically finds no statistically
significant relationship between employment and ferry construction with the exception of one model
specification in which the impact was negative. This means we cannot reject the hypothesis that there is
no relationship between ferry construction and shipyard employment. Generally, these results are
46
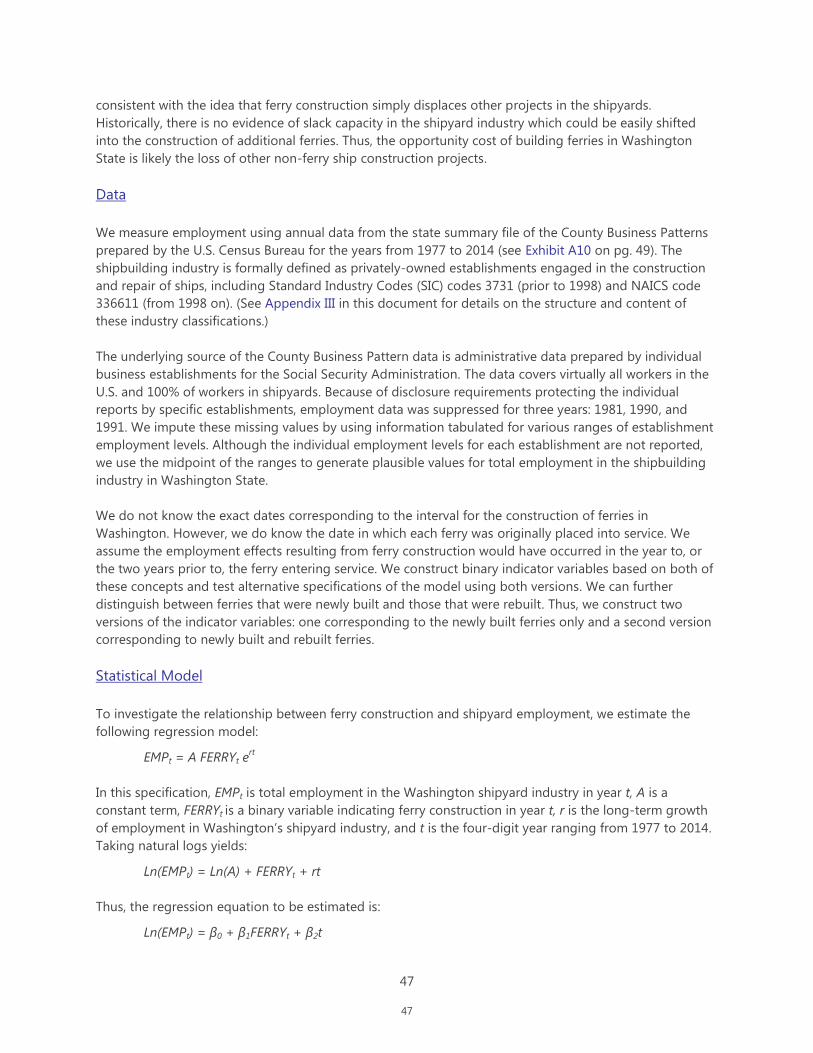
47
consistent with the idea that ferry construction simply displaces other projects in the shipyards.
Historically, there is no evidence of slack capacity in the shipyard industry which could be easily shifted
into the construction of additional ferries. Thus, the opportunity cost of building ferries in Washington
State is likely the loss of other non-ferry ship construction projects.
Data
We measure employment using annual data from the state summary file of the County Business Patterns
prepared by the U.S. Census Bureau for the years from 1977 to 2014 (see Exhibit A10 on pg. 49). The
shipbuilding industry is formally defined as privately-owned establishments engaged in the construction
and repair of ships, including Standard Industry Codes (SIC) codes 3731 (prior to 1998) and NAICS code
336611 (from 1998 on). (See Appendix III in this document for details on the structure and content of
these industry classifications.)
The underlying source of the County Business Pattern data is administrative data prepared by individual
business establishments for the Social Security Administration. The data covers virtually all workers in the
U.S. and 100% of workers in shipyards. Because of disclosure requirements protecting the individual
reports by specific establishments, employment data was suppressed for three years: 1981, 1990, and
1991. We impute these missing values by using information tabulated for various ranges of establishment
employment levels. Although the individual employment levels for each establishment are not reported,
we use the midpoint of the ranges to generate plausible values for total employment in the shipbuilding
industry in Washington State.
We do not know the exact dates corresponding to the interval for the construction of ferries in
Washington. However, we do know the date in which each ferry was originally placed into service. We
assume the employment effects resulting from ferry construction would have occurred in the year to, or
the two years prior to, the ferry entering service. We construct binary indicator variables based on both of
these concepts and test alternative specifications of the model using both versions. We can further
distinguish between ferries that were newly built and those that were rebuilt. Thus, we construct two
versions of the indicator variables: one corresponding to the newly built ferries only and a second version
corresponding to newly built and rebuilt ferries.
Statistical Model
To investigate the relationship between ferry construction and shipyard employment, we estimate the
following regression model:
EMPt = A FERRYt ert
In this specification, EMPt is total employment in the Washington shipyard industry in year t, A is a
constant term, FERRYt is a binary variable indicating ferry construction in year t, r is the long-term growth
of employment in Washington’s shipyard industry, and t is the four-digit year ranging from 1977 to 2014.
Taking natural logs yields:
Ln(EMPt) = Ln(A) + FERRYt + rt
Thus, the regression equation to be estimated is:
Ln(EMPt) = β0 + β1FERRYt + β2t
47

48
The estimated coefficient on t (β2) is the average annual percentage growth rate in employment in
Washington’s shipyard industry. The coefficient on FERRY (β1) captures any impact of ferry construction.
The estimated percentage impact on shipyard industry employment is equal to eβ2
- 1.98
Because the model is a time-series specification, serial autocorrelation is a potential problem. To insure
that the estimated coefficients are not statistically biased, we estimated the equation using an
autoregressive model with two lags. The resulting Durbin-Watson statistics from various models are close
to 2, ranging in values from 2.12 to 2.16. We experimented with shorter and longer lag structures and the
results are qualitatively similar to what is shown in Exhibit A11. Indeed, the results are qualitatively similar
even when the model is OLS without a correction for serial correlation.
Results
Exhibit A11 presents the results from four alternative specifications of the model corresponding to the
specification of the binary indicator variables. In the first two versions, we include only the new ship builds
and the binary indicator variables are B1 and B2: B1 corresponds to a single-year construction period (the
year prior to ferry completion) and B2 corresponds to a two-year construction period (the two years prior
to ferry completion). We also expanded the concept to include both new and rebuilt ships (binary
indicator variables BR1 and BR2), again using the same two versions of construction periods.
The estimated long-term growth of industry employment is quite stable. The median estimate is -2.3%
and the range is -2.5% to -2.27%. These estimates are all statistically significant.
The estimates of the percentage impact of ferry construction on shipyard employment are quite mixed
and range from -13.03% to 0.98%. The median estimated impact is -2.98%. These estimated coefficients
are typically not statistically significant, except in one case where the impact of ferry construction on
shipyard employment is negative. Applying the estimated median percentage impact on the 2014
shipyard employment level, we find the estimated impact of ferry construction on shipyard employment is
97 fewer jobs. However, the range of estimates from Exhibit A11 indicates that the estimated impact of
ferry construction on shipyard employment could range from 426 fewer jobs to 32 additional jobs.
Summary
Based on this analysis, we conclude that there is no empirical evidence of a relationship between
Washington State Ferry construction and total employment in Washington’s shipyard industry. This is
consistent with ferry construction displacing other activities in the shipyard industry.
98
Halvorson & Palmquist (1980).
48
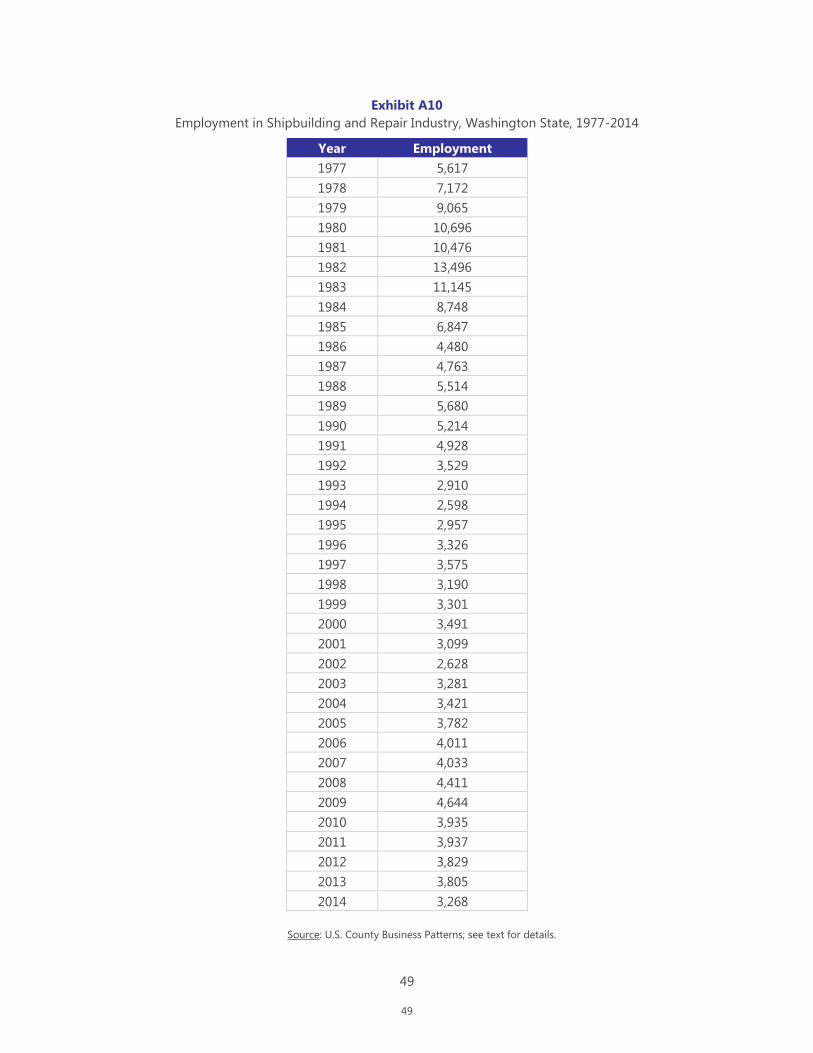
49
Exhibit A10
Employment in Shipbuilding and Repair Industry, Washington State, 1977-2014
Source: U.S. County Business Patterns; see text for details.
Year Employment
1977 5,617
1978 7,172
1979 9,065
1980 10,696
1981 10,476
1982 13,496
1983 11,145
1984 8,748
1985 6,847
1986 4,480
1987 4,763
1988 5,514
1989 5,680
1990 5,214
1991 4,928
1992 3,529
1993 2,910
1994 2,598
1995 2,957
1996 3,326
1997 3,575
1998 3,190
1999 3,301
2000 3,491
2001 3,099
2002 2,628
2003 3,281
2004 3,421
2005 3,782
2006 4,011
2007 4,033
2008 4,411
2009 4,644
2010 3,935
2011 3,937
2012 3,829
2013 3,805
2014 3,268
49
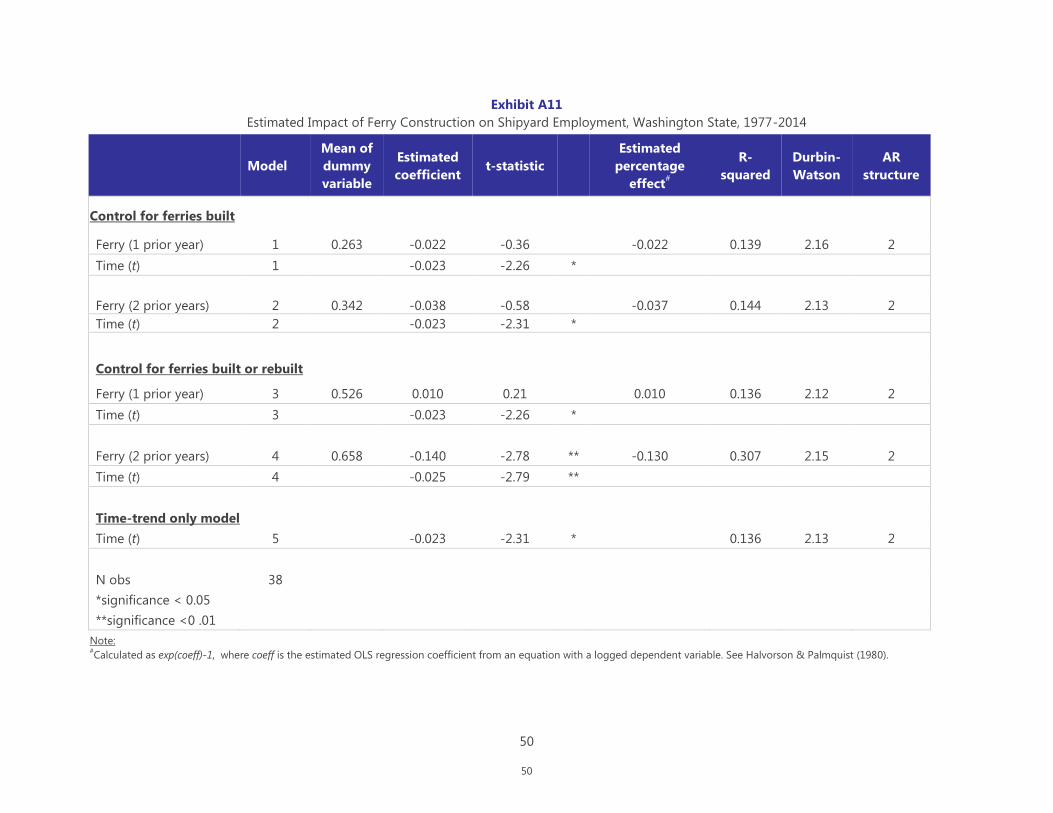
50
Exhibit A11
Estimated Impact of Ferry Construction on Shipyard Employment, Washington State, 1977-2014
Model
Mean of
dummy
variable
Estimated
coefficient t-statistic
Estimated
percentage
effect#
R-
squared
Durbin-
Watson
AR
structure
Control for ferries built
Ferry (1 prior year) 1 0.263 -0.022 -0.36
-0.022 0.139 2.16 2
Time (t) 1
-0.023 -2.26 *
Ferry (2 prior years) 2 0.342 -0.038 -0.58
-0.037 0.144 2.13 2
Time (t) 2
-0.023 -2.31 *
Control for ferries built or rebuilt
Ferry (1 prior year) 3 0.526 0.010 0.21
0.010 0.136 2.12 2
Time (t) 3
-0.023 -2.26 *
Ferry (2 prior years) 4 0.658 -0.140 -2.78 ** -0.130 0.307 2.15 2
Time (t) 4
-0.025 -2.79 **
Time-trend only model
Time (t) 5
-0.023 -2.31 *
0.136 2.13 2
N obs 38
*significance < 0.05
**significance <0 .01
Note: #Calculated as exp(coeff)-1, where coeff is the estimated OLS regression coefficient from an equation with a logged dependent variable. See Halvorson & Palmquist (1980).
50
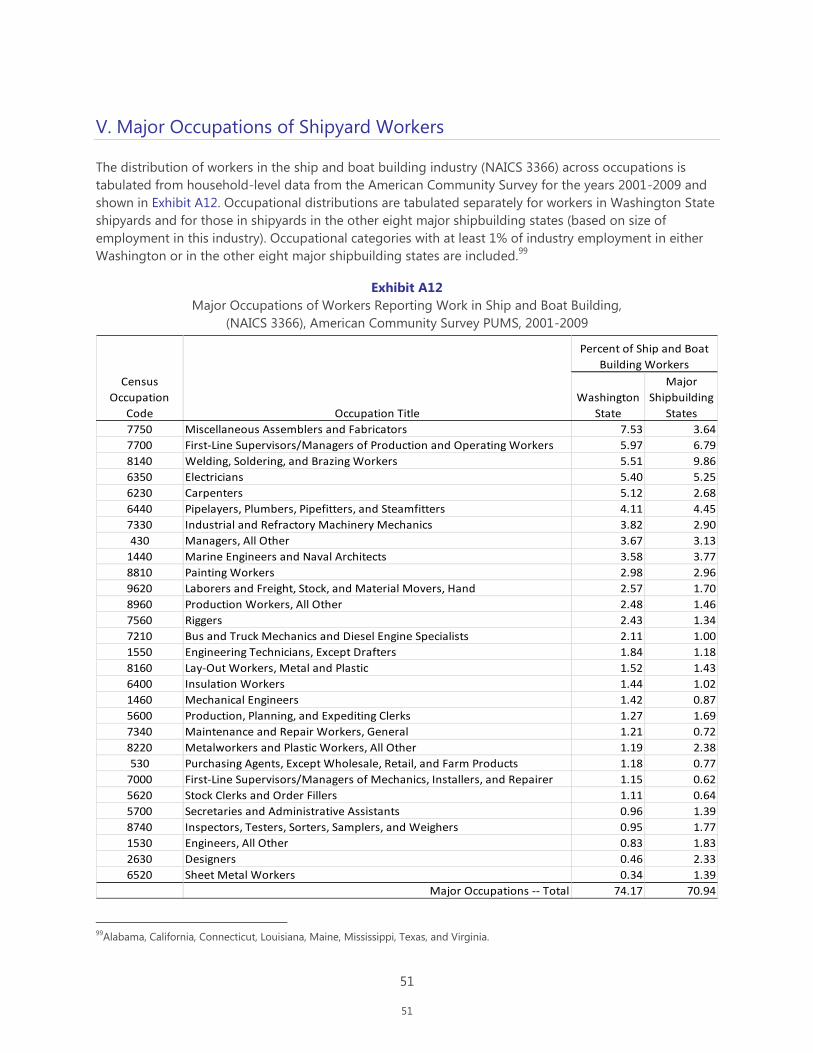
51
V. Major Occupations of Shipyard Workers
The distribution of workers in the ship and boat building industry (NAICS 3366) across occupations is
tabulated from household-level data from the American Community Survey for the years 2001-2009 and
shown in Exhibit A12. Occupational distributions are tabulated separately for workers in Washington State
shipyards and for those in shipyards in the other eight major shipbuilding states (based on size of
employment in this industry). Occupational categories with at least 1% of industry employment in either
Washington or in the other eight major shipbuilding states are included.99
Exhibit A12
Major Occupations of Workers Reporting Work in Ship and Boat Building,
(NAICS 3366), American Community Survey PUMS, 2001-2009
99
Alabama, California, Connecticut, Louisiana, Maine, Mississippi, Texas, and Virginia.
Washington
State
Major
Shipbuilding
States
7750 Miscellaneous Assemblers and Fabricators 7.53 3.64
7700 First-Line Supervisors/Managers of Production and Operating Workers 5.97 6.79
8140 Welding, Soldering, and Brazing Workers 5.51 9.86
6350 Electricians 5.40 5.25
6230 Carpenters 5.12 2.68
6440 Pipelayers, Plumbers, Pipefitters, and Steamfitters 4.11 4.45
7330 Industrial and Refractory Machinery Mechanics 3.82 2.90
430 Managers, All Other 3.67 3.13
1440 Marine Engineers and Naval Architects 3.58 3.77
8810 Painting Workers 2.98 2.96
9620 Laborers and Freight, Stock, and Material Movers, Hand 2.57 1.70
8960 Production Workers, All Other 2.48 1.46
7560 Riggers 2.43 1.34
7210 Bus and Truck Mechanics and Diesel Engine Specialists 2.11 1.00
1550 Engineering Technicians, Except Drafters 1.84 1.18
8160 Lay-Out Workers, Metal and Plastic 1.52 1.43
6400 Insulation Workers 1.44 1.02
1460 Mechanical Engineers 1.42 0.87
5600 Production, Planning, and Expediting Clerks 1.27 1.69
7340 Maintenance and Repair Workers, General 1.21 0.72
8220 Metalworkers and Plastic Workers, All Other 1.19 2.38
530 Purchasing Agents, Except Wholesale, Retail, and Farm Products 1.18 0.77
7000 First-Line Supervisors/Managers of Mechanics, Installers, and Repairer 1.15 0.62
5620 Stock Clerks and Order Fillers 1.11 0.64
5700 Secretaries and Administrative Assistants 0.96 1.39
8740 Inspectors, Testers, Sorters, Samplers, and Weighers 0.95 1.77
1530 Engineers, All Other 0.83 1.83
2630 Designers 0.46 2.33
6520 Sheet Metal Workers 0.34 1.39
Major Occupations -- Total 74.17 70.94
Percent of Ship and Boat
Building Workers
Census
Occupation
Code Occupation Title
51

52
VI. Differences in Shipbuilding Labor Cost across States
We examine several national data sources that provide information on labor cost differentials between
shipbuilding in Washington State and elsewhere. Interest in labor costs derives from the fact that ferry
construction costs are driven by the costs of inputs in the production process. We assume that all
shipyards purchase non-labor inputs in national markets and therefore face roughly the same costs for
these inputs. Labor costs can differ by region, however, and as such these are likely to be the primary
determinants of ferry construction costs differences across states and regions. Regional labor cost
differences as measured here can result from a number of factors. Measured differences can reflect
differences in worker skill and productivity levels that cannot be accounted for in this analysis, they can
reflect competitive conditions in regional labor markets, or they can reflect different state by state sub-
industry mixes within the aggregate ship and boat building industry identified here. Such differences in
labor costs are unlikely to be affected by whether Washington State restricts ferry purchases to in-state
producers or not.
We derive estimates of labor cost differentials for the Washington State shipyard industry, drawing on
data from two types of data sources. First, we use state summary data on payroll (and when available, on
other costs of compensation as well) in the shipbuilding industry to calculate payroll per employee as a
measure of labor costs. Such data are available from two different U.S. Census Bureau products—the state
summary of the County Business Patterns data and the 2012 Economic Census. In addition, we draw on
individual-level data from the Public Use Micro Samples (PUMS) of the American Community Survey
(ACS). The Census Bureau has implemented the ACS by conducting an annual survey of approximately
two million households each year since 2000. Our analysis of each of these data sources is discussed
below.
Aggregate Labor Cost Data
To analyze labor costs in the ship building and repair industry (NAICS 336611) in Washington and other
states we compile data from the Economic Census for five year intervals from 1997 through 2012. (The
Economic Census survey is conducted by the Census Bureau every five years in years ending in 2 and 7).
We use data on total industry employment and payroll to calculate payroll per worker. Our analysis
focuses on the nine states with the largest shipbuilding activity in the U.S. Together these nine states
comprise approximately 90% of the total employment in the shipbuilding industry in 2012. The nine states
are Alabama, California, Connecticut, Louisiana, Maine, Mississippi, Texas, Virginia, and Washington.
Since 1997, there has been a general decrease in labor costs (as measured by payroll per worker) in
Washington State relative to the U.S. as a whole and relative to the other eight large shipbuilding states.
However, in the most recent data for 2012, a mixed picture emerges. Payroll per employee in the
Washington State shipyards is below the U.S. average, but slightly above the other eight comparison
states.
It is important to note that among the eight comparison states, payroll data is suppressed for three states:
Connecticut, Maine, and Mississippi. The Census Bureau suppresses data when there are a small number
of business establishments in a state and publication would violate data confidentiality protections. For
those states, it provides a range of possible employee counts rather than an exact number. The Census
Bureau reported there were between 5,000 and 9,999 shipbuilding and repair employees in Connecticut
and Maine in each of the four the time periods and between 10,000 and 24,999 employees in Mississippi
52

53
during the last three time periods. In Exhibits A13 and A14, we report an imputed value at the midpoint of
those ranges (7,500 and 17,500 respectively) for the states and time periods with suppressed data.
We also compile data from Census Bureau’s County Business Patterns data (state summary files). These
data are collected from individual establishments by the Social Security Administration for administrative
purposes and obtained by Census Bureau for research purposes. Again, we compute payroll per worker
for two recent years (2012 and 2014). The 2014 data is the most recent data available and the 2012 data
allows a direct comparison with the Economic Census data.
Exhibit A13
Total employment Payroll per worker
1997 2002 2007 2012 1997 2002 2007 2012
Alabama 2,644 2,818 2,648 5,002 29,250 35,487 47,502 48,258
California 8,179 6,568 7,470 10,383 32,691 40,861 49,548 49,302
Connecticut 7,500 7,500 7,500 7,500 N/A N/A N/A N/A
Louisiana 13,276 12,869 13,627 10,894 30,789 30,933 40,027 54,577
Maine 7,500 7,500 7,500 7,500 N/A N/A N/A N/A
Mississippi 12,535 17,500 17,500 17,500 N/A N/A N/A N/A
Texas 3,087 3,092 4,536 5,078 30,194 38,456 49,150 57,706
Virginia 22,086 20,077 22,943 27,300 37,271 45,881 51,612 59,441
Washington 3,597 3,244 4,615 4,033 38,291 44,564 48,676 55,456
U.S. 97,065 87,355 98,510 105,192 34,548 41,486 49,266 59,753
Nine state
total employment
80,404 81,168 88,339 95,190
% of U.S. 82.8% 92.9% 89.7% 90.5%
Mean 32,039 38,324 47,568 53,857
WA relative to:
U.S. 10.8% 7.4% -1.2% -7.2%
Eight states 19.5% 16.3% 2.3% 3.0%
Source: 1997, 2002, 2007, and 2012 Economic Census.
Note:
Employment data in shaded cells is imputed at the midpoint of reported range due to data suppression. The Census Bureau reported
that there were between 5,000 and 9,999 shipbuilding and repair employees in Connecticut and Maine in 1997, 2002, 2007, and 2012
and between 10,000 and 24,999 employees in Mississippi in 2002, 2007, and 2012.
53

54
Exhibit A14
Employment, Payroll and Payroll per Worker in the Ship Building and Repairing Industry
Nine largest ship building states, NAICS code 336611
2012 2014
Employment Payroll
($1,000s)
Payroll
per
worker
Employment Payroll
($1,000s)
Payroll
per
worker
Alabama 4,816 $245,781 $51,034 5,764 $305,200 $52,949
California 11,755 $507,187 $43,146 9,142 $499,659 $54,655
Connecticut 7,500 n/a n/a 7,500 n/a n/a
Louisiana 10,084 $592,656 $58,772 7,443 $421,800 $56,671
Maine 7,500 n/a n/a 7,500 n/a n/a
Mississippi 17,500 n/a n/a 17,500 n/a n/a
Texas 5,074 $288,243 $56,808 4,558 $281,683 $61,800
Virginia 37,500 n/a n/a 37,500 n/a n/a
Washington 3,829 $227,122 $59,316 3,268 $186,361 $57,026
Mean (excluding Washington) $52,440 $56,519
Washington relative to large states 13.11% 0.90%
U.S. 108,311 $6,399,464 $59,084 106,734 $6,607,133 $61,903
Washington relative to U.S. 0.39% -7.88%
Source: 2012 and 2014 County Business Patterns, State Summary Files.
Note:
Employment data in shaded cells is imputed at the midpoint of reported range due to data suppression. The Census Bureau reported
that there were between 5,000 and 9,999 shipbuilding and repair employees in Connecticut and Maine and between 10,000 and
24,999 employees in Mississippi.
These data present a somewhat consistent picture for 2012. While the Economic Census data shows
Washington State labor costs at 3.0% above the average for other ship building states, the Business
Patterns data show Washington at 13.1% above the average for these other states. Compared to the U.S.
average, however, the Economic Census data has Washington 7.2% below average in 2012 while the
Business Patterns data shows Washington quite close to the national average. The two data sources are
more closely aligned when the comparison is the U.S. as a whole. In 2014, the Business Patterns data
suggest that Washington State’s labor costs are nearly identical to the average for the other large ship
building states and that Washington costs have fallen to nearly 8% below the U.S. average.
Individual Level Earnings Data
An alternative approach to estimating Washington’s labor costs differences is to employ individual level
data on wage and salary earnings to estimate differences in pay between ship and boat building and
repair workers (NAICS 3366) in Washington State and those in the other major shipbuilding states. This
comparison differs from the two above in that the focus is necessarily on the broader industry which
includes both ship and boat building (NAICS 3366 instead of NAICS 336611). The data used here are
derived from a household-based survey rather than an establishment-based survey. However, these data
include richer information about workers including human capital variables such as education and
potential experience. These variables are important because experience and education are proxies for
54

55
labor productivity. Thus, the estimates produced below control for differences in labor productivity across
states that would be linked to education and potential experience.
Data are drawn from the PUMS from ACS for the years 2001-2009. These years represent the most recent
complete business cycle in the U.S. economy. Estimates based on the entire business cycle will “average
out” any effects that might be associated with one particular point in the business cycle.
Sample. Workers included in the analysis are those aged 18-65 who had positive earnings from an
employer in the year immediately prior to the survey, positive weeks and hours worked in that year, and
who also reported that their most recent employment occurred in the ship and boat building industry
(NAICS code 3366). The industry profile for industry 3366 combines the more disaggregated industries
ship building and repair (336611) and boat building and repair (336612). In states with significant ship
building activity, NAICS code 3366 will likely consist of a mix of both ship and boat building. In states
without significant ship building activity, however, employment in the boat building sector (NAICS code
336612) will likely dominate NAICS code 3366. To address this issue, we restrict the sample to workers in
the nine states with significant ship building activity, using the criteria of largest employment in
shipbuilding (NAICS 336611) in the 2012 Economic Census of Manufacturing as discussed above. This
approach restricts the comparison of Washington State workers to workers in states with a more similar
industrial profile.100
Variables. Earnings measured are those from wage and salary employment only. Earnings from self-, farm-
or family-employment are not included in the analysis. Earnings from all years are adjusted to 2014 dollars
using the GDP Implicit Price Deflator.
In the ACS, earnings measures refer to totals for the 12-month period immediately preceding the survey.
In contrast, the identification of industry of employment refers to the job held last week or, if the
respondent is not currently employed, to the most recently held job within the past five years.101
If the job
held last week has not been long-lived then the earnings measured may correspond less than completely
to the rate of earnings in the current industry of employment.
In some specifications, control variables for key worker productivity characteristics are included in the
analysis as well. These are years of education for each worker (based on reported educational attainment)
and estimated years of potential work experience (calculated as an individual’s age minus their years of
education minus six). Education in the ACS is coded categorically as different levels of educational
attainment (e.g. high school graduation, some college but no degree, Associates degree, etc.) and these
have been coded to the years of education that would normally be implied. In some cases, the
educational attainment level specified represents a possible range of years of schooling. In these cases,
the midpoint of the range is used. The educational attainment categories coded are slightly different for
the ACS for 2001-2007 and for 2008-09. The categories and coding for each case are shown in Exhibit A15
(on the next page).
Estimated equation. Washington State earnings differentials are estimated from OLS regression based on
the following equation:
(1) Ln AE = a + b WA + c Year + d Ed + e Exp + f Exp2
100
For the purposes of identifying state, the location of worker’s place of work is used. In some cases, particularly when metropolitan
areas are next to or cross state boundaries, a worker’s state of residence may actually be different from the state in which they work. 101
If a person held more than one job last week, then information is recorded for the job at which they worked the most hours.
55

56
Where AE represents annual earnings, WA is an indicator for workers living in Washington State, Year
represents a series of indicator variables for years 2002-2009, and Ed and Exp represent years of education
and potential work experience as defined above. Coefficient b is an estimate of the percentage pay
difference between workers in Washington State and those in other included states in the same industry.
All equations are estimated using the ACS PUMS population weights. As is typical for the estimation of
earnings equations, a semi-log form is used to better fit the typical pattern of earnings. One consequence
of using the natural log of the dependent variable is that the coefficient on any indicator variable can be
interpreted as an approximate percent change in the dependent variable that is associated with a change
in the indicator variable.102
Results. Estimated coefficients for equation (1) are presented below in Exhibit A15 with and without
controls for education and potential work experience. The inclusion of controls for worker productivity has
a small effect on the estimated differential for Washington State workers. Coefficients on all included
variables are highly statistically significant. The coefficient comparing earnings in Washington to earnings
in other states with significant shipbuilding industries is estimated as either 0.061 or 0.073, depending on
the inclusion of worker productivity controls in the equation. These imply that either 6.3% or 7.6% higher
earnings for Washington State workers in this industry as compared with workers in the same industry in
other major shipbuilding states. These figures are an average across the years included (2001-2009) and
are consistent with the measures derived from the Economic Census above for roughly the same time
period.
Exhibit A15
Coding of Years of Education According to Educational Attainment, by ACS Year
102
The precise percentage difference is exp(b) – 1. See Halvorsen and Palmquist (1980).
56

57
Exhibit A16
OLS Regressions Explaining Pay in the Ship and Boat Building Industry (NAICS 3366),
2001-2009 (standard errors in parentheses)
Dependent variable: Major shipbuilding states
#
Ln annual earnings
Intercept 10.680 *** 8.768 ***
(0.026)
(0.053)
Work in Washington State indicator 0.061 *** 0.073 ***
(0.023)
(0.021)
Education (years) 0.093 ***
(0.003)
Potential work experience (years) 0.049 ***
(0.002)
Potential work experience-squared -0.001 ***
(0.0000)
Year dummies included Yes
Yes
N 6,461
6,461
Adj R-squared 0.006
0.218
Note: #Alabama, California, Connecticut, Louisiana, Maine, Mississippi, Texas, Virginia, and Washington.
57

58
VII. Economic Impact Analysis
In addition to the BCA outlined in Appendix I, WSIPP conducted an economic impact analysis (EIA) of how
the alternative policy scenarios would affect various aspects of the state’s economy. This analysis was
conducted using Regional Economic Models, Inc.’s (REMI) Tax-PI software (v 1.7.105) software program.103
Joint Legislative Audit and Review Committee (JLARC) staff contributed to the economic impact analysis
for this legislatively required study. JLARC modeled several policy options in coordination with WSIPP staff
using the REMI model.
REMI software is used by state agencies in about two-thirds of U.S. states and is also widely used by
private sector research and consulting firms. Tax-PI is a software tool that embodies a specific
implementation of the more general concept of economic impact analysis. In particular, the REMI software
allows for the assessment of a specific policy change—such as requiring that ferries be built in
Washington State—on economic effects and demographic outcomes. REMI is sectoral-based model
containing 160 industrial sectors classified using NAICS codes. The model has been customized to reflect
the particular industrial composition of the Washington State economy.
Current policy requires the construction of ferries in Washington State. A change in that policy to allow
open bidding from shipyards across the U.S. would increase the possibility that future ferry construction
would take place outside of Washington State. We used the REMI model to assess how shifting ferry
construction out of state would result in a reduction of business activity (sales) in Washington State
Shipyards (NAICS code 336611).104
Specifically, the REMI model projects two future scenarios: a baseline
scenario based on the current policy environment and an alternate scenario resulting from the policy
change. The difference between the two scenarios represents the projected policy impact. The baseline
scenario leaves current policy unchanged and projects key outcomes for the state economy over the next
25 years. The alternate scenario is identical to the baseline in every respect but one: we assume there will
be a $130 million (in current dollars) reduction in ferry construction spread equally over 2021 and 2022.105
We select 2021 as the starting point for this scenario because the Washington State Ferry Vessel
Procurement Plan, as updated in 2016, anticipates beginning construction of a new 144-car ferry in that
year.106
WSF estimates a $130 million cost of the hypothetical ferry ship in current year dollars.107
The REMI model captures impacts from a policy change. Primary impacts are those that occur in the
specific businesses or industry affected by a given policy.108
In this case, the affected industry is the ship
and boat building industry (NAICS code 3366). The construction of a ferry in Washington State increases
revenues, employment, and income in the shipyard industry. In particular, earnings will increase for
103
See Waters (1976) for a description of the differences in evaluative studies (such as BCA) and impact studies (such as EIA). Vining
et al. (2011) have a similar discussion pp. 8-9, and 18-20. 104
NAICS code 336611 is the most detailed industry code for the industry classification associated with ferry construction. This
category includes ship building and repair and focuses on all types of ships including ferries, barges, other commercial vessels, and
military ships, though it excludes boats. Boats are recreational in nature, while ships are commercial. NAICS code 336612
incorporates boat building, while NAICS code 3366 is the broader classification that incorporates both ship and boat building and
repair. 105
Historical analysis of ferry ship construction indicates that material costs make up a greater percentage of the costs in the first
year, while labor costs make up a greater percentage in the second year of construction. We chose to evenly distribute the costs
because the true distribution added complexity while having only a negligible impact on the results. 106
Washington State Department of Transportation, Ferries Division. (2009), Information on WSF’s updated procurement plan was
provided to WSIPP via email (von Ruden, M. personal communication, June 28, 2016). 107
M. von Ruden (personal communication, June 28, 2016). 108
The REMI software refers to these effects as direct effects.
58

59
workers, and the owners of the shipyard will experience an increased return to their capital investment in
the shipyard industry.
In addition to primary effects, there are secondary effects or multiplier effects. These effects occur
because the primary activity (ferry ship construction) generates additional business for other firms that
supply inputs to the ferry construction process. Businesses in the shipyard industry will increase their
purchases of intermediate goods and services which are used in the production of ferries. Examples might
include intermediate products such as steel, and electricity as well as intermediate services such as
accounting, and legal representation. In addition, secondary or multiplier effects are generated when the
extra income realized by shipyard workers and owners leads to additional consumption spending in the
economy, which in turn generates still more economic activity. REMI fully accounts for both of these
multiplier effects, and refers to them as indirect effects and induced effects, respectively. The REMI model
also explicitly models “leakages” from the local economy. That is, the model accounts for the fact that not
all of the secondary spending will occur in Washington State.
Outcomes
REMI produces a wide array of outcomes, but here we focus on a several selected key indicators that
capture the broad impact on the economy. These include non-farm private employment, total state
population, and value added.109
Exhibit A17 provides detailed definitions of these concepts.
Exhibit A17
Economic Impact Outcomes
Outcome Definition
Private non-farm employment
Employment comprises estimates of the number of jobs (full-
time plus part-time) by place of work for all industries except
government and farm. Full-time and part-time jobs are counted
at equal weight. Employees, sole proprietors, and active partners
are included, but unpaid family workers and volunteers are not
included.
Population
Population reflects mid-year estimates of people, including
survivors from the previous year; births; special populations; and
three types of migrants (economic, international, and retired).
Value added
The sum of value added for private non-farm industries, state
and local government, federal civilian, federal military, and farm
sectors.
Notes:
These definitions are provided in documentation for the (REMI) Tax-PI software (v 1.7.105) software program.
109
We use value added instead of gross domestic product for impact outcomes to facilitate the analysis of direct and indirect
impacts in Exhibit A19. The two accounting concepts are virtually identical as can be seen from this definition provided by the
Bureau of Economic Analysis (BEA): “The value added of an industry, also referred to as gross domestic product (GDP)-by-industry, is
the contribution of a private industry or government sector to overall GDP. The components of value added consist of compensation
of employees, taxes on production and imports less subsidies, and gross operating surplus. Value added equals the difference
between an industry’s gross output (consisting of sales or receipts and other operating income, commodity taxes, and inventory
change) and the cost of its intermediate inputs (including energy, raw materials, semi-finished goods, and services that are
purchased from all sources).” See http://www.bea.gov/faq/index.cfm?faq_id=184.
59

60
As would be expected, the main impacts of the analyzed policy change occur in the years 2021 and 2022.
These results are displayed in Exhibit A18. As a result of the policy change we would expect an average
yearly decrease in employment of about 659 jobs in 2021 and 2022.110
GDP will fall by about $68 million
in each year as well. By the end of 2022, population in the state is forecasted to be 112 below the baseline
forecast. After 2022, the selected outcome variables quickly resume a path that converges with the
baseline forecast.
Exhibit A18
Policy Simulation Results, Economic Impact Analysis
Yearly outcomes averaged over 2021-2022
Outcome Baseline scenario Alternate scenario Policy impact
Private non-farm employment 3,599,945 3,599,286 -659
Population 7,740,957 7,740,845 -112
Value added $492,068 million $492,000 million ($68 million)
Note:
Value added is measured in millions of 2014 dollars. Numbers may not sum exactly due to rounding.
The total policy impacts displayed in Exhibit A18 can be broken into direct effects and multiplier effects.
Direct impacts are a result of the extra income earned by shipyard workers and owners as a result of
building the ferry. Multiplier impacts occur in other parts of the economy. For example, the shipyard
building the ferry will purchase a wide range of goods and services required as inputs in the ferry
construction process. These purchases will generate income in other parts of the Washington State
economy. Further, as a result of increased income consumers will increase their purchase of a wide range
of goods and services. This activity will also contribute to multiplier effects. Exhibit A19 displays the total
policy impact (replicated from Exhibit A18) broken down into direct and multiplier effects. The results
indicate that somewhat less than half of the total forecasted impact is a direct impact occurring in the ship
and boat building industry—more than half of the forecasted impacts occur outside of the ship and boat
building industry.
110
Note that these are total jobs rather than employed persons. The same employed person could hold several jobs simultaneously.
Exhibit A19
Policy Impacts, Economic Impact Analysis
Yearly Outcomes Averaged Over 2021-2022
Outcome Baseline
scenario
Alternate
scenario
Total policy impact
(= direct effect + multiplier effect)
Direct effect Multiplier
effect
Total policy
impact
Private non-farm
employment 3,599,945 3,599,286 -280 -379 -659
Value added $492,068 million $492,000 million ($25 million) ($43 million) ($68 million)
60

61
VIII. Case Studies on Ferry Procurement
BC Ferries
BC Ferries (British Columbia Ferry Services Inc.) operates the ferry services in British Columbia, Canada, linking
the mainland of the province to various coastal communities. BC Ferries is the largest ferry operator in the
world, with a fleet of 34 vessels that serve 47 terminals.111
Unlike WSF, which is committed to standardizing
its fleet into specific classes of vessels, BC Ferries has a greater amount of variation in its ships. BC Ferries has
significantly shifted how it operates and procures ferries over the last 30 years.
BC Ferries’ history of shipbuilding parallels that of the Pacific Northwest. The region experienced a boom
in shipbuilding during World War II, but by the 1990s, the regional industry had contracted. The provincial
government created an initiative whereby private shipyards would build a series of four high-speed
ferries. The construction would be overseen by BC Ferries. The goals of the program were to meet
regional transportation needs, generate jobs, and training and revitalize the shipbuilding industry through
future exports of aluminum fast ferries.112
As a Crown corporation, BC Ferries was intended to operate relatively independently from elected
government; however, in practice, business decisions were still made by elected officials, which
undermined the intent of the organizational structure.113
According to a report from the Office of the
Auditor General of British Columbia, the ten-year plan was taken over and significantly modified by
political leadership (the minister in charge of the Crown Corporations Secretariat). A long-term plan with a
timetable and costs for the proposed fast ferries was published. Although BC Ferries no longer had direct
control over their long-term plan, the agency was still responsible for achieving the goals the plan laid
out.
Later, BC Ferries discovered that none of the local shipbuilding yards was willing to be the lead shipyard
on the fast ferries project. None of the shipyards had capacity to handle the entire ferry construction
process, which led BC Ferries to acquire a site for the final assembly. BC Ferries created a wholly owned
subsidiary to take on project management and the substantial amount of the risk that comes with a
construction project.114
The cost for the ferries stretched from a projected $210 million to $463 million, and the schedule fell over
two years behind.115
In its original ten-year plan, BC Ferries had advocated a cautious approach to fast
ferry construction, including the leasing of fast ferries for trials. However, this testing was removed from
the final plan, and the resulting ferries were not suitable for rough water along the routes. The ferries were
also plagued by mechanical problems and caused a high wake. The ferries used a significant amount of
fuel, and when gas prices spiked, the operational costs increased significantly. The third class in the series
was completed but never put into service, and the fourth ferry was never constructed. The ferries were dry
docked for years and then sold for about $19 million.116
111
http://www.bcferries.com/about/More_Information.html 112
http://www.bcauditor.com/sites/default/files/publications/1999/report5/report/review-fast-ferry-project-governance-and-risk-
management.pdf, p. 5. 113
Ibid, p. 12. 114
Ibid, p. 23. 115
Ibid, p. 7. 116
http://www.cbc.ca/news/canada/british-columbia/b-c-fast-ferries-sold-to-uae-buyer-1.852093
61

62
A BC Auditor’s report concluded that the construction of the ferries was done before sufficient testing of
the design because the ferries could not hold up in the water conditions of the routes. The auditor’s office
also noted that there was no evaluation of whether the policy goal of revitalizing the shipbuilding industry
could be achieved through domestic construction of fast ferries.117
The “fast ferry fiasco,” as it became
known, resulted in the replacement of the board of directors and much of senior management and led to
the restructuring of the corporation.
With the passage of the Coastal Ferry Act in 2003, BC Ferries changed from a provincial Crown
corporation into an independently managed, publicly owned company.118
This legislation, which followed
an independent review of BC Ferries, moved BC Ferries further from government and closer to the private
sector. In 2004, BC Ferries disqualified all of the Canadian shipyards from bidding on three new vessels
and only considered bids from European shipyards.
Unlike WSF, which is required by the Jones Act to build ferries inside the U.S., BC Ferries can purchase
internationally constructed ships, but has to pay a 25% import duty.119
In 2004, BC Ferries awarded a
three-ship contract worth $325 million ($267 million U.S.) to a German shipyard. BC Ferries' president
stated that even with the import duty, construction in Germany would save almost $80 million.120
In 2014,
BC Ferries again awarded another three-ship contract to a European shipyard, this time to one in
Poland.121
Alaska Marine Highway System
In the last decade, the Alaska Marine Highway System (AMHS) has changed how it purchases ferry ships.
As one of the largest public ferry operators in the U.S., AMHS may provide some lessons learned for
Washington State. However, there are a number of factors that distinguish the two ferry systems.
AMHS operates fewer routes and ships than Washington State Ferries (WSF). It has only 11 ships and
serves 33 Alaskan communities, 28 of which aren’t connected to the road system.122
Conversely, WSF has
a larger fleet of 24 vessels that sail to 20 terminals. Some of the routes served by AMHS are also
substantially longer than those served by WSF. AMHS does operate some shuttle ferries that depart their
home port in the morning, travel to destination ports, and then return to their home port on the same
day.123
AMHS’ fleet also includes mainline and Aurora class vessels that can sail for multiple days and have
crew quarters as well as possibly passenger staterooms.
Alaska’s longer ferry routes serve more remote communities and are less profitable than shorter routes.
AMHS’s ships must be capable of operating in rougher water than WSF, particularly in the winter months.
Ships that sail to Canada must be certified under the International Maritime Organization’s Safety of Life
at Sea (SOLAS) regulations. The requirements for greater seaworthiness, overnight accommodations, and
regulatory compliance contribute to the complexity and cost of AMHS ferries.
117
http://www.bcauditor.com/sites/default/files/publications/1999/report5/report/review-fast-ferry-project-governance-and-risk-
management.pdf, p. 6. 118
http://www.bcferries.com/about/More_Information.html 119
However, BC Ferries has been able to receive retroactive relief from these import duties in the past:
http://www.timescolonist.com/news/local/jack-knox-ferries-make-headway-as-b-c-lobbies-for-federal-cash-1.2132867 120
http://www.professionalmariner.com/February-2007/Construction-to-begin-in-Germany-on-large-double-enders-for-BC-Ferries/ 121
http://www.vancouversun.com/technology/Ferries+awards+contracts+three+ships+Polish+yard/9997896/story.html 122
http://www.dot.state.ak.us/amhs/doc/reports/econ_15.pdf p. 6. 123
http://www.dot.state.ak.us/amhs/alaska_class/documents/change_122012.pdf p. 1.
62

63
The Alaska State Legislature has substantially changed its procurement practices over the last 30 years.
The four ships purchased in the 1990s and 2000s were done so through open competition and subsidized
by federal grant money. The current round of ship procurement was allocated through a non-competitive
process that went without federal funds in order to guarantee that the ships were built in Alaska.
1990s: Kennicott. By the 1990s, the AMHS fleet had several ships nearing the end of their useful lives.
According to an Alaskan Department of Transportation report, the top priority was replacing one of the
larger mainline ships. However, the state also wanted a replacement ship that could travel across the Gulf
of Alaska and respond to oil spills, which was relevant in the wake of the Exxon Valdez disaster. Building a
ship that could meet this need would also make its purchase eligible for using federal emergency vessel
funds.
The resulting Kennicott was completed in Mississippi by Halter Marine in 1998 at a cost of nearly $80
million. Controversy followed the construction. Halter Marine sued the state for $46 million for causing its
cost overruns, but the shipyard filed for bankruptcy before the suit was settled. Alaska eventually settled
the lawsuit by paying a subcontractor an amount between $500,000124
and $1.2 million 125
according to
contradictory sources.
2000s: Fast ferries. AMHS’s next round of ferry procurement was also marked by controversy. In order to
reduce operating costs, AMHS developed a plan of purchasing four smaller fast ferries that require smaller
crews and operate only part of each day or week. According to an Alaskan DOT report, most of the
funding to build the Fairweather and Chenega was provided by grants from the Federal Transit
Administration and the Federal Highway Administration. The ships were built by Derecktor Shipyards in
Bridgeport, Connecticut in 2003-2004 and 2004-2005.
The ships began experiencing mechanical difficulties immediately following delivery.126
They had difficulty
operating in the harshest weather of the routes and experienced more canceled sailings in the winter than
was expected. The engines were also the subject of a drawn-out lawsuit between the state and the engine
manufactures and the shipyard.127
The fast ferries used more fuel than traditional ferries especially when
routes are too short for the ferries to maintain top speed. When fuel costs unexpectedly increased, it
resulted in dramatically escalated operational costs. In response to the problems with the fast ferries, the
legislature did not approve the two additional ferries needed to complete the proposed four-ship fast
ferry system.
However, AMHS did purchase one additional ship in the 2000s to create the system’s first single shuttle
route.128
Conrad Shipyards in Louisiana built the Lituya, which was a smaller and less technical ship based
off the design of offshore oil platform supply vessels.
124
http://www.sitnews.us/0706news/070806/070806_marine_highway.html 125
http://www.dot.state.ak.us/amhs/doc/reports/system_analysis.pdf 126
The State of Alaska has been involved with a long-running lawsuit with the engine manufacturer according to the following:
http://www.ktoo.org/2013/10/16/fast-ferry-engines/ 127
http://www.ktoo.org/2013/10/16/fast-ferry-engines/ Note that the shipyard went bankrupt before an agreement was reached,
but Alaska was able to reach a settlement with the German engine manufacturer. 128
http://www.dot.state.ak.us/amhs/doc/reports/system_analysis.pdf
63
64
2010s: Current round of ship procurement. Beginning in 2006, AMHS began the design process for the ship
intended to be the first Alaska Class Ferry. The vessel was initially envisioned as a day shuttle ferry with a
roll-on-roll off design that would allow cars to load and exit through the stern/bow. The Alaska
Department of Transportation and Public Facilities (DOT&PF) began working with naval architecture firm,
Elliott Bay Design Group, to create a design study report. The report was completed in 2009 and had
multiple changes from the original design, including the elimination of a bow door, an increased ferry
length, and the addition of crew quarters. While the initial 2006 cost estimate for the ship was placed at
between $25 million and $30 million, the estimate in 2009 had climbed to $120 million (both
unadjusted).129
In 2010, the Alaskan State Legislature appropriated $60 million to pay for the ferry, and
was matched by $68 million in Federal Highway Administration funds.
Later in 2010, the recently-elected governor announced that AMHS would return the federal funds and
scrap the designs develop so far. Instead, the governor stated that AMHS would build two small ships for
the same $120 million budget and construction would happen in Alaska. The de-federalization of the
project made it possible for AMHS to control the bidding process, including limit bidding to in-state
shipyards.130
In 2011, the state legislature appropriated an additional $60 million for the project, bringing
the total funding amount to $120 million.
To negotiate the price of the new ferries, AMHS used a "construction manager/general contractor"
(CMGC) process. Only Vigor Alaska was invited to participate in the CMGC bidding process. Vigor Alaska
leases the Ketchikan shipyard, which is owned by the state’s Alaska Industrial Development and Export
Authority. Unlike a traditional low-bid process, the shipyard is involved early in the design process. Then,
when the shipyard is familiar enough with the design to accurately estimate its cost, the shipyard
negotiates a "guaranteed maximum price” at which it can be profitable and which the state thinks is
fair.131
The shipyard can develop a design that reduces construction costs through their knowledge of the
construction process and information on the costs of components. The construction schedule can also be
set collaboratively. For example, the ferry construction can be ramped up during summer seasons when
Alaska’s shipyards have less maintenance work. AMHS was able to negotiate with Vigor Alaska to
construct the two day ferries for the $120 maximum agreed upon price.132
Both BC Ferries and AMHS illustrate different ways that public ferry systems have responded to the
challenges of ferry procurement. Ferry construction is a niche market and the shipbuilding industry is
highly concentrated. While BC Ferries has responded by opening up the bidding process, AMHS has used
a CMGC process to reduce uncertainty and lower costs with its local shipyard.
129
http://www.dot.state.ak.us/amhs/alaska_class/documents/change_122012.pdf pp. 1-2 130
Ibid. 131
http://www.adn.com/print/article/20141005/new-ferry-contract-part-effort-create-shipbuilding-industry-alaska 132
http://www.marinelog.com/index.php?option=com_k2&view=item&id=7763:vigor-alaska-to-build-two-new-amhs-
ferries&Itemid=230
64

65
IX. Recent History of WSF Vessel Procurement
Over the last 30 years, the majority of new ferry construction for WSF has been led by a single Seattle-based
shipyard. Todd Pacific Shipyards, later acquired by Vigor Industrial, has been the lead shipyard in the
construction of the last eight ships and three classes of ferries; however, other shipyards have collaborated
on their construction.
Between 1994 and 1998, Todd Pacific Shipyards built the first car ferries built for WSF in 20 years. The three
Jumbo Mark II class ferries are the largest ferries in the WSF fleet, with a capacity of 2,500 passengers and
202 vessels.133
Despite this addition, the fleet had a number of aging vessels including four steel electric class
ferries that had been constructed in 1927. WSF abruptly retired those four ferries after finding corrosion
during an inspection. This action led to a crisis on the Port Townsend-Keystone route, with residents left
without regular ferry service. WSF leased a Pierce County ferry to try to fill in the gap and requested bids for
a 50-car ferry to serve that route. The single bid they received on the project from Todd Shipyards was
rejected at $9 million over the engineer’s estimate of about $17 million.134
At the time, WSF explained the
resulting higher bid as resulting in part from changes to the design, and Todd Shipyards also pointed to the
strict one-year timeline for the project.135
In an effort to quickly construct a replacement for the steel electric ferries, WSF then purchased a design for a
new 64-car ferry based on the Island Home. The original ferry had been constructed in 2005 by V.T. Halter
Marine of Mississippi for the Steamship Authority (SSA), which oversees Massachusetts’ ferry operations.136
In
November 2008, WSF released a new request for proposals (RFP) for two 64-car vessels based on this design.
A 2013 State Auditor’s Office Report analyzing WSF’s vessel construction costs reported that the sole bid on
this two-vessel contract came from a consortium of shipyards led by Todd Shipyard. The bid was about 30%
over the engineer’s estimates for the two ferries.137
During the SAO audit process, WSF explained that they purchased the design for a number of reasons—
using an existing design would reduce design time; the design already used the propulsion systems that WSF
had in storage; and the Island Home operates in a similar seasonal environment.138
The final cost for the first
ferry built on this design, the Chetzemoka, was significantly higher than the price for the Island Home.139
The
$87 million Chetzemoka included $10 million in change orders.140
The original purchased design was
modified via change orders for a number of reasons, including addressing excessive vibrations in the drive
train; bringing the ferry into greater similarity to the fleet; and extending the length of the ferry.141
Errors in
the design and additional Coast Guard requirements not caught before construction began also caused
delays.142
The SAO identified these change orders as one of the main driver in the vehicle’s cost. WSF
133
http://www.evergreenfleet.com/mark2.html 134
http://www.seattletimes.com/seattle-news/state-rejects-todd-shipyards-ferry-bid/ 135
Ibid. 136
Officially, this is the Woods Hole, Martha's Vineyard and Nantucket Steamship Authority. 137
https://www.sao.wa.gov/state/Documents/PA_Ferries_Vessel_Construction_ar1008884.pdf, p. 19. 138
Ibid, p. 25. 139
According to the SAO’s analysis which adjusted prices to 2011 dollars using a shipbuilding specific index, the Chetzemoka was
about $87 million and the Island Home was about $48 million. 140
SAO Report, p. 29. note that the $87 million (cost is in adjusted 2011 dollars) and includes $3.1 million for a propulsion system
that WSF had previously acquired. 141
For a good description of the changes made, see: http://www.professionalmariner.com/October-2010/Chetzemoka/. 142
http://www.kitsapsun.com/news/local/new-state-ferry-five-weeks-late-and-counting-and-the-costs-are-mounting-ep-
419524915-357553471.html
65

66
completed the three Kwa-di Tabil class ferries between 2009 and 2011 (see Exhibit 2 on page two of the main
report for the specific contracts award and paid amounts for these vessels).
In 2007, WSF signed a contract with a consortium of Washington Shipyards led by Todd Shipyards to build
144-car ferries. This construction was put on hold during the process of building the replacements for the
steel electrics. In 2011, WSF renegotiated the price and construction schedule for the first 144-car ferry.
Construction of the/ new Olympic class ferry started in early 2012, and the Tokitae was delivered in 2014. The
Washington State Legislature then funded the construction of the second 144-car ferry (the Samish) in June
2012, which was delivered in 2015. Funding for the third Olympic class ferry was authorized by the legislature
in spring of 2014 (the Chimacum is currently under construction), and the most recent Olympic class vessel
(the Suquamish) was authorized in 2015 and has an expected delivery date of 2017.
For further information, contact:
Madeline Barch 360.664.9070, [email protected] Document No. 16-12-4102
W a s h i n g t o n S t a t e I n s t i t u t e f o r P u b l i c P o l i c y
The Washington State Legislature created the Washington State Institute for Public Policy in 1983. A Board of Directors—representing the
legislature, the governor, and public universities—governs WSIPP and guides the development of all activities. WSIPP’s mission is to carry out
practical research, at legislative direction, on issues of importance to Washington State.
66