WASHINGTON HEALTH BENEFIT EXCHANGE · Qualified Health Plan Enrollees ... Data Source: ProviderOne...
16
Open Enrollment 5: Nov. 1, 2017 - Jan. 15, 2018 WASHINGTON HEALTH BENEFIT EXCHANGE HEALTH COVERAGE ENROLLMENT REPORT HEALTH COVERAGE ENROLLMENT REPORT WAhealthplanfinder.org Published March 2018
Transcript of WASHINGTON HEALTH BENEFIT EXCHANGE · Qualified Health Plan Enrollees ... Data Source: ProviderOne...

Open Enrollment 5: Nov. 1, 2017 - Jan. 15, 2018
WASHINGTON HEALTH BENEFIT EXCHANGE
HEALTH COVERAGEENROLLMENT REPORT
HEALTH COVERAGEENROLLMENT REPORT
WAhealthplanfinder.org
Published March 2018

Table of Contents
Total Enrollees ......................................................................................... 1 Enrollees Qualified Health Plan Enrollees Subsidized/Non-Subsidized by Month QHP Enrollees ......................................................................................... 2 By Metal Level By Percent of Federal Poverty Level (FPL) Enrollees by FPL/Metal Level New QHP Enrollees ................................................................................ 3 Total New By FPL By Metal/FPL Level QHP Renewals ........................................................................................ 4 Renewals By FPL By Metal Levels By Carrier QHP Disenrollment ................................................................................ 5 2017 Disenrollment By Metal Level By FPL/Metal Level Enrollees by County ............................................................................... 6 QHP by County Washington Apple Health by County QHP Enrollees Data ................................................................................ 7 Age Under 19 Race/Ethnicity U.S. Citizenship Gender By Carriers
Washington Health Benefit ExchangeEnrollment Report
OE5
This Enrollment Report in an excel spreadsheet with additional data is also available online at:https://www.wahbexchange.org/about-the-exchange/reports-data/Qualified Health Plans (QHP) data; Author: WAHBE/Thuy Ha, Data Source: Washington Healthplanfinder as of Feb. 23, 2018
Washington Apple Health - Medicaid MAGI/CHIP population:MAGI/CHIP Population Characteristics; Author: HCA/OMSD ; Data Source: ProviderOne ODS Data Warehouse as of Feb. 6, 2018
Language Data ....................................................................................... 8 Limited English Proficient Applicants Spanish Languages Top Language Requests By Applicants Language Enrollees ................................................................................ 9 Customer Service Top Language Requests Through Telephonic Interpretation Services
Dental Enrollees.................................................................................... 10 By Plan Type QHP with Dental By Age By Gender By Carrier Washington Apple Health Enrollees ................................................... 11 Age Under 19 Race/Ethnicity Medicaid Plan Selection By FPL Additional Data ..................................................................................... 12 Special Enrollment Period (SEP) Churn Additional Household Data ................................................................. 13 Partnered Households Households Additional Financial Data

TOTAL:
QHPsTotal: 209,802 (12%)
1,725,780
WA Apple HealthTotal: 1,515,978 (88%)
Total Enrollees
Subsidized/Non-Subsidized by Month
Enrollees Qualified Health Plan Enrollees
* Washington Apple Health is comprised of Medicaid MAGI (1,454,392) and CHIP (61,586) enrollees through Jan. 2018.
QHP - Non-Subsidized: Includes individuals who selected a qualified health plan that either did not qualify for a tax credit or did not apply for financial help.
QHP - Subsidized: Includes individuals who have selected a qualified health plan and are eligible for a tax credit to lower their monthly premiums.
All subsidized counts now include all individuals eligible for APTC.
Washington Health Benefit ExchangeEnrollment Report
OE5
1
Non-SubSubsidizedTotal
0
50K
100K
150K
200K
250K
3/1/17 4/1/17 5/1/17 6/1/17 7/1/17 8/1/17 9/1/17 10/1/17 11/1/17 12/1/17 1/1/18 2/1/18 55,877 ........... 55,231 ............54,583 ........... 54,299 ...........53,854 ........... 53,906 ...........53,737 ........... 53,026 ...........52,089 ...........49,772 ...........73,694 ............77,219 137,339 ........ 135,433 .........133,574 .......... 131,857 ..........130,270 ..........128,973 .........127,405 ..........125,531 ..........122,777 ......... 117,344 ......... 124,423 ......... 132,589 193,216 ......... 190,664 .......... 188,157 .......... 186,156 .......... 184,124 ..........182,879 ......... 181,142 ...........178,557 .........174,866 ..........167,116 ........... 198,111 ..........209,802
TOTAL:
Non-SubsidizedTotal: 77,219 (37%)
SubsidizedTotal: 132,589 (63%)
209,802
* Qualified Health Plans (QHP)

TOTAL:
SilverTotal: 108,159 (51%)
BronzeTotal: 72,669 (35%)
CatastrophicTotal: 3,250 (2%)
209,812
GoldTotal: 25,734 (12%)
QHP Enrollees
By Metal Level
*Chose not to apply for tax credit. lBronze Plans cover 60% of the cost of essential health benefits, while the patient pays 40% ; lSilver Plans cover 70%, while the patient pays 30%; lGold Plans cover 80%, while the patient pays 20%; lCatastrophic Plans are type of health care plan only available through Washington Healthplanfinder for certain populations, such as individuals under age 30. This type of plan generally offers the least coverage. Tax credits and cost sharing reductions cannot be used to purchase a catastrophic plan.
0
10K
20K
30K
40K
50K
By Percent of Federal Poverty Level (FPL)
By FPL/Metal Level
2
<100% 100%-138% 139%-150% 151%-200% 201%-250% 251%-300% 301%-400% >400% Other* 7,387....................... 3,843 ......................15,586 .....................42,857 .....................28,225 .....................19,521 .................... 26,069 .................... 21,732 .....................44,592 199 ...........................66........................... 341......................... 1,449 .......................3,426 ......................3,064 .......................4,169 .......................3,726 .......................9,294 6,610 ....................... 3,543 ......................13,582 .....................34,262 ..................... 15,669 .....................6,946 ...................... 8,709 .......................6,402 ......................12,436 512 ..........................224 ........................1,603 ....................... 6,952 ....................... 8,881 ......................9,020 ......................12,501 ......................11,017 ......................21,959 66 ............................ 10 ............................ 60 ........................... 194 ..........................249 ..........................491 ..........................690 ..........................587.......................... 903
TOTAL:
<100%Total: 7,387 (4%)
139%-150%Total: 15,586 (8%)
151%-200%Total: 42,857 (20%)
201%-250%Total: 28,225 (14%)
OtherTotal: 44,592 (21%)
>400%Total: 21,732 (10%)
301%-400%Total: 26,069 (12%)251%-300%Total: 19,521 (9%)
209,812
100%-138%Total: 3,843 (2%)
Total GoldSilverBronzeCatastrophic
Washington Health Benefit ExchangeEnrollment Report
OE5
7,387
3,843
15,586
42,857
28,225
19,521
26,069
21,732
44,592
*Chose not to apply for tax credit.
*

TOTAL:
New Non-SubsidizedTotal: 35,458 (50%)
NewSubsidizedTotal: 35,384 (50%)
70,842
New QHP Enrollees
Total New
* Washington Apple Health is comprised of Medicaid MAGI (1,454,392) and CHIP (61,586) enrollees through Jan. 2018.
QHP - Non-Subsidized: Includes individuals who selected a qualified health plan that either did not qualify for a tax credit or did not apply for financial help.
QHP - Subsidized: Includes individuals who have selected a qualified health plan and are eligible for a tax credit to lower their monthly premiums.
All subsidized counts now include all individuals eligible for APTC.
0
5K
10K
15K
20K
25K
30K
By FPL Level
By Metal/FPL Level
3
<100% 100%-138% 139%-150% 151%-200% 201%-250% 251%-300% 301%-400% >400% Other* 2,469 .......................1,125 ...................... 4,330 ......................11,796 ...................... 7,130 ......................4,825 .......................6,916 ....................... 6,810 ......................25,449 79 ............................ 21 ............................117 ...........................479 ......................... 1,117 ....................... 1,004 ....................... 1,417 ....................... 1,444 .......................5,933 2,170 ........................1,037 ...................... 3,649 ...................... 8,862 .......................3,247 .......................1,133........................1,650 ....................... 1,664 .......................6,808 186 ...........................62...........................533 ........................ 2,368 .......................2,670 ......................2,487 ...................... 3,555 .......................3,458 ...................... 12,188 34 ............................. 5 ............................. 31 .............................87 ............................ 96 ........................... 201 ..........................294 ..........................244 ......................... 520
TOTAL:
<100%Total: 2,469 (3%)
139%-150%Total: 4,330 (6%)
151%-200%Total: 11,796 (17%)
201%-250%Total: 7,130 (10%)
Other*Total: 25,443 (36%)
>400%Total: 6,808 (10%)
301%-400%Total: 6,916 (10%)
70,842
100%-138%Total: 1,125 (2%)
251%-300%Total: 4,825 (7%)
Total GoldSilverBronzeCatastrophic
Washington Health Benefit ExchangeEnrollment Report
OE5
2,4691,125
4,330
11,796
7,130
4,825
6,916 6,810
25,449
*Chose not to apply for tax credit.
*Chose not to apply for tax credit.

<100%
0 5K 10K 15K 20K 25K 30K 35K
100%-138%
139%-150%
151%-200%
201%-250%
251%-300%
301%-400%
>400%
No APTC
10,8929,41229,96730,60920,18220,163
13,97213,52818,22216,88714,03411,65418,39923,436
2018 2017
4,7464,9872,5932,331
Dec. 2017 QHP Enrollees:Total: 167,101
Did not renew:Total: 34,094 (20%)
Renewals:Total: 133,007 (80%)
Paid till Feb. 2018:Total: 214,963
QHP Renewals
Movement by Carrier
Renewals By FPL
Washington Health Benefit ExchangeEnrollment Report
OE5
4
Movement by Metal Levels
2017 Renewals:38,746
Remained With MetalTotal: 28,379 (73%)
2017 Renewals:82,696
Remained With MetalTotal: 65,255 (79%)
2017 Renewals:10,588
Remained With MetalTotal: 8,017 (76%)
Bronze Silver GOLD
Coordinated CareContinued coverage with the carrier:Total: 25,748 (91%)
2017 Enrollees: 28,363
Kaiser Permanente WAContinued coverage with the carrier:Total: 28,816 (96%)
2017 Enrollees: 29,997
Kaiser NorthwestContinued coverage with the carrier:Total: 4,925 (99%)
20177 Enrollees: 4,954
LifeWiseContinued coverage with the carrier:Total: 6,153 (43%)
2017 Enrollees: 14,389
MolinaContinued coverage with the carrier:Total: 16,194 (52%)
2017 Enrollees: 31,277
PremeraContinued coverage with the carrier:Total: 10,771 (71%)
2017 Enrollees: 15,148
Other*
*Chose not to apply for tax credit.

TOTAL:
Non-PaymentTotal: 28,268 (46%)
62,006
Voluntary Total: 33,738 (54%)
QHP Disenrollment
2017 Disenrollment By Metal Level
Washington Health Benefit ExchangeEnrollment Report
OE5
5
TOTAL:
Gold Total: 4,988 (8%)
BronzeTotal: 20,907 (34%)
62,006
SilverTotal: 35,108 (57%)
CatastrophicTotal: 1,003 (2%)
By FPL/Metal Level
0
3K
6K
9K
12K
15K
<100% 100%-138% 139%-150% 151%-200% 201%-250% 251%-300% 301%-400% >400% Other* 1,864 ......................... 817 ........................ 3,439 ......................11,895 ..................... 9,048.......................6,444 ...................... 7,784 ....................... 7,419 ...................... 13,296 61 ............................. 10 ............................ 48 ...........................294 .........................553 ..........................538 ......................... 713 ...........................908......................... 1,863 1,518 ..........................711 ........................ 2,935.......................9,349 ...................... 5,734 .......................2,866 .......................3,173 ....................... 2,981 ....................... 5,841 271............................93........................... 441 ........................ 2,192 ...................... 2,653 .......................2,849 ...................... 3,672 .......................3,362 .......................5,374 14 .............................. 3 ............................. 15 .............................60 ........................... 108 ........................... 191 ..........................226 .......................... 168 ...........................218
Total Gold SilverBronzeCatastrophic
1,864
817
3,439
11,895
9,048
6,444
7,7847,419
13,296
*Chose not to apply for tax credit.
Notes: Includes 2017 enrollees whose coverage ended before Dec. 2017. Excludes enrollees who moved to Medicaid (17,703) or reported other changes impacting their eligibility.

Enrollees by County
QHP by County
12,666
18,257
848
3,243
8,790
3,402
21,122
81,525
6,263
1,483
331
3,458
1,257
1,118 88
64
418
1,415
2,617
1,069
162
1,157
373
1,002
1,789
351 12,457
356807
2,929
1,834
1,741 1,375
962,325
711
1,260
2,470
7,173
KING .................................. 81,525
SNOHOMISH ................. 21,122
PIERCE............................... 18,257
CLARK ............................... 12,666
SPOKANE ........................ 12,457
WHATCOM ......................... 8,790
KITSAP ................................. 7,173
THURSTON ........................ 6,263
BENTON .............................. 3,458
SKAGIT ................................. 3,402
Top 10
6
10,000+ Enrollees (5 Counties)
2,000 - 9,999 Enrollees (10 Counties)
1,000 - 1,999 Enrollees (12 Counties)
1 - 999 Enrollees (12 Counties)
Washington Apple Health by County
96,3164,990
KING ................................. 329,903
PIERCE.............................. 186,091
SNOHOMISH ................ 136,284
SPOKANE ........................ 131,174
CLARK .............................. 100,182
YAKIMA ............................. 95,965
THURSTON ...................... 54,646
BENTON ............................ 49,438
WHATCOM ....................... 45,698
KITSAP ............................... 43,204
Top 10
*Washington Apple Health enrollees consist of Medicaid MAGI (1,454,392) and CHIP (61,586). A total of 606 Washington Apple Health enrollees listed “Other” under county, while 209 enrollees listed “Border” under county.
100,000+ Enrollees (5 Counties)
30,000 - 99,999 Enrollees (7 Counties)
10,000 - 29,999 Enrollees (12 Counties) 1 - 9,999 Enrollees (15 Counties)
100,182
186,091
5,311
95,965
45,698
29,935
136,284
329,903
54,646
21,967
1,931
49,438 30,741
13,901 920
506
5,282
13,919
20,785
8,298
1,96311,677
3,511
11,100
31,260
2,646 131,174
8,649 7,006
17,434
6,021
21,061 15,245
914 29,845
5,353
3,059
12,335
43,204
Washington Health Benefit ExchangeEnrollment Report
OE5

TOTAL:
Toddler 1-5Total: 4,097 (24%)
Adolescent 13-18Total: 5,918 (35%)
16,909
Infant <1Total: 608 (4%)
School Age 6-12Total: 6,286 (37%)
TOTAL: Not ProvidedTotal: 74,074 (35%)
AsianTotal: 21,864 (10%)African AmericanTotal: 3,302 (1%)
OtherTotal: 5,682 (3%)
WhiteTotal: 100,061 (48%)
209,802
American IndianTotal: 1,219 (1%)
Pacific IslanderTotal: 3,456 (2%)
QHP Enrollees Data Washington Health Benefit ExchangeEnrollment Report
OE5
Age Under 19
Race/Ethnicity
Gender
U.S. Citizenship
7
TOTAL: 35-44Total: 35,218 (17%)
55-64Total: 65,200 (31%)
45-54Total: 40,789 (19%)
26-34Total: 34,567 (16%)
<18Total: 15,965 (8%)
209,802
65+Total: 2,193 (1%)
18-25Total: 15,870 (8%)
TOTAL:
FemaleTotal: 114,846 (55%)
MaleTotal: 94,956 (45%)
209,802
TOTAL:
Lawfully Present Total: 27,148 (13%)
CitizenTotal: 182,654 (87%)
209,802
10,005 marked “Hispanic” with their ethnicity, while 145,504 did not declare.
Hawaiian:Total: 144
Note: Additional FPL data available online.
/Alaska Native
By Carrier
Coordinated CareTotal: 54,516 (26%)Kaiser NorthwestTotal: 9,800 (5%)Kaiser Permanente WATotal: 73,289 (35%)LifeWiseTotal: 12,895 (6%)MolinaTotal: 25,437 (12%)PremeraTotal: 33,297 (16%)BridgeSpanTotal: 568
TOTAL:209,802
*Reporting race/ethnicity is not required

0
2K
4K
6K
8K
10K
Lorem ipsum
Language Data Washington Health Benefit ExchangeEnrollment Report
OE5
Top Language Requests By Washington Healthplanfinder Applicants
8
Limited English Proficient Applicants Spanish Language
TOTAL: 117,469
QHPsTotal: 11,001 (9%)
WA Apple HealthTotal: 106,468 (91%)
Chinese Vietnamese Russian Korean Arabic Somali 3,952 ..... 3,662 2,895 ............ 2,671 1,084 .............. 995 916 .................855 107 ............... 103 19 ................. 173 5,023 ..... 4,776 5,782 ............ 5,619 4,243 ............4,189 1,786 ............. 1,724 1,357.............1,425 1,032 ..............976 8,975 ..... 8,438 8,677 ............ 8,290 5,327.............5,184 2,702 .............2,579 1,464 ............1,528 1,051 .............1,149
QHPWAHTotal
*WAH: Washington Apple Health
Note: Excludes Spanish, the top language requested (see above). Includes applicants as of Feb 2018 who indicated in Washington Healthplanfinder they do not speak and/or read English and requested an interpreter or translation.
Spanish Language Requests By Washington Healthplanfinder
Applicants
Interpreter QHP ............. 3,789 (5%)WAH ......... 70,708 (95%)TOTAL ................ 74,497
TranslationQHP ............. 3,672 (5%)WAH ......... 71,664 (95%)TOTAL ................ 75,336
Interpreter
QHP
Washington Apple Health
QHP
Washington Apple Health
Translation
Note: Includes applicants as of February 2018 who indicated in Washington Healthplanfinder they do not speak and/or read English.

Language Data Washington Health Benefit ExchangeEnrollment Report
OE5
Top Language Requests Through Telephonic Interpretation Services
Customer Service
9
Spanish ........... 26,011
Vietnamese ....... 6,169
Russian .............. 4,695
Madarin ............ 1,727
Korean ................. 722
Cambodian.......... 143
Somali .................. 125
Laotian ................... 48
NON-ENGLISH CALLS ANSWERED
Language Count
Note: Includes calls answered by bilingual and multilingual Customer Service Representatives (CSRs) at the Washington Healthplanfinder Customer Support Center from Oct. 2017 - Feb. 2018. Additional language data provided online.
0 300 600 900 1200 1500
Note: Includes total calls from Oct. 2017 - Jan. 2018. Telephonic interpretation services in over 175 languages are available to Exchange staff and the Customer Support Center through Language Line Solutions. Additional language data provided online.
Language Count Language Count Language Count
VIETNAMESE 1,375
SPANISH 497
MANDARIN 363
ARABIC 323
SOMALI 276
KOREAN 225
RUSSIAN 218
FARSI 215
AMHARIC 187
PUNJABI 146

Dental Enrollees Washington Health Benefit ExchangeEnrollment Report
OE5
10
By Plan Type QHP with Dental
By Age By Gender
By Carrier Delta Dental of Washington ..........................................28,085 Dentegra Insurance Company ........................................ 4,009 Premera Blue Cross .................................................................947 KaiserNorthwest .......................................................................153 LifeWise Health Plan of Washington ................................130 Total ........................................................................................33,324
TOTAL: Family DentalTotal: 31,894 (96%)33,324
Pediatric DentalTotal: 1,430 (4%)
TOTAL:209,802
Enrolled in QHPand also in QDPTotal: 31,342 (15%)
TOTAL:
FemaleTotal: 17,973 (54%)
MaleTotal: 15,351 (46%)
33,324TOTAL:
65+Total: 258
18-25Total: 2,391 (7%)
26-34Total: 5,803 (17%)35-44Total: 5,250 (16%)
55-64Total: 7,249 (22%)
33,324
<18Total: 6,686 (20%)
45-54Total: 5,687 (17%)

0
200K
400K
600K
800K
1M
1.2M
TOTAL: 65+Total: 505
18-25Total: 187,669 (12%)26-34Total: 213,417 (14%)
35-44Total: 153,137 (8%)
55-64Total: 93682 (6%)
1,515,978
<18Total: 752,373 (50%)
45-54Total: 115,195 (8%)
WA Apple Health Enrollees Washington Health Benefit ExchangeEnrollment Report
OE5
11
Age Under 19
Race/Ethnicity Medicaid Plan Selection
TOTAL:
Coordinated CareTotal: 31,520 (9%)
Amerigroup Washington IncTotal: 32,725 (9%)
United HealthCareTotal: 60,993 (17%)
351,811
CHPWTotal: 56,253 (16%)
MolinaTotal: 170,320 (49%)
TOTAL:
Toddler 1-5Total: 224,552 (29%)
Adolescent 13-18Total: 214,490 (27%)
785,694
Infant <1Total: 41,854 (5%)
School Age 6-12Total: 304,798 (39%)
Hawaiian:Total: 3,883
By FPL
TOTAL: Not ProvidedTotal: 142,762 (9%)
AsianTotal: 69,515 (5%)African AmericanTotal: 118,570 (8%)
OtherTotal: 225,243 (15%)
WhiteTotal: 854,779 (56%)
1,515,978
American IndianTotal: 56,487 (4%)
Pacific IslanderTotal: 44,739 (3%)
FPL CHIP MAGI Total <100% ...........3,223 ......... 1,092,716 ........ 1,095,939 100-138% .....707 ............ 228,465 ................229,172 139-150% .....175 ............ 28,724 .................... 28,899 151-200% .....482 ............ 80,914 .................... 81,396 201-250% .....29,541 ...... 18,064 .................... 47,605 251-300% .....22,233 ...... 3,275 ....................... 25,508 301-400% .....4,884 ......... 1,564 ..........................6,448 >400% ...........341 ............ 670 .............................1,011 Total ................61,586 ...... 1,454,392 ....... 1,515,978
<100% 100%-138% 139%-150% 151%-200% 201%-250% 251%-300% 301%-400% >400%
341,364 marked “Hispanic” with their ethnicity, while 345,860 did not declare.
Medicaid MAGI CHIP
/Alaska Native

TOTAL:
Changes in household sizeTotal: 57 (2%)
Loss of MECTotal: 1,912 (59%) 3,323
OtherTotal: 119 (4%)
Change in program eligibilityTotal: 914 (28%)
Change in residence Total: 221 (7%)
Additional Data Washington Health Benefit ExchangeEnrollment Report
OE5
12
Special Enrollment Period (SEP)
QHP - WA APPLE HEALTH
March 1, 2017 - Feb. 1, 2018 Avg. Monthly Churn Percentage:
0.846%
Avg. Monthly Churn Total:1,549
Highest Month Churn Percentage: Dec. 1, 2017 - 2.37%
Highest Month Churn Total: Dec. 1, 2017 - 3,987
QHP – Medicaid: Enrollees who were enrolled in a QHP in a given month and the next month they are enrolled in Medicaid. Percentage is calculated by dividing the total number of enrollees who moved to Medicaid by the total number of QHP enrollees the previous month.
WA APPLE HEALTH - QHP
March 1, 2017 - Feb. 1, 2018 Avg. Monthly Churn Percentage:
0.13%
Avg. Monthly Churn Total:2,175
Highest Month Churn Percentage: Jan. 1, 2018 - 0.32%
Highest Month Churn Total: Jan. 1, 2018 - 4,887
Medicaid – QHP: Enrollees who were enrolled in Medicaid in a given month and the next month they are enrolled in QHP. Percentage is calculated by dividing the total number of enrollees who moved to QHP by the total number of Medicaid enrollees the previous month.
Churn
There are special circumstances that trigger a special enrollment period for an individual or a family outside of open enrollment.
These exceptions include, but are not limited to: loss of minimum essential health coverage (MEC); changes in household size (e.g., marriage, death, birth, or adoption); change in program eligibility (e.g., change in income); and change in residence (e.g., moved to WA). Enrollment is offered year-round for Washington Apple Health, SHOP, and American Indians and Alaska Natives.
Data shows total SEP enrollments during February 2018
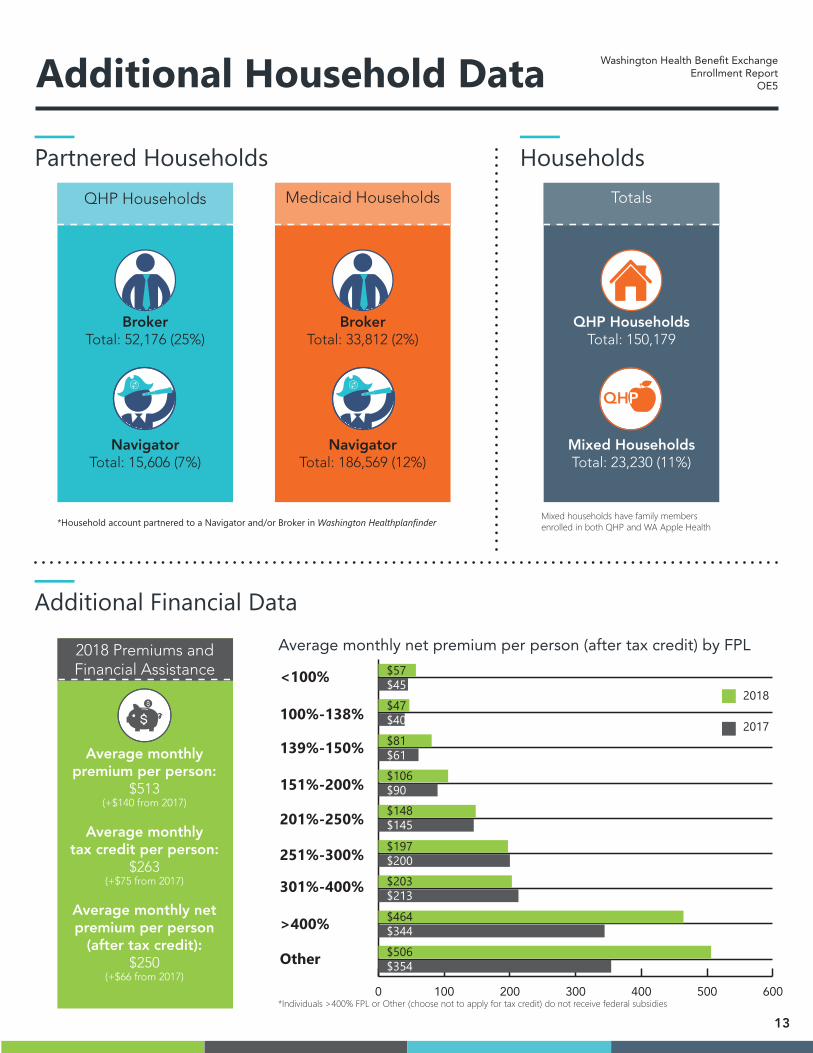
Additional Household Data Washington Health Benefit ExchangeEnrollment Report
OE5
Partnered Households HouseholdsTotals
QHP Households Total: 150,179
Mixed Households Total: 23,230 (11%)
QHP
Mixed households have family members enrolled in both QHP and WA Apple Health
Additional Financial Data
Average monthly premium per person:
$513(+$140 from 2017)
Average monthly tax credit per person:
$263(+$75 from 2017)
Average monthly net premium per person
(after tax credit): $250
(+$66 from 2017)
Medicaid HouseholdsQHP Households
Broker Total: 52,176 (25%)
Navigator Total: 15,606 (7%)
Broker Total: 33,812 (2%)
Navigator Total: 186,569 (12%)
13
*Household account partnered to a Navigator and/or Broker in Washington Healthplanfinder
2018 Premiums and Financial Assistance <100%
0 100 200 300 400 500 600
100%-138%
139%-150%
151%-200%
201%-250%
251%-300%
301%-400%
>400%
Other
$81$61$106$90$148$145
$197$200$203$213$464$344$506$354
2018
$57$45$47$40 2017
Average monthly net premium per person (after tax credit) by FPL
*Individuals >400% FPL or Other (choose not to apply for tax credit) do not receive federal subsidies