WASHINGTON AVENUE TOWNHOMES PROJECT ... - City of Orange
98
WASHINGTON AVENUE TOWNHOMES PROJECT FOCUSED TRAFFIC ANALYSIS (REVISED) February 25, 2014 F-1
Transcript of WASHINGTON AVENUE TOWNHOMES PROJECT ... - City of Orange

��������� ���������������������������������������������������� ������������������ ������ ��������������������� ������!��"�� �!#�� �������$ ���#�%������� ��" �
WASHINGTON AVENUE TOWNHOMES PROJECT
FOCUSED TRAFFIC ANALYSIS (REVISED)
February 25, 2014
F-1

KKuunnzzmmaann AAssssoocciiaatteess,, IInncc..
WASHINGTON AVENUE TOWNHOMES PROJECT
FOCUSED TRAFFIC ANALYSIS (REVISED)
February 25, 2014
Prepared by:
Chris Pylant, INCE Bryan Crawford
Carl Ballard, LEED GA William Kunzman, P.E.
1111 Town & Country Road, Suite 34 Orange, California 92868
(714) 973‐8383
www.traffic‐engineer.com 5574a
F-2

Table of Contents
I. Findings ............................................................................................................................. 2
A. Existing Traffic Conditions ................................................................................................ 2 B. Traffic Impacts ................................................................................................................. 2 C. Mitigation Measures ........................................................................................................ 3
II. Congestion Management Program Methodology ............................................................... 4 A. County Congestion Management Program ..................................................................... 4 B. Prescribed Methodology for a Traffic Impact Analysis .................................................... 5 C. Mitigation Measures ........................................................................................................ 6
III. Project Description ............................................................................................................ 7 A. Location ............................................................................................................................ 7 B. Proposed Development ................................................................................................... 7
IV. Existing Traffic Conditions ................................................................................................ 10 A. Surrounding Street System ............................................................................................ 10 B. Existing Travel Lanes and Intersection Controls ............................................................ 10 C. Existing Average Daily Traffic Volumes .......................................................................... 10 D. Existing Levels of Service ................................................................................................ 11 E. Existing General Plan Circulation Element ..................................................................... 11 F. Transit Service ................................................................................................................ 11
V. Project Traffic .................................................................................................................. 20 A. Trip Generation .............................................................................................................. 20 B. Trip Distribution ............................................................................................................. 20 C. Trip Assignment ............................................................................................................. 20 D. Modal Split ..................................................................................................................... 21
VI. Existing Plus Project Traffic Conditions ............................................................................. 27 A. Method of Projection ..................................................................................................... 27 B. Existing Plus Project Average Daily Traffic Volumes ...................................................... 27 C. Existing Plus Project Levels of Service ............................................................................ 27
VII. Opening Year (2016) Traffic Conditions ............................................................................ 33 A. Method of Projection ..................................................................................................... 33 B. Opening Year (2016) Average Daily Traffic Volumes ..................................................... 33 C. Opening Year (2016) Intersection Levels of Service ...................................................... 33
VIII. Recommendations ........................................................................................................... 44 A. Site Access ...................................................................................................................... 44 B. Roadway Improvements ................................................................................................ 44
APPENDICES Appendix A – Glossary of Transportation Terms Appendix B – Traffic Count Worksheets Appendix C – Explanation and Calculation of Intersection Capacity Utilization/Delay
F-3

List of Tables
Table 1. Existing Roadway Segment Average Daily Traffic Volumes ........................................... 12 Table 2. Existing Intersection Levels of Service ........................................................................... 13 Table 3. Project Trip Generation ................................................................................................. 22 Table 4. Existing Plus Project Roadway Segment Average Daily Traffic Volumes ....................... 28 Table 5. Existing Plus Project Intersection Levels of Service ....................................................... 29 Table 6. Opening Year (2016) Roadway Segment Average Daily Traffic Volumes ...................... 35 Table 7. Opening Year (2016) Without Project Intersection Levels of Service ............................ 36 Table 8. Opening Year (2016) With Project Intersection Levels of Service ................................. 37
F-4

List of Figures
Figure 1. Project Location Map ....................................................................................................... 8 Figure 2. Site Plan ........................................................................................................................... 9 Figure 3. Existing Through Travel Lanes and Intersection Controls .............................................. 14 Figure 4. Existing Average Daily Traffic Volumes .......................................................................... 15 Figure 5. Existing Morning Peak Hour Intersection Turning Movement Volumes ....................... 16 Figure 6. Existing Evening Peak Hour Intersection Turning Movement Volumes ........................ 17 Figure 7. Orange County Master Plan of Arterial Highways ......................................................... 18 Figure 8. City of Orange General Plan Roadway Cross-Sections ................................................... 19 Figure 9. Project Trip Distribution ................................................................................................. 23 Figure 10. Project Average Daily Traffic Volumes ........................................................................... 24 Figure 11. Project Morning Peak Hour Intersection Turning Movement Volumes ........................ 25 Figure 12. Project Evening Peak Hour Intersection Turning Movement Volumes ......................... 26 Figure 13. Existing Plus Project Average Daily Traffic Volumes ...................................................... 30 Figure 14. Existing Plus Project Morning Peak Hour Intersection Turning Movement
Volumes ......................................................................................................................... 31 Figure 15. Existing Plus Project Evening Peak Hour Intersection Turning Movement
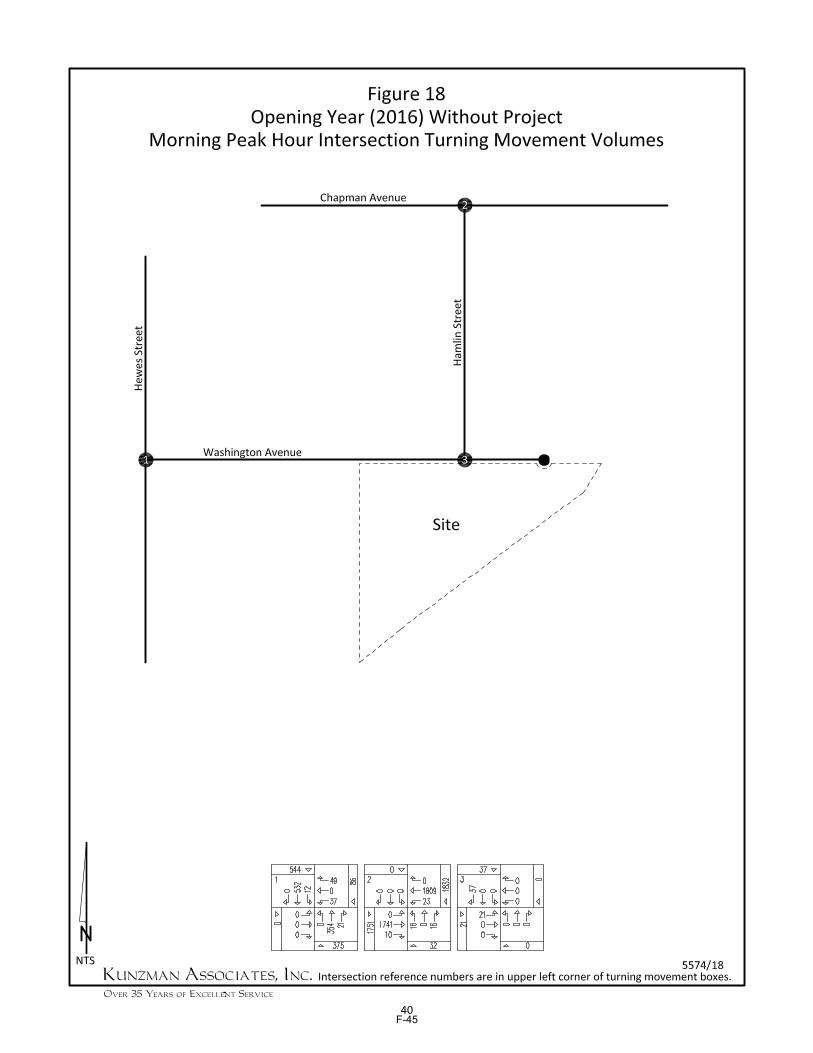
Volumes ......................................................................................................................... 32 Figure 16. Opening Year (2016) Without Project Project Average Daily Traffic
Volumes ......................................................................................................................... 38 Figure 17. Opening Year (2016) With Project Average Daily Traffic Volumes ................................ 39 Figure 18. Opening Year (2016) Without Project Project Morning Peak Hour
Intersection Turning Movement Volumes ..................................................................... 40 Figure 19. Opening Year (2016) Without Project Evening Peak Hour Intersection
Turning Movement Volumes ......................................................................................... 41 Figure 20. Opening Year (2016) With Project Morning Peak Hour Intersection
Turning Movement Volumes ......................................................................................... 42 Figure 21. Opening Year (2016) With Project Evening Peak Hour Intersection Turning
Movement Volumes ....................................................................................................... 43 Figure 22. Circulation Recommendations ....................................................................................... 45
F-5

Washington Avenue Townhomes Project
Focused Traffic Analysis
This report contains the focused traffic analysis for the Washington Avenue Townhomes project. The project site is located south of Hamlin Street adjacent to Washington Avenue in the City of Orange. The approximately 4 acre project site is proposed to be developed with 58 townhome dwelling units. The traffic report contains documentation of existing traffic conditions, trips generated by the project, distribution of the project traffic to roads outside the project, and an analysis of future traffic conditions. Each of these topics is contained in a separate section of the report. The first section is “Findings”, and subsequent sections expand upon the findings. In this way, information on any particular aspect of the study can be easily located by the reader. Although this is a technical report, every effort has been made to write the report clearly and concisely. To assist the reader with those terms unique to transportation engineering, a glossary of terms is provided within Appendix A.
F-6

2
I. Findings
This section summarizes the existing traffic conditions, project traffic impacts, and the proposed mitigation measures. A. Existing Traffic Conditions
1. The project site is currently vacant and not generating significant traffic.
2. The study area includes the following intersections:
Hewes Street (NS) at:
Washington Avenue (EW) - #1 Hamlin Street (NS) at:
Chapman Avenue (EW) - #2 Hamlin Street/Project Access (NS) at:
Washington Avenue (EW) - #3
3. The study area intersections currently operate within acceptable Levels of Service during the peak hours for Existing traffic conditions.
B. Traffic Impacts
1. The approximately 4 acre project site is proposed to be developed with 58 townhome dwelling units. The project site will have access to Hamlin Street and Washington Avenue.
2. The proposed development is projected to generate approximately 337 daily vehicle trips, 25 of which will occur during the morning peak hour and 30 of which will occur during the evening peak hour.
4. The study area intersections are projected to operate within acceptable Levels of Service during the peak hours for Existing Plus Project traffic conditions.
5. The study area intersections are projected to operate within acceptable Levels of Service during the peak hours for Opening Year (2016) Without Project traffic conditions.
6. The study area intersections are projected to operate within acceptable Levels of Service during the peak hours for Opening Year (2016) With Project traffic conditions.
F-7

3
C. Mitigation Measures The following measures are recommended to mitigate the impact of the project on traffic circulation: 1. Site-specific circulation and access recommendations are depicted on Figure 22.
2. Construct Washington Avenue from the west project boundary to its eastern terminus
at its ultimate half-section width including landscaping and parkway improvements in conjunction with development.
3. Sufficient on-site parking shall be provided to meet City of Orange parking code requirements.
4. On-site traffic signing and striping should be implemented in conjunction with detailed construction plans for the project.
5. Sight distance at the project access should be reviewed with respect to California Department of Transportation/City of Orange standards in conjunction with the preparation of final grading, landscaping, and street improvement plans.
6. As is the case for any roadway design, the City of Orange should periodically review traffic operations in the vicinity of the project once the project is constructed to assure that the traffic operations are satisfactory.
F-8

4
II. Congestion Management Program Methodology
This section discusses the County Congestion Management Program. The purpose, prescribed methodology, and definition of a significant traffic impact are discussed. A. County Congestion Management Program
The Congestion Management Program is a result of Proposition 111 which was a statewide initiative approved by the voters in June, 1990. The proposition allowed for a nine cent per gallon State gasoline tax increase over a five year period. Proposition 111 explicitly stated that the new gas tax revenues were to be used to fix existing traffic problems and was not to be used to promote future development. For a City to get its share of the Proposition 111 gas tax, it has to follow certain procedures specified by the State Legislature. The legislation requires that a traffic impact analysis be prepared for new development. The traffic impact analysis is prepared to monitor and fix traffic problems caused by new development. The Legislature requires that adjacent jurisdictions use a standard methodology for conducting a traffic impact analysis. To assure that adjacent jurisdictions use a standard methodology in preparing traffic impact analyses, one common procedure is that all Cities within a County, and the County agency itself, adopt and use one standard methodology for conducting traffic impact analyses. Although each County has developed standards for preparing traffic impact analyses, traffic impact analysis requirements do vary in detail from one County to another, but not in overall intent or concept. The general approach selected by each County for conducting traffic impact analyses has common elements. The general approach for conducting a traffic impact analysis is that existing weekday peak hour traffic is counted and the percent of roadway capacity currently used is determined. Then the project traffic is added and the percent of roadway capacity used is again determined. If the new project adds traffic to an overcrowded facility, then the new project has to mitigate the traffic impact so that the facility operates at a level which is no worse than before the project traffic was added. If the project size is below a certain minimum threshold level, then a project does not have to have a traffic impact analysis prepared, once it is shown or agreed that the project is below the minimum threshold. In Orange County a project needs a traffic impact analysis if it generates more than 200 daily trips. If a project is bigger than the minimum threshold size, then a traffic impact analysis is required.
F-9
5
B. Prescribed Methodology for a Traffic Impact Analysis The traffic impact analysis must include all monitored intersections to which the project adds traffic above a certain minimum amount. In the City of Orange, the monitored intersections are all arterial to arterial intersections. In the City of Orange, the following is the minimum traffic impact that is required before an intersection has to be analyzed: "Intersections and roadway segments where capacity analysis will be required. As a minimum, intersections where the project will add 51 or more trips during either the AM or PM peak hours will need to be analyzed. This threshold may be reduced, at the discretion of the City Traffic Engineer, for intersections that are projected to or currently operate at Level of Service "E" or "F"." In the City of Orange, mitigation is required if: "A transportation impact on an intersection shall be deemed "significant" and require mitigation under CEQA in accordance with the following table:
Level of Service Final V/C Ratio Project‐Related Increase in V/C E,F >0.900 Equal or Greater Than 0.010
For purposes of this calculation, the "Final V/C Ratio" shall mean the future V/C ratio at an intersection considering impacts with Project, Ambient Growth, and Approved and Pending Projects but without any proposed mitigation." An intersection mitigation measure shall either fix the deficiency, or reduce the Intersection Capacity Utilization so that it is below the level which occurs without the project. In the City of Orange, the technique used to calculate Intersection Capacity Utilization for a signalized intersection is as follows. Lane capacity is 1,700 vehicles per lane per hour of green time for through and turn lanes. A total yellow clearance time of 5 percent is added. The technique used to assess the capacity needs of an unsignalized intersection is known as the Intersection Delay Method (see Appendix C). To calculate delay, the volume of traffic using the intersection is compared with the capacity of the intersection. Project traffic is generated using rates and procedures contained in the Institute of Transportation Engineers, Trip Generation, 9th Edition, 2012. To determine the trip distribution for the proposed project, peak hour traffic counts of the existing directional distribution of traffic for existing areas in the vicinity of the site, and other additional information on future development and traffic impacts in the area were reviewed. The Traffic Impact Analysis has to be prepared by a licensed Traffic Engineer.
F-10

6
This traffic analysis has been prepared in accordance with the Traffic Impact Analysis requirements except as noted. The Traffic Impact Analysis not only examined the Congestion Management Program system of roads and intersections, but also other roads and intersections. The project generated traffic was added to intersections, and a full intersection analysis was conducted, even when the project added traffic failed to meet the minimum thresholds that require an intersection analysis.
C. Mitigation Measures If a project is large enough to require that a Traffic Impact Analysis be prepared, and if the project adds traffic to an intersection above a minimum threshold, and if the intersection is operating at above an acceptable level of operation, then the project must mitigate its traffic impact. Traffic mitigation can be in many forms including adding lanes. Lanes can sometimes be obtained through restriping or elimination of parking, and sometimes require spot roadway widening.
F-11

7
III. Project Description
This section discusses the project’s location and proposed development. Figure 1 shows the project location map and Figure 2 illustrates the site plan. A. Location
The project site is located south of Hamlin Street adjacent to Washington Avenue in the City of Orange.
B. Proposed Development The approximately 4 acre project site is proposed to be developed with 58 townhome dwelling units. The project site will have access to Hamlin Street and Washington Avenue.
F-12

F-13

F-14

10
IV. Existing Traffic Conditions
The project site is currently vacant. The traffic conditions as they exist today are discussed below and illustrated on Figures 3 to 8. A. Surrounding Street System
Study area roadways that will be utilized by the development include Hewes Street, Hamlin Street, Chapman Avenue, and Washington Avenue. Hewes Street: This north-south roadway currently is four lanes undivided in the study area. Hewes Street is currently classified as a Secondary Arterial on the City of Orange Master Plan of Street and Highways. It currently carries approximately 9,000 vehicles per day in the study area. Hamlin Street: This north-south roadway currently is two lanes undivided in the study area. Hamlin Street is currently unclassified on the City of Orange Master Plan of Street and Highways. It currently carries approximately 800 vehicles per day in the study area. Chapman Avenue: This east-west roadway currently is six lanes divided in the study area. Chapman Avenue is currently classified as a Major Arterial on the City of Orange Master Plan of Street and Highways. It currently carries approximately 41,000 vehicles per day in the study area. Washington Avenue: This east-west roadway currently is two lanes undivided in the study area. Washington Avenue is currently unclassified on the City of Orange Master Plan of Street and Highways. It currently carries approximately 700 vehicles per day in the study area.
B. Existing Travel Lanes and Intersection Controls Figure 3 identifies the existing roadway conditions for study area roadways. The number of through lanes for existing roadways and the existing intersection controls are identified.
C. Existing Average Daily Traffic Volumes Figure 4 depicts the existing average daily traffic volumes. Table 1 summarizes the existing average daily traffic volumes at the intersection of Hewes Street/Washington Avenue and Hamlin Street/Chapman Avenue during a typical weekday. The existing average daily traffic volumes were factored from traffic counts (see Appendix B) obtained by Kunzman Associates, Inc. in December 2013 and from the Annual Traffic Volume Maps by the Orange County Transportation Authority.
F-15

11
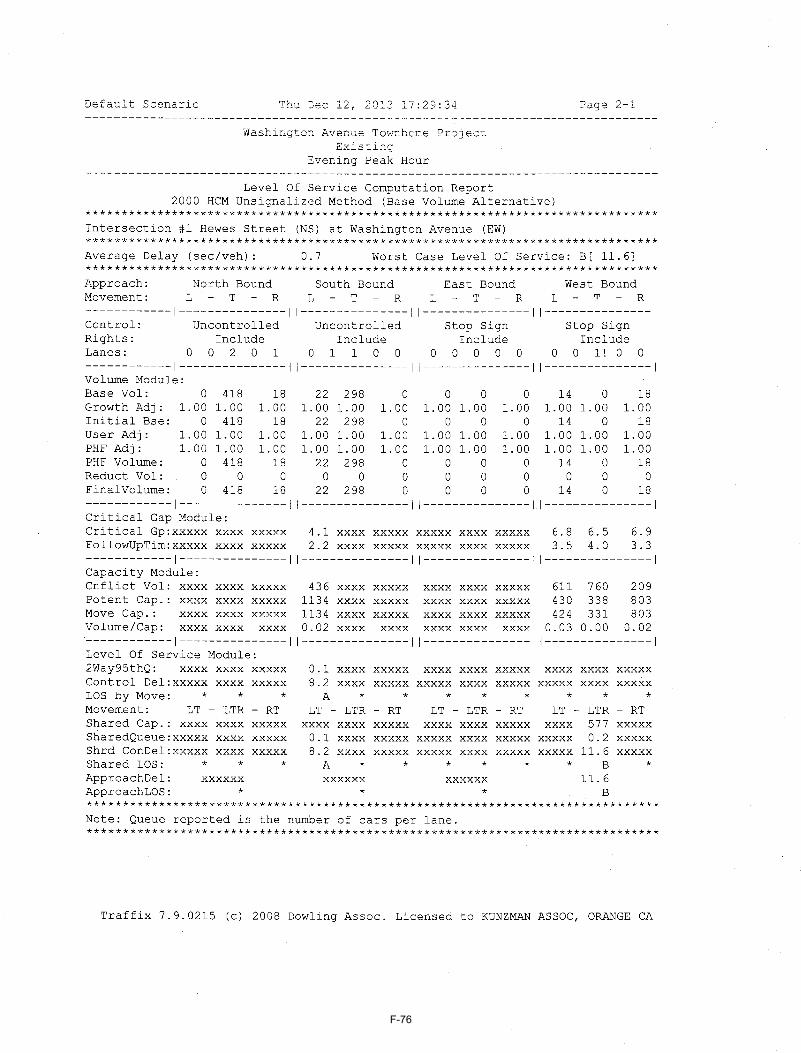
D. Existing Levels of Service The technique used to assess the operation of a signalized intersection is known as Intersection Capacity Utilization, as described in Appendix C. To calculate an Intersection Capacity Utilization value, the volume of traffic using the intersection is compared with the capacity of the intersection. An Intersection Capacity Utilization value is usually expressed as a decimal. The decimal represents that portion of the hour required to provide sufficient capacity to accommodate all intersection traffic if all approaches operate at capacity. The technique used to assess the capacity needs of an unsignalized intersection is known as the Intersection Delay Method (see Appendix C). To calculate delay, the volume of traffic using the intersection is compared with the capacity of the intersection. The Levels of Service for the existing traffic conditions have been calculated and are shown in Table 2. Existing Level of Service is based upon manual morning and evening peak hour intersection turning movement counts made for Kunzman Associates, Inc. in December 2013 (see Figures 5 and 6). Traffic count worksheets are provided in Appendix B. There are two peak hours in a weekday. The morning peak hour is between 7:00 AM and 9:00 AM, and the evening peak hour is between 4:00 PM and 6:00 PM. The actual peak hour within the two hour interval is the four consecutive 15 minute periods with the highest total volume when all movements are added together. Thus, the evening peak hour at one intersection may be 4:45 PM to 5:45 PM if those four consecutive 15 minute periods have the highest combined volume. The study area intersections currently operate within acceptable Levels of Service during the peak hours for existing traffic conditions (see Table 2). Existing Intersection Level of Service worksheets are provided in Appendix C.
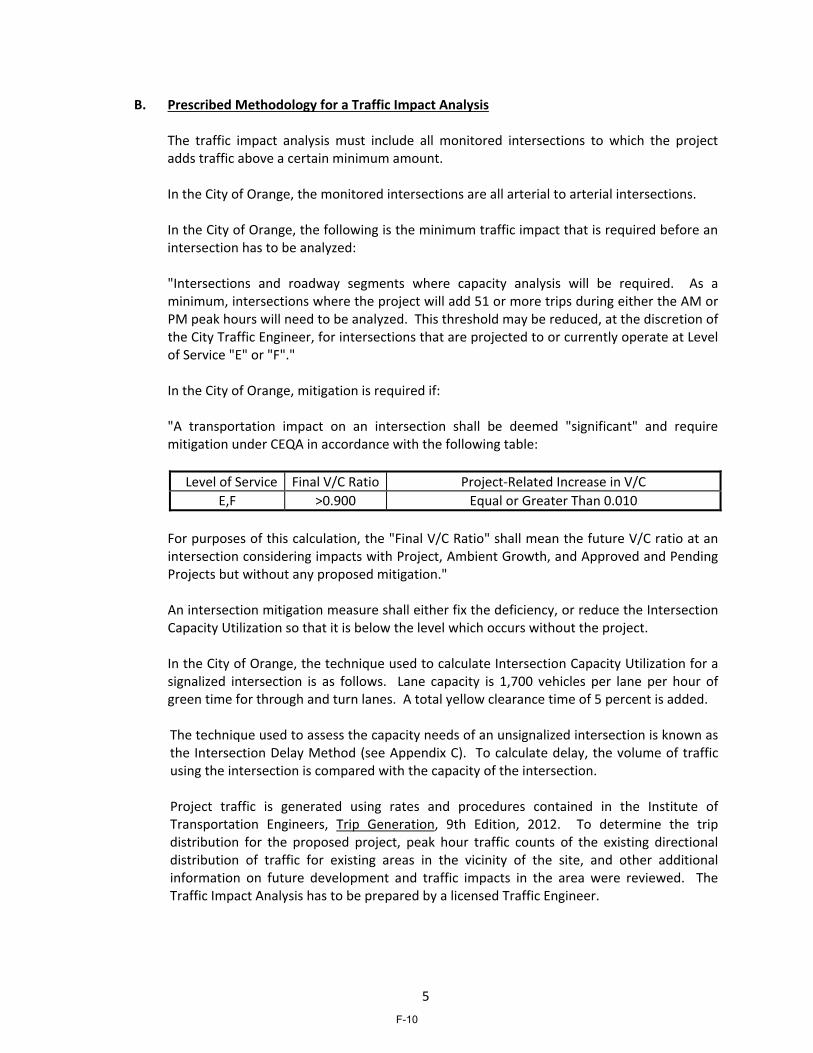
E. Existing General Plan Circulation Element Figure 7 shows the current City of Orange Master Plan of Streets and Highways. Both existing and future roadways are included in the Master Plan of Arterial Highways and are graphically depicted on Figure 7. This figure shows the nature and extent of arterial highways that are needed to adequately serve the ultimate development depicted by the land use element of the General Plan. Figure 8 illustrates the City of Orange arterial street cross-sections.
F. Transit Service Transit service is currently provided along Hewes Street by the Orange County Transportation Authority Route 167 and along Chapman Avenue by the Orange County Transportation Authority Route 54.
F-16

ExistingAverage Daily
Traffic Volumes
North 9,000South 9,000East 700West 0North 0South 800East 41,000West 41,000
Table 1
Existing Roadway Segment Average Daily Traffic Volumes
Intersection LegHewes Street (NS) at Washington Avenue (EW)
Hamlin Street (NS) at Chapman Avenue (EW)
12
F-17

TrafficControl3 L T R L T R L T R L T R Morning Evening
Hewes Street (NS) at:Washingon Avenue (EW) - #1 CSS 0 1.5 0.5 0.5 1.5 0 0 0 0 0.5 0 0.5 12.2-B 11.6-B
Chapman Avenue (EW) - #3 CSS 0.5 0 0.5 0 0 0 0 2.5 0.5 1 3 0 27.4-D 18.5-C
3 CSS = Cross Street Stop
street stop control, the delay and level of service are shown for the individual movement (or movements sharing a single lane) are shown.
Hamlin Street (NS) at:
1 When a right turn lane is designated, the lane can either be striped or unstriped. To function as a right turn lane, there must be sufficient width for right
turning vehicles to travel outside the through lanes.
L = Left; T = Through; R = Right
2 Delay and level of service has been calculated using the following analysis software: Traffix, Version 7.9.0215 (2008). Per the Highway Capacity Manual,
overall average intersection delay and level of service are shown for intersections with traffic signal or all way stop control. For intersections with cross
IntersectionNorthbound Southbound Eastbound
Existing Intersection Levels of Service
Table 2
Intersection Approach Lanes1
Delay-LOS2Peak Hour
Westbound
13
F-18

F-19

F-20

F-21

F-22

F-23
F-24

20
V. Project Traffic
The approximately 4 acre project site is proposed to be developed with 58 townhome dwelling units. The project site will have access to Hamlin Street and Washington Avenue. A. Trip Generation
The trips generated by the project are determined by multiplying an appropriate trip generation rate by the quantity of land use. Trip generation rates are predicated on the assumption that energy costs, the availability of roadway capacity, the availability of vehicles to drive, and our life styles remain similar to what we know today. A major change in these variables may affect trip generation rates. Trip generation rates were determined for average daily traffic, morning peak hour inbound and outbound traffic, and evening peak hour inbound and outbound traffic for the proposed land use. By multiplying the trip generation rates by the land use quantity, the traffic volumes are determined. Table 3 exhibits the trip generation rates, project peak hour volumes, and project average daily traffic volumes for the proposed project site. The trip generation rates are from the Institute of Transportation Engineers, Trip Generation, 9th Edition, 2012. The proposed development is projected to generate approximately 337 daily vehicle trips, 25 of which will occur during the morning peak hour and 30 of which will occur during the evening peak hour (see Table 3).
B. Trip Distribution Figure 9 contain the directional distributions of the project trips for the proposed land use. To determine the trip distribution for the proposed project, peak hour traffic counts of the existing directional distribution of traffic for existing areas in the vicinity of the site, and other additional information on future development and traffic impacts in the area were reviewed.
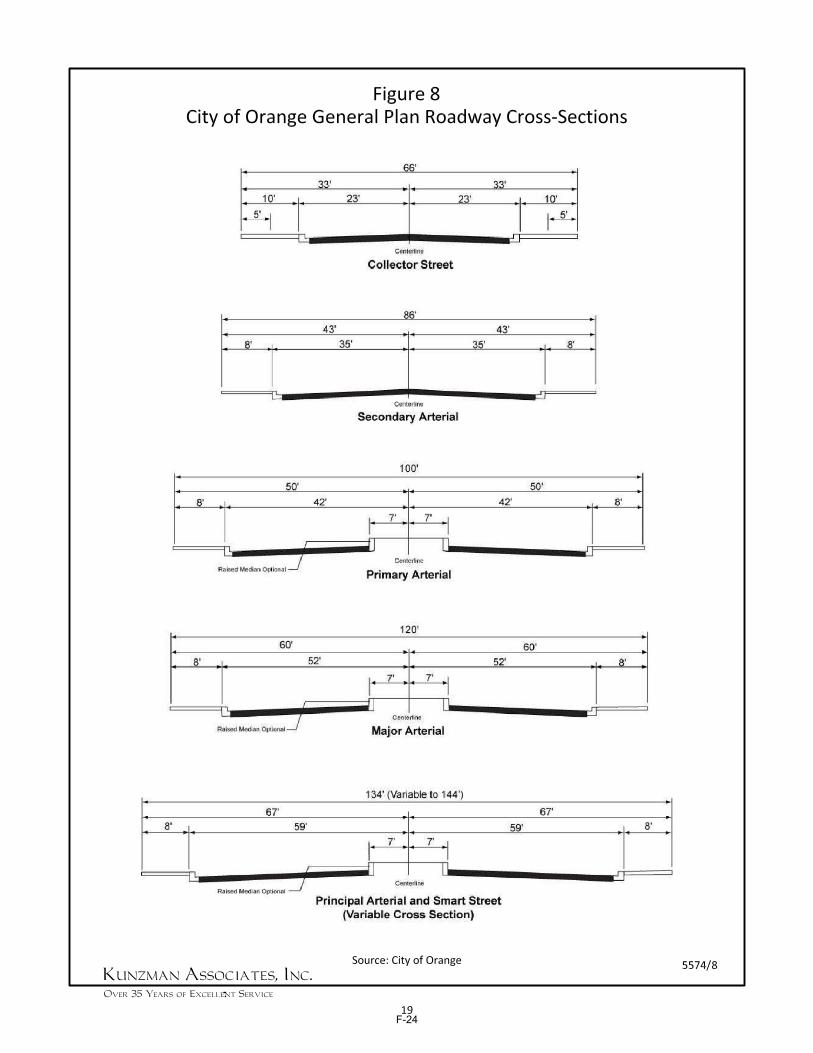
C. Trip Assignment Based on the identified trip generation and distribution, project average daily traffic volumes have been calculated and shown on Figure 10. Morning and evening peak hour intersection turning movement volumes expected from the project are shown on Figures 11 and 12, respectively.
F-25

21
D. Modal Split The traffic reducing potential of public transit has not been considered in this report. Essentially the traffic projections are conservative in that public transit might be able to reduce the traffic volumes.
F-26

Inbound Outbound Total Inbound Outbound Total
Trip Generation RatesTownhomes 58 DU 0.07 0.37 0.44 0.35 0.17 0.52 5.81Trips GeneratedTownhomes 58 DU 4 21 25 20 10 30 337
Morning Evening
1 Source: Institute of Transportation Engineers, Trip Generation, 9th Edition, 2012, Land Use Category 230.
2 DU = Dwelling Units
Table 3
Project Trip Generation1
Land Use Quantity Units2
Peak Hour
Daily
22
F-27

F-28

F-29
F-30

F-31

27
VI. Existing Plus Project Traffic Conditions
In this section, Existing Plus Project traffic conditions are discussed. Figures 13 to 15 depict the Existing Plus Project traffic conditions. A. Method of Projection
To assess Existing Plus Project traffic conditions, existing traffic is combined with the project.
B. Existing Plus Project Average Daily Traffic Volumes Existing Plus Project average daily traffic volumes are illustrated on Figure 13 and are shown in Table 4.
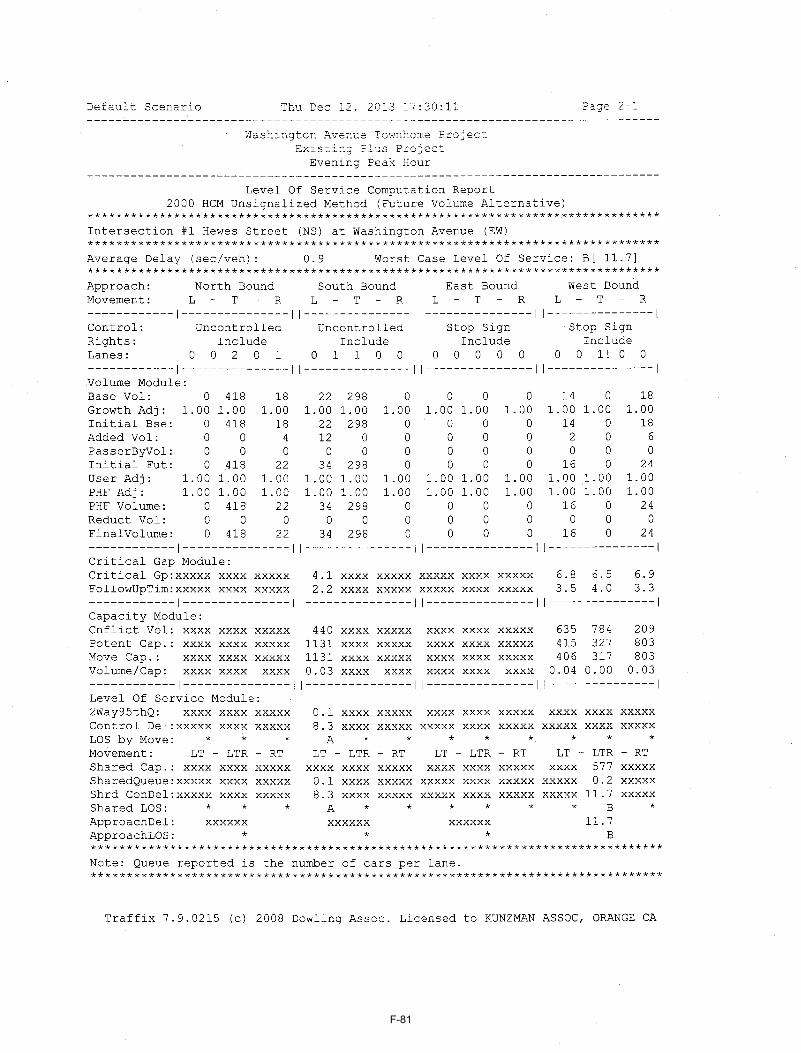
C. Existing Plus Project Levels of Service The technique used to assess the operation of a signalized intersection is known as Intersection Capacity Utilization, as described in Appendix C. To calculate an Intersection Capacity Utilization value, the volume of traffic using the intersection is compared with the capacity of the intersection. An Intersection Capacity Utilization value is usually expressed as a decimal. The decimal represents that portion of the hour required to provide sufficient capacity to accommodate all intersection traffic if all approaches operate at capacity. The technique used to assess the capacity needs of an unsignalized intersection is known as the Intersection Delay Method (see Appendix C). To calculate delay, the volume of traffic using the intersection is compared with the capacity of the intersection. The Levels of Service for Existing Plus Project traffic conditions have been calculated and are shown in Table 5. Existing Plus Project morning and evening peak hour intersection turning movement volumes are shown on Figures 14 and 15, respectively. The study area intersections are projected to operate within acceptable Levels of Service during the peak hours for Existing Plus Project traffic conditions (see Table 5). Existing Plus Project intersection Level of Service worksheets are provided in Appendix C.
F-32

Existing Plus Percent IncreaseExisting Project Project by Project
North 9,000 200 9,200 2.2%South 9,000 100 9,100 1.1%East 700 300 1,000 30.0%West 0 0 0 0.0%North 0 0 0 0.0%South 800 100 900 11.1%East 41,000 100 41,100 0.2%West 41,000 NOM1 41,000 0.0%
Table 4
Intersection LegHewes Street (NS) at Washington Avenue (EW)
Existing Plus Project Roadway Segment Average Daily Traffic Volumes
1 NOM = Nominal, less than 50 vehicles per day
Hamlin Street (NS) at Chapman Avenue (EW)
Average Daily Traffic Volumes
28
F-33

TrafficControl3 L T R L T R L T R L T R Morning Evening
Hewes Street (NS) at:Washingon Avenue (EW) - #1 CSS 0 1.5 0.5 0.5 1.5 0 0 0 0 0.5 0 0.5 12.3-B 11.7-B
Chapman Avenue (EW) - #2 CSS 0.5 0 0.5 0 0 0 0 2.5 0.5 1 3 0 27.0-D 18.7-CHamlin Street/Project Access (NS) at:
Washingon Avenue (EW) - #3 CSS 0 1 0 0 1 0 0 1 0 0 1 0 9.2-A 9.2-A
overall average intersection delay and level of service are shown for intersections with traffic signal or all way stop control. For intersections with cross
street stop control, the delay and level of service are shown for the individual movement (or movements sharing a single lane) are shown.
3 CSS = Cross Street Stop
Intersection
1 When a right turn lane is designated, the lane can either be striped or unstriped. To function as a right turn lane, there must be sufficient width for right
turning vehicles to travel outside the through lanes.
L = Left; T = Through; R = Right
2 Delay and level of service has been calculated using the following analysis software: Traffix, Version 7.9.0215 (2008). Per the Highway Capacity Manual,
Hamlin Street (NS) at:
Table 5
Peak Hour
Existing Plus Project Intersection Levels of Service
Intersection Approach Lanes1
Northbound Southbound Eastbound Westbound Delay-LOS2
29
F-34

F-35

F-36

F-37

33
VII. Opening Year (2016) Traffic Conditions
Figures 16 to 21 illustrate the Year 2035 traffic conditions. A. Method of Projection
For Opening Year (2016) traffic conditions, an areawide growth rate has been utilized to account for areawide growth on study area roadways. Opening Year (2016) traffic volumes have been calculated based on a 0.5 percent annual growth rate of existing traffic volumes over a three year period. The areawide growth rate has been obtained from the City of Orange staff. Areawide growth has been added to existing daily and peak hour traffic volumes on surrounding roadways, in addition to trips generated by the project.
B. Opening Year (2016) Average Daily Traffic Volumes Opening Year (2016) average daily traffic volumes are shown in Table 6. Figure 16 shows the average daily traffic volumes that can be expected for Opening Year (2016) Without Project traffic conditions and Figure 17 shows the average daily traffic volumes that can be expected for Opening Year (2016) With Project traffic conditions.
C. Opening Year (2016) Intersection Levels of Service Level of Service at Opening Year (2016) Without Project The Opening Year (2016) Without Project Levels of Service for the study area roadway network without the proposed project are shown in Table 7. Opening Year (2016) Without Project morning and evening peak hour intersection turning movement volumes are shown on Figures 18 and 19, respectively. Opening Year (2016) Without Project Intersection Level of Service worksheets are provided in Appendix C. For Opening Year (2016) Without Project traffic conditions (see Table 7), the study area intersections are projected to operate within acceptable Levels of Service during the peak hours. Level of Service at Opening Year (2016) With Project The Opening Year (2016) With Project Levels of Service for the study area roadway network with the proposed project are shown in Table 8. Opening Year (2016) With Project morning and evening peak hour intersection turning movement volumes are shown on Figures 20 and 21, respectively. Opening Year (2016) With Project With Project Intersection Level of Service worksheets are provided in Appendix C.
F-38

34
For Opening Year (2016) With Project traffic conditions (see Table 8), the study area intersections are projected to operate within acceptable Levels of Service during the peak hours.
F-39
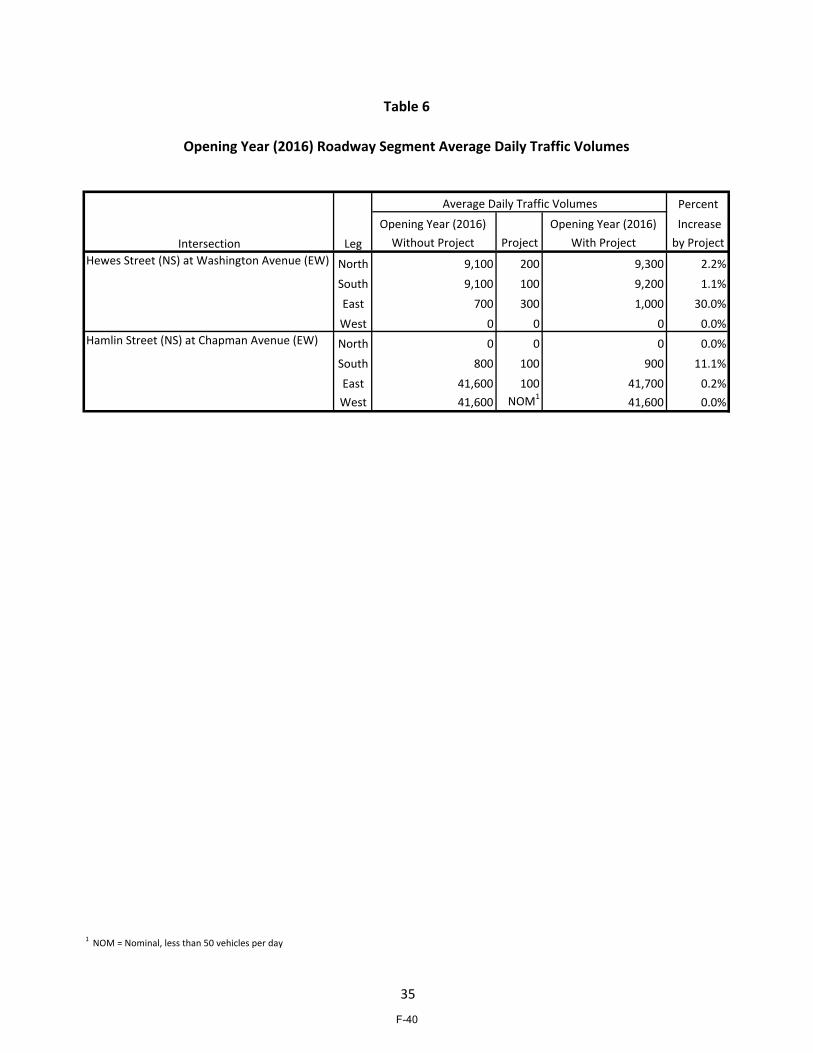
PercentOpening Year (2016) Opening Year (2016) Increase
Without Project Project With Project by Project
North 9,100 200 9,300 2.2%South 9,100 100 9,200 1.1%East 700 300 1,000 30.0%West 0 0 0 0.0%North 0 0 0 0.0%South 800 100 900 11.1%East 41,600 100 41,700 0.2%West 41,600 NOM1 41,600 0.0%
Table 6
Intersection LegHewes Street (NS) at Washington Avenue (EW)
Opening Year (2016) Roadway Segment Average Daily Traffic Volumes
1 NOM = Nominal, less than 50 vehicles per day
Hamlin Street (NS) at Chapman Avenue (EW)
Average Daily Traffic Volumes
35
F-40

TrafficControl3 L T R L T R L T R L T R Morning Evening
Hewes Street (NS) at:Washingon Avenue (EW) - #1 CSS 0 1.5 0.5 0.5 1.5 0 0 0 0 0.5 0 0.5 12.3-B 11.7-B
Chapman Avenue (EW) - #3 CSS 0.5 0 0.5 0 0 0 0 2.5 0.5 1 3 0 28.2-D 18.9-C
3 CSS = Cross Street Stop
street stop control, the delay and level of service are shown for the individual movement (or movements sharing a single lane) are shown.
Opening Year (2016) Without Project Intersection Levels of Service
Intersection
1 When a right turn lane is designated, the lane can either be striped or unstriped. To function as a right turn lane, there must be sufficient width for right
turning vehicles to travel outside the through lanes.
L = Left; T = Through; R = Right
2 Delay and level of service has been calculated using the following analysis software: Traffix, Version 7.9.0215 (2008). Per the Highway Capacity Manual,
Hamlin Street (NS) at:
overall average intersection delay and level of service are shown for intersections with traffic signal or all way stop control. For intersections with cross
Table 7
Intersection Approach Lanes1 Peak HourNorthbound Southbound Eastbound Westbound Delay-LOS2
36
F-41

TrafficControl3 L T R L T R L T R L T R Morning Evening
Hewes Street (NS) at:Washingon Avenue (EW) - #1 CSS 0 1.5 0.5 0.5 1.5 0 0 0 0 0.5 0 0.5 12.4-B 11.8-B
Chapman Avenue (EW) - #2 CSS 0.5 0 0.5 0 0 0 0 2.5 0.5 1 3 0 32.0-D 19.0-CHamlin Street/Project Access (NS) at:
Washingon Avenue (EW) - #3 CSS 0 1 0 0 1 0 0 1 0 0 1 0 9.2-A 9.2-A
overall average intersection delay and level of service are shown for intersections with traffic signal or all way stop control. For intersections with cross
street stop control, the delay and level of service are shown for the individual movement (or movements sharing a single lane) are shown.
3 CSS = Cross Street Stop
Opening Year (2016) With Project Intersection Levels of Service
1 When a right turn lane is designated, the lane can either be striped or unstriped. To function as a right turn lane, there must be sufficient width for right
turning vehicles to travel outside the through lanes.
L = Left; T = Through; R = Right
2 Delay and level of service has been calculated using the following analysis software: Traffix, Version 7.9.0215 (2008). Per the Highway Capacity Manual,
Hamlin Street (NS) at:
Table 8
Intersection
Intersection Approach Lanes1 Peak HourNorthbound Southbound Eastbound Westbound Delay-LOS2
37
F-42

F-43

F-44
F-45

F-46

F-47

F-48

44
VIII. Recommendations
A. Site Access
The project site will have access to Hamlin Street and Washington Avenue.
B. Roadway Improvements Site‐specific circulation and access recommendations are depicted on Figure 22. Construct Washington Avenue from the west project boundary to its eastern terminus at its ultimate half‐section width including landscaping and parkway improvements in conjunction with development. Sufficient on‐site parking shall be provided to meet City of Orange parking code requirements. On‐site traffic signing and striping should be implemented in conjunction with detailed construction plans for the project. Sight distance at the project access should be reviewed with respect to California Department of Transportation/City of Orange standards in conjunction with the preparation of final grading, landscaping, and street improvement plans.
F-49

F-50

Appendices
Appendix A – Glossary of Transportation Terms Appendix B – Traffic Count Worksheets Appendix C – Explanation and Calculation of Intersection Capacity Utilization/Delay
F-51

APPENDIX A
Glossary of Transportation Terms
F-52

GLOSSARY OF TRANSPORTATION TERMS COMMON ABBREVIATIONS AC: Acres ADT: Average Daily Traffic Caltrans: California Department of Transportation DU: Dwelling Unit ICU: Intersection Capacity Utilization LOS: Level of Service TSF: Thousand Square Feet V/C: Volume/Capacity VMT: Vehicle Miles Traveled TERMS AVERAGE DAILY TRAFFIC: The total volume during a year divided by the number of days in a year. Usually only weekdays are included. BANDWIDTH: The number of seconds of green time available for through traffic in a signal progression. BOTTLENECK: A constriction along a travelway that limits the amount of traffic that can proceed downstream from its location. CAPACITY: The maximum number of vehicles that can be reasonably expected to pass over a given section of a lane or a roadway in a given time period. CHANNELIZATION: The separation or regulation of conflicting traffic movements into definite paths of travel by the use of pavement markings, raised islands, or other suitable means to facilitate the safe and orderly movements of both vehicles and pedestrians. CLEARANCE INTERVAL: Nearly same as yellow time. If there is an all red interval after the end of a yellow, then that is also added into the clearance interval. CORDON: An imaginary line around an area across which vehicles, persons, or other items are counted (in and out). CYCLE LENGTH: The time period in seconds required for one complete signal cycle. CUL-DE-SAC STREET: A local street open at one end only, and with special provisions for turning around.
F-53

DAILY CAPACITY: The daily volume of traffic that will result in a volume during the peak hour equal to the capacity of the roadway. DELAY: The time consumed while traffic is impeded in its movement by some element over which it has no control, usually expressed in seconds per vehicle. DEMAND RESPONSIVE SIGNAL: Same as traffic-actuated signal. DENSITY: The number of vehicles occupying in a unit length of the through traffic lanes of a roadway at any given instant. Usually expressed in vehicles per mile. DETECTOR: A device that responds to a physical stimulus and transmits a resulting impulse to the signal controller. DESIGN SPEED: A speed selected for purposes of design. Features of a highway, such as curvature, superelevation, and sight distance (upon which the safe operation of vehicles is dependent) are correlated to design speed. DIRECTIONAL SPLIT: The percent of traffic in the peak direction at any point in time. DIVERSION: The rerouting of peak hour traffic to avoid congestion. FORCED FLOW: Opposite of free flow. FREE FLOW: Volumes are well below capacity. Vehicles can maneuver freely and travel is unimpeded by other traffic. GAP: Time or distance between successive vehicles in a traffic stream, rear bumper to front bumper. HEADWAY: Time or distance spacing between successive vehicles in a traffic stream, front bumper to front bumper. INTERCONNECTED SIGNAL SYSTEM: A number of intersections that are connected to achieve signal progression. LEVEL OF SERVICE: A qualitative measure of a number of factors, which include speed and travel time, traffic interruptions, freedom to maneuver, safety, driving comfort and convenience, and operating costs. LOOP DETECTOR: A vehicle detector consisting of a loop of wire embedded in the roadway, energized by alternating current and producing an output circuit closure when passed over by a vehicle.
F-54

MINIMUM ACCEPTABLE GAP: Smallest time headway between successive vehicles in a traffic stream into which another vehicle is willing and able to cross or merge. MULTI-MODAL: More than one mode; such as automobile, bus transit, rail rapid transit, and bicycle transportation modes. OFFSET: The time interval in seconds between the beginning of green at one intersection and the beginning of green at an adjacent intersection. PLATOON: A closely grouped component of traffic that is composed of several vehicles moving, or standing ready to move, with clear spaces ahead and behind. ORIGIN-DESTINATION SURVEY: A survey to determine the point of origin and the point of destination for a given vehicle trip. PASSENGER CAR EQUIVALENTS (PCE): One car is one Passenger Car Equivalent. A truck is equal to 2 or 3 Passenger Car Equivalents in that a truck requires longer to start, goes slower, and accelerates slower. Loaded trucks have a higher Passenger Car Equivalent than empty trucks. PEAK HOUR: The 60 consecutive minutes with the highest number of vehicles. PRETIMED SIGNAL: A type of traffic signal that directs traffic to stop and go on a predetermined time schedule without regard to traffic conditions. Also, fixed time signal. PROGRESSION: A term used to describe the progressive movement of traffic through several signalized intersections. SCREEN-LINE: An imaginary line or physical feature across which all trips are counted, normally to verify the validity of mathematical traffic models. SIGNAL CYCLE: The time period in seconds required for one complete sequence of signal indications. SIGNAL PHASE: The part of the signal cycle allocated to one or more traffic movements. STARTING DELAY: The delay experienced in initiating the movement of queued traffic from a stop to an average running speed through a signalized intersection. TRAFFIC-ACTUATED SIGNAL: A type of traffic signal that directs traffic to stop and go in accordance with the demands of traffic, as registered by the actuation of detectors.
F-55

TRIP: The movement of a person or vehicle from one location (origin) to another (destination). For example, from home to store to home is two trips, not one. TRIP-END: One end of a trip at either the origin or destination; i.e. each trip has two trip-ends. A trip-end occurs when a person, object, or message is transferred to or from a vehicle. TRIP GENERATION RATE: The quality of trips produced and/or attracted by a specific land use stated in terms of units such as per dwelling, per acre, and per 1,000 square feet of floor space. TRUCK: A vehicle having dual tires on one or more axles, or having more than two axles. UNBALANCED FLOW: Heavier traffic flow in one direction than the other. On a daily basis, most facilities have balanced flow. During the peak hours, flow is seldom balanced in an urban area. VEHICLE MILES OF TRAVEL: A measure of the amount of usage of a section of highway, obtained by multiplying the average daily traffic by length of facility in miles.
F-56

APPENDIX B
Traffic Count Worksheets
F-57

F-58

F-59

APPENDIX C
Explanation and Calculation of Intersection Capacity Utilization/Delay
F-60

EXPLANATION AND CALCULATION OF INTERSECTION CAPACITY UTILIZATION
Overview The ability of a roadway to carry traffic is referred to as capacity. The capacity is usually greater between intersections and less at intersections because traffic flows continuously between them and only during the green phase at them. Capacity at intersections is best defined in terms of vehicles per lane per hour of green. If capacity is 1600 vehicles per lane per hour of green, and if the green phase is 50 percent of the cycle and there are three lanes, then the capacity is 1600 times 50 percent times 3 lanes, or 2400 vehicles per hour for that approach. The technique used to compare the volume and capacity at an intersection is known as Intersection Capacity Utilization. Intersection Capacity Utilization, usually expressed as a percent, is the proportion of an hour required to provide sufficient capacity to accommodate all intersection traffic if all approaches operate at capacity. If an intersection is operating at 80 percent of capacity (i.e., an Intersection Capacity Utilization of 80 percent), then 20 percent of the signal cycle is not used. The signal could show red on all indications 20 percent of the time and the signal would just accommodate approaching traffic. Intersection Capacity Utilization analysis consists of (a) determining the proportion of signal time needed to serve each conflicting movement of traffic, (b) summing the times for the movements, and (c) comparing the total time required to the total time available. For example, if for north-south traffic the northbound traffic is 1600 vehicles per hour, the southbound traffic is 1200 vehicles per hour, and the capacity of either direction is 3200 vehicles per hour, then the northbound traffic is critical and requires 1600/3200 or 50 percent of the signal time. If for east-west traffic, 30 percent of the signal time is required, then it can be seen that the Intersection Capacity Utilization is 50 plus 30, or 80 percent. When left turn arrows (left turn phasing) exist, they are incorporated into the analysis. The critical movements are usually the heavy left turn movements and the opposing through movements. The Intersection Capacity Utilization technique is an ideal tool to quantify existing as well as future intersection operation. The impact of adding a lane can be quickly determined by examining the effect the lane has on the Intersection Capacity Utilization.
F-61

Intersection Capacity Utilization Worksheets That Follow This Discussion The Intersection Capacity Utilization worksheet table contains the following information: 1. Peak hour turning movement volumes. 2. Number of lanes that serve each movement. 3. For right turn lanes, whether the lane is a free right turn lane, whether it has a
right turn arrow, and the percent of right turns on red that are assumed. 4. Capacity assumed per lane. 5. Capacity available to serve each movement (number of lanes times capacity per
lane). 6. Volume to capacity ratio for each movement. 7. Whether the movement's volume to capacity ratio is critical and adds to the
Intersection Capacity Utilization value. 8. The yellow time or clearance interval assumed. 9. Adjustments for right turn movements. 10. The Intersection Capacity Utilization and Level of Service. The Intersection Capacity Utilization Worksheet also has two graphics on the same page. These two graphics show the following: 1. Peak hour turning movement volumes. 2. Number of lanes that serve each movement. 3. The approach and exit leg volumes. 4. The two-way leg volumes. 5. An estimate of daily traffic volumes that is fairly close to actual counts and is
based strictly on the peak hour leg volumes multiplied by a factor. 6. Percent of daily traffic in peak hours.
F-62

7. Percent of peak hour leg volume that is inbound versus outbound. A more detailed discussion of Intersection Capacity Utilization and Level of Service follows. Level of Service Level of Service is used to describe the quality of traffic flow. Levels of Service A to C operate quite well. Level of Service C is typically the standard to which rural roadways are designed. Level of Service D is characterized by fairly restricted traffic flow. Level of Service D is the standard to which urban roadways are typically designed. Level of Service E is the maximum volume a facility can accommodate and will result in possible stoppages of momentary duration. Level of Service F occurs when a facility is overloaded and is characterized by stop-and-go traffic with stoppages of long duration. A description of the various Levels of Service appears at the end of the ICU description, along with the relationship between Intersection Capacity Utilization and Level of Service. Signalized and Unsignalized Intersections Although calculating an Intersection Capacity Utilization value for an unsignalized intersection is invalid, the presumption is that a signal can be installed and the calculation shows whether the geometrics are capable of accommodating the expected volumes with a signal. A traffic signal becomes warranted before Level of Service D is reached for a signalized intersection. Signal Timing The Intersection Capacity Utilization calculation assumes that a signal is properly timed. It is possible to have an Intersection Capacity Utilization well below 100 percent, yet have severe traffic congestion. This would occur if one or more movements is not getting sufficient green time to satisfy its demand, and excess green time exists on other movements. This is an operational problem that should be remedied. Lane Capacity Capacity is often defined in terms of roadway width; however, standard lanes have approximately the same capacity whether they are 11 or 14 feet wide. Our data indicates a typical lane, whether a through lane or a left turn lane, has a capacity of
F-63

approximately 1750 vehicles per hour of green time, with nearly all locations showing a capacity greater than 1600 vehicles per hour of green per lane. Right turn lanes have a slightly lower capacity; however 1600 vehicles per hour is a valid capacity assumption for right turn lanes. This finding is published in the August, 1978 issue of Institute of Transportation Engineers Journal in the article entitled, "Another Look at Signalized Intersection Capacity" by William Kunzman. A capacity of 1600 vehicles per hour per lane with no yellow time penalty, or 1700 vehicles per hour with a 3 or 5 percent yellow time penalty is reasonable. Yellow Time The yellow time can either be assumed to be completely used and no penalty applied, or it can be assumed to be only partially usable. Total yellow time accounts for approximately 10 percent of a signal cycle, and a penalty of 3 to 5 percent is reasonable. During peak hour traffic operation the yellow times are nearly completely used. If there is no left turn phasing, the left turn vehicles completely use the yellow time. Even if there is left turn phasing, the through traffic continues to enter the intersection on the yellow until just a split second before the red. Shared Lanes Shared lanes occur in many locations. A shared lane is often found at the end of an off ramp where the ramp forms an intersection with the cross street. Often at a diamond interchange off ramp, there are three lanes. In the case of a diamond interchange, the middle lane is sometimes shared, and the driver can turn left, go through, or turn right from that lane. If one assumes a three lane off ramp as described above, and if one assumes that each lane has 1600 capacity, and if one assumes that there are 1000 left turns per hour, 500 right turns per hour, and 100 through vehicles per hour, then how should one assume that the three lanes operate. There are three ways that it is done. One way is to just assume that all 1600 vehicles (1000 plus 500 plus 100) are served simultaneously by three lanes. When this is done, the capacity is 3 times 1600 or 4800, and the amount of green time needed to serve the ramp is 1600 vehicles divided by 4800 capacity or 33.3 percent. This assumption effectively assumes perfect lane distribution between the three lanes that is not realistic. It also means a left turn can be made from the right lane.
F-64

Another way is to equally split the capacity of a shared lane and in this case to assume there are 1.33 left turn lanes, 1.33 right turn lanes, and 0.33 through lanes. With this assumption, the critical movement is the left turns and the 1000 left turns are served by a capacity of 1.33 times 1600, or 2133. The volume to capacity ratio of the critical move is 1000 divided by 2133 or 46.9 percent. The first method results in a critical move of 33.3 percent and the second method results in a critical move of 46.9 percent. Neither is very accurate, and the difference in the calculated Level of Service will be approximately 1.5 Levels of Service (one Level of Service is 10 percent). The way Kunzman Associates, Inc. does it is to assign fractional lanes in a reasonable way. In this example, it would be assumed that there is 1.1 right turn lanes, 0.2 through lanes, and 1.7 left turn lanes. The volume to capacity ratios for each movement would be 31.3 percent for the through traffic, 28.4 percent for the right turn movement, and 36.8 percent for the left turn movement. The critical movement would be the 36.8 percent for the left turns. Right Turn on Red The Kunzman Associates, Inc. software treats right turn lanes in one of five different ways. Each right turn lane is classified into one of five cases. The five cases are (1) free right turn lane, (2) right turn lane with separate right turn arrow, (3) standard right turn lane with no right turns on red allowed, (4) standard right turn lane with a certain percentage of right turns on red allowed, and (5) separate right turn arrow and a certain percentage of right turns on red allowed. Free Right Turn Lane If it is a free right turn lane, then it is given a capacity of one full lane with continuous or 100 percent green time. A Free right turn lane occurs when there is a separate approach lane for right turning vehicles, there is a separate departure lane for the right turning vehicles after they turn and are exiting the intersection, and the through cross street traffic does not interfere with the vehicles after they turn right. Separate Right Turn Arrow If there is a separate right turn arrow, then it is assumed that vehicles are given a green indication and can proceed on what is known as the left turn overlap. The left turn overlap for a northbound right turn is the westbound left turn. When the left turn overlap has a green indication, the right turn lane is also given a green arrow
F-65

indication. Thus, if there is a northbound right turn arrow, then it can be turned green for the period of time that the westbound left turns are proceeding. If there are more right turns than can be accommodated during the northbound through green and the time that the northbound right turn arrow is on, then an adjustment is made to the Intersection Capacity Utilization to account for the green time that needs to be added to the northbound through green to accommodate the northbound right turns. Standard Right Turn Lane, No Right Turns on Red A standard right turn lane, with no right turn on red assumed, proceeds only when there is a green indication displayed for the adjacent through movement. If additional green time is needed above that amount of time, then in the Intersection Capacity Utilization calculation a right turn adjustment green time is added above the green time that is needed to serve the adjacent through movement. Standard Right Turn Lane, With Right Turns on Red A standard right turn lane with say 20 percent of the right turns allowed to turn right on a red indication is calculated the same as the standard right turn case where there is no right turn on red allowed, except that the right turn adjustment is reduced to account for the 20 percent of the right turning vehicles that can logically turn right on a red light. The right turns on red are never allowed to exceed the time the overlap left turns take plus the unused part of the green cycle that the cross street traffic moving from left to right has. As an example of how 20 percent of the cars are allowed to turn right on a red indication, assume that the northbound right turn volume needs 40 percent of the signal cycle to be satisfied. To allow 20 percent of the northbound right turns to turn right on red, then during 8 percent of the signal cycle (40 percent of signal cycle times 20 percent that can turn right on red) right turns on red will be allowed if it is feasible. For this example, assume that 15 percent of the signal cycle is green for the northbound through traffic, and that means that 15 percent of the signal cycle is available to satisfy northbound right turns. After the northbound through traffic has received its green, 25 percent of the signal cycle is still needed to satisfy the northbound right turns (40 percent of the signal cycle minus the 15 percent of the signal cycle that the northbound through used). Assume that the westbound left turns require a green time of 6 percent of the signal cycle. This 6 percent of the signal cycle is used by northbound right turns on red. After accounting for the northbound right turns that occur on the westbound overlap
F-66

left turn, 19 percent of the signal cycle is still needed for the northbound right turns (25 percent of the cycle was needed after the northbound through green time was accounted for [see above paragraph], and 6 percent was served during the westbound left turn overlap). Also, at this point 6 percent of the signal cycle has been used for northbound right turns on red, and still 2 percent more of the right turns will be allowed to occur on the red if there is unused eastbound through green time. For purpose of this example, assume that the westbound through green is critical, and that 15 percent of the signal cycle is unused by eastbound through traffic. Thus, 2 percent more of the signal cycle can be used by the northbound right turns on red since there is 15 seconds of unused green time being given to the eastbound through traffic. At this point, 8 percent of the signal cycle was available to serve northbound right turning vehicles on red, and 15 percent of the signal cycle was available to serve right turning vehicles on the northbound through green. So 23 percent of the signal cycle has been available for northbound right turns. Because 40 percent of the signal cycle is needed to serve northbound right turns, there is still a need for 17 percent more of the signal cycle to be available for northbound right turns. What this means is the northbound through traffic green time is increased by 17 percent of the cycle length to serve the unserved right turn volume, and a 17 percent adjustment is added to the Intersection Capacity Utilization to account for the northbound right turns that were not served on the northbound through green time or when right turns on red were assumed. Separate Right Turn Arrow, With Right Turns on Red A right turn lane with a separate right turn arrow, plus a certain percentage of right turns allowed on red is calculated the same way as a standard right turn lane with a certain percentage of right turns allowed on red, except the turns which occur on the right turn arrow are not counted as part of the percentage of right turns that occur on red. Critical Lane Method Intersection Capacity Utilization parallels another calculation procedure known as the Critical Lane Method with one exception. Critical Lane Method dimensions capacity in terms of standardized vehicles per hour per lane. A Critical Lane Method result of 800 vehicles per hour means that the intersection operates as though 800 vehicles were using a single lane continuously. If one assumes a lane capacity of 1600 vehicles per hour, then a Critical Lane Method calculation resulting in 800 vehicles per hour is the same as an Intersection Capacity Utilization calculation of 50 percent since 800/1600
F-67

is 50 percent. It is our opinion that the Critical Lane Method is inferior to the Intersection Capacity Utilization method simply because a statement such as "The Critical Lane Method value is 800 vehicles per hour" means little to most persons, whereas a statement such as "The Intersection Capacity Utilization is 50 percent" communicates clearly. Critical Lane Method results directly correspond to Intersection Capacity Utilization results. The correspondence is as follows, assuming a lane capacity of 1600 vehicles per hour and no clearance interval.
Critical Lane Method Result Intersection Capacity Utilization Result
800 vehicles per hour 50 percent 960 vehicles per hour 60 percent 1120 vehicles per hour 70 percent 1280 vehicles per hour 80 percent 1440 vehicles per hour 90 percent 1600 vehicles per hour 100 percent 1760 vehicles per hour 110 percent
F-68

INTERSECTION CAPACITY UTILIZATION
LEVEL OF SERVICE DESCRIPTION1
Level of
Service
Description
Volume to
Capacity Ratio
A
B
C
D
E
F
Level of Service A occurs when progression is extremely favorable and vehicles arrive during the green phase. Most vehicles do not stop at all. Short cycle lengths may also contribute to low delay. Level of Service B generally occurs with good progression and/or short cycle lengths. More vehicles stop than for Level of Service A, causing higher levels of average delay. Level of Service C generally results when there is fair progression and/or longer cycle lengths. Individual cycle failures may begin to appear in this level. The number of vehicles stopping is significant at this level, although many still pass through the intersection without stopping. Level of Service D generally results in noticeable congestion. Longer delays may result from some combination of unfavorable progression, long cycle lengths, or high volume to capacity ratios. Many vehicles stop, and the proportion of vehicles not stopping declines. Individual cycle failures are noticeable. Level of Service E is considered to be the limit of acceptable delay. These high delay values generally indicate poor progression, long cycle lengths, and high volume to capacity ratios. Individual cycle failures are frequent. Level of Service F is considered to be unacceptable to most drivers. This condition often occurs when oversaturation, i.e., when arrival flow rates exceed the capacity of the intersection. It may also occur at high volume to capacity ratios below 1.00 with many individual cycle failures. Poor progression and long cycle lengths may also be major contributing causes to such delay levels.
0.600 and below
0.601 to 0.700
0.701 to 0.800
0.801 to 0.900
0.901 to 1.000
1.001 and up
1Source: Highway Capacity Manual Special Report 209, Transportation Research Board, National Research Council Washington D.C., 2000.
F-69

EXPLANATION AND CALCULATION OF INTERSECTION LEVEL OF SERVICE USING DELAY METHODOLOGY
The levels of service at the unsignalized and signalized intersections are calculated using the delay methodology in the Highway Capacity Manual. This methodology views an intersection as consisting of several lane groups. A lane group is a set of lanes serving a movement. If there are two northbound left turn lanes, then the lane group serving the northbound left turn movement has two lanes. Similarly, there may be three lanes in the lane group serving the northbound through movement, one lane in the lane group serving the northbound right turn movement, and so forth. It is also possible for one lane to serve two lane groups. A shared lane might result in there being 1.5 lanes in the northbound left turn lane group and 2.5 lanes in the northbound through lane group. For each lane group, there is a capacity. That capacity is calculated by multiplying the number of lanes in the lane group times a theoretical maximum lane capacity per lane time’s 12 adjustment factors. Each of the 12 adjustment factors has a value of approximately 1.00. A value less than 1.00 is generally assigned when a less than desirable condition occurs. The 12 adjustment factors are as follows:
1. Peak hour factor (to account for peaking within the peak hour) 2. Lane utilization factor (to account for not all lanes loading equally) 3. Lane width 4. Percent of heavy trucks 5. Approach grade 6. Parking 7. Bus stops at intersections 8. Area type (CBD or other) 9. Right turns
F-70

10. Left turns 11. Pedestrian activity 12. Signal progression
The maximum theoretical lane capacity and the 12 adjustment factors for it are all unknowns for which approximate estimates have been recommended in the Highway Capacity Manual. For the most part, the recommended values are not based on statistical analysis but rather on educated estimates. However, it is possible to use the delay method and get reasonable results as will be discussed below. Once the lane group volume is known and the lane group capacity is known, a volume to capacity ratio can be calculated for the lane group. With a volume to capacity ratio calculated, average delay per vehicle in a lane group can be estimated. The average delay per vehicle in a lane group is calculated using a complex formula provided by the Highway Capacity Manual, which can be simplified and described as follows: Delay per vehicle in a lane group is a function of the following:
1. Cycle length 2. Amount of red time faced by a lane group 3. Amount of yellow time for that lane group 4. The volume to capacity ratio of the lane group
The average delay per vehicle for each lane group is calculated, and eventually an overall average delay for all vehicles entering the intersection is calculated. This average delay per vehicle is then used to judge Level of Service. The Level of Services are defined in the table that follows this discussion. Experience has shown that when a maximum lane capacity of 1,900 vehicles per hour is used (as recommended in the Highway Capacity Manual), little or no yellow time penalty is used, and none of the 12 penalty factors are applied, calculated delay is realistic. The delay calculation for instance assumes that yellow time is totally unused. Yet experience shows that most of the yellow time is used.
F-71

An idiosyncrasy of the delay methodology is that it is possible to add traffic to an intersection and reduce the average total delay per vehicle. If the average total delay is 30 seconds per vehicle for all vehicles traveling through an intersection, and traffic is added to a movement that has an average total delay of 15 seconds per vehicle, then the overall average total delay is reduced. The delay calculation for a lane group is based on a concept that the delay is a function of the amount of unused capacity available. As the volume approaches capacity and there is no more unused capacity available, then the delay rapidly increases. Delay is not proportional to volume, but rather increases rapidly as the unused capacity approaches zero. Because delay is not linearly related to volumes, the delay does not reflect how close an intersection is to overloading. If an intersection is operating at Level of Service C and has an average total delay of 18 seconds per vehicle, you know very little as to what percent the traffic can increase before Level of Service E is reached.
F-72

DELAY METHODOLOGY LEVEL OF SERVICE DESCRIPTION1
Level Of
Service
Description
Average Total DelayPer Vehicle (Seconds)
Signalized UnsignalizedA
Level of Service A occurs when progression is extremely favorable and most vehicles arrive during the green phase. Most vehicles do not stop at all. Short cycle lengths may also contribute to low delay.
0 to 10.00 0 to 10.00
B
Level of Service B generally occurs with good progression and/or short cycle lengths. More vehicles stop than for Level of Service A, causing higher levels of average total delay.
10.01 to 20.00 10.01 to 15.00
C
Level of Service C generally results when there is fair progression and/or longer cycle lengths. Individual cycle failures may begin to appear in this level. The number of vehicles stopping is significant at this level, although many still pass through the intersection without stopping.
20.01 to 35.00 15.01 to 25.00
D
Level of Service D generally results in noticeable congestion. Longer delays may result from some combination of unfavorable progression, long cycle lengths, or high volume to capacity ratios. Many vehicles stop, and the proportion of vehicles not stopping declines. Individual cycle failures are noticeable.
35.01 to 55.00 25.01 to 35.00
E
Level of Service E is considered to be the limit of acceptable delay. These high delay values generally indicate poor progression, long cycle lengths, and high volume to capacity ratios. Individual cycle failures are frequent occurrences.
55.01 to 80.00 35.01 to 50.00
F
Level of Service F is considered to be unacceptable to most drivers. This condition often occurs with oversaturation, i.e., when arrival flow rates exceed the capacity of the intersection. It may also occur at high volume to capacity ratios below 1.00 with many individual cycle failures. Poor progression and long cycle lengths may also be major contributing causes to such delay levels.
80.01 and up 50.01 and up
1 Source: Highway Capacity Manual Special Report 209, Transportation Research Board, National Research Council, Washington, D.C., 2000.
F-73

Existing
F-74

F-75
F-76

F-77

F-78

Existing Plus Project
F-79

F-80
F-81

F-82

F-83

F-84

F-85

Opening Year (2016) Without Project
F-86

F-87

F-88

F-89

F-90

Opening Year (2016) With Project
F-91

F-92

F-93

F-94

F-95

F-96

F-97

1111 Town & Country Road, Suite 34 Orange, California 92868
(714) 973-8383
www.traffic-engineer.com
F-98