WASH Research Team - BRACresearch.brac.net/publications/WASH_Baseline_findings.pdf · WASH Research...
124
i WASH Programme of BRAC: Towards Attaining the MDG Targets: Baseline Findings WASH Research Team
-
Upload
truongdieu -
Category
Documents
-
view
215 -
download
0
Transcript of WASH Research Team - BRACresearch.brac.net/publications/WASH_Baseline_findings.pdf · WASH Research...

i
WASH Programme of BRAC: Towards Attaining the MDG
Targets: Baseline Findings
WASH Research Team

ii
Copyright © 2008 BRAC July 2008 WASH Research Team Nasima Akter Research Fellow Kazi Faisal Bin Seraj Research Associate Syed Masud Ahmed Research Coordinator MA Quaiyum Sarkar Senior Research Associate Ananta Z. Neelim Intern Tanveer M. Kamal Research Associate Tawhidul Islam Consultant Md. Mizanur Rahman Field Manager Published by: BRAC BRAC Centre 75 Mohakhali Dhaka 1212, Bangladesh E-mail: [email protected] Fax: (88-02) 8823542, 8823614 Telephone: (88-02) 9881265-72, 8824180-7 Website: www.brac.net/research Printing and publication: Altamas Pasha Cover design: Md. Abdur Razzaque Typesetting and layout: Md. Akram Hossain BRAC/RED publishes research reports, scientific papers, monographs, working papers, research compendium in Bangla (Nirjash), proceedings, manuals, and other publications on subjects relating to poverty, social development, health, nutrition, education, gender, environment, and governance. Printed by BRAC Printers, 87-88 (old) 41 (new), Block C, Tongi Industrial area, Gazipur, Bangladesh
iii
CONTENTS
Acknowledgements vii Chapter One: Introduction 1 Background 1 BRAC Water, Sanitation and Hygiene (WASH) programme and the baseline survey 4 Objectives of the baseline survey 5 Overview of this baseline report 6
Survey design and methods 6 Poverty oriented analysis 6 Socio-demographic profile 7 Status of safe water 8 Sanitation status 9 Hygiene status 9 WASH status at institutes 10
Conclusion 10 Chapter Two: Survey design and methods 11 Selection of upazilas 11 Sampling procedure for the household survey 11 Educational and social institutes 13 Respondents 15 Questionnaire development 15 Enumerators 16 Data collection and quality control 16 Data coding and entry 17 Chapter Three: Towards a poverty oriented analysis of water, sanitation
and hygiene 19 Introduction 19 Defining the hardcore poor 20 Socioeconomic profile of the surveyed households 24
Household composition 24

iv
Education of the head of the family 24 Occupation of the household head 24 Disease occurrence 25 Land ownership 25 Dwelling condition 26
Perceived economic status 26 Conclusion 27 Chapter Four: Socio-demographic profile 29 Introduction 29 Methods 30 Results and discussion 30
Household Population 30 Household composition 30 Age and sex distribution 32 Marital status 33 Education status 35 Occupational variation 38
Specially focused group 39 Disability (different ability) status 39 Adolescents 41 Elderly population 42
Disease Prevalence 43 Conclusion 48 Chapter Five: Water for life: status of water 51 Introduction 51 Methods 53 Results and discussion 53
Use of tubewell water 53 Ownership of tubewells 54 Mechanical condition 54 Platform condition 56 Testing water for arsenic contamination 56 Use of arsenic contaminated water 58 Arsenic-free tubewell based on observaion 59 Water purification 59 Placement of tubewells: safety issue 60 Water collection: role of women 60 Cleaning tubewell’s platform 60 Particular time to use shared or public tubewells 61
Availability of water 61 Satisfaction related to source of water 62 Preferred source of water 62

v
Preferred size of monthly installment on loan 63 Conclusion 64 Chapter Six: Status of sanitation: a focus on latrines in WASH
programme area 65 Introduction 65 Methods 68 Results and discussion 68
Sanitation practice, access and status 68 Quality of the latrines from spot observation 70 Perception and practice of sanitation- related hygiene 73 Maintenance of sanitation facility 76
Satisfaction and demand for sanitary latrine 79 Conclusion and recommendations 81 Chapter Seven: Hygiene awareness and practices 85 Introduction 85 Methods 87 Results and discussion 87
Sociodemographic profile 87 General health awareness 88 Awareness about water-borne diseases 89 Hygienic collection and storage of water 90 Knowledge on critical times for handwashing 92 Domestic waste disposal 93 Field observations of actual practices 93
Conclusion 94 Chapter Eight: Status of water sanitation and hygiene in educational institutes 97 Introduction 97 Methods 98 Results and discussion 98
Summary profile of educational institutes 98 Safe water source and use 100 Sanitation 102 Student to latrine ratio 103 Hygiene 104 Disease profile 105
Conclusion 105

vi
Chapter Nine: Status of water, sanitation and hygiene in social and religious institutes 107
Introduction 107 Methods 108 Results and discussion 109
Safe water source – sufficiency and quality 109 State of sanitation facilities 109
Ownership of sanitary latrine 110 State of hygiene practice 110
Conclusion 111 References 113 Appendices 119 Abbreviation 123

vii
ACKNOWLEDGEMENTS We would like to express our heartiest gratitude to BRAC Water, Sanitation and Hygiene (WASH) Programme for giving us the opportunity to be part of the programme through research. We thank the programme people for giving all out cooperation, especially to the WASH field staff without whose support and assistance it would not have been possible to conduct this baseline survey. We would particularly like to thank Dr. AMR Chowdhury, Deputy Executive Director and Faruque Ahmed, the director of health programme and Dr. Babar Kabir, director and Milan Kanti Barua, programme head of BRAC WASH programme for their support and encouragement. Special thanks go to Samir R Nath for helping us in sampling design. We are also thankful to Dr. Mohammad Rafi for his valuable inputs in designing the study. We extend our sincere thanks to Rezwan Islam and Mizanur Rahman (WASH) for their invaluable contribution in designing the research and drafting the survey tools. We also thank Hasanur Rahman, Aroz Ali Joarder, Nazim Uddin, Farid Ahmed, Shahidul Islam and Suaib Ahmed for taking part in training session and field monitoring. Special thanks also go to Md. Mizanur Rahman for doing the hardest job of managing the field activities efficiently. We would like to thank all the enumerators involved in data collection who sometimes even went through the most unfavourable conditions to fulfill their tasks. The painstaking job done by the coding section lead by Swapan Deb Roy needs special acknowledgement in making the authors’ life easier for the data analysis. Thanks to Ms. Maliha Muzammil, intern for her time for going through the whole report and formatting it. We are also thankful to Dr. Moushumi Chaudhury for reviewing the report. Thanks go to Dr. Sheikh Tawhidul Islam for his tremendous support in finalizing the report and producing the GIS maps. Thanks are due to Shamim Ahmed and Tahmid Arif for editing and formatting the report at the final stage. Our sincere thanks extended to Hasan Shareef Ahmed for taking the pain of doing professional editing of this report. Finally, special thanks to Dr. Imran Matin, Deputy Executive Director, Overseas Programme, BRAC for the interest he had and the inspiration he showed for this research.
viii
The Research and Evaluation Division (RED) is supported by BRAC's core funds and funds from donor agencies, organizations and governments worldwide. Current donors of BRAC and RED include Aga Khan Foundation Canada, AusAID, Australian High Commission, Brigham Young University, Bill and Melinda Gates Foundation, BRAC University, NIKE Foundation, Campaign for Popular Education, Canadian International Development Agency, Charities Aid Foundation-America, Columbia University (USA), Conrad N Hilton Foundation, Danish International Development Agency, DEKA Emergence Energy (USA), Department for International Development (DFID) of UK, Embassy of Denmark, Embassy of Japan, European Commission, Fidelis France, GITAC Consult GmbH, The Global Fund, GTZ-Germany, Government of Bangladesh, The Hospital for Sick Children, ICDDR,B Centre for Health and Population Research, ICLARM/World Fish Centre, Institute of Development Studies (Sussex, UK), Inter-cooperation Bangladesh, International Committee of the Red Cross, Japan International Cooperation Agency, International Research and Exchange Board, The Johanriter, Land O Lakes (USA), Manusher Jonno Foundation, Micro-Nutrient Initiative, NORAD, NOVIB, OXFAM America, Plan Bangladesh, The Population Council (USA), RNE/DGIS, Embassy of the Kingdom of the Netherlands, Royal Norwegian Embassy, Scojo Foundation Incorporation, SIDA, Sight Savers, Stanford Medical School, Swiss Development Cooperation, ULG Northumbrain, UNICEF, United Way International, University of Calgory, University of Leeds, University of Manchester (UK), World Bank, World Food Programme, and World Health Organization. RED received wide support and cooperation from all divisions of BRAC, particularly from the field staff and the people of Bangladesh without whose sincere support and patronage no field research could be conducted smoothly. RED also received useful comments, suggestions, and guidance from researchers, reviewers, and editors from within and outside the country, which helped improve the quality of research and research outputs. RED is indebted to BRAC management for its continued support.

WASH baseline findings
1
Introduction Nasima Akter
“Health 101”, which means that once we can secure access to clean water and to adequate sanitation facilities for all people, irrespective of the difference in their living conditions, a huge battle against all kinds of diseases will be won." – Dr. LEE Jong-wook, Director-General, World Health Organization 2004
BACKGROUND
The combination of safe drinking water and hygienic sanitation facilities is a precondition for health and for success in the fight against poverty, hunger, child death, and gender inequality. It is also central to the human rights and personal dignity for all. Water supply and sanitation services, as well as water as a resource, are also critical to sustainable development—from environmental protection and food security to increased tourism and investment, from the empowerment of women and the education of girls to reductions in productivity losses due to morbidity and malnutrition (UNDP 2005). However, inadequate quantity and quality of drinking water, lack of sanitation facilities, and poor hygiene cause millions of the world’s poorest people to die from preventable (primarily diarrhoeal) diseases each year.
1

Introduction
2
According to the World Bank’s Health-Nutrition-Population report (2003) inadequate water, sanitation and hygiene account for a large part of the burden of illness and death in developing countries. Approximately 4 billion cases of diarrhoea per year cause 2.2 million deaths, mostly (1.7 million) children under the age of five, about 15% of all under 5 deaths in developing countries. Diarrhoeal diseases account for 4.3% of the total global disease burden (62.5 million DALYs). An estimated 88% of this burden is attributable to unsafe drinking water supply, inadequate sanitation, and poor hygiene. These risk factors are second, after malnutrition, in contributing to the global burden of disease; intestinal worms infect about 10% of the population of the developing world and can lead to malnutrition, anaemia and retarded growth; 6 million people are blind from trachoma and the population at risk is about 500 million; 300 million people suffer from malaria; 200 million people are infected with schistosomiasis, 20 million of whom suffer severe consequences (World Bank 2003). The impact of inadequate water and sanitation services falls primarily on the poor. Water and sanitation-related sicknesses put severe burden on health services. Contaminated drinking water and an inadequate supply of water cause diseases that account for 10% of the total burden of disease in developing countries (World Bank 2002, 2003). Diarrhoea spreads most readily in environment of poor sanitation where safe water is unavailable. A study shows that water-borne diseases are one of the major cases of under-five mortality, along with pneumonia, malaria, and measles (Talk International 2004). There are several reasons why low levels of safe drinking water and poor sanitation exist. According to Human Development Report (UNDP 2006), poor sanitation can be a result of institutional fragmentation, weak national planning and low political status. Poverty is another barrier to progress: the poorest households often lack the financing capacity to purchase sanitation facilities. This may lead to lack of appropriate and well-maintained excreta disposal facilities, lack of refuse collection, and inadequate control of vectors. Additionally, limited quantity and poor quality of water for hygiene purposes, low level of hygiene understanding, poor hygiene practice (e.g. food contamination from soiled hands), and poor housing and drainage are the reasons that can increase disease prevalence in a community. Other factors also constrain progress, including household demand and gender inequality. Women tend to attach more importance to sanitation than men, but female priorities carry less weight in household budgeting (UNDP 2006). The impact of inadequate water and sanitation services falls primarily on the poor, women, and children who are the main victims of poor health and sanitation due to unsafe drinking water (World Bank 2003). Despite the significance of poor water and sanitation, 2.6 billion people representing half the developing world lack even a simple ‘improved’ latrine and nearly two out of every 10 have no source of safe drinking water. More than 1

WASH baseline findings
3
billion of world population has little choice but to use potentially harmful sources of water (WHO 2004). The consequences of all collective failures to tackle water and sanitation problems have dimmed the prospects for billions of people locked in a cycle of poverty and disease. In adopting the Millennium Development Goals (MDG), the countries of the world pledged to reduce by half the proportion of people without access to safe drinking water and basic sanitation. With the exception of sub-Saharan Africa, many developing countries are well on their way to meet the drinking water target by 2015. However, progress in sanitation is stalled in many developing regions (WHO 2004). Several studies show that, improved hygiene (hand washing) and sanitation (latrines) have more impact than drinking water quality on health outcomes. These practices can reduce diarrhoea, parasitic infections, morbidity and mortality, and increase child growth (Esrey et al. 1991, Hutley et al. 1997). Changing hygiene behaviour is complex. Hygiene promotion is most successful when it targets a few behaviours with the most potential for impact. Based on extensive research, WHO and UNICEF have identified hand washing with soap (or ash or other aid) after defecation and before preparing food; safe disposal of faeces and use of latrines; and safe weaning food preparation, water handling and storage as the key hygiene behaviours. A recent review of all the available evidences suggests that handwashing with soap could reduce diarrhoea incidence by 47% and save at least one million lives per year (World Bank 2003). This is consistent with other studies, which found that 12 hand-washing interventions in 9 countries achieved a median reduction in diarrhoea incidence of 35% (Hill et al. 2001). Quantity of water also has a role to play in hygiene practices. A study found that most endemic diarrhoea is not water-borne, but transmitted from person to person by poor hygiene practices. Therefore, an increase in the quantity of water has a greater health impact than improved water quality because it makes it possible (or at least more feasible) for people to adopt safe hygiene behaviors (Esrey et al. 1996). According to the World Bank (2003), constructing water supply and sanitation facilities is not enough to improve health. Sanitation and hygiene promotion must accompany the infrastructure investments that supply adequate water to realize their full potential as a public health intervention. During 1981-1990, the United Nations initiated the International Drinking Water Supply and Sanitation Decade to promote safe water supplies and sanitation facilities to the poor of the developing countries (Larsimont 1995). The UN declaration reflects the commitment to improve water supply and sanitation coverage for the disadvantaged people lacking such services. Along with many other countries, Bangladesh also committed to provide safe drinking water and sanitary facilities to its people by the year 2000. This however, was an

Introduction
4
unattainable dream. The role of awareness campaigns in promoting tubewells and changing sanitation behaviour has been well documented (Toron 1982, Stanton et al. 1987). But what is not as clearly known is that whether the access to safe water and sanitation among the poorest has increased as a result (Akter and Jakariya 2004). BRAC WATER, SANITATION AND HYGIENE (WASH) PROGRAMME
AND THE BASELINE SURVEY Since 1972, BRAC has been working with its twin objectives of poverty alleviation and empowering the poor with a holistic approach. It has made notable contributions in the field of micro finance, health and education. In order to achieve the MDG (Goal 4 and 7) of reducing child mortality and halving the number of people without sustainable access to safe drinking water and basic sanitation by 2015, BRAC has initiated the Water, Sanitation and Hygiene (WASH) Programme. With the support of the government of Netherlands, BRAC WASH Programme plans to assist in achieving the target set forth by the government of Bangladesh to fulfill the MDG (BRAC 2005). The Programme aims to ensure access to sanitation services that are effectively used by 17.6 million people along with providing education on good hygiene practices to 37.5 million people in 150 upazilas and safe water supply services to 8.5 million people. Programme has started its activities with an inception phase of 6 months since July 2006. Following this, it has started its operations in the first 50 upazilas and eventually in a span of 18 months, will cover 150 upazilas. BRAC plans to achieve its goal through participation and collaboration with people from national to village levels, where hygiene practices will be the backbone of the programme supported by improved sanitation and safe water supplies. Capacity building workshop and training for different stakeholders, including government officials, local representatives and village leaders, will be organized for better and sustainable implementation of the programme. BRAC’s experience in initiating programmes on sustainable and integrated water, sanitation and hygiene practices will allow it to tackle the challenges of ensuring levels of safe drinking water and sanitation. Its past experiences reveal that it is difficult for hardcore poor families to have access to safe water and afford proper sanitation facilities. The WASH programme will particularly address the status and access to safe water and sanitation for the hardcore poor. It will also focus on WASH issues related to socially excluded group such as, the disabled, elderly, and adolescent groups in the community. A unique feature of the programme is to bring different groups of population i.e. men, women, and children under hygiene education and promotion, and sanitation facilities for female students at secondary schools, which are otherwise overlooked. As part of a strong gender orientation, WASH focuses on women in all situations to participate in the programme and raise their voices in decision-making process.

WASH baseline findings
5
The WASH programme is a joint effort of BRAC health, research, and training divisions along with its micro finance, and education programmes. The programme will be considered successful if the access to and practice of safe water, sanitation and hygiene in the community continue beyond the programme period. BRAC has developed a multidisciplinary research team for WASH under its Research and Evaluation Division (RED). RED has always played an important role in the betterment of BRAC programmes. The responsibility of WASH research team is to provide research support to improve the programme and maintain its relevance in addressing challenges of 100% WASH practices in the community (i.e. access to and practice of safe drinking water, sanitation, and hygiene by all people in the community). The important driver of research on WASH in particular is to deliver on the broader intellectual challenge of developing a better understanding of hygiene behaviour and safe water and sanitation practices in Bangladesh. The WASH research team will continue to find challenges that this programme may face and come up with particular strategies to overcome those. A baseline survey was conducted to gather information on different variables of safe water supply, sanitation and hygiene practices of population at selected upazilas under WASH programme. The survey also included information on local educational, social and religious institutions to address the need of the community effectively. This provides background data and insights on the household level practices, which will help to apply suitable strategies for the programme and to assess the effectiveness and success of the WASH programme in the future.
OBJECTIVES OF THE BASELINE SURVEY The broad objective of this study was to know and analyze the baseline information of water, sanitation, and hygiene at WASH areas before implementing the programme. Specific objectives are as follows: Coverage/status • To find out the percentage of people and area under safe water and sanitation-
coverage, both households (HH) and institutes. • To find out the status and access of water sources, different types of latrines,
and defecation practices. • To analyze the various WASH-related attributes and to identify the links with
other social and economic components.

Introduction
6
Knowledge, attitude, and practice (KAP) • To assess existing knowledge, attitude, and practice of hygiene among men,
women, and children. • To find out people’s willingness to change their existing unhygienic
behaviours. Demand • To find out HH’s demand for safe water and sanitation, and willingness to pay
for improved services. Overview of this baseline report Findings of the baseline report are arranged on the thematic area of WASH. All the chapters are independent and self-explanatory. Overviews of the chapters are given in this section. Survey design and methods Out of 150 upazilas, 75 upazilas were selected (50 from first phase and 25 from second and third phase) for the baseline survey considering the geographical variations. The sample size estimation for the household survey followed a multi-stage sampling procedure where each upazila was considered as a cluster. The total sample size for the household survey was 44,993 for the 75 upazilas. In addition, the educational and social institutes were also surveyed for data collection. For the household survey, the respondents were the ‘adult female member of the household’ who had knowledge of her household’s day-to-day activities related to water, sanitation, and hygiene. For educational institutes the respondents were the head of the institutes. In the case of social institutes the respondents were the persons responsible for overall maintenance of the institutes. The baseline information collected on demography, socioeconomic status, access and status of water supply and sanitation, hygiene knowledge, and attitude and practice in study households, educational and social institutes. The baseline survey was carried out during November 2006 to June 2007. Poverty oriented analysis This chapter illustrated the definition of hardcore poor used in this baseline report. Based on that definition a socioeconomic analysis of the surveyed households was done to see the differences among the economic group at WASH area. According to the programme’s definition and criteria, about 18% of the surveyed households belonged to hardcore poor category, about 27% to poor category, and the rest to non-poor category. It was found that about 70% of the

WASH baseline findings
7
hardcore poor household heads have never been to school whereas the corresponding figure for the poor was 54% and for the non-poor was 36%. Most common primary occupation of the non-poor household heads were own or shared agriculture and wage or manual labour was found to be the most common primary occupation of the hardcore poor household heads. This is quite similar to the findings of a recent World Food Programme (WFP 2006) study and the baseline survey on hardcore poor carried out by BRAC RED (Hadi 2004). Disease prevalence (waterborne) among surveyed household heads were 7.5% with a gradual decline in relation to economic status. In conclusion, analysis showed that the definition used in identifying hardcore poor is logically consistent with other discrete indicators of poverty. The correlation between economic status and some of the indicators used such as household head’s occupation, land and homestead ownership is obvious as they were used to identify the hardcore poor in the first place. However, the correlation found between economic status and some other indicators such as household size, household head’s education, prevalence of waterborne diseases, access to electricity and dwelling condition of the household show that the definition is very much consistent with common socioeconomic theories and empirical findings. This analysis and results have been used in other chapters to analyze water, sanitation, and hygiene status among study population from poverty perspective. Socio-demographic profile This chapter described the socio-demographic status at BRAC WASH areas before initiating interventions to identify the target audience, appropriate actions and effective approaches of WASH interventions. This chapter included household population (with household composition, age and sex distribution, marital status, education, and occupational variation), specially focused group (disabled, adolescents and elderly population), and disease prevalence among the study population. The total population of surveyed households was 210,968 and the average family size was 4.69. The average family size of hardcore poor was lower than non-poor group. Among the surveyed population, female members constituted 50.6%. According to this survey, 37.8% of the total population was 15 years or less and 4.6% was 65 years or older. That made the dependant population of 42.4%. Of the study population, 46.8% were married with very little difference across gender. It was found that 34.9% of the adult male members were unmarried, the corresponding figure for females was 21.4%. Survey found 56% of the rural population (5+ of age) attended schools. However, 44% of the total population was still uneducated (i.e. who have not attended school or did not pass grade-1). In most levels of education, males have a better standing than females. It is

Introduction
8
intuitive for a couple of reasons (at higher levels of education); firstly, rural women usually get married by the time they are capable of taking HSC exams or beyond, and secondly, the government support for post Secondary School Certificate (SSC) examination is limited for women. However, there seems to be a wide disparity in the levels of education across the poverty groups. A hardcore poor person is 14 percentage points more likely to be uneducated than a non-poor person. Among the respondents, 87% completed their study from formal educational institutes followed by religious schools (7.8%) and non-formal education (4.3%). From the perspective of educating pupils about hygiene it would be better or more fruitful to focus on the formal schools (especially primary and secondary). In terms of occupation, the responses were aggregated into eight broad categories. It can be observed that in activities that require ownership of land or capital, the hardcore poor people’s involvement have been drastically lower than the non-poor people. Thus, it is not surprising that most of the hardcore poor involvement has been in areas requiring labour The elaborations of ‘specially focused groups (SFG)’, on some WASH-related attributes may help design and deploy appropriate interventions to address the special needs of these SFGs. It was found that 0.86% of the total population reported some kind of disability. Of which 63.9% were physical disability (physical disability refers to only those which pose problems for the proper usage of latrines). Based on our study definition (age between 10-19 years), adolescents account for more than 22% of the surveyed population. Thus, it is crucial to cater specific WASH educational packages towards this group. It must be noted that adolescence is an important time for females with regard to feminine hygiene. According to this study 15097 elderly people (age above 60 years) account for 7.2% of the total population. They may need special attention when selecting sanitation technology. The disease prevalence was 14.6%. The prevalence was much higher on children than on the adult population, 31.6% and 12.1% respectively. Sixty-five percent of the total disease prevalence can be attributed to waterborne and fecalborne diseases. The hardcore poor are more likely to be sick than the non-poor population. The hardcore poor were more prone to waterborne and fecal borne diseases than the non-poor, given the differences in their hygiene practice. Status of safe water The access to tubewell water for drinking was 98.1%. However, majority of these tubewells were not tested for arsenic contamination, leaving the users of those tubewells prone to various arsenic-related ailments, signifying knowledge gap regarding ingestion of arsenic contaminated and the contraction of arsenic-related diseases. On the other hand, it was reported that 91.5% of the tubewells were functional. The households also got sufficient levels of water in both dry and

WASH baseline findings
9
rainy season, but certain sections of the society were not happy with the quality of their water supply. Female members in most of the households were responsible for collecting water to use for household works. Women members in the household also played a vital role in cleaning tubewell’s platform on regular basis in most cases. However, in the context of large-scale contamination of tubewells with arsenic, it is advisable to have an immediate concern in providing safe water free from arsenic as well as other chemical and bacteriological contamination. The technology to provide safe water should have features that are desirable in any water supply system including pond sand filter and rain-water harvester. Sanitation status The study found out that about 32% of the study households used sanitary latrines, 39% of study population used latrines with broken water seal and 29% defecated in open spaces. Of the existing latrines, in most cases (66%), it was found that the latrines were foul smelling and had fecal matter in them. This was not surprising given the low availability of water in or near the latrine. Knowledge gaps also existed in the usage of sanitation facilities e.g. 59% of the respondents claimed to clean their latrines regularly, but only 34% of the latrines were found clean during spot observations. Similarly there was an existence of perception practice gap. Ninety-one percent of the people responded that the use of sandals in latrines as hygienic, but in 96% of the cases no sandals were found near latrines. Thus, gaps exist in both knowledge and between perception and practice. The study also identified that the main reason for not using latrines is economic (64%). In order to achieve the MDG targets that were set at the beginning of the programme, the WASH programme should aim to increase the access to sanitary latrines and improving the quality of latrines. However, providing economic incentives to the right agents would be vital in achieving an overall improvement across all the economic sections of the society. Hygiene status Level of hygiene awareness as well as personal hygiene and sanitation practices was found to be poor. Awareness about the cycle of disease transmission was fragmentary as revealed by giving less importance to the contamination potential of children’s stool or washing hands at critical times. Apparently, germ theory of disease has very little relevance in this population and most of the women thought that water is contaminated by dirt, etc. only. The programme need to focus on these aspects and build up community knowledge and awareness about the cycle of disease transmission and how to break that cycle, including the importance of washing hands with soap or some other disinfectants in breaking this cycle.

Introduction
10
WASH status at institutes In the educational and social institutes the situation was the same- poor levels of access to safe water and safe sanitation. Most schools reported that tubewells were the main source for their drinking water, but in most cases these tubewells were not tested for arsenic contamination. However, 75% of the students reported to wash their hands with soap after defecation, but given that the greater proportions of the diseases reported were fecal or waterborne (around 60%) this statistics was baffling. About half of the social institutes reported to use sanitary latrines. All social institutions except pagodas need much hardware support towards adequate latrine coverage. Although most of the institutes owned tubewells, hygiene practices were very poor in social and religious institutes. It is known that social and religious institutions have strong influence on many communities of rural Bangladesh. Hence, targeted interventions to address the key needs may have an impact on improving the water, sanitation and hygiene conditions and practices of communities.
CONCLUSION In both the cases of water and sanitation the status of the hardcore poor households were worse than that of the non-poor. Given the low quality water and sanitation facilities available to them, there is an overwhelming demand for both sanitary latrines and safe water sources if proper prices and credit facilities were set. It is interesting to note that almost similar state of awareness and practices were observed across the households, irrespective of its poverty status. Thus, any knowledge and awareness building interventions on water, sanitation and hygiene must adopt a community approach, and not rely on the common assumption that higher SES is associated with better knowledge, etc. To achieve this, in-depth qualitative studies are needed for contextualization of their current behaviour. Informed by these formative studies, a culture and context sensitive hygiene intervention may be developed which will fit into the overall framework of thinking of the respondents and will be more acceptable and effective. Therefore, it is imperative that in every sector of the country, the level of sanitation is poor and the access to safe water is dubious. Thus, the intervention that BRAC is going to carry out with its WASH programme is justified and timely. Hopefully, by the end of the intervention, the status of water, sanitation and hygiene will greatly improve.
WASH baseline findings
11
Survey Design and Methods Kazi Faisal Bin Seraj In line with the programme interventions three primary sampling units namely household, educational institute and social institute were identified for the survey. Information on water, sanitation, hygiene and other demographic and socioeconomic variables for each sampling unit was collected using structured questionnaires. The baseline survey was carried out during November 2006 to June 2007. Selection of upazilas The BRAC WASH programme started its operation in three phases where each phase consisted of 50 upazilas. In selecting upazilas for the baseline survey, we took all the 50 upazilas from the first phase of the programme and carried out the survey. The baseline survey was subsequently conducted in another 25 upazilas to supplement the previously selected upazilas by representing all the geographic variations within the programme areas. Thus, the total number of upazilas covered by the baseline survey was 75 (Table 2.1 and Map 2.1), exactly half of the total upazilas covered by the programme. Sampling procedure for the household survey The sample size estimation for the household survey followed a multi-stage sampling procedure where each upazila was considered as a cluster. The level of
2
Survey design and methods
12
significance was set at 5% with admissible error of 5% and design effect of 1.5. Considering the maximum possible ratio of 50% the sample size estimated for the survey was 576 for each upazila, which was rounded to 600 for distributive convenience. The total sample size for the household survey was thus calculated to be 45,000 for the 75 upazilas (Fig. 2.1). The estimated sample size was distributed among 30 villages of each upazila. In selecting the villages, interval-sampling method was used. In the first stage, all the villages within an upazila were listed. In the second stage, the interval size was estimated by dividing the total number of villages within an upazila by 30. The first village was selected randomly from the first interval to avoid systematic bias and the consecutive villages were selected using the estimated interval size. Interval sampling procedure was used once again to select 20 households within each village. Table 2.1 Surveyed upazilas
District Upazilas District Upazilas First phase (50 Upazilas)
Jessore Bagherpara Monirampur Keshabpur
Jhikargacha Sharsha Khulna
Dighulia Dumuria Fultala
Rupsha Batiaghata
Mymensingh Trishal Sadar Gaffargaon
Bhaluka Gouripur Haluaghat
Bogra
Sadar Shibgonj Kahaloo Dupchachia Sonatala Sariakandi
Mazira Nandigram Sherpur Gabtali Dhunat Adamdighi
Dinajpur
Birgonj Biral Bochagonj Kaharole Fulbari
Birampur Nawabgonj Ghoraghat Parbatipur Hakimpur
Panchagar Atwari
Thakurgaon Pirganj Ranisankail Haripur Nilphamari Domar
Sadar Saidpur
Feni Parshuram Chagalnaiya Fulgazi Noakhali Senbag Sonaimuri
Second phase (25 Upazilas) Bagerhat Rampal Kustia Bheramara Meherpur Mujibnagar Rajbari Pangsha Netrokona Kendua Barhattta Gopalganj Tungipara Kashiani Faridpur Bhanga Sadarpur Shariatpur Vadharhonj Manikgonj Shibalaya Chandpur Sadar Shaharasti Chttagong Anowara Sitakunda Cox’s Bazar Ramu Ukhia Maulovibazar Sremongol Habigonj Chunarughat Sylhet Bianibazar Jaintapur Sunamgonj Jagannatpur Pabna Ishwardi Kurigram Bhurungamari

WASH baseline findings
13
Educational and social institutes In parallel to the household survey educational and social institutes were also surveyed for data collection. For each village a list was made of all the educational and social institutes. The listed institutes were then separated into typical categories. In case of educational institutes, they were separated into primary school, junior high school, high school, college, BRAC school, other community and non-formal school, and madrasa and other religious school. For social institutes the main categories were mosque, temple, church, pagoda, and permanent club or community center. Once the institutes were categorized the largest institute from each category was selected for the survey.

Survey design and methods
14
Map 2.1. WASH baseline survey areas
N
Not to Scale
Upazilas out of WASH pro g r a m m e Surveyed upazilas (75)Upazilas not under survey ( 7 5 )
BRAC Water, Sanitati o n and Hygiene (WASH) Pro g r a m m e

WASH baseline findings
15
Figure 2.1. Sample selection Respondents For the household survey, respondents were the ‘adult female member of the household’ who had knowledge of her household’s day-to-day activities related to water, sanitation, and hygiene. The choice of a female respondent was based on the fact that they are usually responsible for collecting and storing water and for maintenance of latrines. Another reason for choosing female respondents was because of WASH programme’s wider objective of promoting household hygiene practice through the female members of the households. For the information on income and assets including land holdings, enumerators were instructed to consult the household head. For educational institutes the respondent was the head of the institute or the acting head of the institute. In case of social institutes the respondent was the person responsible for overall maintenance of the institute. Questionnaire development A multidisciplinary WASH research team developed the questionnaire for the baseline survey. Each section of the questionnaire was prepared in consultation with appropriate specialists within RED. The questionnaire primarily focused on collecting baseline information on demography, socioeconomic status, access and status of water supply and sanitation, hygiene knowledge, attitude and practice in study households, educational and social institutes. The draft questionnaire was
75 Upazilas
30 Villages
20 Households
45,000 Households
Social and Educational
Institutes
+

Survey design and methods
16
also presented in front of the concerned programme and sector specialists of BRAC for feedback and comments. The draft questionnaire was pre-tested extensively in the field. The pre-test was essential in finalizing the structure of the questionnaire and writing it in the language most applicable for the survey areas. The pre-test findings also helped in setting appropriate codes for some of the questions. Timing of filling each questionnaire was recorded to determine average time to conduct a full-length survey. The final draft questionnaire once again went through some internal and external reviews before it was finalized. Enumerators Selection criteria for the enumerators were based on previous experience and educational qualifications. The selected enumerators went though a week-long rigorous training in the head office followed by a field test to acclimatize with the survey procedure and questionnaire. Data collection and quality control The enumerators were divided into groups with four members in each group. A typical group consisted of two female members and two male members. Within the four members, one was selected to be the team leader (Fig. 2.2). In addition, 10 supervisors were selected and trained separately who then took responsibility of two groups each. The assignment for each group was to cover 20 households per day and the required number of educational and social institutes. Enumerators were instructed to complete all the questionnaires in the field and cross-check each other’s questionnaires before finalizing the days work. The supervisor’s duty was to spend a week in each of his assigned group. During their stay they went through all the questionnaires to identify any inconsistencies and re-interviewed the inconsistent questionnaires. In addition they were also told to verify 5% of the previous weeks filled up questionnaires. In parallel, field managers from the head office made their scheduled visits to the field. In general they would check quality of each interviewer by randomly picking twelve completed questionnaires of a particular day and visit the field to verify answers of some previously selected questions. They were provided with a structured checklist and reported back to the head office with their findings. The responsibility of the field coordinator was to supervise overall field activities. Field coordinator was the contact person for the WASH research team and would document all the enquiries from the field for immediate dissemination

WASH baseline findings
17
to the concerned researchers. The field coordinator also kept a log book of field activities. Figure 2.2. Field coordination Data coding and entry Questionnaires from the field were collected and submitted for coding at the coding section of RED. The coded questionnaires were then sent to the computer section of BRAC for entry. After entry data were sent back to RED, 20% of the data were rechecked to identify any inconsistencies. Once rechecked, the data were disseminated to researchers for analyses.
Research team
Field coordinator
Field supervisors
Team leaders
Group members
Field managers

WASH baseline findings
19
Towards a Poverty Oriented Analysis of Water, Sanitation and Hygiene Kazi Faisal Bin Seraj
INTRODUCTION Reaching the poor, especially the hardcore poor, has been set as a key theme of BRAC Water, Sanitation and Hygiene (WASH) programme. In fact, it is one of the ‘red thread’ against which the success of the programme will be evaluated when the programme ends. The idea behind such a pro-poor approach is to bring about positive changes in the lives of the poor and hardcore poor through special programmes and financial strategies at both micro and macro levels. However, one might ask why it is necessary to treat the hardcore poor as a special group and whether it is really important to mobilize resources to improve their water, sanitation, and hygiene status. Some questions that may naturally follow are what is the existing situation of WASH in the programme areas in the perspective of economic condition of the households? Is there any real difference in WASH between the groups in the programme areas? How can we, in quantifiable term, monitor the progress of the programme in closing the gap between the poor and the non-poor? Baseline surveys are instrumental in answering such questions.
3

Towards a poverty oriented analysis of water, sanitation and hygiene
20
In line with the targets of the WASH programme, this baseline survey report intends to analyze water, sanitation, and hygiene from a very tangible poverty perspective. Efforts have been made to put forward evidences that will help explore the poverty dimensions of WASH in a very concrete way. Collectively, information from baseline surveys can be used in setting targets, defining indicators, monitoring progress towards goals, and evaluating specific programmes and projects for desired outcomes (Bosh et al. 2000 and Prenusshi et al. 2000 cited in WB 2006). From programme evaluation perspective, which is essentially one of the vested interests of BRAC RED, such start-line information will help in the long-term evaluation studies and generating further research hypotheses. It will also provide the programme with invaluable information needed to formulate policies that target the poor population in the most effective ways. The criteria used for defining hardcore poor in this baseline report stems from the indicators used by the programme to identify the hardcore poor at the field level. The primary objective of this chapter is to introduce the readers to the definition of hardcore poor used in this baseline report. A secondary objective of this chapter is to carry out a socioeconomic analysis of the surveyed households based on the definition elicited. Such analysis is not only important to comprehend the extent of differences that exist within the economic groups, but will also help in cross-checking the validity of the definition used against some discrete indicators.
DEFINING THE HARDCORE POOR Depending on the method used, poverty estimation in Bangladesh can differ significantly. Bangladesh Bureau of Statistics (BBS) of the government of Bangladesh (GoB) uses Cost of Basic Needs (CBN) as its preferred method for estimating poverty. The method is based on the estimated cost of the bundle of goods adequate to ensure that basic needs are met. In practice, the cost of the food basket necessary to attain the minimum energy intake is first calculated and an allowance for non-food expenditure is then added. Though CBN is the preferred method adopted by BBS, it also reports a food-intake based estimate of poverty in its five-yearly reports on household income expenditure survey (HIES). According to the HIES-2005 (BBS 2007), the national poverty estimate of Bangladesh ranges from 14% to 44% (Table 3.1).

WASH baseline findings
21
Table 3.1. Poverty estimates by Bangladesh Bureau of Statistics (BBS)
HIES 2005 HIES 2000 Variables National
(%) Rural (%)
Urban (%)
National (%)
Rural (%)
Urban (%)
Less than 2122 kcal/person/day 40 39 43 44 42 53
Less than 1805 kcal/person/day 19 18 24 20 19 25
Upper poverty line head count (CBN method) 40 44 28 49 52 35
Lower poverty line head count(CBN Method) 25 29 14 34 37 19
Source: Household income & expenditure survey 2005 (BBS 2007) World Food Programme (WFP) Bangladesh has recently conducted a study to develop a socioeconomic profile of the six priority regions of Bangladesh based on a logical framework of the linkages between food security, nutritional status, livelihood, and socioeconomic indicators (WFP 2007). The study has identified four discrete socioeconomic classes of households that range from non-vulnerable household to highly vulnerable households. Table 3.2 shows that the percentage of highly vulnerable households was found to be about 15% by the WFP study. Table 3.2. Poverty estimates by World Food Programme (WFP)
Economic status Percentage Non-vulnerable household 16 Households on the edge 37 Vulnerable households 32 Highly vulnerable households (The invisible poor) 15 Source: WFP 2007
The WASH programme has its own working definition of hardcore poor, which is similar to definitions used by other BRAC programmes. Using information on land holding of the household and demographic information of the household head, the field staff can identify the hardcore poor households in a very convenient way. In general, the households are judged against some pre-identified indicators of poverty to be called hardcore poor. Table 3.3 shows the indicators that have been used by the WASH programme to identify hardcore poor households. A household is considered hardcore poor if it satisfies at least two of the last three conditions mentioned in Table 3.3 and an additional condition from the rest of the criteria mentioned.
Towards a poverty oriented analysis of water, sanitation and hygiene
22
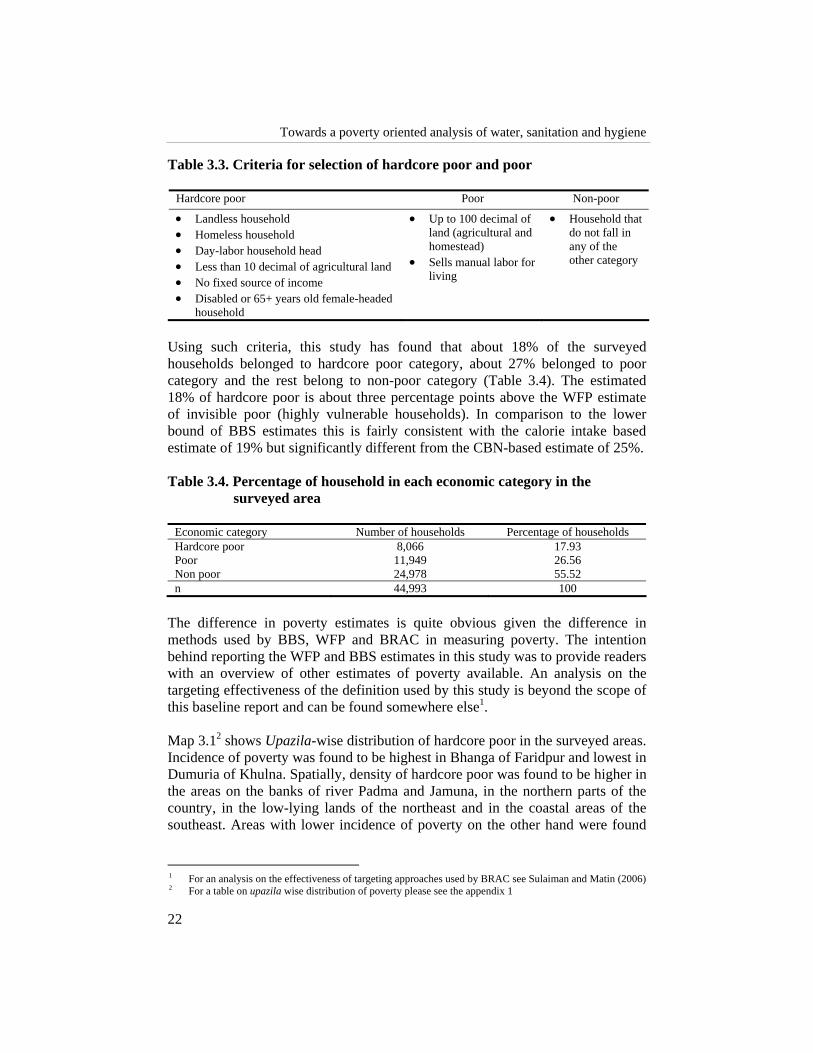
Table 3.3. Criteria for selection of hardcore poor and poor
Hardcore poor Poor Non-poor
• Landless household • Homeless household • Day-labor household head • Less than 10 decimal of agricultural land • No fixed source of income • Disabled or 65+ years old female-headed
household
• Up to 100 decimal of land (agricultural and homestead)
• Sells manual labor for living
• Household that do not fall in any of the other category
Using such criteria, this study has found that about 18% of the surveyed households belonged to hardcore poor category, about 27% belonged to poor category and the rest belong to non-poor category (Table 3.4). The estimated 18% of hardcore poor is about three percentage points above the WFP estimate of invisible poor (highly vulnerable households). In comparison to the lower bound of BBS estimates this is fairly consistent with the calorie intake based estimate of 19% but significantly different from the CBN-based estimate of 25%. Table 3.4. Percentage of household in each economic category in the
surveyed area
Economic category Number of households Percentage of households Hardcore poor 8,066 17.93 Poor 11,949 26.56 Non poor 24,978 55.52 n 44,993 100
The difference in poverty estimates is quite obvious given the difference in methods used by BBS, WFP and BRAC in measuring poverty. The intention behind reporting the WFP and BBS estimates in this study was to provide readers with an overview of other estimates of poverty available. An analysis on the targeting effectiveness of the definition used by this study is beyond the scope of this baseline report and can be found somewhere else1. Map 3.12 shows Upazila-wise distribution of hardcore poor in the surveyed areas. Incidence of poverty was found to be highest in Bhanga of Faridpur and lowest in Dumuria of Khulna. Spatially, density of hardcore poor was found to be higher in the areas on the banks of river Padma and Jamuna, in the northern parts of the country, in the low-lying lands of the northeast and in the coastal areas of the southeast. Areas with lower incidence of poverty on the other hand were found
1 For an analysis on the effectiveness of targeting approaches used by BRAC see Sulaiman and Matin (2006) 2 For a table on upazila wise distribution of poverty please see the appendix 1

WASH baseline findings
23
very much sporadic all around the surveyed regions with a heavier concentration in the southwest, in Bogra, and Comilla-Feni region. Map 3.1. Density of hardcore poor in the surveyed upazilas
R A N G A M A T I
S Y L H E T
TANGAIL
B O GRA
B A N D A R B A N
K H ULNA
COMILLA
P A BNA
D I N A J P U R
N A O G A O N
MYMENSINGH
SUNAMGANJ
CHITTA G O N G
J E S S O R E
S A T K H I R A
HABIGANJR A J S H A H I
R A N G P UR
NETRAKONA
N A T O R E
DHAKA
S I RAJGANJ
BAGERHAT
KURIGRAM
BHOLA
FARIDPUR
NOAKHALI
FENI
K U S H T I A
JAMALPUR
MAULVIBA Z A R
GAZIPUR
G AIBANDHA
KISHOREGANJ
J H E N A I D A H
KHAGRA C H H A R I
COX ' S B A Z A R
CHANDPUR
N I L P H A M A R I
SHERPUR
N A W A B G A N J
NARAIL
RAJBARI
T H A K U R GA O N
GOPALGANJ
M AGURA
MANIKGANJ
BARISAL
BRAHAMANBARIANARSINGDI
P A N C H A G A R H
SHARIATPURMADARIPUR
LAKSHMIPUR
C H U A D A N G A
L A L M O N I R HAT
J O Y P U R H A T
MUNSHIGANJ
PATUAKHALI
M E H E R P U R
PIROJPUR
BARGUNA
NARAYANGANJ
JHALOKATI
1st Quartile (<14 % ) 2nd Quartile (14 - 1 8 % ) 3rd Quartile (18 - 2 2 % ) 4th Quartile (>22 % )
Density of Hardcore Poor
N
Not to Scale

Towards a poverty oriented analysis of water, sanitation and hygiene
24
SOCIOECONOMIC PROFILE OF THE SURVEYED HOUSEHOLDS Household composition Hardcore poor households tend to be smaller in size and tend to have a large number of female-headed households (Halder 2000, Hadi 2004). In general, for the surveyed households, hardcore poor households were found to have lesser number of members compared to non-poor households (Table 3.5). There is also a significant difference in the percentage of female-headed households between the compared groups. Compared to about 25.5% female-headed households in the hardcore poor group, the non-poor group had only about 8% female-headed households. Education of the head of the family Education and standard of living has a correlation (Islam 2007, Hadi 2004, Hossain and Hossain 1995). In addition to standard of living, education is also an indicator of status in the community. About 47% of the surveyed households had household heads who had never been to school. This figure is even more staggering if only hardcore poor households are considered. About 70% of the hardcore poor households were headed by members who had never been to school. However, the situation somewhat improves with the economic condition, e.g. 54% for the poor and 36% for the non-poor. Table 3.5. Household heads information
Types of households
Hardcore poor Poor Non-poor All National rural
estimates Average household size 4.19 4.5 4.94 4.69 4.89 % female headed HH 25.32 7.24 8.06 10.94 10.67 HH head’s education % did not pass class I (%) 69.60 54.12 35.86 46.76 55.39 Primary occupation % in agriculture (own/shared) 1.41 17.65 44.86 29.85 28.7 % in wage/manual labor 70.67 59.62 6.21 31.95 31.3 % in business 2.17 10.13 23.26 15.99 17.3 % Suffered from water-borne disease in last 15 days
8.95 7.98 7.29 7.77 ---
n 8,066 11,949 24,978 44,993 6,400 Source: BBS (2007) estimates for rural households
Occupation of the household head Own or shared agriculture was found to be the most common primary occupation of the non-poor household heads and wage or manual labour was found to be the

WASH baseline findings
25
most common primary occupation of the hardcore poor household heads. This is quite similar to the findings from the recent WFP (WFP 2006) study and the baseline survey on hardcore poor carried out by RED (Hadi 2004). Of the total surveyed hardcore poor households, only a meager 1.41% was found to be involved in own or shared agricultural activities compared to about 45% for the non-poor households. On the other hand, in case of wage or manual labour, involvement of the hardcore poor households (70.5%) was found to be more prominent than the involvement of the non-poor households (6%). Business was found to be a primary occupation of about 23% of non-poor households, about 10% of the poor households and only about 2% of the hardcore poor households. Disease occurrence Morbidity of the household heads can be considered as an indicator of economic hardship due to productive days lost (Hadi 2004). The WASH baseline survey collected information on whether the household members suffered from any water-borne diseases in the last 15 days. In general, 7.5% of the surveyed household heads had some sort of water-borne diseases in the last 15 days with a gradual decline in disease prevalence in relation to economic status. Land ownership Historically in Bangladesh land poor are the poor in general and there was always a strong negative correlation between land ownership and incidence of poverty (BBS 2007). This study has also found a highly significant difference in land ownership between the compared economic groups. This is quite expected, given the criteria used for separating the hardcore poor from the non-poor was mainly based on land ownership. Almost all the hardcore poor households identified were found to be landless (Table 3.6). Interestingly percentage of landless household is greater in the non-poor category (35%) compared to poor category (28%). Table 3.6. Land ownership, asset holding and living status
Types of households Hardcore poor Poor Non-poor All % Household without any cultivable land 99.40 28.04 35.35 44.89 % Household with less than 10 decimal of cultivable land
99.86 29.94 37.07 46.43
% Household not owning their homestead 24.08 8.08 6.97 10.33 Complete bedding (bed, mosquito net, blanket)
62.73 80.12 89.21 82.05
Have electricity 18.27 28.19 43.03 34.65 n 8,066 11,949 24,978 44,993

Towards a poverty oriented analysis of water, sanitation and hygiene
26
Dwelling condition Housing status is an indicator that is sensitive to the poverty scale. A comfortable housing condition with sufficient energy need is also key to a healthy life. In case of homestead ownership in the study areas, it was found that about 10% of the households do not own their homestead. Compared to other two groups, the percentage point of homestead ownership is three times less for the hardcore poor households. Overall about 82% of the households were found to have complete bedding; that is they have beds, mosquito net and blanket available at home. Electricity coverage was found to be about 34.5% and there exists a significant difference in electricity coverage among the economic groups. While the non-poor households had about 43% electricity coverage, it was only about 18% for the hardcore poor households.
PERCEIVED ECONOMIC STATUS The measurement of poverty in this study was based mainly on land holding and socio-demographic profile of the household heads. One limitation of this study is that we did not collect any information on household yearly income and expenditure. Thus, a comparison with poverty estimate based on income-expenditure is beyond the scope of this report. However, we asked the respondents about how they perceived their economic condition last year and whether there had been any improvement in economic condition compared to the preceding year. This essentially gives an opportunity for a comparison between subjective and objective measurement of poverty. Based on their income and expenditure, about 10% of the households reported to have experienced deficit all the year while about 30% reported of occasional deficit (Table 3.7). Percentage of households experiencing deficit was found to be significantly higher for the hardcore poor households compared to the poor and non-poor households. In general, higher percentage of poor and non poor households reported to have surplus or at least no deficit in the last year compared to the hardcore poor households. Table 3.7. Perceived economic status
Types of households (%) Hardcore poor Poor Non-poor All Deficit all the year 27.39 10.33 5.04 10.45 Occasional deficits 38.53 35.40 24.58 29.95 No deficit and no surplus 27.60 38.28 38.90 36.71 Surplus 6.48 15.99 31.48 22.89 Situation improved 19.74 32.64 43.29 36.24 No change 52.43 46.29 40.41 44.12 Deteriorated 27.83 21.07 16.30 19.64 n 8,066 11,949 24,978 44,993

WASH baseline findings
27
About 36% of the households reported to have an improvement and about 44% reported no change in economic situation. The percentage of households that reported at least no change in economic condition was significantly higher for the non-poor and poor groups compared to the hardcore poor group. The reverse was true in case of the percentage of households who reported to have experienced deterioration in economic status. In comparison to the poor and non poor households a significantly higher percentage of households from the hardcore poor households reported to have experienced deterioration in economic status.
CONCLUSION One of the objectives of this chapter was to introduce readers with the definition of hardcore poor that has been used for analyzing poverty dimension of WASH programme in the following chapters. Using the criteria used to identify hardcore poor by the programme, this study found about 18% of the surveyed households belonged to the hardcore poor category. Though the number-wise estimate from this study seems quite consistent with other poverty estimates available, further analysis is needed to examine targeting effectiveness of the criteria used to identify hardcore poor. In general, it was found that the definition used to identify hardcore poor is logically consistent with other discrete indicators of poverty. The correlation between economic status and some of the indicators used such as household head’s occupation; land and homestead ownership is obvious as they were used to identify the hardcore poor in the first place. However, the correlation found between economic status and some other indicators such as household size, household head’s education, prevalence of water-borne diseases, access to electricity and dwelling condition of the household show that the definition is very much consistent with common socioeconomic theories and empirical findings. Finally, a comparison between the subjective and objective measurements of poverty shows that the higher percentage of households who reported to have any sort of deficit in the last year belonged to the hardcore poor group compared to the poor and non-poor groups. A significantly higher percentage of households belonging to the hardcore poor group also stated that their economic situation in the last year have deteriorated compared to the previous year’s condition. This shows a very high correlation between the subjective and objective measurements of poverty for the household surveyed.

WASH baseline findings
29
Socio-Demographic Profile Nasima Akter and Ananta Z. Neelim
INTRODUCTION
Total population of Bangladesh was over 143 million during 2002 (Earth Trends 2003) and estimated to reach over 158 million by mid 2007 (UN 2006) in only 55,100 square miles of land. Bangladesh is one of the most densely populated countries in the world. It has a shortage of natural and social resources and more importantly access to basic services. However, water and sanitation access is quite impressive compared to the global average shown in Earth Trends (2003), as access to improved sanitation1 was 71% in urban and 41% during 2000 in rural areas compared to the world access of 85% and 40% respectively. Similarly access to an improved water source2 was 99% in urban and 97% in rural areas where corresponding figures for the world were 95% and 71% respectively. However, these figures do not reflect the real situation of the country at present. Definition of improved sanitation and water used has been changed or improvised to meet the quality of life, environment and health. Moreover, increasing trend of population growth, demand for basic needs and services, and
1 Improved sanitation includes any of the following excreta disposal facilities: connection to a public sewer,
connection to a septic tank, pour-flush latrine, simple pit latrine, and ventilated improved pit latrine. 2 An improved water source includes any of the following types of drinking water sources: household
connections, public standpipes, boreholes, protected dug wells, protected springs, and rainwater collection. At least 20 liters per person per day of this water must be available within one kilometer of a user's dwelling.
4

Socio-demographic profile
30
decreasing trend of environmental resources and access give room for further thinking and action. Any kind of intervention for the community needs basic socio-demographic information about that area to identify the target audience, appropriate actions and effective approaches. Therefore, this study aims to know the baseline socio-demographic status at BRAC Water Sanitation and Hygiene (WASH) programme areas before initiating interventions.
METHODS This chapter described the basic socio-demographic information of selected WASH programme areas such as family structure, age and sex distribution, education, marital status, occupational pattern, status of specially focused group (e.g. adolescent, elderly, disabled) and diseases prevalence. Data for this chapter were extracted from the baseline survey conducted during November 2006 to June 2007 at 75 upazilas of WASH area. It should be noted that household population was considered as the primary unit for analysis.
RESULTS AND DISCUSSION Household population Household composition A household is defined as a person or a group of people who live together and share food from the same kitchen (cook stove). This survey was based on 44,993 households3. Thus, it included 44,993 (21.3 %) household heads, 39,741 (18.8%) of the spouses of the HH heads, 94,560 (44.8%) of HH heads’ children, 8,300 (3.9 %) of HH heads’ parents, 3,701 (1.8 %) of HH heads’ siblings and 19,673 (9.3 %) other relatives or servants. Household composition is shown in figure 4.1. The total population, thus surveyed was 210,968 leading to a family size of 4.69. According to HIES 2005 (BBS 2007), the average family size was 4.85, which is quite similar to that in the WASH areas. Details of household composition at WASH areas are shown in appendix 2.
3 Though the estimated sample size was 45,000, seven households were dropped because of data
inconsistencies leading to a final figure of 44,993.

WASH baseline findings
31
Figure 4.1. Household composition at surveyed WASH area
2%4% 9% 21%
19%45%
Head
Spouse
Children
Parents
Siblings
Others
Most of the households had three to six members in the family (Table 4.1), 1% of the households had single member while very few households had 10 to 15 members in the family. Proportion of single member households were found higher (3.2%) in hardcore poor group compared to poor (0.6%) and non-poor (1.0%) groups. However, the average family size of hardcore poor was lower than non-poor group shown in Table 4.1 below. Table 4.1. Household composition by economic group among study
population
Hardcore poor Poor Non-poor Total Number of family members % % % %
1 3.2 0.6 0.4 1 2 12 6.3 5.4 6.8 3 21.4 19.2 15.8 17.7 4 25.1 29.6 25.4 26.5 5 18.6 22.3 21.7 21.3 6 10.6 12.3 14.2 13.1 7 5.1 5.6 7.8 6.7 8 2 2.3 4.1 3.3 9 1.1 0.9 2.2 1.7 10 0.4 0.4 1.3 0.9 11 0.2 0.3 0.9 0.6 12 0.1 0.1 0.3 0.2 13 0 0 0.2 0.1 14 0 0 0.2 0.2 n 8,066 11,949 24,978 44,993 Average family size 4.19 4.50 4.94 4.69

Socio-demographic profile
32
Age and sex distribution The distribution of household population over the 75 surveyed upazilas is presented in Table 4.2. Among the surveyed population, female members constituted 50.6%. This difference is more prominent in the age groups of 15-30, that might be due to emigration for employment among men. Population distribution among different age group show that, more people belong to the younger age groups for both sexes (Figures 4.2 and 4.3). According to this survey, 37.8% of the total population was <15 years old, this figure is higher than the national estimate of 36.7% (BBS 2007). On the contrary 4.6% of the total surveyed population was >65 years old (Corresponding HIES figure equal 4.3%). The key drivers of this trend can be attributed to the lower life expectancy and the decrease in child mortality that was observed in Bangladesh over the years (BRAC 2006). Table 4.2. Population distribution by age and sex at selected upazilas
(N=210,968)
Description Male (%) Female (%) Both (%) Under 5 14.2 13.2 13.7 0 to 4 11.9 11.2 11.5 5 to 9 12.4 11.7 12.1 10 to 14 12.3 11.4 11.9 15-19 10.2 10.9 10.6 20-24 6.8 9.5 8.2 25-29 7.1 8.8 8.0 30-34 6.5 6.7 6.6 35-39 6.5 6.7 6.6 40-44 5.4 5.3 5.3 45-49 5.5 5.1 5.3 50-54 4.2 3.9 4.0 55-59 3.1 2.5 2.8 60-64 2.9 2.2 2.5 65-69 1.9 1.4 1.6 70-74 1.6 1.2 1.4 75-79 0.7 0.5 0.6 80 to above 1.0 1.0 1.0
WASH baseline findings
33
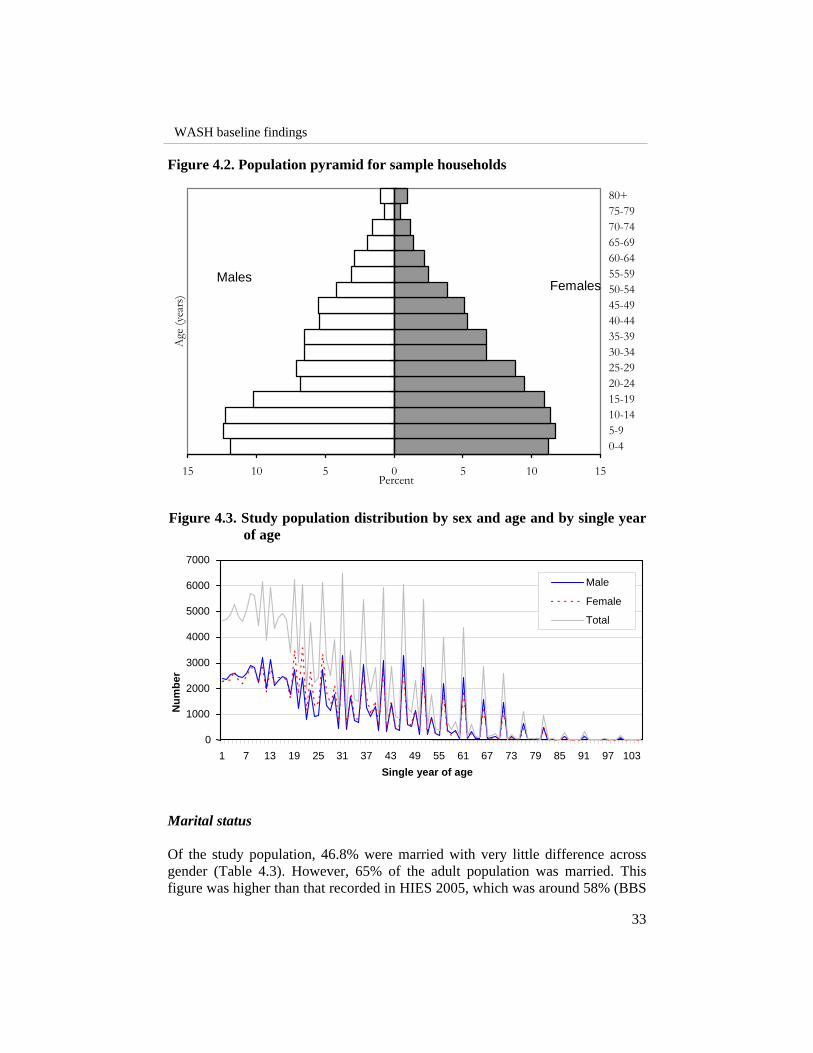
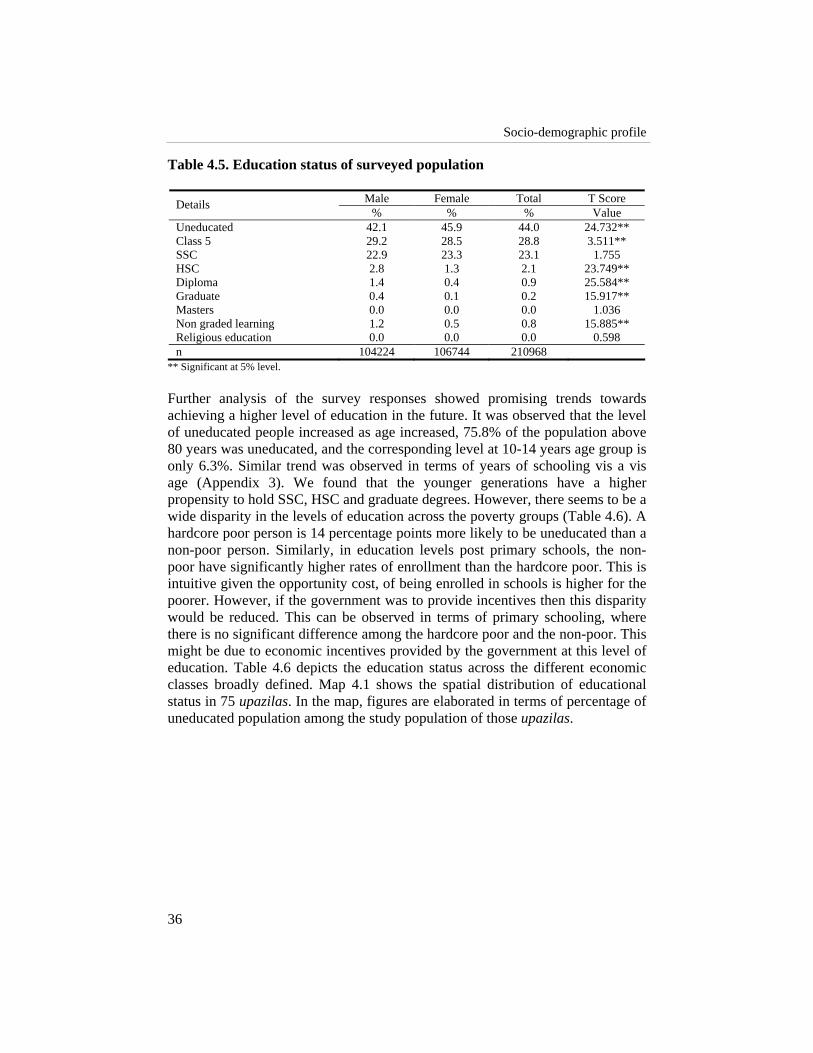
Figure 4.2. Population pyramid for sample households Figure 4.3. Study population distribution by sex and age and by single year
of age Marital status Of the study population, 46.8% were married with very little difference across gender (Table 4.3). However, 65% of the adult population was married. This figure was higher than that recorded in HIES 2005, which was around 58% (BBS
Males Females
15 10 5 0 5 10 15
0-45-910-1415-1920-2425-2930-3435-3940-4445-4950-5455-5960-6465-6970-7475-7980+
Age
(yea
rs)
Percent
Num
ber
0 1000 2000 3000 4000 5000 6000 7000
1 7 13 19 25 31 37 43 49 55 61 67 73 79 85 91 97 103 Single year of age
Male Female Total

Socio-demographic profile
34
2007). In the CFPR/TUP baseline survey (Hadi 2004) this figure was around 61%. It was found that 34.9% of the adult male members were unmarried, the corresponding figure for females was 21.4%. Though, more females were divorced or widowed than male (11.8% and 1.2%). The figures for unmarried population were lower than and the figures for divorced or widowed population were consistent with HIES 2005 estimates. Most people who were married are middle or old aged (95.7%). Similarly, 88.1% of the people under the age of 20 was unmarried and 70.6% of the divorced population was over the age of fifty. This is consistent with general perception. Figure 4.4 and Table 4.4 illustrates the findings. Table 4.3. Marital status of population in 75 surveyed upazilas
Male Female Total Details % % %
Unmarried 24.7 15.5 20.1 Married 45.1 48.5 46.8 Widowed 0.9 8.6 4.8 N/A 29.3 27.4 28.3 n 1,04,224 1,06,744 2,10,968 Marital status among adult population Unmarried 34.9 21.4 28 Married 63.9 66.8 65 Widowed 1.2 11.9 7 n 73,664 77,526 1,51,190
Table 4.4. Marital Status across the age group
Description Unmarried (%) Married (%) Widowed/Separated Abandoned (%)
All Female All Female All Female 10 to 14 35.1 43.9 0.1 0.2 0.2 0.2 15-19 42.4 45.8 4.2 7.6 1.2 1.2 20-24 15.2 8.2 10.7 16.6 2.5 2.4 25-49 7.1 2.0 62.4 62.0 25.6 26.3 50 + 0.1 0.1 22.6 13.6 70.6 70.0

WASH baseline findings
35
Figure 4.4. Marital status of study population by age group Education status It is widely recognized that education plays an important role in hygiene and sanitation practices (IRC 2004). Over the years education levels, measured by years of schooling, in Bangladesh have been rising (NIPORT 2001). According to Ahmed et al. (2003), 41% of the rural population (5+ years of age) attended schools one time in their lives. In this study this figure was found to be 56%. However, 44% of the total population was still uneducated4 with females (45.9%) having a 3.8 percentage points higher chance of being uneducated than males (42.1%). The corresponding figure reported in HIES 2005 for uneducated population was 50.2% with a gender disparity of 7.1 percentage points. Table 4.5 gives the education status of the surveyed population. From the table it can be observed that in most levels of education, males have a better standing than females. In the higher levels of education, Higher Secondary Certificate (HSC) and above, it is intuitive for a couple of reasons; firstly, rural women usually get married off by the time they are capable of taking HSC exams or beyond and secondly, the government supports for post Secondary School Certificate (SSC) is very limited for women. However, governments have been encouraging girls to attend schools and in the future there is a potential for having gender parity in all primary, secondary and tertiary education.
4 Uneducated for the purposes of this study refers to people who have not attended school or did not pass
grade 1.
0% 10% 20% 30% 40% 50% 60% 70% 80% 90% 100% 10 to 14
15-19 20-24 25-49
50 +
Age
(in
year
)
Percentage
Unmarried Married Widow/Separated
Socio-demographic profile
36
Table 4.5. Education status of surveyed population
Male Female Total T Score Details % % % Value
Uneducated 42.1 45.9 44.0 24.732** Class 5 29.2 28.5 28.8 3.511** SSC 22.9 23.3 23.1 1.755 HSC 2.8 1.3 2.1 23.749** Diploma 1.4 0.4 0.9 25.584** Graduate 0.4 0.1 0.2 15.917** Masters 0.0 0.0 0.0 1.036 Non graded learning 1.2 0.5 0.8 15.885** Religious education 0.0 0.0 0.0 0.598 n 104224 106744 210968
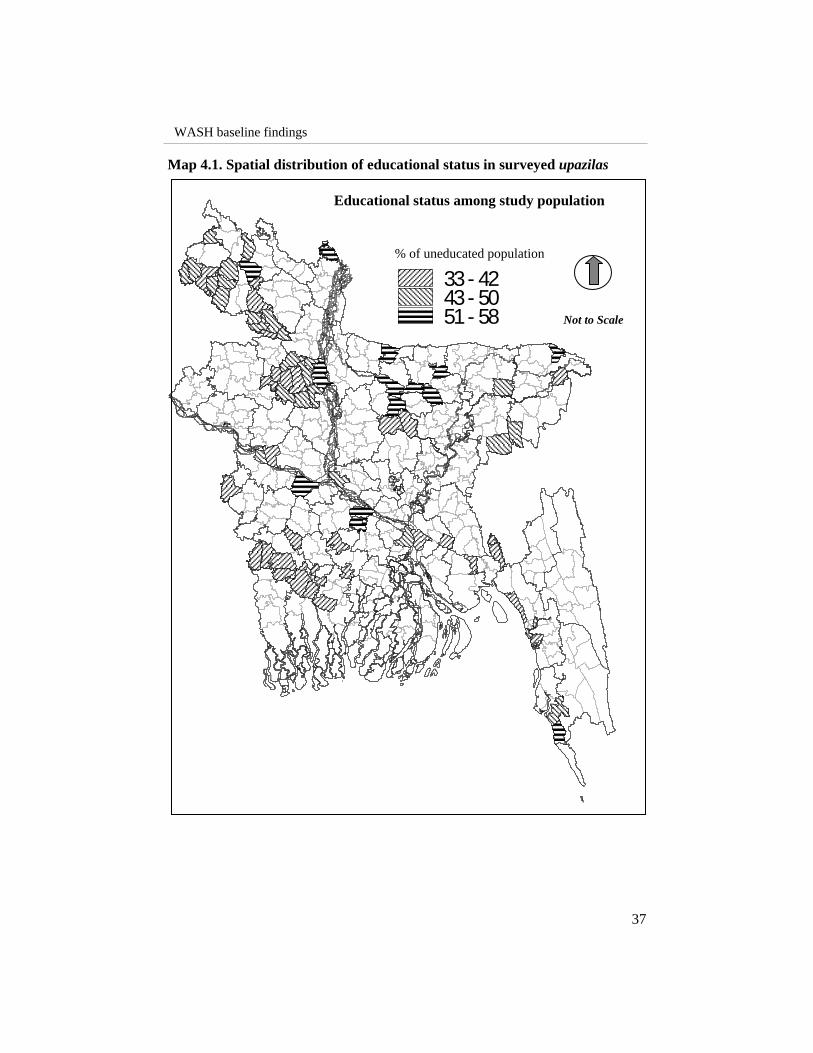
** Significant at 5% level. Further analysis of the survey responses showed promising trends towards achieving a higher level of education in the future. It was observed that the level of uneducated people increased as age increased, 75.8% of the population above 80 years was uneducated, and the corresponding level at 10-14 years age group is only 6.3%. Similar trend was observed in terms of years of schooling vis a vis age (Appendix 3). We found that the younger generations have a higher propensity to hold SSC, HSC and graduate degrees. However, there seems to be a wide disparity in the levels of education across the poverty groups (Table 4.6). A hardcore poor person is 14 percentage points more likely to be uneducated than a non-poor person. Similarly, in education levels post primary schools, the non-poor have significantly higher rates of enrollment than the hardcore poor. This is intuitive given the opportunity cost, of being enrolled in schools is higher for the poorer. However, if the government was to provide incentives then this disparity would be reduced. This can be observed in terms of primary schooling, where there is no significant difference among the hardcore poor and the non-poor. This might be due to economic incentives provided by the government at this level of education. Table 4.6 depicts the education status across the different economic classes broadly defined. Map 4.1 shows the spatial distribution of educational status in 75 upazilas. In the map, figures are elaborated in terms of percentage of uneducated population among the study population of those upazilas.
WASH baseline findings
37
Map 4.1. Spatial distribution of educational status in surveyed upazilas
33- 4243- 5051- 58
% of uneducated population
Educational status among study population
Not to Scale

Socio-demographic profile
38
Table 4.6. Education status across economic groups
Ultra Poor Poor Non-Poor Total T Score Details % % % % Value
Uneducated 58.37 49.60 37.67 44.02 63.02** Class 5 28.55 30.16 28.31 28.82 0.852 SSC 11.57 18.01 28.48 23.10 64.57** HSC 0.53 0.99 2.95 2.06 25.7** Diploma 0.16 0.31 1.35 0.90 18.65** Graduate 0.03 0.07 0.37 0.24 10.2** Masters 0.00 0.00 0.01 0.00 1.48 Non graded learning 0.79 0.86 0.85 0.84 1.181 Religious education 0.01 0.00 0.00 0.00 2.703 n 33799 53743 123426 210968
** Significant at 5% level. Table 4.7 shows the types of different educational institutes from where the respondents completed their study. Of the respondents, 87% completed their study from formal educational institutes followed by religious schools (7.8%) and non-formal education (4.3%). From the perspective of educating pupils about hygiene it would be better or more fruitful to focus on the formal schools (especially primary and secondary). Table 4.7. Cross tabulation of education status across educational institutes
KG school Formal Non-
formal Religious Technical Disabled Total (n) Details
% % % % % % Fr No class passed 6.0 64.2 18.8 11.0 0.0 0.0 9045
Class 5 1.1 88.0 5.4 5.5 0.0 0.0 60536 SSC 0.0 92.0 0.0 7.8 0.2 0.0 48553 HSC 0.0 94.0 0.0 5.6 0.4 0.0 4344 Diploma 0.0 90.2 0.0 9.3 0.5 0.0 1888 Graduate 0.0 78.2 0.0 21.6 0.2 0.0 505 Masters 0.0 100.0 0.0 0.0 0.0 0.0 9 Non graded learning
1.7 2.5 23.7 72.1 0.0 0.0 1735
Religious education 0.0 0.0 66.7 33.3 0.0 0.0 3
N/A 0.0 86.1 2.8 11.1 0.0 0.0 36 n 1211 110015 5386 9916 121 5 126654
Occupational variation In terms of occupation, the responses were aggregated into 8 broad categories. The following Table (Table 4.8) shows the situation of employment across the different economic classes. It can be observed that in activities that require
WASH baseline findings
39
ownership of land or capital, the hardcore poor people’s involvement have been drastically lower than the non-poor people. Thus it is not surprising that most of the hardcore poor involvement has been in areas requiring labour as found in Chapter 3. Table 4.8. Occupational pattern across different economic classes
Hardcore poor Poor Non-poor Total T Score Details % % % % Value Agriculture 1 5 13 9 66.69** Manual labor 25 18 4 11 133.27** Business 2 3 7 5 37.29** Service 1 2 4 3 23.19** Domestic chores 27 27 28 28 4.00** Self-employed 1 1 1 1 2.94** Student 20 23 25 24 17.59** Unemployment 5 3 3 3 15.08** N/A 18 18 15 16 n 33798 53742 123424 210964
** Significant at 5% level. Specially focused group In this report we considered the disabled, adolescents and elderly population are considered as `specially focused groups (SFG)’ in addition to children and hardcore poor. The elaborations, presented in this section, on some WASH-related attributes may help design and deploy appropriate interventions to address the special needs of these SFGs. Disability (different ability) status Some 400 million people with disabilities live in the Asia and Pacific region (UNESCAP 2007). The majority of them are excluded from many social opportunities. In the baseline survey, it was found that 0.86% (1,820) of the total population reported 1,992 cases of disability (Table 4.9). According to a study conducted by UNESCAP (2007), the national status of disability is 5.6%. This is quite high compared to this baseline survey. This is because of that data on disability is limited to a great extent by variations in national concepts, definitions, methodologies and capacity for data collection (UNESCAP 2007). Moreover, the UNESCAP data did not clarify the type of disability. However, this study found that out of the 1,992 cases of disability, 64% were physical5 and the rest were other forms of disability (e.g psychological, ear, eye, nose, lip, etc.).
5 Physical disability refers to only those physical disabilities which pose problems for the proper usage of
latrines.

Socio-demographic profile
40
Table 4.9. Cases of disability Details % Physical 36.1 Other 63.9 n 1992 Table 4.10 shows that differences exist between observed and expected levels of disability across poverty class, gender and age groups6. Amongst the disabled people, the probability of being hardcore poor is 36% higher than expected, whereas the corresponding figure for poor and non poor is 7%, i.e., the likelihood is 7% less than expected. In terms of physical disability the disparity increases, whereas for other disabilities the differences are less stark. However, it must be noted that disability could perpetuate poverty, rather than poverty perpetuating disability, and thus, the figures provided above should be interpreted accordingly. Table 4.10. Differences between observed and expected levels of disability7 Details Total disability Physical disability Other disability
Observed ExpectedDiff(%) Observed Expected
Diff (%) Observed Expected
Diff (%)
Poverty class Ultra poor 398 292 -36 161 103 -57 237 189 -26 Poor 429 464 7 156 164 5 273 300 9 Non-poor 993 1,065 7 325 376 13 668 689 3 F value 23.3 7.8 20.1 Gender Male 1,178 899 -31 380 317 -20 682 582 -17 Female 642 921 30 262 325 19 496 596 17 T value 7.7 5.8 4.9 Age Under 5 121 248 51 62 87 29 59 160 63 Rest 1,699 1,572 -8 580 555 -5 1,119 1,018 -10 T value 8.7 8.6 2.9
Within the disabled population the probability of finding males was 31% higher than expected and 30% lower than expected for females (Table 4.10). Similarly, within the disabled group the probability of finding under-five children are 51% lower than expected, whereas the corresponding probability was 8% higher for the rest of the population. Appendix 3 to 5 show detailed pictures of disability status across poverty class, gender and age groups.
6 The expected probabilities are computed by computing the ratio of the subgroup to the total population 7 The high values for F and T statistics signify that the differences indicated are statistically significant
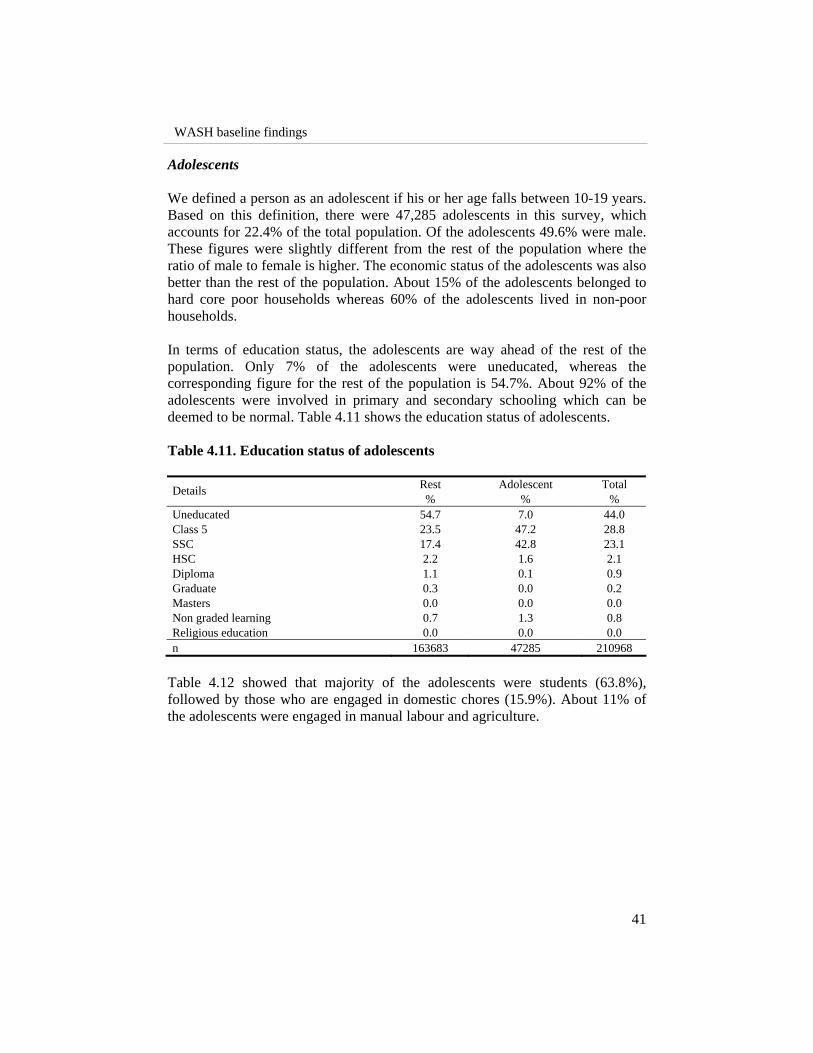
WASH baseline findings
41
Adolescents We defined a person as an adolescent if his or her age falls between 10-19 years. Based on this definition, there were 47,285 adolescents in this survey, which accounts for 22.4% of the total population. Of the adolescents 49.6% were male. These figures were slightly different from the rest of the population where the ratio of male to female is higher. The economic status of the adolescents was also better than the rest of the population. About 15% of the adolescents belonged to hard core poor households whereas 60% of the adolescents lived in non-poor households. In terms of education status, the adolescents are way ahead of the rest of the population. Only 7% of the adolescents were uneducated, whereas the corresponding figure for the rest of the population is 54.7%. About 92% of the adolescents were involved in primary and secondary schooling which can be deemed to be normal. Table 4.11 shows the education status of adolescents. Table 4.11. Education status of adolescents
Rest Adolescent Total Details % % %
Uneducated 54.7 7.0 44.0 Class 5 23.5 47.2 28.8 SSC 17.4 42.8 23.1 HSC 2.2 1.6 2.1 Diploma 1.1 0.1 0.9 Graduate 0.3 0.0 0.2 Masters 0.0 0.0 0.0 Non graded learning 0.7 1.3 0.8 Religious education 0.0 0.0 0.0 n 163683 47285 210968
Table 4.12 showed that majority of the adolescents were students (63.8%), followed by those who are engaged in domestic chores (15.9%). About 11% of the adolescents were engaged in manual labour and agriculture.

Socio-demographic profile
42
Table 4.12. Occupational variation among adolescents
Rest Adolescent Total Details % % %
Agriculture 10.7 3.4 9.0 Manual labor 11.7 7.5 10.8 Business 6.1 1.0 5.1 Service 3.1 1.3 2.7 Domestic chores 31.4 15.9 27.9 Self-employed 1.0 0.7 0.9 Student 12.3 63.8 23.8 Unemployment 2.9 5.6 3.5 N/A 20.8 0.2 16.2 n 163679 47285 210964
Elderly population A person has defined as elderly if he or she is aged 60 years and above. Based on this definition, we found 15097 elderly people, which accounts for 7.2% of the total population. Of the elderly people 55.6% were male. This figure was different from the rest of population where the ratio of male to female was lower. The economic status of the elderly was better than the rest of the population. About 17% of the elderly people belong to hard core poor households whereas 64% of the elderly population live in non-poor households (Appendix 6). The level of illiteracy among the elderly people is 67%, which is 24.9 percentage points higher than the rest of the population. And of the educated, most of the elderly people had education up to SSC only (Table 4.13). Table 4.13. Education status of the elderly
Rest Elderly Total Details % % %
Uneducated 42.2 67.1 44.0 Class 5 29.7 17.5 28.8 SSC 23.9 12.2 23.1 HSC 2.1 1.4 2.1 Diploma 0.9 1.0 0.9 Graduate 0.2 0.2 0.2 Masters 0.0 0.0 0.0 Non graded learning 0.9 0.6 0.8 Religious education 0.0 0.0 0.0 n 195871 15097 210968
Most of the elderly people were involved in domestic chores and agriculture (Table 4.14). Agriculture as occupation among the elderly population is distinctly

WASH baseline findings
43
higher than rest of the population. However, disparity exists across gender groups within the elderly population. Most females (93.5%) were involved in activities related to households whereas most males (51.3%) were involved in agricultural activities. Table 4.14. Elderly occupation
Rest Elderly Total Details % % %
Agriculture 8.1 21.0 9.0 Manual labor 10.9 8.2 10.8 Business 5.1 5.0 5.1 Service 2.7 2.6 2.7 Domestic chores 27.9 28.0 27.9 Self-employed 0.9 1.0 0.9 Student 25.7 0.0 23.8 Unemployment 3.5 3.8 3.5 N/A 15.1 30.4 16.2 n 195867 15097 210964
Disease prevalence To analyze disease prevalence, the respondents were asked to recall their illness or diseases during the last 15 days from the date of interview. The disease prevalence on the total population was 14.6%. The prevalence was much higher on children than on the adult population, 31.6% and 12.1% respectively. Most of the disease prevalence in rural Bangladesh can be attributed to low standards of hygiene and sanitation. Sixty-five% (65%) of the total disease prevalence can be attributed to waterborne and faecal-borne diseases (table 4.14, 4.15). Thus, it is imperative that intervention to improve the levels of hygiene and sanitation will definitely have an impact on the disease prevalence in rural Bangladesh. There was very little difference in the level of disease prevalence across gender. However, across economic groups the differences were stark. The hardcore poor are 2.2 percentage points more likely to be sick than the non-poor population. Not surprisingly the hardcore poor were more prone to waterborne and faecal-borne diseases than the non-poor, given the differences in their hygiene practice. The following tables show the differences in disease prevalence across gender (Table 4.15), age groups (Table 4.16), and economic classes (Table 4.17). Figure 4.5 also shows the diseases pattern among the study population. Also Maps 4.2. and 4.3 show the total disease prevalence and waterborne diseases prevalence among the study population and under or equal 5 children across the upazila level.

Socio-demographic profile
44
Table 4.15. Disease prevalence across gender
Male Female Total T Score Details % % % Value
Disease prevalence 14.40 14.90 14.60 3.128** No disease 85.60 85.10 85.40 3.128** n 104224 106744 210968 Disease pattern and prevalence Waterborne 56.15 53.85 54.97 0.599 Infestation 8.80 9.20 9.00 2.038** Flu-fever related 28.82 30.18 29.52 3.844** Other infectious (TB, malaria etc) 1.16 1.00 1.08 1.041 Other diseases 5.07 5.77 5.43 3.333** n 15012 15889 30901
** Significant at 5% level. Table 4.16. Disease prevalence on children equal or under five
Under 5 Rest (above 5 yrs) Details % %
Disease prevalence 30.60 12.10 No disease 69.40 87.90 n 28720 182248 Disease pattern and prevalence Waterborne 55.42 54.79 Infestation 9.48 8.81 Flu-fever related 31.78 28.62 Other infectious (TB, malaria etc) 1.20 1.03 Other diseases 2.12 6.74 n 8775 22126
Table 4.17. Disease prevalence across economic classes
Ultra Poor Poor Non Poor Total T Score Details % % % % Value
Disease prevalence 16.00 15.80 13.80 14.60 10.092** No disease 84.00 84.20 86.20 85.40 10.092** n 33799 53743 123426 210968 Disease pattern and prevalence Waterborne 58.09 55.34 53.79 54.97 11.235** Infestation 9.05 9.65 8.67 9.00 3.637** Flu-fever related 27.25 29.28 30.36 29.52 1.3 Other infectious (TB, malaria etc) 1.08 1.18 1.03 1.08 1.263 Other diseases 4.54 4.55 6.15 5.43 2.227** n 5395 8478 17028 30901
** Signifies a p value of less than 0.00

WASH baseline findings
45
Map 4.2. Spatial distribution of diseases prevalence across upazila level
TOTAL DISEASE PREVALENCE�(in percentage)
3.86 - 10.1610.16 - 16.0616.06 - 23.223.2 - 37.05
�(in percentage)
FECAL AND WATERBORNE DISEASE PREVALENCE
15.99 - 37.3837.38 - 60.160.1 - 79.9579.95 - 99.35
N
Not to Scale
N
Not to Scale
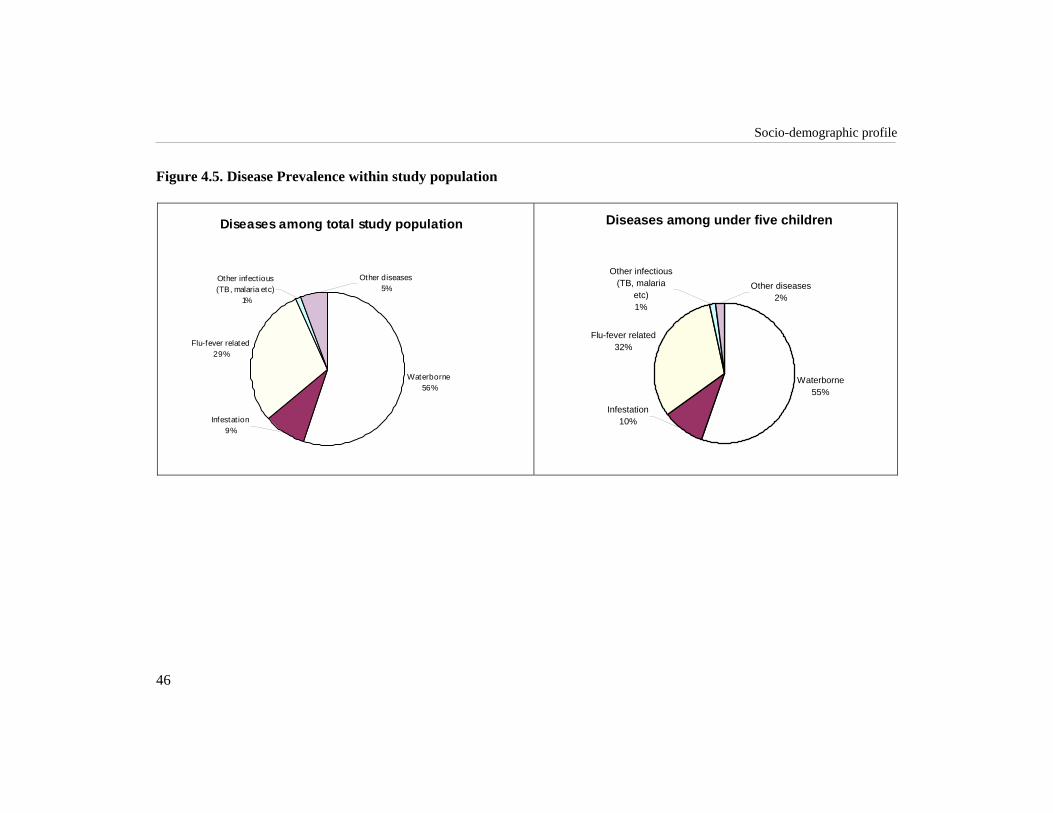
Socio-demographic profile
46
Figure 4.5. Disease Prevalence within study population
Diseases among total study population
Waterborne56%
Flu-fever related29%
Infestat ion9%
Other infect ious (TB, malaria etc)
1%
Other diseases5%
Diseases among under five children
Waterborne55%
Flu-fever related32%
Infestation10%
Other infectious (TB, malaria
etc)1%
Other diseases2%

WASH baseline findings
47
Map 4.3. Spatial distribution of waterborne diseases among equal or under five children
WATERBORNE DISEASE PREVALENCE UNDER FIVE CHILDREN
(in percentage)17 - 3839 - 5455 - 7071 - 96
N
Not to Scale

Socio-demographic profile
48
CONCLUSION The average family size among the study population is 4.7 which is similar to that of the national survey (BBS 2007). However, the average family size of hardcore poor (4.2) was lower than non-poor (4.9). The reason for this could be the absence of male family members due to emigration or the fact that these households have fewer members that are economically active i.e. they are poorer because they have fewer members that can earn money. Social dependency rate, defined as the ratio of young (15 years or less) and elderly (over 65 years) to the rest of the people, was 66.9%. Any kind of interventions and economic incentives should consider these dependant groups. Around 14% of the total surveyed population were five years of age or less. To ensure that these children learn about proper hygiene and practice, mothers of these children can be targeted. By teaching the mothers the benefits of hygiene practice in their own lives and their children’s lives, the WASH programme can ensure that in future there will be no loopholes in hygiene knowledge and practice among the new entrants into the society. The study identified that 44% of the people were uneducated. The members of the younger age groups exhibit a lower level of illiteracy than the older age group. Members of the hardcore poor are more likely to be uneducated than the non-poor people and even when they are educated the level of their education is lower than non-poor people. Given the high levels of uneducated people within the communities a two pronged approach must be undertaken. For the people who are enrolled in educational institutes, formal hygiene education could be arranged and for the people who are not enrolled in educational institutes (mostly uneducated) a community training could be arranged. A special feature of this study was that a focus was set on the disabled, adolescents and elderly population of the society. Though disability will not be a big impediment towards achieving WASH targets, it is important to make sure that the 719 physically disabled people are not neglected, special provisions should made for them. Adolescents account for more than 22% of the surveyed population. Thus, it is crucial to cater specific WASH educational packages for them. It must be noted that adolescence is an important time for females with regards to feminine hygiene. Thus the educational packages catered towards them should incorporate this aspect. Around 8% of the surveyed population is elderly of which 56% were male. The indigenous experience and knowledge that this group possesses could be incorporated in hygiene education packages. The total disease prevalence was reported as 14.6%. Waterborne and faecal-borne diseases, which are directly related to water and sanitation quality and hygiene practices, accounted for 65% of the total ailments. Children and the

WASH baseline findings
49
hardcore poor were more prone to diseases. Therefore, they should be given more emphasis in WASH intervention to attain the MDG targets of improving water and sanitation access and reducing the infant morbidity and mortality.

WASH baseline findings
51
Water for Life: Status of Water MA Quaiyum Sarkar
Water is not only essential for life, it is also a wide-ranging cultural presence- an inspiration for artists, a focus of scientific research, and an indispensable element in the religious rituals of many traditions and faiths (UN: Water and Culture 2006).
INTRODUCTION
Contaminated drinking water and an inadequate supply of water cause diseases that account for 10% of the total burden of disease in developing countries (World Bank 2002). Because of water pollution, about 1.5 billion people suffer from lack of safe drinking water, which causes at least 5 million deaths per year (WHO 2006). A study (Talk International 2004) shows that water-borne diseases are one of the major causes of under-five mortality, along with pneumonia, malaria, and measles. Present statistics indicate that diarrhoeal diseases still remain to be a leading cause of illness and death. Worldwide every year, about 2.2 million people die of diarrhoea, 90% of which are children. In Bangladesh, in spite of continued progress in the health sector, about 110 thousands children under the age of five die of diarrhoea every year. Whereas, it is expected that only basic water supply, sanitation, and hygiene together could reduce diarrhoeal diseases by 26% and mortality by 65% (WHO 2006).
5

Water for life: status of water
52
Water is life. In every sphere of life water is essential. Two-thirds of earth’s surface is covered by water. But only 1% of total water on earth is drinkable. At present 1.1 billion people lack access to improved water sources and two-thirds of them reside in Asia (UNDP 2006). In Bangladesh 97.4% of the population have access to water from tubewell, tap, and other technologies based on ground water sources. Arsenic contamination, urban and industrial pollution, anticipated increase of human excreta load from present 1,500 metric tons per day to 6,000 metric tons per day, and gradual increase of solid waste load from existing 4,500 metric tons per day to 19,000 metric tons per day can be identified as the major threat to safe water (World Bank 2005). These factors contribute in reducing the access to safe water to 74% (WHO 2006). At present, supply of safe drinking water provides about 10,000 million liters per day against anticipated demand of 35,000 million liters per day (World Bank 2005). It is alarming that over the next 20 years the average supply of safe water worldwide per person is expected to drop by a third (WHO 2006). Recognizing this imminent crisis and importance of water, the UN General Assembly adopted a resolution at its 47th session in November 1992 to observe 22 March as World Water Day. Besides, the UN General Assembly, in its resolution proclaiming the period from 2005 to 2015 as the International Decade for Action, “Water for Life,” called for more concentrated action to reach the internationally agreed targets for accessing safe water and sanitation. The Millennium Development Goal (MDG 7, target 10) envisions halving the population who have no access to basic water supply and sanitation by 2015. The target could be achieved through integrated development and management of water resources. In response to MDG, Bangladesh has set its target to ensure that 100% of urban and 96.5% of rural population have access to safe water by 2015 (World Water Day 2006). Success in providing safe drinking water, will not only reduce human disease burden, it will also help make millions of the world’s poorest people’s lives more enjoyable with better health. Government, NGOs, and donor agencies are involved through both soft and hardware programmes towards ensuring safe water to the people in Bangladesh. As part of these efforts, BRAC initiated its WASH programme where ensuring safe water is one of the major components. However, it is not clear what the current status of safe water access is among the people at the different levels of the society. The baseline survey, in this regard, is an attempt to fill in the gaps. This chapter aims to identify the status and access of safe water in WASH areas.

WASH baseline findings
53
METHODS This chapter describes the degree of access to water, functional state of tubewells, water quality and awareness especially related to arsenic, role of women with regard to water, satisfaction and preferences to water sources and poverty dimension of water access. Data were collected using structured questionnaires and spot observations as mentioned earlier in the methods chapter. The survey was conducted between November 2006 and June 2007.
RESULTS AND DISCUSSION Use of tubewell water This section describes the status of using tubewell water for drinking, cooking, washing, bathing, and defecation purposes by the study households. Table 5.1-5.2 show that average use of tubewell water for drinking purposes (98.1%) in both dry and rainy seasons was almost similar to the national average of 98% (WHO 2006). Among the hardcore poor, use of tubewell water for drinking purposes was somewhat lower (97%) compared to poor (98%) and non-poor (98.4%). The use of tubewell water was lower for cooking (81%), washing (75%), and defecation (77%), and much lower for bathing (56%) at all levels of study households compared to drinking purposes, in both seasons. Use of tubewell water was much higher for drinking purpose due to its availability and increased awareness among the users. Irrespective of poverty classes, almost all study households used tubewell water as the main source for drinking purposes. Table 5.1. Use of tubewell water for different purposes during dry season
Study household Purpose Hardcore poor (%) Poor (%) Non-poor (%)
ALL (%)
Drinking 97.2 98.0 98.4 98.1 Cooking 83.1 81.6 80.9 81.5 Washing 76.2 73.7 75.9 75.4 Bathing 55.2 54.0 57.5 56.1 Defecation 75.7 75.7 79.2 77.6 n 8066 11949 24978 44993

Water for life: status of water
54
Table 5.2. Use of tubewell water for different purposes during rainy season
Study household (%) Purpose Hardcore poor (%) Poor (%) Non-poor (%)
All (%)
Drinking 97.4 98.1 98.3 98.1 Cooking 82.3 81.0 80.2 80.8 Washing 75.6 73.3 75.5 74.9 Bathing 52.6 51.3 54.9 53.5 Defecation 75.1 75.5 78.9 77.3 n 8066 11949 24978 44993
Ownership of tubewells This part explains the distribution status of own and shared tubewells among study households. About 42.7% of the study households had their own tubewells (Table 5.3) and 50.8% shared tubewells with others. Status of single ownership of the tubewells among hardcore poor was much lower compared to non-poor. Out of all the single ownership tubewells, 65.4% belonged to the non-poor households whereas 11.9% belonged to hardcore poor households. Regional distribution of tubewells based on ownership pattern is also presented in the map 5.1. Table 5.3. Distribution of tubewells based on ownership
Households level Own tubewell (%) Shared tubewell (%) All 42.7 50.8 Hardcore poor 11.9 21.9 Poor 22.7 29.4 Non-poor 65.4 48.7 n 19224 22842
Mechanical condition Those who had single-owned tubewells were asked whether their tubewells were functioning. It was found about 91.5% of the tubewells of these households were functional (Table 5.4). The percentage of having functional tubewells (within single-owned tubewell owners) among the hardcore poor (89.4%) and poor (89.9%) was almost similar. This was somewhat lower compared to the non-poor (92.4%). Thus, economic condition may play an important role in the maintenance of tubewells.

WASH baseline findings
55
RANGAMATI
SYLHET
TANGAIL
BOGRA
BANDARBAN
KHULNA
COMILLA
PABNA
DINAJPUR
NAOGAON
MYMENSINGH
SUNAMGANJ
CHITTAGONG
JESSORE
SATKHIRA
HABIGANJRAJSHAHI
RANGPUR
NETRAKONA
NATORE
DHAKA
SIRAJGANJ
BAGERHAT
KURIGRAM
BHOLA
FARIDPUR
NOAKHALI
FENI
KUSHTIA
JAMALPUR
MAULVIBAZAR
GAZIPUR
GAIBANDHA
KISHOREGANJ
JHENAIDAH
KHAGRACHHARI
COX'S BAZAR
CHANDPUR
NILPHAMARI
SHERPUR
NAWABGANJ
NARAIL
RAJBARI
THAKURGAON
GOPALGANJ
MAGURA
MANIKGANJ
BARISAL
BRAHAMANBARIANARSINGDI
PANCHAGARH
SHARIATPURMADARIPUR
LAKSHMIPUR
CHUADANGA
LALMONIRHAT
JOYPURHAT
MUNSHIGANJ
PATUAKHALI
MEHERPUR
PIROJPUR
BARGUNA
NARAYANGANJ
JHALOKATI
Biral
Ramu
Birganj
Bhaluka
Dumuria
Pirganj
Trishal
Pangsha
Ukhia
Rampal
Sharsha
Kendua
Sariakandi
Parbatipur
Sherpur
Domar
Manirampur
Chunarughat
Shibganj
Sreemangal
Gaffargaon
Haluaghat
Gabtali
Dhunat
Fulbari
Kashiani
Atwari
Gauripur
Ishwardi
Bogra Sadar
Sadarpur
Kahaloo
Nawabganj
Jaintiapur
Bhanga
Barhatta
Jagannathpur
Sitakunda
Ranisankail
Nandigram
Keshabpur
Birampur
Jhikargachha
Kaharole
Bagher Para
Nilphamari Sadar
Bochaganj
Shibalaya
Beani Bazar
Mymensingh Sadar
Parshuram
Rupsa
Bhedarganj
Senbagh
Shahrasti
Adamdighi
Bhurungamari
Saidpur
Anowara
Ghoraghat
Bheramara
Tungi Para
Chhagalnaiya
Mujib Nagar
Dighalia
Chandpur Sadar
LegendOwn TubewellShared TubewellPublic TubewellOther Sources
Table 5.4. Mechanical condition of own tubewells
Conditions Hardcore poor (%) Poor (%) Non-poor (%) All (%) Active 89.4 89.9 92.4 91.5 Inactive 10.6 10.1 7.6 8.5 n 2283 4360 12581 19224
Map 5.1. Regional distribution of tubewells based on ownership pattern
Regional distribution of tubewells based on ownership pattern
N
Not to Scale
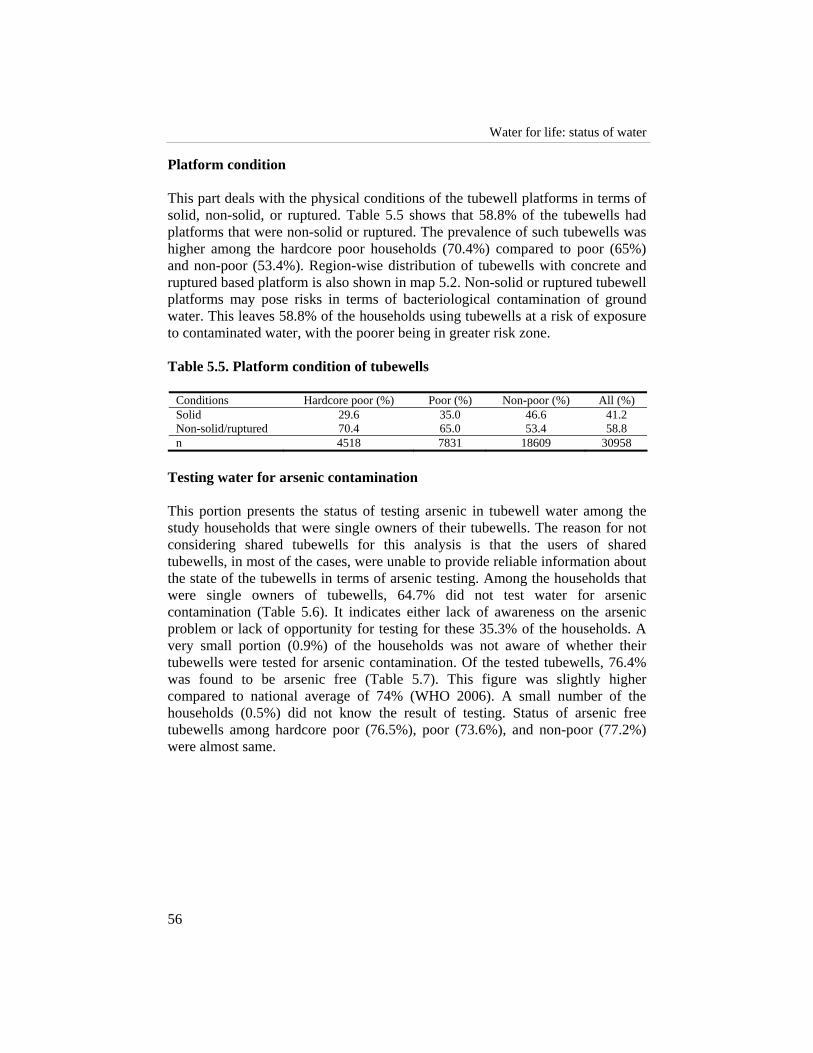
Water for life: status of water
56
Platform condition This part deals with the physical conditions of the tubewell platforms in terms of solid, non-solid, or ruptured. Table 5.5 shows that 58.8% of the tubewells had platforms that were non-solid or ruptured. The prevalence of such tubewells was higher among the hardcore poor households (70.4%) compared to poor (65%) and non-poor (53.4%). Region-wise distribution of tubewells with concrete and ruptured based platform is also shown in map 5.2. Non-solid or ruptured tubewell platforms may pose risks in terms of bacteriological contamination of ground water. This leaves 58.8% of the households using tubewells at a risk of exposure to contaminated water, with the poorer being in greater risk zone. Table 5.5. Platform condition of tubewells
Conditions Hardcore poor (%) Poor (%) Non-poor (%) All (%) Solid 29.6 35.0 46.6 41.2 Non-solid/ruptured 70.4 65.0 53.4 58.8 n 4518 7831 18609 30958
Testing water for arsenic contamination This portion presents the status of testing arsenic in tubewell water among the study households that were single owners of their tubewells. The reason for not considering shared tubewells for this analysis is that the users of shared tubewells, in most of the cases, were unable to provide reliable information about the state of the tubewells in terms of arsenic testing. Among the households that were single owners of tubewells, 64.7% did not test water for arsenic contamination (Table 5.6). It indicates either lack of awareness on the arsenic problem or lack of opportunity for testing for these 35.3% of the households. A very small portion (0.9%) of the households was not aware of whether their tubewells were tested for arsenic contamination. Of the tested tubewells, 76.4% was found to be arsenic free (Table 5.7). This figure was slightly higher compared to national average of 74% (WHO 2006). A small number of the households (0.5%) did not know the result of testing. Status of arsenic free tubewells among hardcore poor (76.5%), poor (73.6%), and non-poor (77.2%) were almost same.

WASH baseline findings
57
Map 5.2. Region-wise distribution of tubewells with concrete and ruptured based platform
NAOGAON
RANGAMATI
SYLHET
TANGAIL
BOGRA
BANDARBAN
KHULNA
COMILLA
PABNA
DINAJPUR
NAOGAON
MYMENSINGH
SUNAMGANJ
CHITTAGONG
JESSORE
SATKHIRA
HABIGANJ
RAJSHAHI
RANGPUR
NETRAKONA
NATORE
DHAKA
SIRAJGANJ
BAGERHAT
KURIGRAM
BHOLA
FARIDPUR
NOAKHALI
FENI
KUSHTIA
JAMALPUR
MAULVIBAZAR
GAZIPUR
GAIBANDHA
KISHOREGANJ
JHENAIDAH
KHAGRACHHARI
COX'S BAZAR
CHANDPUR
NILPHAMARI
SHERPUR
NAWABGANJ
NARAIL
RAJBARI
THAKURGAON
GOPALGANJ
MAGURA
MANIKGANJ
BARISAL
BRAHAMANBARIANARSINGDI
PANCHAGARH
SHARIATPURMADARIPUR
LAKSHMIPUR
CHUADANGA
LALMONIRHAT
JOYPURHAT
MUNSHIGANJ
PATUAKHALI
MEHERPUR
PIROJPUR
BARGUNA
NARAYANGANJ
JHALOKATI
No Concrete and RapturedConcrete Made
CONDITION OF TUBEWELL FLOOR(in percentage)

Water for life: status of water
58
Table 5.6. Own tubewell: Testing for arsenic
Study household Whether tested Hardcore poor (%) Poor (%) Non-poor (%)
All (%)
Tested for arsenic 26.6 31.4 36.8 34.3 Not tested 72.1 67.7 62.4 64.7 Don’t know 1.2 .9 .9 .9 n 2283 4360 12581 19224
Table 5.7. Own tubewell: Result of testing
Status Hardcore poor (%) Poor (%) Non-poor (%) All (%) Arsenic free 76.5 73.6 77.2 76.4 Arsenic contaminated 23.0 26.1 22.3 23.2 Don’t know .5 .3 .5 .5 n 608 1367 4627 6602
Use of arsenic contaminated water This part describes the state of practice of arsenic contaminated water for drinking and cooking purposes by the study households. Table 5.8 shows that two-thirds of the households that owned arsenic contaminated tubewells drank water from it in both dry and rainy season. This is another indication of lack of awareness on arsenic problem or lack of availability of alternative sources of safe water. The use of arsenic contaminated water for cooking was lower (30.8%) compared to drinking purposes (60.1%). The use of arsenic contaminated water by hardcore poor was higher (67.9%) compared to poor (60.8%), and non-poor (58.9%), indicating that hardcore poor households have higher exposure to arsenic pollution. Water mixed with harmful doses of arsenic if taken for long time may lead to serious skin diseases, swelling of liver, anaemia, anorexia, deafness and fatal skin-cancer (Ecofile 1996). Therefore, ensuring arsenic-free safe water and raising awareness level of the community people is urgently needed. Table 5.8. Use of arsenic contaminated own tubewell water
Purpose Hardcore poor (%) Poor (%) Non-poor (%) All (%) During dry season Drinking 67.9 60.8 58.9 60.1 Cooking 38.6 30.5 29.8 30.8 During rainy season Drinking 67.9 60.8 58.9 60.1 Cooking 35.7 30.3 28.3 29.4 n 140 357 1033 1530

WASH baseline findings
59
Arsenic-free tubewell based on observation Self-reported arsenic free tubewells were checked physically. All of the self-reported arsenic free tubewells were supposed to be painted green. However, 85% of them did not have any marks indicating its arsenic free status (Table 5.9). Less than 14% of the tubewells were marked green and a few were marked red. This also indicates lack of awareness among the tubewell users or lack of proper monitoring by the local government, or any other organization responsible for raising awareness of the community people. Table 5.9. Distribution of reported arsenic-free tubewell based on
observation
Status Own tubewell (%) Shared tubewell (%) Green marked 13.9 10.4 Red marked .5 3.3 No marked 85.5 86.1 n 5019 4709
Water purification Everyday, some 6000 people, mostly children, die from water-related causes (UN 2006). So, clean and purified water and thus safe water is an unconditional prerequisite for human wellbeing. Up till now, for a large percentage of the people in Bangladesh, water is neither safe nor adequate. Table 5.10 shows that more than 96% of the study households did not purify either tubewell water or surface water for drinking. This can be attributed to mainly three factors – habits, lack of awareness on safe water, and lack of resources (including technical knowledge) for water purification. There is no doubt that the households were at risk of exposure to waterborne diseases. Use of surface water or arsenic contaminated water without any purification, especially for drinking, is one of the major causes for increased morbidity and mortality rate. Table 5.10. Whether purifying water
Purification status at different sources Methods Own
tubewell (%) Shared
tubewell (%) Supply water
(%) *Public tubewell/surface
water (%) Do not purify 98.6 99.3 90.1 96.3 Purify water 1.4 .7 9.9 3.7 n 19224 22842 686 23016
* Govt. tubewell also includes surface water like river, canal, pond, and dugwell
Water for life: status of water
60
Placement of tubewells: safety issue Improper placement of tubewells with relation to latrines is one of the factors that affect water quality. Among study households 19.9% of tubewells were placed at lower horizontal plane compared to the latrines. Spot observations also indicate that 39.6% of the tubewells were placed within 10 meters of the latrines, which is deemed unsafe. Water collection: role of women Women in rural households in Bangladesh are concerned with the private domain of water - drinking, cooking, and washing water for household use (WHO 2006). Women prioritize water for health and the reproduction of household, against men’s priority of water for agricultural production (UN 2006). Table 5.11 shows that for more than 95% of the households, female members were responsible for the collection of water. Women’s contribution to managing water for household use is universally recognized. In all developing countries, it is the females who walk miles to collect drinking water for the family, wash the clothes, and boil the rice (UNICEF 2006). Another study (BRAC 2004) also showed that more than 95% of the women were found to be responsible for fetching water. Moreover, familial civilization largely depends on women’s role in households. Therefore, like other programmes in BRAC, WASH should make sure that women are actively involved in every part of the decision-making process in both household and communal aspects. Table 5. 11. Who is responsible to collect water in the household
Types of water source Responsible persons Single-own tubewell (%) Shared tubewell (%) Public tubewell (%)
Female members 96.4 95.0 73.1 Others 3.6 5.0 26.9 n 19171 22648 16135
Cleaning tubewells’ platform Women in households not only were responsible for fetching water in most cases, but also played a vital role in cleaning tubewells’ platform on regular basis. Table 5.12 shows that females in the study households were involved in cleaning both owned and shared tubewells’ platform in most cases (>95%). Cleaning tubewells’ platform on regular basis plays an important role in ensuring safe water. However, women’s contribution to household water management is a common phenomenon in our daily lives.
WASH baseline findings
61
Table 5.12. Responsibility of cleaning tubewells’ basement
Type of family members responsible mainly for cleaning Response status (%) Female members 94.1 Others 5.9 n 17208
Particular time to use shared or public tubewells The households who collected water from other’s (shared or public) tubewell were asked whether there were any time restrictions imposed on their use of the tubewell. Tables 5.13 and 5.14 show that 1.4-2.0% of such households claimed that they had to follow particular times to collect water from both public and shared tubewells. For the public tubewell users, 39.6% mentioned that it was unsafe for women to follow particular times. Any interventions related to installment of shared tubewells should be based on consensus among potential users on the timing of their individual use. Table 5.13. Particular time to use shared tubewell
Particular time Response (%) In case of particular time is it safe for women? Response (%)
No 98 Safe 83.5 Yes 2 Unsafe 16.5 n 22842 - 266
Table 5.14. Particular time to use government tubewell/river/canal/pond/
dugwell
Is there any particular time? Status (%) In case of particular time is it safe for women?
Status (%)
No particular time 98.6 Safe 60.4 Has particular time 1.4 Unsafe 39.6 n 23026 - 328
AVAILABILITY OF WATER This segment describes to what extent the study households got water for domestic purposes throughout the year. Table 5.15 shows that almost all of the study households (99.1%) got sufficient water in rainy season. But in dry season this figure reduced to nearly 70%. Water crisis in dry seasons is a common scenario in Bangladesh. Sufficient safe water among community people should be ensured especially in dry season.
Water for life: status of water
62
Table 5.15. Availability of water
During rainy season (%)
During dry season (%)
Status
Own tubewell
Tubewell jointly
Supply water
Public tubewell
Own tubewell
Tubewell jointly
Supply water
Public tubewell
Sufficient 99.1 99.1 95.5 99.5 67.1 69.7 88.9 60.9 Insufficient .9 .9 4.5 .5 32.9 30.3 11.1 39.1 n 19224 22842 686 23026 19224 22842 686 23026
Satisfaction related to source of water This section explains the state of satisfaction with existing source of water and also the interest to install new source of water among the study households. Table 5.16 shows that majority of the households (61.1%) were satisfied with their existing source of water. Satisfaction state with existing source of water differed at different levels of study households. About half of the hardcore poor were dissatisfied with their existing sources of water. Dissatisfaction among non-poor was lower (34%) compared to poor (41.8%) and hardcore poor (50%), indicating that non-poor got more safe water over time. Subsequently, non-poor compared to hardcore poor (59.3%) and poor (54.2%) were interested to a lesser extent (46.1%) to install new sources of water (Table 5.17). Interest to install new sources of water among hardcore poor was higher compared to non-poor. However, it is encouraging that more than half of the hardcore poor and poor expressed their interest positively towards installing new source of water, which could mean that these households were aware of the benefits of safe water. Table 5.16. Satisfaction with existing source of water
Subject Hardcore poor (%) Poor (%) Non-poor (%) All (%) Satisfied 50.0 58.2 66.0 61.1 Dissatisfied 50.0 41.8 34.0 38.9 n 8066 11949 24978 44993
Table 5.17. Interest to install new source of water
Interest Hardcore poor (%) Poor (%) Non-poor (%) All (%) Interested 59.3 54.2 46.1 50.6 Uninterested 40.7 45.8 53.9 49.4 n 8066 11949 24978 44993
Preferred source of water Different sources of water are available in Bangladesh. Among the study households that were interested to install a new source of water, 97.4% preferred

WASH baseline findings
63
tubewells (Table 5.18). It means that they were either habituated in using tubewell water, or they were aware of the safe nature of tubewell water. Another study (UNDP/WB 1994) also showed that tubewell water was the preferred source for drinking. Yet surface water still remained the primary source for many other domestic uses for at least for 46% of the population (BBS 1997). Earlier tubewell water was considered as safe drinking water. As a result, during the last two decades, the incidence of cholera and hepatitis reduced significantly (WHO 2006). But at present, due to the presence of arsenic in ground water and tubewell water does not mean safe drinking water for all the cases. Study people irrespective of hardcore poor (98.1%), poor (97.9%), and non-poor (96.8%) preferred tubewell water, of course, arsenic free-tubewell water. Table 5.18. Preferred source of water
Subject Hardcore poor (%) Poor (%) Non-poor (%) All (%) Tubewell water 98.1 97.9 96.8 97.4 Others 2.1 2.3 3.8 3.0 n 4784 6474 11518 22776
Preferred size of monthly installment on loan When asked, what is the preferred size of monthly installment, about 28% of study population irrespective of hardcore poor, poor, and non-poor preferred Tk. <25/month (Table 5.19). Opportunity of having loan with affordable installment may encourage community people to install new safe sources of water. Successful loan-realization largely depends on loan-repayment criteria. Loan-repayment criteria should be developed in consultation with related experts, organizations and also concerned beneficiaries. Table 5.19. Willingness to pay for tubewells
Preferred installment Hardcore poor (%) Poor (%) Non-poor (%) Total (%) >400 0.6 1.2 2.4 1.7 350-400 0.1 0.1 0.3 0.2 300-350 0.5 0.9 1.7 1.2 250-300 0.4 0.7 1.2 0.9 200-250 3.9 6.5 9.8 7.6 150-200 10.1 16.2 18.5 16.1 100-150 17.2 19.7 18.5 18.6 75-100 2.0 1.9 1.2 1.6 50-75 20.2 18.5 14.2 16.7 25-50 11.6 7.3 4.9 7.0 <25 33.3 27.0 27.2 28.4 Not applicable 0.0 0.1 0.1 0.1

Water for life: status of water
64
CONCLUSION Access to tubewell water for drinking among the study households was almost similar (98.1%) to the national coverage of 98%. Use of tubewell water was much higher for drinking purpose compared to cooking, washing, and bathing. This is a common scenario in rural Bangladesh. Around 43% of the study households had their own tubewells. Status of ownership of tubewells among hardcore poor was much lower compared to non-poor. Functional state of existing tubewells among study households was good, about 91.5% were functional. Hardcore poor were more at risk of exposure to contaminated tubewell water compared to non-poor. More than 70% of the platforms of the tubewells that the hardcore poor people owned were ruptured or non-solid. Majority of the tubewells among the study households were not tested for arsenic. Of the tested tubewells, most were found arsenic-free. Of those households with arsenic contaminated tubewells, two-thirds of them used arsenic contaminated water for drinking purposes. It largely indicates the lack of awareness on arsenic problem among study people or lack of alternative safe water sources. Furthermore, about 96% of the study households did not purify surface water, or water from any other sources, for drinking. Around 40% of the tubewells were placed within 10 meters of the latrines, which is unsafe. During installation of tubewells and construction of latrines safe distance must be ensured along with other factors. Females in most of the households were responsible for collecting water for household work. Women in rural households in Bangladesh are concerned with drinking, cooking, and washing water for household use (WHO 2006). Women members in the households also played a vital role in cleaning tubewell platform on regular basis in most cases. Most of the study households got sufficient water either from tubewells or other sources especially in rainy season. Some of the households faced water crisis in dry season. About 50percent of the hardcore poor were dissatisfied with their existing sources of water. Dissatisfaction concerning source of water among non-poor was lower compared to poor and hardcore poor. Interest to install new source of water among hardcore poor was higher compared to non-poor. Almost all of the study households preferred arsenic-free tubewell water. However, in the context of large-scale contamination of tubewells with arsenic in Bangladesh, it is advisable to have an immediate concern in providing safe water free from arsenic as well as other chemical and bacteriological contamination. The technology to provide safe water should have features that are desirable in any water supply system including pond sand filter, rain water harvester.
WASH baseline findings
65
Status of Sanitation: A Focus on Latrines in WASH Programme Area Nasima Akter and Ananta Z. Neelim
“We shall not finally defeat AIDS, tuberculosis, malaria, or any of the other infectious diseases that plague the developing world until we have also won the battle for safe drinking water, sanitation and basic health care.”
-Kofi Annan, former United Nations Secretary-General
INTRODUCTION
It is now widely believed that safe water supplies alone can do little to improve health conditions without similar progress in sanitation. Unhygienic sanitation reduces the potential benefits of safe water supply by transmitting pathogens from infected to healthy people. Similarly, indiscriminate defecation leaves pathogen-rich faecal matter in the open that ultimately contaminates surface water. Cross-country studies also show that the method of disposing of excreta is one of the strongest determinants of child survival: the transition from unimproved to improved sanitation reduces overall child mortality by about a third (WHO 2000; World Bank 2003; UNDP 2006). Thus, it is imperative, from a public health or policy perspective, that safe water and sanitation must be approached in a holistic rather than a partial way in order to achieve the full benefits of each for every sector of the country.
6

Status of sanitation: a focus on latrines in WASH programme area
66
Almost half the developing world lacks access to basic sanitation, many more lack access to good quality sanitation (World Bank 2003; Jenkins and Curtis 2005). Not having access to sanitation means that people are forced to defecate in the open or public areas (UN 2002). The lack of perception of various linkages between health and sanitation practice only aids to people’s choice to take part in indiscriminate defecation. In a micro scale, the problem becomes more acute. Coverage rates of latrines within countries exhibit wide variation leading to pockets of the country where rates dip down to shocking levels. These pockets also coincide with pockets that exhibit higher level of poverty. It has been observed that improved sanitation not only brings advantages for public health, but also has positive effects on livelihoods and dignity—advantages that extend beyond households to entire communities. Toilets may seem an unlikely catalyst for human progress—but the evidence is overwhelming (WHO 2000; World Bank 2003; UNDP 2006). Building a latrine is the first step on the sanitation ladder in developing countries where majority of the population defecate in open or public areas. Thus, public health programmes to improve sanitation, which have consistently framed promotional messages in terms of fecal–oral disease prevention, have largely failed to motivate changes in sanitation behaviour. As estimated 10,000 people die every day worldwide from water and sanitation related diseases, and thousands more suffer from a range of debilitating illnesses. The impact of inadequate water and sanitation services falls primarily on the poor. Water and sanitation-related sicknesses put severe burdens on health services (World Bank 2002, 2003). Diarrhoea spreads most readily in environments of poor sanitation where safe water is unavailable. Many communicable diseases may occur due to low access of safe drinking water and poor sanitary practices. A study showed that water-borne diseases are one of the major causes of under-five mortality, along with pneumonia, malaria, and measles (Talk International 2004). In 1994, the government of Bangladesh launched its social mobilization for sanitation project to make people aware of the need for safe disposal of excreta. But, the project achieved very little (Hadi 2000). Given the failure of the programme, the government of Bangladesh has taken up an extensive programme of ‘national sanitation campaign’ in order to ensure construction of sanitary latrines, its use and personal hygiene practiced by all by the year 2010. The government is using the help of many NGOs to achieve its goals (NGO forum, BRAC, VERC, Grameen bank and many other local NGOs). So far the outcomes have been promising. Sanitation coverage is increasing, moving from 33% in 2003 (UNICEF 2003) to 39% in 2004 (UNDP 2006) to about 48% in 2005 (WSP 2005). Bangladesh Bureau of Statistics (BBS 2005) reported that the national sanitation coverage was 31% (only sanitary and water sealed pacca latrine) and 52% (both water sealed and no water seal) in 2004. However, there is still disparity between urban and rural areas. While 48% of urban dwellers have

WASH baseline findings
67
access to proper sanitary system, only 24% of rural people have been covered under proper sanitation (BBS 2005). Even though there is disparity in urban and rural settings, the overall improvement is appreciable in terms of meeting the Millennium Development Goals (MDG). A target to halve the proportion of the world’s population without adequate sanitation by 2015 was included in the MDG (UN 2002). International agencies and sanitation experts have called for new demand-responsive approaches to address the sanitation gap (Cairncross 1992, 2003, Lafond 1995, WHO/UNICEF 2000). If such approaches are to achieve the required growth in coverage rates, it becomes imperative that we understand what generates demand and how to motivate more households to adopt improved sanitation. Such insights into consumer behaviour and demand have thus far been lacking in the sanitation and public health literature. The results establish a perception emerging from earlier work that sanitation consumers often have motives which have little or nothing to do with health protection or a healthier environment, and much more to do with prestige (Cotton et al. 1995, Elmendorf 1980, Goodhart 1988, Murthy et al. 1990, Perrett 1983). On the other hand, women were motivated more by convenience, comfort, and privacy. One of the main focuses of the WASH programme is to improve the level of sanitation and hygiene (access and practices) in rural Bangladesh. This is in line with the MDG to reduce child and infant mortality rates and PRSP targets of achieving 100% national sanitation target by 2010 (GoB 2005). To achieve its targets it is imperative that WASH should aim to improve both the level of awareness and level of sanitary practice in both rural and urban Bangladesh1. For its success, in the most cost-effective manner, WASH should identify the main stakeholders, their behaviours and learn lessons from researches that have taken place with regard to sanitation in other countries. It is a note of promise that BRAC has achieved a series of success in installing sanitary latrine within a limited time frame preceding the WASH programme (BRAC 2004, Chowdhury and Hossain 2006). Experiences gathered from those programmes will only be an advantage to achieving the targets set up by WASH. This study aims to present the initial status of sanitation access and practices existing in 75 selected upazilas of Bangladesh. Besides providing the utility of being a baseline, the study also identifies the status of perception of sanitation and good health amongst the residents of these upazilas. It also identifies the main impediments that WASH will face in achieving its goals and provides solutions in terms of which policy instruments will be better on what agents in the society.
1 Both indicated as a precursor to achieving 100% sanitation in the National Sanitation Strategy (GoB 2005)
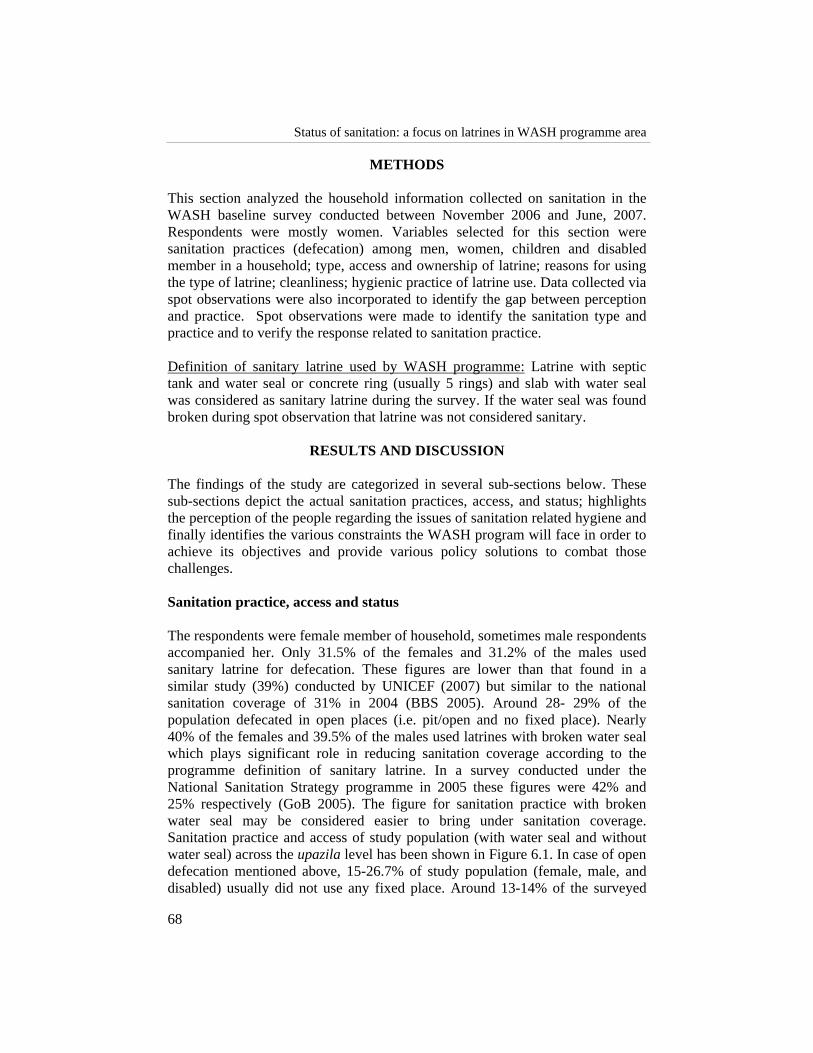
Status of sanitation: a focus on latrines in WASH programme area
68
METHODS This section analyzed the household information collected on sanitation in the WASH baseline survey conducted between November 2006 and June, 2007. Respondents were mostly women. Variables selected for this section were sanitation practices (defecation) among men, women, children and disabled member in a household; type, access and ownership of latrine; reasons for using the type of latrine; cleanliness; hygienic practice of latrine use. Data collected via spot observations were also incorporated to identify the gap between perception and practice. Spot observations were made to identify the sanitation type and practice and to verify the response related to sanitation practice. Definition of sanitary latrine used by WASH programme: Latrine with septic tank and water seal or concrete ring (usually 5 rings) and slab with water seal was considered as sanitary latrine during the survey. If the water seal was found broken during spot observation that latrine was not considered sanitary.
RESULTS AND DISCUSSION The findings of the study are categorized in several sub-sections below. These sub-sections depict the actual sanitation practices, access, and status; highlights the perception of the people regarding the issues of sanitation related hygiene and finally identifies the various constraints the WASH program will face in order to achieve its objectives and provide various policy solutions to combat those challenges. Sanitation practice, access and status The respondents were female member of household, sometimes male respondents accompanied her. Only 31.5% of the females and 31.2% of the males used sanitary latrine for defecation. These figures are lower than that found in a similar study (39%) conducted by UNICEF (2007) but similar to the national sanitation coverage of 31% in 2004 (BBS 2005). Around 28- 29% of the population defecated in open places (i.e. pit/open and no fixed place). Nearly 40% of the females and 39.5% of the males used latrines with broken water seal which plays significant role in reducing sanitation coverage according to the programme definition of sanitary latrine. In a survey conducted under the National Sanitation Strategy programme in 2005 these figures were 42% and 25% respectively (GoB 2005). The figure for sanitation practice with broken water seal may be considered easier to bring under sanitation coverage. Sanitation practice and access of study population (with water seal and without water seal) across the upazila level has been shown in Figure 6.1. In case of open defecation mentioned above, 15-26.7% of study population (female, male, and disabled) usually did not use any fixed place. Around 13-14% of the surveyed

WASH baseline findings
69
population defecated in some kind of fixed place. A multi pronged approach is required to tackle with these different practices of the people differently in order to bring them under safe sanitation practice. Following this multi pronged approach will be both cost effective and time saving. There was no separate arrangement of latrine for the disabled population except in few cases e.g. bed pan, chair with a hole. Practice of using sanitary latrine amongst disabled people was about 5 percentage points lower than that of the average. A similar figure (26.7%) was observed for children (children within 5 years of age). The national statistics on disposal of faeces of children (under 5) in no fixed place was 61% in 2003 (UNICEF, 2007), the corresponding figure in this study was 69% (Table 6.1). The following table depicts sanitary practices of defecation among the surveyed population. According to Rahman and Kumar (2006), 78% of rural Bangladesh was under complete sanitation coverage. However, the findings of our study were completely different. One of the reasons for this might be that the definitions of sanitation used by different organizations were less restrictive than the one used in this study. Table 6.1. Sanitation practices amongst study population
Practice of defecation Female (%) Male (%) Disabled (%) Sanitary 31.5 31.2 26.5 Broken water seal 39.8 39.5 33.6 Pit/open 13.8 13.6 13.3 No latrine 14.9 15.7 26.7 Children (< 5 years) (%) Latrine (+ pot, commode) 26.7 Premises 48.4 No fixed place 20.6
Table 6.2 shows that there is a disparity in terms of sanitation practice across the economic classes. A non-poor person is 18.3 percentage point more likely to use sanitary latrine than a hardcore poor person. Seventy eight percent of the non-poor population used some sort of latrine (with or without water seal), whereas the respective figure for the hardcore poor was only 56.3%. Among the hardcore poor 43.7% people defecate openly, whereas only 22.1% of the non-poor population defecated openly.

Status of sanitation: a focus on latrines in WASH programme area
70
Table 6.2. Sanitation practice across economic class
Hardcore poor Poor Non-poor Total Details (%) (%) (%) (%)
Sanitary 20.3 25.5 38.4 31.3 Broken water seal 36.1 42.6 39.5 39.6 Pit/open 17.2 15.3 11.6 13.7 No latrine 26.5 16.6 10.5 15.4 n 18860 23013 48102 89975
Among the survey households, 58.2% of the households own latrines, of which 38.6% was sanitary. Other than that, 17.7% of the people share latrines with other people and 33.6% of these latrines were sanitary. The rest of the households did not own latrines. They either use latrines of other people or defecate openly. Table 6.3 shows the ownership of latrines and their sanitary condition. Table 6.3. Ownership of total latrine and sanitary latrine (% of Households)
Ownership Total latrine (%) Only sanitary latrine (%) Own 58.2 38.6 Shared 17.7 33.6 No ownership 12.0 21.3 N/A (not applicable) 12.2
It can be noted that, in case of sanitation respondents’ answers were verified with spot observation to identify the latrine type. Quality of the latrines from spot observation This section illustrates the actual quality of the latrines as observed during the survey. The enumerators were asked to check the status of the latrines after interviewing the respondents to confirm the type of latrine and its cleanliness. They were asked to fill out a set of questions regarding latrine hygiene and score them, according to a strict guideline, based on what they observed. This sort of technique was adopted to avoid the varying degrees of perception of cleanliness2
and hygiene across the surveyed households. Table 6.4 clearly corroborates what was claimed in the earlier subsection. In most cases, based on the responses of the four questions, the quality of the latrines was not up to par. It was observed that 66% of the latrines were not clean. This is not surprising given only 34.4% of the latrines were close to a source of water. Such
2 Clean according to the definition set by WASH signifies that the latrine will not emit foul smell, there will
be no visible presence of fecal matter around the latrine, and no visible presence of mosquitoes and flies in or around the latrine

WASH baseline findings
71
high levels of dirtiness can give rise to huge hubs for diseases, especially endangering children, who have lower levels of immunity.
Table 6.4. Indicators of quality of latrines
Is the latrine clean? Hardcore poor Poor Non-poor Total (%) (%) (%) (%) Yes 28.1 28.8 37.2 34.0 No 71.9 71.2 62.8 66.0 n 3637 7175 18092 28904 Is there foul smell coming from the latrine? Hardcore poor Poor Non-poor Total (%) (%) (%) (%) Yes 69.9 69.8 60.1 63.7 No 30.1 30.2 39.9 36.3 n 3637 7175 18092 28904 Are any fecal matters left in the latrine? Hardcore poor Poor Non-poor Total % % % % Yes 55.4 54.2 46.2 49.3 No 44.6 45.8 53.8 50.7 n 3637 7175 18092 28904 Is there any water in and/or near the latrine? Hardcore poor Poor Non-poor Total % % % % Yes 28.8 30.4 37.1 34.4 No 71.2 69.6 62.9 65.6 n 3637 7175 18092 28904
It was noticed that 63.7% of the latrines emitted foul smell. Similarly 49.3% of the observed latrines were found to have faecal residues. This is a deterrent for people using latrines, and it is possible that these cleanliness factors play a part in their choice to defecate in open space. The problem of clean latrines was more acute for poor households. Latrines in hardcore poor households were 9.1 percentage point more likely to be dirtier and 9.8 percentage point more likely to be foul smelling than the ones in non-poor households. Water facilities were also poorer in the hardcore poor households. There is a clear negative relationship between latrine hygiene and poverty and to succeed, the WASH programme must address this issue. Distance between household and latrine can be another reason to defecate in open space. To address this issue the study measured the distance between the latrine and homestead. It was observed that most latrines (97%) were close to the homestead (within 50m or less). It was also observed that there was very little variation in distances across poverty groups, gender or seasons (Table 6.5). Thus, it is clear that distance between latrines and houses were not a driving force in

Status of sanitation: a focus on latrines in WASH programme area
72
Figure 6.1. Spatial distribution of sanitation access among the study population
�(in percentage)
ACCESS TO SANITARY LATRINE (WITH WATER-SEAL)
7.17 - 2525.1 - 5050.1 - 7575.1 - 83.17
�(in percentage)
ACCESS TO SANITARY LATRINE (WITH BROKEN WATER-SEAL)
7.5 - 2525.1 - 5050.1 - 75
N
Not to Scale
N
Not to Scale

WASH baseline findings
73
the practice of open defection. However, further qualitative research can be undertaken to actually see why people defecate openly especially highlighting differences across gender. Table 6.5. Distance between latrine and house (in %)
Hardcore poor Poor Non-poor Total 0-50 m 97.3 96.8 96.9 97 >50 m 2.7 3.2 3.1 3 Total 100 100 100 100
Perception and practice of sanitation-related hygiene Each respondent was asked some specific questions based on what they perceived to be clean and following hygienic practice. Four questions regarding sanitation practice were chosen. The questions were regarding the reasons for using latrines, availability of water in latrines, the use of sandals while using latrine and the cleanliness of latrines. In the first question, the respondents were asked to identify reasons as to why they used latrines (existing type of latrine – which might not be sanitary) and similarly asked to identify reasons for defecating openly. Table 6.6 shows the summary of the responses. The answers of the respondents were grouped into six main categories of convenience, health and environment, social status, economic reason, shame and others (e.g. no alternatives, no places, etc.). Table 6.6. Perceptions of latrine hygiene a) Reasons for using latrine
Hardcore poor Poor Non-poor Total % % % % Convenience 23.9 25.9 23.4 24.1 Health and environment 44.4 48.8 55.3 52.1 Social status 3.4 3.5 4.1 3.8 Economic 21.3 15.8 11.4 14.0 Shame 0.0 0.0 0.0 0.0 Others 7.0 6.0 5.8 6.0 n 4108 6293 16184 26585
b) Reasons for not using latrines
Hardcore poor Poor Non-poor Total % % % % Convenience 4.0 6.4 11.4 7.7 Economic reasons 70.7 64.0 58.9 64.0 Social reasons 25.1 29.6 29.6 28.3 Others 0.1 0.0 0.1 0.1 n 3340 3276 4476 11092
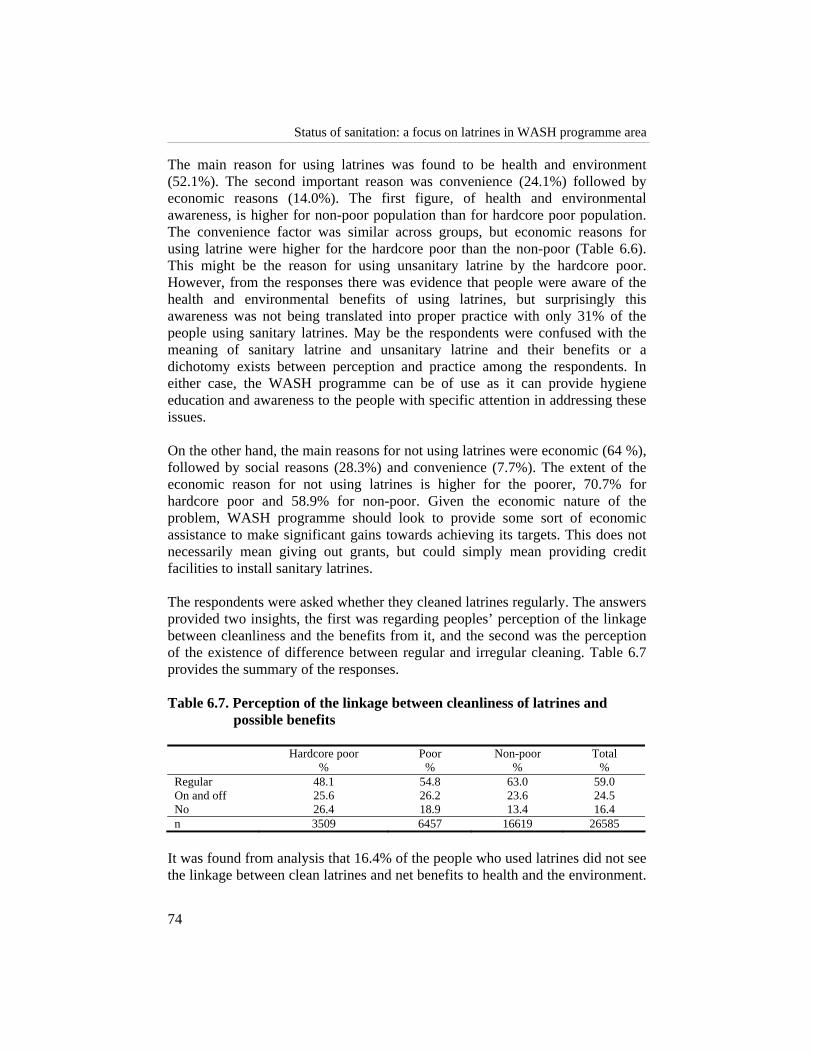
Status of sanitation: a focus on latrines in WASH programme area
74
The main reason for using latrines was found to be health and environment (52.1%). The second important reason was convenience (24.1%) followed by economic reasons (14.0%). The first figure, of health and environmental awareness, is higher for non-poor population than for hardcore poor population. The convenience factor was similar across groups, but economic reasons for using latrine were higher for the hardcore poor than the non-poor (Table 6.6). This might be the reason for using unsanitary latrine by the hardcore poor. However, from the responses there was evidence that people were aware of the health and environmental benefits of using latrines, but surprisingly this awareness was not being translated into proper practice with only 31% of the people using sanitary latrines. May be the respondents were confused with the meaning of sanitary latrine and unsanitary latrine and their benefits or a dichotomy exists between perception and practice among the respondents. In either case, the WASH programme can be of use as it can provide hygiene education and awareness to the people with specific attention in addressing these issues. On the other hand, the main reasons for not using latrines were economic (64 %), followed by social reasons (28.3%) and convenience (7.7%). The extent of the economic reason for not using latrines is higher for the poorer, 70.7% for hardcore poor and 58.9% for non-poor. Given the economic nature of the problem, WASH programme should look to provide some sort of economic assistance to make significant gains towards achieving its targets. This does not necessarily mean giving out grants, but could simply mean providing credit facilities to install sanitary latrines. The respondents were asked whether they cleaned latrines regularly. The answers provided two insights, the first was regarding peoples’ perception of the linkage between cleanliness and the benefits from it, and the second was the perception of the existence of difference between regular and irregular cleaning. Table 6.7 provides the summary of the responses. Table 6.7. Perception of the linkage between cleanliness of latrines and
possible benefits
Hardcore poor Poor Non-poor Total % % % % Regular 48.1 54.8 63.0 59.0 On and off 25.6 26.2 23.6 24.5 No 26.4 18.9 13.4 16.4 n 3509 6457 16619 26585
It was found from analysis that 16.4% of the people who used latrines did not see the linkage between clean latrines and net benefits to health and the environment.

WASH baseline findings
75
A further 24.5% of the people using latrines did not see the difference between regular cleaning and irregular cleaning. This is alarming because these statistics were collected from people who have been using latrines and did not take into account people not using latrines. Like all the other variables, the situation of the hardcore poor was worse than the non-poor. Although 59% of the people claimed to clean their latrines regularly, 34% of the latrines were found clean during observation (from previous section). Thus, gaps exist in both knowledge and between perception and practice. Table 6.8 shows that people were aware of the benefits of wearing sandals while using latrines. Hence, there is little knowledge gap. On the other hand, during spot observations no sandals near latrines were observed in 96% of the cases, showing a huge gap in terms of perception and practice. Table 6.8. Usage of sandals while using latrines
Hardcore poor Poor Non-poor Total % % % % Yes 85.8 90.9 93.1 91.2 No 14.2 9.1 6.9 8.8 n 8129 12076 25212 45417
Table 6.9 shows that 59.8% of the respondents indicated that the water availability near the latrines they used was poor. To make matters worse 13% of the latrines had soaps inside or nearer. This is a reflection of the lack of understanding of the importance of cleaning latrines after using and their hands after defecating. The disparity between the non-poor and the hardcore poor was also stark. A non-poor household was 12.1 percentage points more likely to have access to water near their latrines compared to hardcore poor households. Spot observation revealed that 65.6% of the latrines had no or limited water sources nearer, leaving with a gap of 5.8 percentage points. Map 6.2 shows the spot observation results of water availability near latrine in different upazila level, which reveals the relationship between latrine cleanliness and water availability at that area. Table 6.9. Water availability near latrines Hardcore poor Poor Non-poor Total % % % % Inside the latrine 2.1 1.9 5.1 3.9 Near the latrine 29.4 34.3 38.5 36.3 Far from the latrine 57.2 54.7 49.8 51.9 None 11.3 9.1 6.6 7.8 n 3509 6457 16619 26585
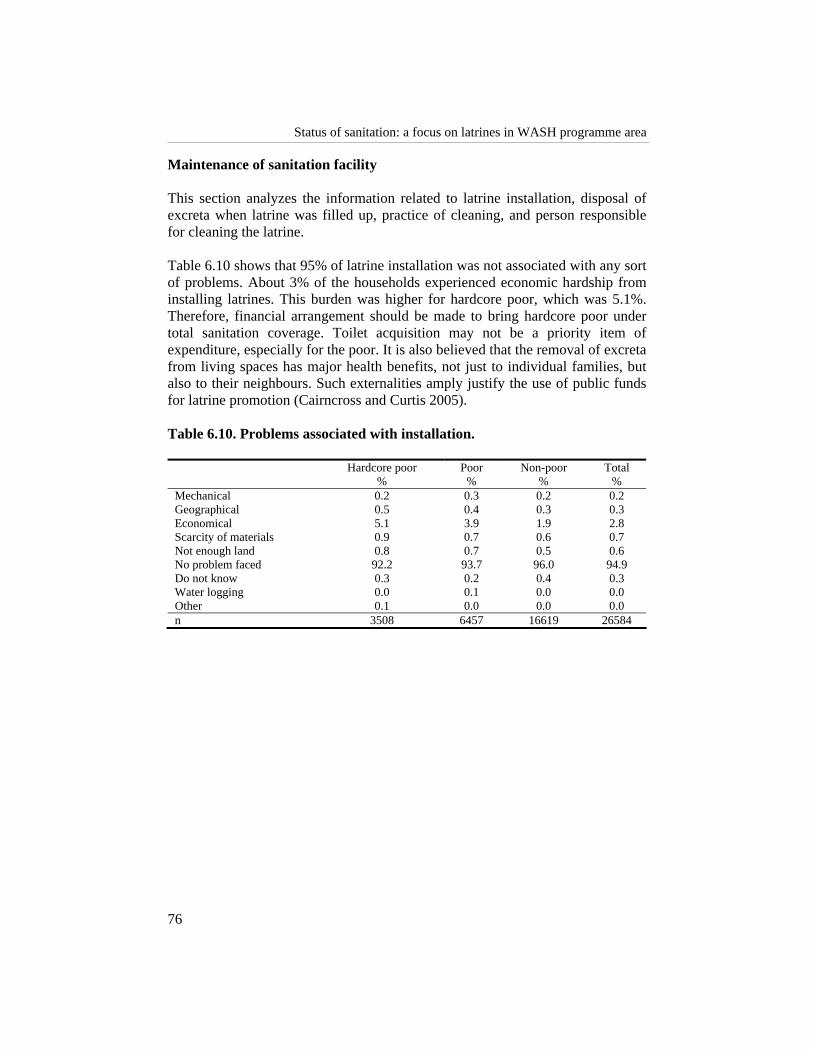
Status of sanitation: a focus on latrines in WASH programme area
76
Maintenance of sanitation facility This section analyzes the information related to latrine installation, disposal of excreta when latrine was filled up, practice of cleaning, and person responsible for cleaning the latrine. Table 6.10 shows that 95% of latrine installation was not associated with any sort of problems. About 3% of the households experienced economic hardship from installing latrines. This burden was higher for hardcore poor, which was 5.1%. Therefore, financial arrangement should be made to bring hardcore poor under total sanitation coverage. Toilet acquisition may not be a priority item of expenditure, especially for the poor. It is also believed that the removal of excreta from living spaces has major health benefits, not just to individual families, but also to their neighbours. Such externalities amply justify the use of public funds for latrine promotion (Cairncross and Curtis 2005). Table 6.10. Problems associated with installation.
Hardcore poor Poor Non-poor Total % % % % Mechanical 0.2 0.3 0.2 0.2 Geographical 0.5 0.4 0.3 0.3 Economical 5.1 3.9 1.9 2.8 Scarcity of materials 0.9 0.7 0.6 0.7 Not enough land 0.8 0.7 0.5 0.6 No problem faced 92.2 93.7 96.0 94.9 Do not know 0.3 0.2 0.4 0.3 Water logging 0.0 0.1 0.0 0.0 Other 0.1 0.0 0.0 0.0 n 3508 6457 16619 26584

WASH baseline findings
77
Map 6.2. Spatial distribution of water availability near latrine across upazila level (spot observation)
Table 6.11 shows that 63% of the latrines that have been installed have not filled up yet. However, when they did fill up, 76% of the households cleaned the filled up latrines to make them usable again, 22% of the households installed new latrines or used latrines owned by others. About 2% of the people went back to
13 - 19 20 - 3940 - 5960 - 81
WATER AVAILABILITY NEAR LATRINE (in percentage)
N
Not to Scale

Status of sanitation: a focus on latrines in WASH programme area
78
open defecation or did not take any action to clean the latrine which is analogous to open defecation. This is optimistic as it can be seen that once people start using latrines, they experience the benefits from it and do not go back to defecating in open space. Table 6.11. Actions taken when latrine fills up
Hardcore poor Poor Non-poor Total % % % % Clean and use 22.0 25.2 30.7 28.2 Use new or other latrines 12.8 9.6 6.7 8.2 No action taken 1.0 0.7 0.7 0.8 Not filled 64.3 64.5 61.9 62.9 n 3505 6453 16613 26571
Finally, the respondents were asked to indicate how people cleaned latrines and who was responsible for it. Tables 6.12 and 6.13 summarize the results. Table 6.12. Cleaning latrines
Hardcore poor Poor Non-poor Total % % % % High quality cleaners 8.9 10.9 21.3 17.5 Low quality cleaners 0.4 0.9 0.6 0.6 Only water 30.4% 28.5 24.4 26.0 Use hardware 59.8 59.4 53.5 55.6 Others 0.4 0.3 0.2 0.2 n 3143 6560 18725 28428
Although 55.6% of the households used hardware to clean the latrines, the full health benefits of a latrine could only be realized if the latrines were clean. Given what was observed in first section of this results and discussion chapter, it is not surprising that only 18.1% of the people were using some sort of cleaning agents to clean their latrines. There might be two reasons for this practice – a) lack of knowledge, as it has been stated categorically in the report, and b) economic. The latter is based on the fact that the primary cost of maintaining latrines is associated with the usage of cleaning agents which was found to be lower for the poorer households. Table 6.13 shows that, female members of the household clean 84.8% of the latrines. This is significant in setting target groups for disseminating knowledge. If WASH programme focused on educating only women about the importance of clean latrines and teach them methods of cleaning latrines it would be more cost-effective than teaching men or the whole population in general. However, this will increase the workload of females and hence would also suggest that males be taught simultaneously.

WASH baseline findings
79
Table 6.13. Person responsible for cleaning latrine
Hardcore poor Poor Non-poor Total % % % % Male member 2.7 3.8 4.4 4.1 Female member 86.9 86.0 83.9 84.8 Both 5.4 6.2 9.0 7.8 Rented sweeper 0.4 0.2 0.4 0.4 Servant 0.1 0.0 0.3 0.2 Sweeper 0.1 0.1 0.1 0.1 Not cleaned 3.4 2.3 1.3 1.8 Others 1.0 1.3 0.6 0.8 n 3947 7597 18585 30129
SATISFACTION AND DEMAND FOR SANITARY LATRINE
To implement WASH programme in a meaningful way within a fixed period, it is vital that the constraints to its success are identified and steps are taken to overcome those constraints. Keeping that in mind, several questions were asked during the baseline survey to understand some of these constraints and formulate solutions. The first set of questions was regarding people’s opinion about why they need latrines. According to the respondents, the main reason for having a latrine was health-related (Table 6.14). About 62.5% of the respondents believed that by using latrines they will lead to better health. Around 18% of the respondents mentioned that they need latrines because they found it to be more convenient than defecating in open places. Though 5% of the households believed that latrines improved overall cleanliness and 5.8% of the respondents believed that having latrines were signs of modernity, or it would be shame not to have one. About 37.5% of the people could not identify the link between latrine usage and good health. This perception of this link must be established with this group of the respondents along with a reinforcement or reiteration of the health benefits of using latrines to the whole population. Given the poor quality of hygiene practice in latrines, this would be key to improve sanitation and hygiene practice. Table 6.14. People’s opinion about why they need latrines
Hardcore poor Poor Non-poor Total % % % % Convenience 20.1 18.2 16.8 17.9 Reliability 9.2 8.3 7.1 7.9 Health 61.7 62.7 62.7 62.5 Cleanliness 5.2 5.3 5.0 5.1 Modern/Contemporary 3.1 4.9 7.5 5.8 Others 0.8 0.7 0.8 0.8 n 5416 7378 13376 26170
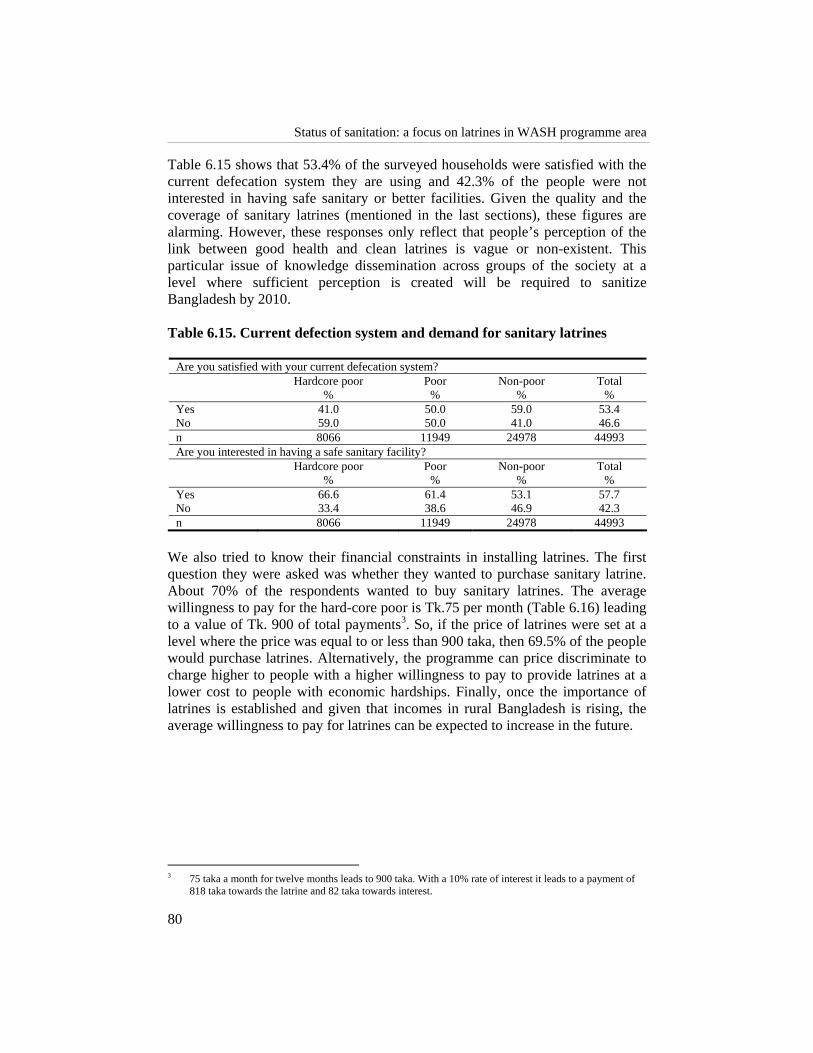
Status of sanitation: a focus on latrines in WASH programme area
80
Table 6.15 shows that 53.4% of the surveyed households were satisfied with the current defecation system they are using and 42.3% of the people were not interested in having safe sanitary or better facilities. Given the quality and the coverage of sanitary latrines (mentioned in the last sections), these figures are alarming. However, these responses only reflect that people’s perception of the link between good health and clean latrines is vague or non-existent. This particular issue of knowledge dissemination across groups of the society at a level where sufficient perception is created will be required to sanitize Bangladesh by 2010. Table 6.15. Current defection system and demand for sanitary latrines
Are you satisfied with your current defecation system? Hardcore poor Poor Non-poor Total % % % % Yes 41.0 50.0 59.0 53.4 No 59.0 50.0 41.0 46.6 n 8066 11949 24978 44993 Are you interested in having a safe sanitary facility? Hardcore poor Poor Non-poor Total % % % % Yes 66.6 61.4 53.1 57.7 No 33.4 38.6 46.9 42.3 n 8066 11949 24978 44993
We also tried to know their financial constraints in installing latrines. The first question they were asked was whether they wanted to purchase sanitary latrine. About 70% of the respondents wanted to buy sanitary latrines. The average willingness to pay for the hard-core poor is Tk.75 per month (Table 6.16) leading to a value of Tk. 900 of total payments3. So, if the price of latrines were set at a level where the price was equal to or less than 900 taka, then 69.5% of the people would purchase latrines. Alternatively, the programme can price discriminate to charge higher to people with a higher willingness to pay to provide latrines at a lower cost to people with economic hardships. Finally, once the importance of latrines is established and given that incomes in rural Bangladesh is rising, the average willingness to pay for latrines can be expected to increase in the future.
3 75 taka a month for twelve months leads to 900 taka. With a 10% rate of interest it leads to a payment of
818 taka towards the latrine and 82 taka towards interest.

WASH baseline findings
81
Table 6.16. Willingness to pay for latrines
Hardcore poor Poor Non-poor Total Preferred amount per installment per month (in Taka) % % % % >400 0.4 0.7 1.9 1.3 350-400 0.1 0.2 0.4 0.3 300-350 0.3 0.6 1.5 1.0 250-300 0.2 0.6 1.2 0.8 200-250 3.4 4.7 8.9 6.6 150-200 10.2 13.5 18.3 15.3 100-150 14.5 19.5 20.6 19.1 75-100 2.3 2.5 2.2 2.3 50-75 27.9 28.7 23.5 25.9 25-50 20.4 14.5 9.4 13.1 <25 20.3 14.3 11.8 14.2 Not applicable 1 0.2 0.4 0.3 n 3638 5202 9215 18055
CONCLUSION AND RECOMMENDATIONS
The status of sanitation coverage in WASH study areas was poor with only 31.5% of the people using sanitary latrines and around 29% people defecating in open places and rest are using latrine with broken water seal. Out of 29%, around 13-14% population used at least some kind of fixed place whereas 14-27% did not have any fixed place for defecation. Therefore, these two groups may need different motivation strategy to bring them under sanitation coverage. As some people defecate in a fixed place they may need comparatively little effort to change their behaviour. People who were using latrine with broken water seal would be easier to bring under sanitation coverage by repairing the water seal. There was a disparity in terms of sanitation practice across the economic classes as well. A non-poor is 18.3 percentage points more likely to use sanitary latrine than a hardcore poor. The ownership of latrine would be a factor in this case as most of the sanitary latrines used by the respondents were own and shared, which might not give access to the hardcore poor. Therefore, hardcore poor need more attention to reach the target of 100% coverage. It was found that the hygiene quality of existing latrines was also poor. Spot observations indicate that 66% of the latrines were not clean, 64% of the latrines were foul smelling, 49.3% of the latrines had left over fecal matter, and 65.6% of the latrines did not have water access. These figures deteriorate as it moves across economic classes from rich to poor. Given the amount of effort and money that has been spent by the state and other NGOs over the years, a lot is left to be desired. To achieve the targets that were set at the beginning of the program, WASH programme should aim to increase the access to sanitary latrines and simultaneously work towards improving the quality of latrines across the community. There is lot of room for improvement in both areas. However,

Status of sanitation: a focus on latrines in WASH programme area
82
providing economic incentives to the right agents would again be vital in achieving an overall improvement across all the economic sections of the society. Also it is imperative that special focus must be on the poorer people. The study identified that the main reason for not using latrines is economic (64%). This information would be useful to mobilize and reallocate government loans (e.g. ADP loan) to bring these people with economic hardship under sanitation coverage. One of the main focuses of this study was to highlight the existence of knowledge gaps, and gaps between perception and practice with regard to sanitation. It can be concluded that gaps exist in both cases. For example, 16.4% of the people who use latrines do not see the linkage between clean latrines and net benefits to health and the environment and a further 24.5% of the people using latrines do not see the difference between regular cleaning and irregular cleaning. Fifty nine percent of the respondents claimed to clean their bathrooms regularly, but only 34% of the latrines were found clean during spot observations. Another stark dichotomy between perception and practice was found when sandal usage in latrines was analyzed. Ninety-one percent of the people responded that the use of sandals in latrines as hygienic, but in 96% of the cases no sandals were found near latrines. Thus, gaps exist in both knowledge and between perception and practice. With regard to the maintenance of sanitation facilities there are no possible threats at present. Most of the installed latrines have not filled up yet and when they did, in most cases they were cleaned out or the users of that latrine switched to other latrines. Remarkably, only two percent of the people switched to open defection after their latrines filled up. This is optimistic as it can be seen once people start using latrines, they experience the benefits from it and do not go back to defecating in open places. Women are the main agents (84.8% of the cases) in cleaning latrines. This provides an incentive for WASH programme to target women as possible agents to bring about change. If WASH were to target women for hygiene education the results would come about faster. However, it would put extra stress on women who are already burdened with other household chores. Also, for a more meaningful intervention in the long run both males and females should be targeted with equal importance especially for hygiene education and promotion. The average willingness to pay for latrines for hard-core poor is Tk.75 per month leading to a value of Tk. 900 of total payments. So, if the price of latrines were set at a level that was equal to or less than Tk. 900, then 69.5% of the people would purchase latrines. Alternatively, the programme can price discriminate to charge higher to people with a higher marginal willingness to pay to provide

WASH baseline findings
83
latrines at a lower cost to people with economic hardships. Finally, once the importance of latrines is established and given that income in rural Bangladesh is rising, the average willingness to pay for latrines can be expected to increase.

WASH baseline findings
85
Hygiene Awareness and Practices Syed Masud Ahmed and Tanveer M Kamal
Nine-tenths of our sickness can be prevented by right thinking plus right hygiene — nine-tenths of it!
— Henry Miller (1891-1980)
INTRODUCTION Hygiene is the science of preserving and promoting the health of both the individual and the community and embraces personal, domestic and community hygiene (The Columbia Encyclopedia 2003). More specifically, hygiene refers to procedures or activities used to reduce microbial contamination on environmental sites and surfaces, etc. to prevent the transmission of infectious disease (IFH 2001). The public health perception of hygiene emphasizes cleanliness of water, food and the environment while the popular perception is mainly concerned with the avoidance of dirt, killing of germs or cleanliness of bathrooms and hospitals (Stanwell-Smith 2003). Hygiene has recently been emphasized as the ‘most economically sustainable prevention strategy’ (Stanwell-Smith 2003), and a cost-effective intervention for child survival in developing countries at only a fraction of the cost of water supply and sanitation (Larsen 2003). In developing countries, contamination of household environment and unhygienic practices are responsible for almost 30% of the total burden of
7

Hygiene awareness and practices
86
illnesses (World Bank 2003). Among this burden of illnesses are diarrhoeal diseases, worm infestations, and eye and skin infections. Simple hygiene practices such as sanitary disposal of excreta, handwashing after defecation and before handling food, and maintaining drinking water free from faecal contamination have been shown to prevent most of these water and sanitation-related diseases in developing countries (Wijk and Murre 1995, Curtis 2003, Fewtrell et al. 2005), including Bangladesh (Hoque 2003, Mascie-Taylor et al. 2003). However, rather than associating hygiene practices such as handwashing with illnesses and disease, people may relate it to nurturance, social acceptance and disgust (Scott et al. 2007). Sanitation and hygiene practices which effectively break down the cycle of disease transmission (faecal-oral route) are found to be more effective than the supply of improved water alone (Esrey 1996). Other researchers have found that integrated interventions can promote sustained behavioural changes towards desired direction (Metwally et al. 2007), sometimes creating demand for sanitation and hygiene through innovative measures such as community health clubs (Waterkeyn and Cairncross 2005). Good hygiene practices are now recognized to be essential for reaping optimum benefits from improved water and sanitation facilities (Wijk and Murre 1995) and need to be continued beyond the period of programme implementation. Factors such as understanding, facilitation, peer influence and autonomy are needed to sustain the changes (Wijk and Murre 1995) which also depend on socioeconomic status (Taha et al. 2000, Jenkin and Curtis 2005). In Bangladesh, majority of the population have access to safe drinking water e.g., 72% in the rural (adjusted for arsenic contamination) and 82% in the urban areas in 2005 while percentage of rural and urban population with access to improved sanitation is only 29 and 56 respectively (GoB and UN 2005). The situation in urban slums is especially distressing e.g., only 29% of slum households in metropolitan cities had access to any type of sanitary latrine in 2006 (CUS, MEASURE Evaluation and NIPORT 2006). The government of Bangladesh recognizes the importance of safe water and environmental sanitation for a healthy and productive population and is working with other development partners including the Non Governmental Organizations to achieve the relevant Millennium Development Goal targets through innovative approaches (WSP-SA 2005). BRAC, an indigenous Bangladeshi NGO, integrates its regular microcredit-based interventions with essential healthcare (EHC) services1 to reduce the vulnerability of poor households against the income-erosion effect of illness
1 health and nutrition education, water and sanitation, mch-fp, communicable disease control, and basic
curative care for common illnesses (BHP 2007)
WASH baseline findings
87
(BHP 2007). One of the main thrust of its EHC programme has been improving practices related to water and sanitation, and BRAC has demonstrated an impressive performance in this area in recent years (BHP 2007, Hossain et al. 2006, Chowdhury and Hossain 2006). It is now working with the government of Bangladesh and other development partners to achieve the national goal of 100% sanitation by the year 2010. As a continuation of this endeavour, BRAC has undertaken a comprehensive programme on water, sanitation and hygiene (WASH) in 150 upazilas (sub-districts) of Bangladesh with financial assistance from the Dutch government, to be implemented during 2006-2010 (BRAC WASH programme 2005). A baseline survey was done in 2006-07 in 75 sampled upazilas to record benchmark information and help in the informed designing of programme interventions. Interventions for sustained change in hygiene behaviour is one of the major component of the programme interventions.
METHODS This study used a sub-sample of data on women’s current knowledge and practices on hygiene from the larger WASH baseline survey conducted during 2006-‘07. For details on the study design, sampling and description of variables, please refer to Chapter two.
RESULTS AND DISCUSSION Sociodemographic profile The sociodemographic profile of the women reporting hygiene awareness/ knowledge and practices according to the poverty level of households is presented in Table 7.1. The women were in their early middle age (mean age 35 years), have had around 5+ years of schooling, mostly currently married (92%) and engaged mainly in domestic chores (92%). Women from non-poor households had higher years of schooling compared to the other two poor groups of households; also, the proportion of widowed, divorced or separated were more among women from hardcore poor households (15%) compared to others (5%) which is consistent with what was found in an earlier study (BRAC 2004). Wage-labour was more among women from hardcore poor households (9%). Around 14% of women reported to have had suffered from water-borne illnesses in the past 15 days, the proportion being marginally greater among those from poor households. This prevalence of waterborne illnesses is less than what have been observed in other studies from rural plain land (Ahmed et al. 2000) or hill tracts region of the country (Ahmed 2001).

Hygiene awareness and practices
88
Table 7.1. Sociodemographic characteristics of the study women reporting hygiene knowledge and practices
Types of households
Hardcore poor Poor Non-poor All Mean age (years) 35.6 32.9 35.7 34.9 Mean years of schooling 5.1 5.5 6.4 6.0 Marital status % Never married 1.4 1.1 1.9 1.6 Currently married 83.6 93.9 93.0 91.6 Widowed, divorced or separated 15.0 5.0 5.0 6.8 Physically disabled % 0.4 0.3 0.3 0.3 Occupation % Wage labour 9.2 2.8 0.6 2.7 Self-employed 1.5 1.1 1.0 1.1 Service/trade 2.4 1.1 1.7 1.7 Domestic chores 82.9 93.2 94.4 92.0 Others 3.9 1.7 2.2 2.4 Suffered from water-borne disease in past 15 days 14.2 14.5 13.3 13.8 n 8,066 11,949 24,978 44,993
General health awareness Several aspects of health and hygiene awareness of the study women are presented in Table 7.2. It was observed that neither personal hygiene (e.g., regular bathing, washing hands after defecation) nor sanitation (e.g, keeping latrine neat and clean) received any importance in their perception of health and hygiene. Children’s stool was considered to be less harmful than adult’s stool: around 40% of the respondents considered both as harmful without substantial difference by poverty status of the households. Proportionately, more women from non-poor households (71%) were aware about arsenic contamination than those from the poor and the hardcore poor households (66% and 57% respectively).

WASH baseline findings
89
Table 7.2. General health awareness of the study women (%)
Types of households Hardcore poor Poor Non-poor All
Perceived ways of maintaining good health Regular intake of nutritious food 69.8 73.9 76.2 74.5 Maintain neat and cleanliness 16.9 15.9 14.3 15.2 Regular bathing 6.1 5.3 4.9 5.2 Regular light exercise 0.1 0.1 0.1 0.1 Others 0.6 0.6 0.5 0.6 Do not know 6.6 4.2 3.9 4.5 Perceived norms of using safe latrine Use sandal while going to latrine 74.5 80.4 81.4 79.9 Holding pot with right hand 1.0 1.1 1.1% 1.1 Washing hands with ash/soap after defecation 11.6 9.8 8.9 9.6 Keeping latrine neat and clean always 3.8 3.1 3.6 3.5 Others 0.5 0.4 0.3 0.4 Don’t know 8.5 5.2 4.7 5.5 Perceived reasons for using sanitary napkin Prevention of infection 0.1 0.3 0.8 0.6 Comfortable for performing daily chores 0.2 0.2 0.5 0.4 Others 99.7 99.5 98.7 99.1 Perceived harmfulness of stool Children’s stool 23.0 24.7 23.0 23.5 Adult’s stool 34.8 33.9 31.0 32.5 Both children’s and adult’s stool 37.7 38.6 43.5 41.1 Don’t Know 4.5 2.7 2.5 2.9 Aware about arsenic contamination of water 56.6 65.6 70.8 66.9 n 8,066 11,949 24,978 44,993
Awareness about water-borne diseases Table 7.3 presents awareness of the study women about faecal-borne diseases. Women perceived contamination of water to be caused mostly by dirts/garbage (76%). Around 20% of the women did not know how to purify water. They could name diarrhoeal diseases to be spread by contaminated water, but not the other ones. Again, around 20% of the women could not state how water could be purified. Thus, a large knowledge gap on the role of contaminated water in spreading diarrhoeal diseases and how to make water safe for drinking exist in this population.

Hygiene awareness and practices
90
Table 7.3. Awareness of study women on water-borne diseases (%) Types of households Hardcore poor Poor Non-poor All How water gets contaminated Contact with dirty hand 8.1 8.4 9.5 8.9 When garbage gets in 73.2 76.7 76.5 76.0 When the container is uncovered 10.5 9.2 9.0 9.3 Others 0.6 0.5 0.6 0.6 Don’t know 7.6 5.1 4.5 5.2 Diseases spread by contaminated water Diarrhea 89.7 91.0 92.2 91.4 Dysentery 0.3 0.4 0.6 0.5 Typhoid 0.1 0.1 0.2 0.2 Cholera 0.5 0.4 0.4 0.4 Jaundice 0.2 0.1 0.1 0.1 Worm infestation 0.2 0.1 0.1 0.1 Indigestion 1.3 0.8 0.8 0.9 Arsenicosis 0.3 0.4 0.3 0.3 Others 1.2 1.4 1.1 1.2 Don’t know 6.3 5.3 4.2 4.9 How water-borne diseases can be prevented By drinking pure water 36.6 42.1 46.3 43.5 By drinking tube-well water 37.5 36.7 35.7 36.3 Others 1.2 1.4 1.3 1.3 Don’t know 24.7 19.9 16.6 18.9 How water can be purified By boiling 59.3 66.0 69.8 66.9 By treatment with medicine 3.4 3.6 3.9 3.8 By filtering 1.0 1.0 1.1 1.0 Others 8.1 8.6 7.8 8.1 Don’t know 28.3 20.8 17.4 20.2 n 8,066 1,949 24,978 4,993
Hygienic collection and storage of water The practice of maintaining hygiene (such as covering the container) while transporting or storing water appeared to be poor (Table 7.4). Around 1/5th of the containers of drinking water were reported to have been covered during transport from source while around 40% of the containers kept covered during storage. However, the scenario of water used for washing utensils or cooking was worse. Not much difference was observed among the groups of households with the exception of covering container during transport of drinking water where the non-poor households did better. These warrant behavioural intervention because preventing contamination of water during transport or storage has been found to be more effective in reducing diarrhoeal morbidity than previously thought (Fewtrell et al. 2005). Also, the most common pot used for storage of water was reported to be the earthen pitcher. Studies have shown that use of containers with narrow openings and appropriate dispensing devices such as taps or spigots

WASH baseline findings
91
protect the collected water from microbial contamination during storage and household use (Thompson et al. 2003). This point-of-use safety measure should be incorporated in designing behavioural intervention to keep storage water free from contamination. Table 7.4. Collection and storage of water for drinking, washing utensils,
and cooking purposes Types of households Hardcore poor Poor Non-poor All Drinking Pots used to collect water from source Earthen pitcher Jug Bucket Others
43.3 40.3 14.7 1.6
42.6 38.4 18.2 0.7
41.5 41.9 15.9 0.7
42.1 40.7 16.3 0.9
Covered during transport 15.4 26.2 58.4 21.1 Storage pot for water Earthen pitcher Jug Bucket Others Do Not Store
36.5 13.0 4.0 1.7
44.8
34.5 12.1 3.8 1.0 48.6
32.0 12.8 3.0 1.6 50.6
33.5 12.7 3.4 1.4 49.0
Storage pot has a cover 40.7 39.4 38.9 39.4 Frequency of washing storage pot in a week (mean±sd)
6.1 (+ 1.8) 6.1 (+ 1.9) 6.1 (+ 1.9) 6.1 (+ 1.9)
Washing utensils Pots used to collect water from source Earthen pitcher Jug Bucket Others Do Not Collect
6.8 0.3 6.2 0.9
85.7
4.1 0.1 4.5 0.4 90.9
2.7 0.1 3.6 0.3 93.4
3.8 0.2 4.3 0.4 91.3
Covered during transport 1.3 0.6 0.5 0.7 Storage pot Earthen pitcher Jug Bucket Others Do not Store
3.9 0.1 1.4 0.6
94.0
2.1 0.0 1.0 0.3 96.7
1.4 0.0 0.7 0.3 97.6
2.0 0.0 0.9 0.3 96.7
Storage pot has a cover 2.6 1.3 1.0 1.4 Frequency of washing storage pot in a week (mean±sd)
5.6+2.1 5.6+2.1 56+2.2 5.6+2.2
(Continued...)

Hygiene awareness and practices
92
Table 7.4 (.... Continued) Cooking Pots used to collect water from source Earthen pitcher Jug Bucket Others Do not Collect
49.4 11.7 25.3 12.7 0.8
51.3 9.4 29.2 9.1 0.9
51.9 8.9 29.4 8.6 1.1
51.3 9.6 28.6 9.5 1.0
Covered during transport 14.2 17.2 15.7 15.8 Storage pot for water Earthen pitcher Jug Bucket Others Do not Store
33.3 0.5 2.5 1.5
62.2
34.7 0.2 2.1 1.2 61.8
32.8 0.2 2.0 1.2 63.8
33.4 0.3 2.1 1.3 63.0
Storage pot has a cover 29.7 31.8 30.9 30.9 Frequency of washing storage pot in a week (mean±sd)
5.6+2.1 5..7+2.1 5.7+2.1 5.7+2.1
n 8,066 11,949 24,978 44,993 Knowledge on critical times for handwashing Handwashing (with soap) is now considered to be the most effective low-cost intervention to prevent diarrhoea and has been calculated to save a million lives (Curtis 2003). According to Curtis, ‘handwashing may be at least as effective as some vaccines (“do-it-yourself vaccine”) currently under development’. The knowledge of our study participants on handwashing at critical times is presented in Table 7.5. While about 91% of the respondents knew that handwashing was necessary after coming from toilet, only 11% were knowledgeable about its necessity after cleaning children’s bottom following defecation. Similarly, the proportion who knew about the necessity of handwashing before taking food was much higher (92%) compared to serving food (17%) or cooking (31%). No substantial variation was seen among the households according to poverty status for this critical preventive measure. This draws our attention to the need of community–wise promotion of informed handwashing (with soap) intervention. Table 7.5. Knowledge of the study women regarding appropriate time of
handwashing
Types of households Hardcore poor Poor Non-poor All After coming from toilet 89.0 90.3 91.5 90.7 After cleaning children’s stool 10.8 11.7 10.7 11.0 After cleaning domestic wastes 47.0 51.9 51.5 50.8 Before taking food 91.0 91.8 92.4 92.0 Before serving food 14.3 15.7 18.6 17.1 After taking food 65.0 66.8 68.9 67.6 n 8,066 11,949 24,978 44,993
WASH baseline findings
93
Domestic waste disposal It is interesting to note that while household wastes from kitchen, poultry and livestock, and other domestic wastes were mostly reported to be disposed in a fixed place, this was practiced by only 14% of the respondents while disposing children’s stool (Table 7.6). Table 7.6. Fixed place of disposal of daily household wastes as reported by
the study women (%)
Types of households Hardcore poor Poor Non-poor All Kitchen waste 93.0 95.5 96.0 95.3 Domestic waste 93.9 96.4 96.6 96.0 Stool of children 14.2 15.1 14.0 14.4 Poultry waste 69.0 81.5 82.8 80.0 Livestock waste 49.7 62.9 66.9 62.8 n 8,066 11,949 24,978 44,993
Field observations of actual practices Table 7.7 presents personal and domestic hygiene practices of the respondents as revealed through field observation. Only in around 1/3rd of instances the latrine was found to be neat and clean, the proportion being a little greater in case of the non-poor households compared to the poor households. Water was available nearby only in 1/3rd of the latrines, but soap or ash was available nearby only in 13% of the latrines. It has been found that handwashing is more frequent if handwashing facilities such as soap and water are easily available near the latrines (Curtis 2003). Distance of ten yards between the latrine and the tubewell was maintained most frequently in case of hardcore poor households (61%) but least frequently in case of non-poor households (38%) (Table 7.7). However, on average, only 45% of the households were found to maintain this distance. In only around 12% of the households, the tube-well was found to be situated at a higher level than the latrine, irrespective of the poverty status of the households.

Hygiene awareness and practices
94
Table 7.7. Personal and domestic hygiene practices of the study women as revealed through field observation (%)
Types of households
Hardcore poor Poor Non-poor All Toilet is neat and clean 28.1 28.8 37.2 34.0 Sufficient water available nearby 28.8 30.4 37.1 34.4 Soap/ash available for hand washing nearby 7.3 9.0 15.7 13.0 Sandal available near latrine 2.3 2.2 5.7 4.4 Distance between latrine and tubewell is more than 10 yards
61.4 48.2 37.9 44.9
Tubewell is situated at a higher level than the latrine
11.9 12.9 12.4 12.4
Courtyard is neat and clean 45.0 45.3 48.2 46.8 n 8,066 1,949 24,978 44,993
CONCLUSION
This survey presented interesting insights into the hygiene awareness and practice of the study women. Level of hygiene awareness as well as personal hygiene and sanitation practices was found to be poor. Awareness about the cycle of disease transmission was fragmentary as revealed by giving less importance to the contamination potential of children’s stool or washing hands at critical times. Apparently, germ theory of disease has little relevance in this population and most of the women thought that water is contaminated by dirt, etc. only, and no mention was made of microbes. The programme need to focus on these aspects and build up community knowledge and awareness about the cycle of disease transmission and how to break that cycle, including the importance of washing hands with soap or some other disinfectants in breaking this cycle. Recognizing and acknowledging that a particular behaviour is harmful is the first step in any sustained change in hygiene behaviour (Wijk and Murre 1995). Recent research has given importance to keep water free from contamination at point of use, besides safe source of water (Thompson et al. 2003). The study women in this survey displayed low level of awareness and practice in keeping drinking and cooking water safe before use. A large proportion of them (20%) are even unaware about how to purify water. Similar situation prevailed in case of sanitation as well. Almost similar state of awareness and practices were observed across the households, irrespective of their poverty status. This directs us to the importance of cultural and other social factors beyond poverty in shaping hygiene behaviour (Caprara 1998, Curtis 2008). Similar observation of little influence of socio economic status (SES) on morbidity prevalence in rural Bangladesh was noted in an earlier study from Bangladesh (Ahmed et al. 2003).

WASH baseline findings
95
Thus, any knowledge and awareness building interventions on water, sanitation and hygiene must adopt a community approach, and not rely on the common assumption that higher SES is associated with better knowledge, etc. To achieve this, in-depth qualitative studies are needed for contextualization of their current behaviour. Informed by these formative studies, a culture and context sensitive hygiene intervention may be developed which will fit into the overall framework of thinking of the respondents and will be more acceptable and effective.

WASH baseline findings
97
Status of Water Sanitation and Hygiene in Educational institutes Nasima Akter, Kazi Faisal Bin Seraj, Ananta Z. Neelim and Tanveer M Kamal
INTRODUCTION Bangladesh houses 78,000 primary schools that enroll 20 million students (Nahar and Ahmed 2006), with a net enrolment rate of 79.4% (WHO 2006). There is a school in almost every village of Bangladesh. Studies have found schools to have a significant impact on the knowledge, attitudes, and practice of the communities to which the school is central (IRC 2004). Moreover, the socio-cultural environment of Bangladesh is characterized by the existence and operation of different kinds of schools: government, non-government as well as religious (Madrasa), at primary, secondary and higher levels. The existing water, sanitation and hygiene situation in these institutes may well provide a reflection of the corresponding situation of communities, especially with respect to the basic rights and health of children. The objective of this chapter is to provide a description of the existing situation of water, sanitation and hygiene in the educational institutes of rural Bangladesh, wherein, the chapter aims to highlight the key challenges and constraints that may be addressed through the BRAC Water Sanitation and Hygiene programme.
8

Status of water sanitation and hygiene in educational institutes
98
METHODS A total of 3,065 institutes were captured in this baseline survey in 75 upazilas. Twenty-three types (Appendix 7) of institutes were surveyed, including primary, under secondary (junior high), secondary schools, BRAC pre-primary and primary schools, all types and levels of Madrasas, colleges and universities, technical, agricultural and missionary institutes, as well as orphanages. These institutes were divided into the following categories (Table 8.1). Table 8.1. Categories of educational institutes considered
Category Composition Primary Primary Secondary Under secondary + Secondary College College Madrasas Dhakhil, Sr., Quraania, Hafizia, Kawmi, Maktab and Ebtedayi BRAC schools BRAC pre-primary + BRAC non-formal primary Others All else
The majority of the respondents were headmasters (32%) and assistant teachers (31.6%), followed by teachers (20.4%). The rest 16.8% were assistant headmasters and madrasa- superintendents.
RESULTS AND DISCUSSION The sample size was 3,065 institutes where the majority (41.9%) of the institutes was primary schools, followed by BRAC schools and madrasas each totaling a fifth of all schools (19.5% and 19.2%, respectively). Secondary schools represent 13.8 % of the sample, while the rest of the institutes represent only 5.6 % of the total (Table 8.2). Table 8.2. Percentage wise breakdown of surveyed institutes
Type of institute % of total (N = 3,065) Primary 41.9 Secondary 13.8 College 1.3 BRAC schools 19.5 Madrasas 19.2 Others 4.3
Summary profile of educational institutes The total sample comprises of 540,146 students and 19,487 teachers. Figure 8.1 shows that primary schools (49% boys, 51% girls), secondary schools (46% boys and 54% girls), and BRAC schools (40% boys and 60% girls) show more girls

WASH baseline findings
99
enrollment than madrasas (60% boys and 40% girls), colleges (80% boys and 20% girls), and other institutes (56% boys and 44% girls). This corroborates the findings on educational status in the chapter on socio-demographic profile of the WASH surveyed areas. Figure 8.1. Student profile by institute
N = 540146 It can be observed that in all the types of educational institutes, there exists a gender disparity in numbers of teachers (Figure 8.2). In every institute there is male dominance with the exception of BRAC schools, where the opposite situation exists. Figure 8.2. Teacher profile by institute
From figure 8.3 it can be observed that the largest pupil-teacher ratio i.e., number of students per teacher was found in primary schools (44.6) and the lowest was observed in colleges (7.5).
50.7% 53.8%
20.3%
40.0%
60.0%
44.4% 49.3%
46.2%
79.7%
60.0%
40.0%
55.6%
0.0%
10.0%
20.0%
30.0%
40.0%
50.0%
60.0%
70.0%
80.0%
90.0%
Primary Secondary College Madrasa BRAC School Other School
Girls Boys
44.0%
21.9% 18.4%
11.0%
87.8%
46.1%
56.0%
78.1% 81.6%
89.0%
12.2%
53.9%
0.0%
10.0%
20.0%
30.0%
40.0%
50.0%
60.0%
70.0%
80.0%
90.0%
100.0%
Primary Secondary College Madrasa BRAC School Other School
Female Male

Status of water sanitation and hygiene in educational institutes
100
Figure 8.3. Number of students per teacher (pupil teacher ratio)
Safe water source and use The institutes exhibited an almost complete dependence on tubewells as the source of their safe water supply – a dependence that remained virtually unvaried through seasonal variations in water availability (Table 8.3). Secondary schools and colleges reported highest levels of ownership of tubewells (79.6% and 80.5% respectively) followed by primary schools and madrasas (61.3% each). BRAC schools, due to the sheer infrastructure and modalities of operation, reported a low ownership of 7.2%, implying a high dependency on accessing safe water from shared tubewells. Table 8.3. Water sources for educational institute for monsoon and dry
season
Monsoon (%) Dry season (%) Type of institute Own
tubewells Shared/Pubic
tubewell Supply Other Own tubewells
Shared/Pubic tubewell Supply Others
Primary 61.3 37.7 0.5 0.6 59.6 39.4 0.5 0.6 Secondary 79.6 17.8 2.4 0.2 77.9 19.5 2.4 0.2 College 80.5 12.2 7.3 0 80.5 12.2 7.3 0 Madrasa 61.3 35.7 2.2 0.9 60.1 37.2 2 0.7 BRAC 7.2 91.3 0.2 1.3 7.4 91.3 0.2 1.2 Others 46.2 50 2.3 1.5 46.2 50 2.3 1.5
44.6
26.4
7.5
19.8
14.1
18.0
27.7
0.0 5.0
10.0 15.0 20.0 25.0 30.0 35.0 40.0 45.0 50.0
Primary Secondary College Madrasa BRAC School Other school Average

WASH baseline findings
101
There are no major variations in statistics between monsoons and dry seasons. For instance, the drop in accessing safe water from own tubewells by secondary schools in dry season (79.6% to 77.9%) may be due to drying up of groundwater aquifers, while similarly the drop in piped water supply in madrasas (2.2% to 2.0%) in dry seasons may be due to the sheer lack of tap water supply from source. Despite this large dependency on tubewells for safe water, the reported adequacy of this supply was not correspondingly high (Table 8.4). While 79.8% secondary schools reported sufficient water supply in the dry season, primary schools reported a slightly lower 71.9%. Considering the larger student enrolment in primary schools than secondary schools, this may just be an outcome of overcrowding in schools. However, with regard to arsenic, much was left to be desired. Less than half of all tube wells at these institutes were tested for arsenic contamination, and most of them were found to be contaminated. Table 8.4. Reported sufficiency and quality of safe water supply
Type of institutes Sufficient supply in dry season (%) Tested arsenic free (%) Primary 71.9 11.9 Secondary 79.8 10.0 College 92.7 N/A Madrasas 76.9 15.3 BRAC schools 73.0 8.3 Others 71.2 10.6
In the area of water usage, almost all institutes did collect their drinking water, while a much greater proportion did not store (Table 8.5). All secondary schools and colleges collected their water, of which 63.4% and 65.8% did not store. The greatest lack of practice of adequate collection and storage of water was reported by BRAC schools, of whom 7.2% did not collect water and 76.8% did not store. Table 8.5. Collection and storage of safe drinking water in educational
institutes Type of institutes
Water collection
(%)
No hand contact (%)
Usage of covers during
collection (%)
Do not store (%)
Usage of covers while storing (%)
Cleaning of the storage pot (at least once a day)
Primary 99.2 96.5 65.3 65.4 88.5 60.8 Secondary 100.0 97.1 65.1 63.4 91.5 63.6 College 100.0 97.6 70.7 65.8 100.0 71.4 Madrasas 98.3 97.9 59.9 71.8 93.4 75.9 BRAC schools 92.8 96.7 63.7 76.8 89.9 77.0 Others 97.0 96.9 68.0 66.7 93.2 70.4

Status of water sanitation and hygiene in educational institutes
102
In the collection of water, around 97% respondents reported that they did not make any hand contact while carrying water from the sources. However, the usage of cover while carrying water was lower, ranging from 59.9% to 70.7%. For storage of water, at least 88.5% of the respondents claimed that they used covers on the storage vessels, which were reported to be cleaned at least once a day in more than 60% of the institutes. Although these figures show promising trends in terms of water-related hygiene, but no firm conclusions can be made since this study did not conduct any spot observations to cross check these attributes. Sanitation The most common sanitation provisions or practices in the educational institutions were found, existing in the descending order of sanitary latrines, ring-and-slab latrines without water seal, open defecation, and pit latrines (Table 8.6). With the exception of BRAC schools, most institutes reported that their students used sanitary latrines. Sanitation coverage was 89% in primary schools, 84% for secondary schools, 92% for colleges, 68% in madrasas, 78% for all other types of schools, and only 38% for BRAC schools. In contrast, BRAC schools reported the highest prevalence of defecation in no fixed place1 (20.5%), while primary school and colleges reported the lowest prevalence (6.1%). Table 8.6. Reported sanitation practice (rainy season)
Sanitary (%) Ring slab without water seal (%) Pit (%) No fixed place (%) Type of
institute Boy Girl Boy Girl Boy Girl Boy Girl
Primary 88.8 89.1 4.4 4.4 0.6 0.5 6.2 6.0 Secondary 76.7 93.1 3.6 4.8 0.2 0.2 19.5 1.9 College 85.4 100.0 0.0 0.0 2.4 0.0 12.2 0.0 Madrasas 74.4 61.6 14.4 11.2 3.1 2.4 8.1 24.8 BRAC schools
37.6 37.6 36.2 36.2 5.7 5.7 20.5 20.5
Others 78.8 77.3 12.9 12.1 0.8 0.8 7.6 9.8
1 No fixed place does not necessarily mean open defecation and may include ‘do not use latrines in the
premises’.

WASH baseline findings
103
Table 8.7. Sanitation provisions-gender and hygiene
Type of institute Own latrine (%)
Separate latrine for boys and girls (%)
Observed to be clean (%)
Primary 93.4 41.0 29.5 Secondary 95.2 62.7 29.6 College 97.5 80.5 50.0 Madrasas 76.7 35.6 29.3 BRAC schools 25.5 1.8 28.9 Others 75.8 21.9 43.3
Secondary schools and colleges reported a high availability of separate latrines for girls (62.7% and 80.5% respectively) (Table 8.7). Less than half (41%) of primary schools reported to have separate latrines for girls. BRAC schools reported the lowest provision of separate sanitation facility for girls (1.8%), although BRAC schools do not operate beyond primary level. Further observations revealed that most primary (93.4%), secondary schools (95.2%) and colleges (97.5%) have their own latrines. About 76.7% of madrasas and 75.8% of other institutions have their own provisions, and only a quarter (25.5%) of BRAC schools could claim the same. As an indicator reflecting the average hygiene and maintenance of latrines, less than 30% of all latrines were observed to be “clean”, in all institutions. Colleges and “other institute” types were slightly cleaner, at 50% and 43.3% respectively. Student to latrine ratio Out of the 3,065 schools, only 2,344 institutes reported to have their own latrines. However, data on the total number of latrines in each institute were not available. Thus, of the institutes who did have latrines, the equivalent student to latrine ratio (assuming an average of 1 to 6 latrines per facility, based on field observations) was found to be in the range of 35.5 to 213.1 students per latrine in primary level, 57.9 to 347.1 student per latrine in secondary level, 33.8 to 202.8 student per latrine in college level, 37.6 to 225.3 students per latrine in BRAC schools, and 28.2 to 169.0 student per latrine in other institutes (Table 8.8).
Status of water sanitation and hygiene in educational institutes
104
Table 8.8. Student to latrine ration
Student latrine ratio Type of institutes
Own latrine
No. of students 1 Lat./
Sch. 2 Lat./ Sch.
3 Lat./ Sch.
4 Lat./ Sch.
5 Lat./ Sch.
6 Lat./ Sch.
Primary 1198 255353 213.1 106.6 71.0 53.3 42.6 35.5 Secondary 401 139200 347.1 173.6 115.7 86.8 69.4 57.9 College 40 8110 202.8 101.4 67.6 50.7 40.6 33.8 Madrasas 452 101841 225.3 112.7 75.1 56.3 45.1 37.6 BRAC schools 153 18747 122.5 61.3 40.8 30.6 24.5 20.4
Others 100 16895 169.0 84.5 56.3 42.2 33.8 28.2 When compared the high reported use of sanitary latrines, the student to latrine ratio actually reveals a shortage of actual numbers of sanitation provisions at these institutes, especially in secondary institutions. This may, in turn, imply that while there is a high awareness regarding the use of sanitary latrines, the actual availability of sanitation provisions are still lacking. Therefore, much hardware intervention/coverage is needed before the prescribed/optimal ratio of no more than 40 students per latrine (Nahar and Ahmed 2006) can be met in Bangladesh at large. Hygiene With regard to hygiene training, primary and secondary schools reported that 26.1% and 24.9% of their teachers respectively received hygiene training, and 53% and 50% of their students respectively received hygiene education or training. Madrasas and other institutions reported similar figures. However, BRAC schools reported a greater percentage of teachers (36.4%) and students (62.4%) to have received any hygiene education training. Table 8.9. Hygiene training and practice in educational institutes
Educational institutes
Teachers received hygiene training
(%)
Students received hygiene
training (%)
Adequate hand-washing
provisions available (%)
Soap available near or inside
latrine (%)
Enough water near latrine (%)
Primary 26.1 52.9 84.3 13.7 46.7 Secondary 24.9 50.1 95.2 10.6 63.3 College 22 46.3 97.6 17.5 80 BRAC schools 36.4 62.4 77.3 9.2 24.1
Madrasas 23.1 51.4 91.7 6.8 45.1 Others 25.8 61.4 81.8 13.5 60.6
In case of provision for handwashing (Table 8.9), colleges reported the highest available handwashing provisions (97.6%), followed by secondary (95.2%) and

WASH baseline findings
105
primary schools (84.3%). BRAC schools lagged behind at 77.3% being equipped with available handwashing facilities. The difference in the high reported hygiene practices (handwashing) and the low hygiene training received by teachers and students may be, in part, due to the over-reporting that is common in behavioral observations. Alternately, it may be enquired upon whether formal hygiene training is really effective, considering that the high hygiene practice in madrasas derives partly from the culture of madrasas as well. Spot observation on availability of soap and water near latrine supports such finding (Table 8.9). Disease profile Another cross-comparison for the effect or even actual prevalence of hygiene practices may be the disease occurrence profile of the institutes (Table 8.10). The following data show diarrhoea as the most common ailment among students, across all types of institutes (23.1% to 38.7% of all episodes among students). Dysentery, fever, worms and typhoid ranked next, which indicates four out of five most common ailments found among students are water-borne. Table 8.10. Disease profile by institutes
Diarrhoea
(%) Dysentery
(%) Typhoid
(%) Cholera
(%) Worms
(%) Measles
(%) Fever (%)
Jaundice (%)
Primary 36.3 16.4 2.6 0.8 5.1 0.9 16.3 1.4 Secondary 33.8 15.4 1.9 0.4 4.7 0.0 18.0 1.0 College 23.1 10.8 6.2 1.5 0.0 0.0 18.5 1.5 Madrasa 36.3 15.6 1.9 0.3 2.5 0.1 16.8 0.9 BRAC school 36.9 11.7 1.4 0.5 3.4 0.7 22.2 0.7 Other 38.7 12.2 2.8 0.6 3.3 0.6 20.4 0.0 Total 36.0 15.0 2.2 0.6 4.1 0.6 18.0 1.0 n 1696 707 102 28 192 26 846 49 In overview, the relatively high proportion of water-borne or diarrhoeal diseases actually questions the reliability of reported prevalence of handwashing, water hygiene and sanitation hygiene of these institutions. Different observational methods would, thus, be needed to accurately obtain the status of various hygienic activities at educational institutes.
CONCLUSION Nearly half of the study sample comprised of primary schools, which also have a high pupil-teacher ratio (44.6). Almost all institutes reported a virtually complete reliance on tubewells for safe water supply, though less than three-fourth claimed their own tubewells, which implies accessing shared wells in the vicinity. However, less than 16% of the tubewells that were tested found to be arsenic-

Status of water sanitation and hygiene in educational institutes
106
free, implying a high risk of arsenicosis in these schools. The provision of safe drinking water is thus a great standing need at these educational institutes. A greater proportion of secondary school enrolment was higher for girls. However, more than a third of those institutes do not have separate sanitation facilities (and dirty, where found) for girls. Further, the student-latrine ratio was the highest at secondary level. All of these beckons that adequate sanitation and hygiene facilities for adolescent girls’ may be in the greatest need of addressing, especially due to anecdotal evidence that school attendance of adolescent girls increases with adequacy of water, sanitation and hygiene facilities at schools (Nahar and Ahmed 2006). While nearly half of all students and about a quarter of all teachers, at most institutes reported to having received hygiene education, this particular statistics raises the question as to how under-trained teachers could provide the necessary hygiene education to these students. Except madrasas, which reported less than half of their students using soap after defecation, more than three-quarter of almost all institutions reported to have adequate handwashing facilities. About three-quarters of the students from these institutes reported to wash their hands with soap after defecation. In contrast to these high hygiene practice prevalence, the greater proportion of reported illnesses remain in the realm of water-borne diseases, with diarrhoea constituting more than half of all episodes among students. Coupled with the national statistics on diarrhoea prevalence of 25 cases in the last 15 days (UNICEF 2006), this is an alarming disease burden on educational institutes. All these indicate a need for more effective, formal hygiene education/promotion at these institutes, especially, and for instance, increasing the use of soap in madrasas. Further, alternative or observational methods may be incorporated to more accurately monitor the prevalence of hygiene practices in these educational institutes.
WASH baseline findings
107
Status of Water, Sanitation and Hygiene in Social and Religious Institutes Nasima Akter, Kazi Faisal Bin Seraj, Ananta Z. Neelim and Tanveer M Kamal
INTRODUCTION This section assesses the state of water, sanitation and hygiene in various social and religious institutes of Bangladesh that play a significant role in maintaining social stability at community level. A large number of community members both young and adult come to these social and religious institutes for praying, religious studies and training, and recreational gathering. Therefore, it is important to evaluate the condition of water supply systems and sanitation facilities in these institutes to identify the areas of concern so that actions for the improvement could be taken. This will make sure that the users of these institutes have access to these facilities while they are in these premises. It is also important for maintaining proper health and living conditions of the people who work and reside in these institutes. The religious institutes were taken from four main religions practiced in the country, i.e. mosques, temples, churches and pagodas. In addition, social clubs, bazaars and cooperatives at community level were also covered in this assessment. But the emphasis is given mainly on religious institutions to examine the situation. However, the results of this section may help identify the key challenges and constraints that may be addressed through the BRAC WASH programme since the programme conceives that improving WASH services at social institutions may positively contribute in improving the overall health conditions of community members.
9

Status of water sanitation and hygiene in social and religious institutes
108
METHODS A total of 2,267 institutes were captured in this baseline survey in 75 upazilas. Nine types of institutions were surveyed, including mosques, temples, churches, pagodas, bazaar and cooperatives, social clubs, and non-formal madrasas which were not captured under educational institutes. In the interest of this baseline report, these institutes were divided into the categories of mosques, temples, churches, pagodas, and others. Table 9.1 shows that the surveyed institutes were mainly dominated by mosques followed by temples. Table 9.1. Breakdown of institutes
Institutes Percentage of total Mosque 83% Temple 11.8% Church 1.6% Pagoda 0.3% Others 3.4% n 2267
Figure 9.1. Profile of the respondents The survey findings show that the majority of the respondents were the committee members of the institutes, followed by muazzins, imams (religious leaders from Islamic institutions) and chairpersons (Figure 9.1). It is imperative to mention that the number of mosques covered in the baseline survey is significantly higher than temples and pagodas as shown in Table 9.1. Because of
Respondent Profile
Muazzin, 12.8%
Imam, 16.5%
Chairperson, 14.6%Cashier, 3.7%
Member, 36.9%
Others, 15.4%
N = 2,267

WASH baseline findings
109
this huge variation in the representation, drawing firm conclusions regarding WASH status across the different types of institutes may be problematic. However, the results still provide us with general insights about the WASH status in some of these types of institutes (i.e. mosques and churches).
RESULTS AND DISCUSSION Safe water source – sufficiency and quality The institutes showed an almost complete dependence on tubewells as the source of safe water supply. About 70.8% mosques, 83.3% pagodas and nearly half (46%) of all churches reported that they have their own tubewells, over three-fourth (77.2 percent) of all temples did not have their own tubewells, implying sharing of nearby and community tubewells. But it is evident in the baseline survey that the percentage of using tubewells was higher in the wet season than the normal (usually dry season) time (Table 9.2). Table 9.2. Drinking water source breakdown (rainy season)
Monsoon season water collection sources (percentage) Institutes Tubewells Piped supply Others
Mosque 86.7 5.0 8.3 Temple 97.0 0.7 2.2 Church 97.3 0.0 2.7 Pagoda 100 0.0 0.0 Others 70 1.3 6.6
Most of the institutes reported sufficient supply of water in dry season (Table 9.3), with pagodas reporting the lowest at 83.3%. Table 9.3. Reported sufficiency of safe water supply and quality
Institutions Sufficient supply in dry season (as reported) Mosque 98.5% Temple 96.6% Church 94.6% Pagoda 83.3% Others 92.1%
State of sanitation facilities Over half of the community members who come to these institutes reported that they use sanitary latrines while they visit these institutes. A quarter of all the boys and one third of all the girls who visit to the temples for religious studies and training acknowledged open defecation, while half of all the boys and girls at

Status of water sanitation and hygiene in social and religious institutes
110
pagodas reported ring-and-slab-latrines with no water-seal as their most availed sanitation option (Table 9.4). Table 9.4. Sanitation practice in wet season
Open defecation Pit Ring slab
no w-seal Ring slab
w-seal Sanitary Go home to defecate No latrine
Boy Girl Boy Girl Boy Girl Boy Girl Boy Girl Boy Girl Boy Girl Mosque 11.0 10.7 1.1 1.3 17.8 17.4 7.8 8.0 54.0 53.9 8.2 8.3 0.2 0.1 Temple 25.0 33.3 0.0 0.0 12.5 11.1 0.0 0.0 50.0 44.4 12.5 11.1 0.0 0.0 Church 20.0 20.0 0.0 0.0 10.0 10.0 0.0 0.0 60.0 60.0 10.0 10.0 0.0 0.0 Pagoda 0.0 0.0 0.0 0.0 50.0 50.0 0.0 0.0 50.0 50.0 0.0 0.0 0.0 0.0 Other 50.0 50.0 0.0 0.0 0.0 0.0 0.0 0.0 50.0 50.0 0.0 0.0 0.0 0.0
Ownership of sanitary latrine All the pagodas and over half of the mosques and churches had their own latrines, temples were in dire need of sanitation provisions, with only 9% of them having their own latrines (Table 9.5). In the instances where latrines were found, churches maintained them the cleanest (71.4%) upon inspection, while mosques had the dirtiest latrines with only 35% of them observed to maintain clean latrines. Table 9.5. Ownership of sanitary latrines
Institutions Own latrine (percent) Mosque 65.9% Temple 9.0% Church 51.4% Pagoda 100.0% Others 10.5%
State of hygiene practice Only church and pagoda members claimed to receive hygiene training in substantive numbers (43.2% and 50% of members, respectively). Paradoxically, mosques had the high prevalence of sufficient and available handwashing provisions (93.7%) while about half of all churches reported similar provisions. Regarding reported hygiene practice, all pagodas reported that their members using soap after defecation, while far less members of churches, temples and mosques (40.5, 29.2 and 23.2 respectively) reported to such handwashing practice.

WASH baseline findings
111
CONCLUSION This chapter focused on the water access, sanitation status, and hygiene practice of the social and religious institutions of the society. Community members of different ages and religion frequently visit these institutes for prayer, religious training and sometimes recreational gathering. Therefore it is utmost important to ensure good water and sanitation services at these institutes along with household level services so that BRAC WASH programme can make a long lasting impact on health condition of the community members. The baseline survey showed that in sanitation sector about half of all the institutes reported to use sanitary latrines. All institutions except pagodas need much hardware support towards adequate latrine coverage. Further, unreliable reports of practices such as going home to defecate pose uncertainties in sanitation coverage and practice estimates. Most of all, the lack of gender parity or gender-friendliness in sanitation provisions at almost all institutions is alarming. Hygiene practice at most of the institutions came out with contrasting reports regarding availability of adequate handwashing facilities on-board. Moderate to few number of cases reported of hand washing practices using soap after defecation. Few members from these institutes reported that they received hygiene trainings. As an endnote, it may be stressed that social and religious institutions may have the strongest influence on many communities of rural Bangladesh. Therefore, targeted interventions to address the key needs may have an impact on improving the water, sanitation and hygiene conditions and practices of communities.

WASH baseline findings
113
References
Ahmed A and Siddiqi AYBI (2004). National baseline survey on sanitation in Bangladesh: an exemplary event of collaborative partnership. Proceedings of the 30th WEDC Conference Vientiane, Lao PDR, 2004. Water, Engineering and Development Centre (WEDC). Loughborough University. Leicestershire LE11 3TU UK. ISBN 1 84380 078 0. PP 657.
http://wedc.lboro.ac.uk/publications/pdfs/30/Prelims%20-%2030th.pdf. (accessed 31st May 2007)
Ahmed M, Nath SR, Ahmed KS (2003). Literacy in Bangladesh: need for a new vision. Dhaka: Campaign for Popular Education 142p.
Ahmed SM (2001). Differing health and health-seeking behaviour: ethnic minorities of the Chittagong Hill Tract, Bangladesh. Asia-Pacific J Public Health 13(2):100-8.
Ahmed SM, Adams AM, Chowdhury M, Bhuiya A (2000). Gender, socio-economic development and health-seeking behaviour in Bangladesh. Soc Sci Med 51:361-71.
Ahmed SM, Adams AM, Chowdhury M, Bhuiya A (2003). Changing health-seeking behaviour in Matlab, Bangladesh: do development interventions matter? Health Policy Plann 18(3):306-15.
Akter N and Jakariya M (2004). Water and sanitation status. In: Towards a profile of the ultra poor in Bangladesh: findings from CFPR/TUP baseline survey. Dhaka and Ottawa: BRAC and Aga Khan Foundation Canada: 39-44.
Bangladesh Bureau of Statistics (BBS) (2007). Report on the household income and expenditure survey 2005. Dhaka: Bangladesh Bureau of Statistics.

References
114
BBS-UNICEF (1997). Pragatir pathey. Dhaka:UNICEF.
BRAC (2005). Attaining the MDG targets on water and sanitation in Bangladesh: project proposal. (Unpublished)
BRAC Health Programme (BHP) (2007). Breaking new grounds in public health: annual report 2006. Dhaka: BRAC.
Cairncross S (1992). Sanitation and water supply: practical lessons from the decade. Washington, DC:UNDP-World Bank Water and Sanitation Program. (Water and sanitation discussion paper series, No. 9)
Caprara A (1998). Cultural interpretations of contagion. Trop Med Int Health 3(12):996-1001.
Choudhury N and Hossain MA (2006). Exploring the current status of sanitary latrine use in Shibpur upazila, Narsingdi district. Dhaka: BRAC. (Unpublished)
Cotton A, Franceys R, Pickford J, Saywell D (1995). On-plot sanitation in low-income urban communities: a review of literature, Leicestershire: Loughborough University of Technology.
Curtis V (2003). Talking dirty: how to save a million lives. Int J Env Health Res 13:S73- 9.
Curtis VA (2007). Dirt, disgust and disease: a natural history of hygiene. J Epidemiol Comm Health 61:660-4.
Earth Trends (2003). Country profiles: population, health, and human well-being Bangladesh. www: http://earthtrends.wri.org/pdf_library/country_profiles/ pop_cou_050.pdf (accessed 20 December 2007)
Ecofile (1996). A periodic environmental update. Volume 1(4) Dhaka: Shomunnaoy. Bangladesh.
Elmendorf M (1980). Seven case studies of rural and urban fringe areas in Latin America. Appropriate technology for water supply and sanitation; No. 8. Washington, DC: World Bank.
Esrey S, Potash J, Roberts L, Shiff C (1991). Effects of improved water supply and sanitation on ascariasis, diarrhea, dracunculiasis, hookworm infection, schistosomiasis, and trachoma. Bulletin WHO 69(5):609:21.
Esrey SA (1996). Water, waste and well-being: a multi-country study. Am J Epidemiol 143(6):608:23.
Fewtrell L, Kaufmann et al.(2005). Water, sanitation, and hygiene interventions to reduce diarrhoea in less developed countries: a systematic review and meta-analysis. Lancet Infect Dis 5:42-52.
GoB (2005). Millennium development goals: Bangladesh progress report. Dhaka: Government of Bangladesh (GoB) and UN Country Team in Bangladesh.
GoB (2005). National sanitation strategy. Dhaka: Government of Bangladesh (GoB).

WASH baseline findings
115
Goodhart L (1988). Lessons for social feasibility studies in rural sanitation in four Indian regions. Washington, DC:UNDP Project INT/ 83/003/PROWESS.
Hadi A (2004). Socio-demographic profile. In: Towards a profile of the ultra poor in Bangladesh: findings from CFPR/TUP baseline survey. Dhaka and Ottawa: BRAC and Aga Khan Foundation Canada.
Hadi A (2000). A participatory approach to sanitation: experience of Bangladeshi NGOs. Health Policy Plann 15(3):332-7.
Halder S (2000). Demographic and social characteristics of the ultra poor. BRAC research report. (unpublished)
Hill Z, Kirkwood B, Edmond K (2001). Family and community practices that promote child survival, growth, and development: a review of the evidence. London: London School of Hygiene.
Hoque BA (2003). Handwashing practices and challenges in Bangladesh. Int J Environ Health Res 13:S81-7.
Hossain MA, Ali A, Uddin N, Joarder AA, Ahmed F (2006). Rapid assessment survey of current sanitation, immunization, and contraception status in selected unions of Bangladesh. Dhaka: BRAC.
Hossain ZR and Hossain M (Editors) (1995). Rethinking rural poverty: Bangladesh as a case study. New Delhi: Sage Publications.
IFH (International Scientific Forum on Home Hygiene), 2003. http://ifhhomehygiene.org/ 2003/2downloadabledoc/IFH-Guidelines-complete.pdf retrieved on 14 November 2007).
IRC (International Water and Sanitation Centre) (2004). The Worth of School Sanitation and Hygiene (SSHE): case studies. Delft: Institute of Research Centre.
IRC (2004). School sanitation and hygiene education symposium: the way forward- construction is not enough.
Islam M (2007). Dimension of poverty and rural development in Bangladesh: the role of government. Kobe: Kobe Gakuin University.
Islam N, Angeles G, Mahbub A, Lance P, Nazem NI (2006). Slums of urban Bangladesh: mapping and census, Dhaka: Center for Urban Studies.
Jenkins MW and Curtis V (2005). Achieving the ‘good life’: why some people want latrines in rural Benin. Soc Sci Med 61:2446–59. http//:www.elsevier.com/locate/socscimed
Lafond AK (1995). A review of sanitation program evaluations in developing countries. Washington, DC: United States Agency for International Development, Environmental Health Project (EHP). (Activity report No. 5)
Larsen B (2003). Hygiene and health in developing countries: defining priorities through cost-benefit assessments. Int J Environ Health Res 13:S37-46.
Larsimont CH (1995). Water supply and sanitation in Bangladesh. June 1994-March 1995.

References
116
Metwally AM, Saad A, Ibrahim NA, Emam HM, El-etreby LA (2007). Monitoring progress of the role of integration of environmental health education with water and sanitation services in changing community behaviours. Int J Environ Health Res 17(1):61-74.
Murthy GVS, Goswami A, Narayanan S, Amar S (1990). Effects of educational intervention on defecation habits in an Indian urban slum. J Trop Med Hyg 93,189–93.
Nahar Q and Ahmed R (2006). Addressing special needs of girls: Challenges in Schools. Dhaka: Bangladesh, Water Aid Bangladesh.
NGO Forum (2006). Water and culture: where we are. Dhaka: NGO Forum p7-8, 11, 29.
NIPORT (2001). Bangladesh demographic and health survey 1999-2000. Dhaka and Calverton: National Institute of Population Research and Training (NIPORT), Dhaka Mitra Associates, and ORC Macro.
Perrett H (1983). Social feasibility analysis in low-cost sanitation projects. Washington DC: UNDP Interregional Project INT/81/047, the World Bank. (TAG technical note No. 5)
Rahman M and Kumar G (2006). Bangladesh government’s commitment to 100 percent sanitation by 2010: from myth to reality. presented at 32nd WEDC International Conference, Colombo.
Scott B, Curtis V, Rabie T, Garbrah-Aidoo (2007). Health in our hands, but not in our heads: understanding hygiene motivation in Ghana. Health Policy Plann 22:225-33.
Stanton BF, Clemens JD, Khair T, Khatun K, Jahan DA (1987). An educational intervention for altering water-sanitation behaviours to reduce childhood diarrhoea in urban Bangladesh: formulation, preparation and delivery of educational intervention. Soc Sci Med 24(3):275-83.
Stanwell-Smith R (2007). The infection potential in the home and the role of hygiene: historical and current perspectives. Int J Environ Health Res 13:S9-17.
Sulaiman M and Matin I (2006). Targeting effectiveness of CFPR/TUP in scale-up environment. Dhaka and Ottawa: BRAC and Aga Khan Foundation Canada. (CFPR working paper series no. 8)
Taha AZ, Sebai ZA, Shahidullah M, Hanif M, Ahmed HO (2000). Assessment of water use and sanitation behaviour of a rural area in Bangladesh. Arch Environ Health 55(1):51-7.
Talk International (2004). Dirty water and poor sanitation kills over 5000 children every day, World Water Day to Focus on Water and Diseases. http//:www.talkinternational.com
The Columbia electronic encyclopedia, Sixth Edition (2003). www.cc.columbia.edu/cu/cup/(accessed on 3 June 2007).
Thompson T, Sobsey M, Bartam J (2003). Providing clean water, keeping water clean: an integrated approach. Int J Environ Health Res 13:S89-94.

WASH baseline findings
117
Toron MA (1982). A longitudinal study of the impact of village health education on environmental sanitation. Int Quarterly Community Health Edu 2(4):311-27.
UN (2006). World population prospects: the 2006 revision. www.unescap.org/esid/psis/population/database/data_sheet/2007/DataSheet2007.pdf (accessed on 23 September 2007)
UN (2002). Report of the world summit for sustainable development. Johannesubrg 26 August to 4 September 2002, A/CONF.199/20, New York: United Nations.
UNDP (2005). Millennium project 2005. Health, dignity, and development: what will it take? Task Force on Water and Sanitation. New York: United Nations Development Programme.
UNDP (2006). Human development report 2006. Beyond scarcity: power, poverty and the global water crisis. New York: United Nations Development Programme (UNDP). p 422.
UNDP-WB (1994). Bangladesh situational analysis- water supply and sanitation sector. Dhaka: World Bank.
UNESCAP (2007). Population and development indicators for Asia and the Pacific. www.unescap.org/esid/psis/disability/index.asp (accessed on 15 August 2007)
UNICEF (2000). New approaches to promoting sanitation in rural Bangladesh. Dhaka: UNICEF.
UNICEF (2006). Environmental sanitation hygiene and water supply project in rural areas (ESHWRA). Dhaka: UNICEF.
UNICEF (2006). Water and culture: where we are. Dhaka: UNICEF.
UNICEF (2007). Rural water sanitation and hygeine. www.unicef.org/bangladesh/ RURAL_Water_Sanitation_and_Hygiene.pdf (accessed on 23rd July 2007)
Waterkeyn J, Cairncross S (2005). Creating demand for sanitation and hygiene through community health clubs: a cost-effective intervention in two districts in Zimbabwe. Soc Sci Med 61:1958-70.
WFP (2007). Socioeconomic profiles of the WFP operational areas and beneficiaries. World Food Programme, Bangladesh and TANGO International, USA.
WHO (2002). World health report: reducing risks, promoting health Life. Geneva: World Health Organization.
WHO (2004). Meeting the MDG drinking-water and sanitation target: a mid-term assessment of progress-World Health Organization and United Nations Children’s Fund. Geneva: World Health Organization.
WHO (2006). Schistosomiasis and soil transmitted helminthes country profile Bangladesh. World Health Organization.
WHO/UNICEF (2000). Water supply and sanitation global assessment 2000 report. Geneva: World Health Organization.

References
118
Wijk C van, Murre T (1992). Motivating better hygiene behaviour: Importance for public health. Mechanisms for change. New York: IRC/UNICEF.
World Bank (2002). Social indicators. www.worldbank.org/poverty/data/trends/water.htm. (accessed on 7 September 2007)
World Bank (2003). Water sanitation and hygiene. www.worldbank.org/hnp (accessed on 15 September 2007)
World Bank (2003). Willingness to pay for arsenic-free, safe drinking water in Bangladesh. Dhaka: World Bank.
World Bank 2005, Bangladesh: country water resources assistance strategy. Dhaka: World Bank.
World Bank (1993). World development report 1993: investing in health. Washington DC: World Bank.
World Bank (2006). Poverty dimension of water, sanitation and hygiene in southwest Sri Lanka. Washington DC: World Bank.(World Bank water supply and sanitation working notes 8)
World Bank (2007). Source for schooling devdata.worldbank.org/edstats/ThematicDataOnEducation/CountryData/total_age15.xls (accessed 21 June 2007)
World Water Day (2006). Water and Culture, MDG and safe water: Bangladesh Targets. www.sdnpbd.org/sdi/international_days/water_day/2006/mdg_freshwater.htm (accessed 21 June 2007)
WSP (Water and Sanitation Program-South Asia) (2000). Learning the fundamentals of hygiene promotion: a review of the three large-scale projects in India. (Sanitation and Hygiene Promotion Series No. 3) www.unpan1.un.org/intradoc/groups/ public/documents/APCITY/UNPAN004771.pdf (accessed 31st May 2007).
WSP (Water and Sanitation Program-South Asia) (2005). Learning the fundamentals of hygiene promotion: a review of the three large-scale projects in India. (Sanitation and Hygiene Promotion Series No. 3) www.unpan1.un.org/intradoc/groups/public/documents/APCITY/UNPAN004771.pdf (accessed 31st May 2007)

WASH baseline findings
119
Appendices
Appendix 1. Upazila wise estimation of hardcore poor in the surveyed areas
Upazila % of hardcore poor Upazila % of
hardcore poor Upazila % of hardcore poor
Bagharpara 11.33 Manirampur 11.50 Keshobpur 15.50 Jhikorgacha 19.33 Sharsha 20.67 Dumuria 6.00 Digholia 13.50 Fultala 15.50 Rupsha 17.67 Batiaghata 10.67 Trishal 14.00 Mymensingh 21.00 Gaforgaon 12.17 Valuka 15.17 Gauripur 17.83 Haluaghat 18.20 Bagura 12.00 Shibganj 13.17 Kahalu 11.33 Dupchachia 9.02 Sonatala 18.17 Sariakandi 26.33 Shajahanpur 10.17 Nandigram 14.83 Sherpur 14.69 Gabtali 18.67 Dhunot 14.50 Adamdighi 16.33 Birganj 17.11 Biral 23.17 Bochaganj 24.67 Kaharol 20.67 Fulbari 22.17 Birampur 20.33 Nawabganj 16.00 Ghoraghat 18.17 Parbatipur 21.83 Hakmpur 19.00 Aatwari 27.00 Pirganj 18.17 Ranisonkail 13.33 Haripur 26.33 Domar 21.83 Nilphamari 22.83 Sayedpur 26.33 Parshuram 16.50 Chagalnaya 9.00 Fulgazi 13.50 Senbagh 8.17 Sonaimuri 17.33 Rampal 7.67 Bheramara 26.33 Mujibnagar 18.83 Kendua 17.00 Barhatta 24.67 Tongipara 8.33 Kashiani 9.17 Bhanga 28.50 Sadarpur 23.67 Pangsha 23.33 Vedorganj 15.33 Shibaloy 17.83 Chandpur 16.83 Shaharasti 13.33 Anwara 20.50 Sitakunda 16.67 Ramu 23.00 Ukhia 26.50 Srimangal 27.33 Chunarughat 21.83 Bianibazar 18.00 Jaintapur 25.17 Jagannathpur 26.67 Ishwardi 24.00 Bhurungamari 21.33

Appendices
120
Appendix 2. Details of household composition at surveyed WASH area
Male Female Total Details % % %
H/H head 38.4% 4.6% 21.3% Spouse 0.2% 37.0% 18.8% Children 51.2% 38.6% 44.8% Parents 1.8% 6.0% 3.9% Siblings 2.2% 1.3% 1.8% Others 6.1% 12.5% 9.3% n 104224 106744 210968
Appendix 3. Disability across poverty class
Hardcore poor Poor Non-poor Total Details % % % %
Not disabled 98.8% 99.2% 99.2% 99.1% Physically disabled 0.7% 0.5% 0.5% 0.6% Other disability 0.5% 0.3% 0.3% 0.3% Total disability 1.2% 0.8% 0.8% 0.9% n 33799 53743 123426 210968
Appendix 4. Disability across gender
Male Female Total Details % % %
Not disabled 98.98% 99.29% 99.14% Physically disabled 0.65% 0.46% 0.56% Other disability 0.36% 0.25% 0.30% Total disability 1.02% 0.71% 0.86% n 104224 106744 210968
Appendix 5. Disability under 5
Under 5 Rest Total Details % % % Not disabled 99.6% 99.1% 99.1% Physically disabled 0.2% 0.6% 0.6% Other disability 0.2% 0.3% 0.3% Total disability 0.4% 0.9% 0.9% n 28720 182248 210968
Appendix 6. Economic status of elderly population among surveyed population
(in number and %)
Age range Ultra poor (%) Poor (%) Non-poor (%) Total Below 60 38012 (19.41) 48887 (24.96) 108972 (55.64) 195871 60 to above 2629 (17.42) 2857 (18.92) 9611 (63.66) 15097 n 40641 (19.26) 51744 (24.53) 118583 (56.21) 210968
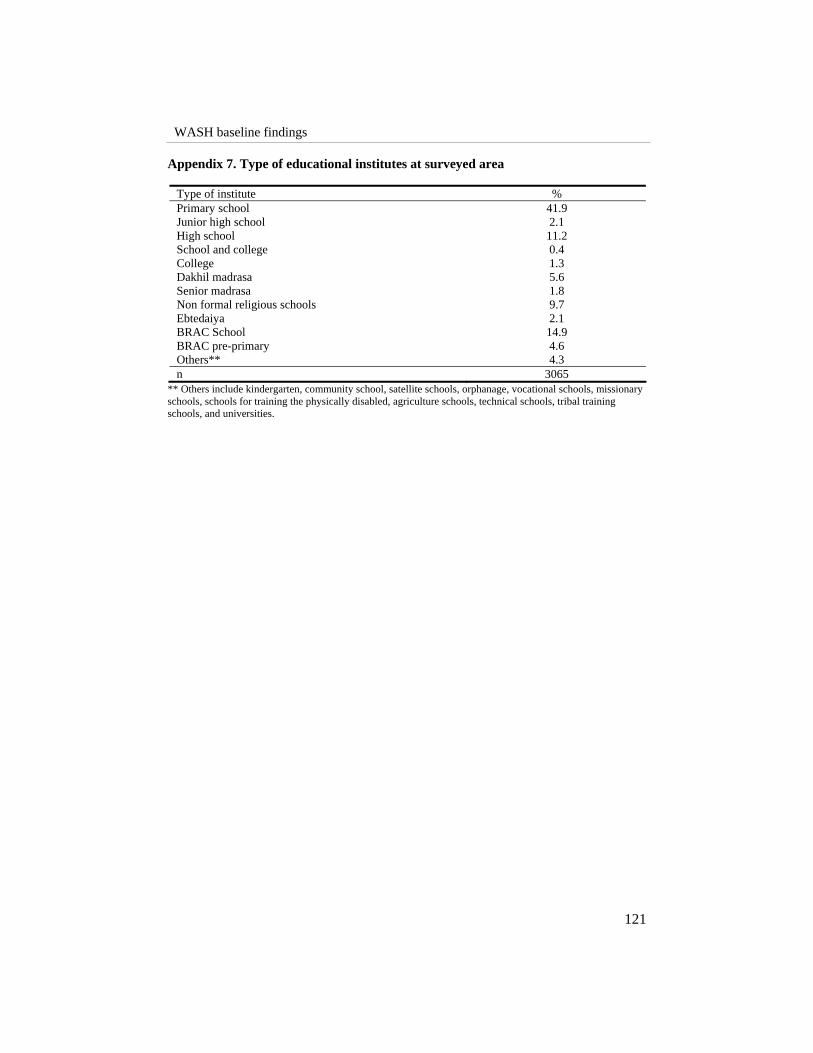
WASH baseline findings
121
Appendix 7. Type of educational institutes at surveyed area
Type of institute % Primary school 41.9 Junior high school 2.1 High school 11.2 School and college 0.4 College 1.3 Dakhil madrasa 5.6 Senior madrasa 1.8 Non formal religious schools 9.7 Ebtedaiya 2.1 BRAC School 14.9 BRAC pre-primary 4.6 Others** 4.3 n 3065
** Others include kindergarten, community school, satellite schools, orphanage, vocational schools, missionary schools, schools for training the physically disabled, agriculture schools, technical schools, tribal training schools, and universities.
WASH baseline findings
123
Abbreviation
ADP BBS BHP BRAC CBN CFPR CUS EHC GoB HIES IFH IRC MDG NGO RED SFG SES TUP UN UNDP UNESCAP UNICEF VERC WASH WB WFP WHO
Annual Development Programme Bangladesh Bureau of Statistics BRAC Health Programme Bangladesh Rural Advancement Committee Cost of Basic Needs Challenging the Frontiers of Poverty Reduction Center for Urban Studies Essential Health Care Government of Bangladesh Household Income Expenditure Survey International Scientific Forum on Home Hygiene International Water and Sanitation Centre Millennium Development Goal Non Government Organization Research and Evaluation Division Specially Focused Group Socio Economic Status Targeting Ultra Poor United Nations United Nations Development Programme United Nations Economic and Social Commission for Asia and the Pacific United Nations Children’s Fund Village Education Resource Center Water Supply, Sanitation and Hygiene World Bank World Food Programme World Health Organization