WAS&24M=QfR00001 (REVISED JANUARY 20,
51
--. I .c WAS&24M=QfR00001 (REVISED JANUARY 20, FIRST QUARTERLY PROGRESS REPORT PERIOD ENDING SEPTEMBER 30, 1964 GPO PRICE $ - RESEARCH a DEVELOPMENT FUEL CELL SYSTEMS ON Contract No. NAS 8-2696 OTS $ - Hard copy (HC) $2 a A+ Microfiche (MF) 1 Prepared for: , Mattamal A-CB and tgoco Adninis+rotion Goorgo C. Marsball e 0 Plight Cnkr Hunhvillo, Alcboma a12 * L 4 o L 5 D- '3 L UUSA CR OR TMX OR AD NUMBER) ! CT~RUI I I &) ALLIS=CHALMERS 1965) v RESEARCH DIVISION MILWAUKEE, WISCONSIN 53201 OCTOBER 30, 1964
Transcript of WAS&24M=QfR00001 (REVISED JANUARY 20,

- - . I
.c
WAS&24M=QfR00001 (REVISED JANUARY 20,
FIRST QUARTERLY PROGRESS REPORT PERIOD ENDING SEPTEMBER 30, 1964
GPO PRICE $ - RESEARCH a DEVELOPMENT
FUEL CELL SYSTEMS ON
Contract No. NAS 8-2696
OTS $-
Hard copy (HC) $2 a A+ Microfiche (MF)
1
Prepared for: ,
Mattamal A-CB and tgoco Adninis+rotion Goorgo C. Marsball e 0 Plight Cnkr
Hunhvillo, Alcboma a 1 2
*
L
4 o L 5 D-
' 3 L
UUSA C R OR TMX O R AD NUMBER)
! C T ~ R U I I
I
&) ALLIS=CHALMERS
1965)
v RESEARCH DIVISION MILWAUKEE, WISCONSIN 53201
OCTOBER 30, 1964

e - .)*
I -
NAS 8-2696-QPR- 0000 1
[Revised 1-20-65)
RESEARCH AND DEVELOPMENT
ON
FUEL CELL SYSTEMS
First Quarterly Progress Rep6rt
Under Modification Number 6, Contract NAS 8-2696
For the Period Ending September 30, 1964
Prepared for
National Aeronautics and Space Administration
George C. Marshall Space Flight Center
Huntsville, Alabama
Research Division, Department 3341 A l l i s - Chalme rs Manufacturing Company Milwaukee, Wisconsin
Approved " J. L. Platner Program Manager

. -~ . .
T A B L E O F C O N T E N T S
FOREWORD . . . . . . . . . . . . . . . . . . . . . . . . . . . . ii SUMMARY . . . . . . . . . . . . . . . . . . . . . . . . . . . . . iii
INTRODUCTION . . . . . . . . . . . . . . . . . . . . . . . . . . 1
RESULTS OF TESTING OF 1.5 KW EXPERIMENTAL F U E L CELL
SYSTEM . . . . . . . . . . . . . . . . . . . . . . . . . . . . . 4
PART I TASKS . RESEARCH AND TECHNOLOGY . . . . . . . . . 17
Technical Plan . . . . . . . . . . . . . . . . . . . . . . . . 17
Technical Progress . . . . . . . . . . . . . . . . . . . . . . 17
Evaluation Tests of Cell Centerline Specification . . . . . . . . . 17
PART 11 TASKS . BREADBOARD AND EXPERIMENTAL ITEMS . . 25
Technical Plan . . . . . . . . . . . . . . . . . . . . . . . . 25
Technical Progress . . . . . . . . . . . . . . . . . . . . . . 25
Design Review of the 1.5 KW Breadboard Unit . . . . . . . . 25 Fuel Cell System Modifications . . . . . . . . . . . . . . . 26
A-C Breadboard Refurbishment . . . . . . . . . . . . . . 27
MSC Breadboardunit . . . . . . . . . . . . . . . . . . . 28
PART 111 TASKS . SYSTEM TEST MODELS . . . . . . . . . . . . 29
Technical Plan . . . . . . . . . . . . . . . . . . . . . . . . 29
Technical Progress . . . . . . . . . . . . . . . . . . . . . . 29
Electronic Controller for a Vapor Pressure Regulator . . . . 30
-1-

8- I, I' I c 1
F O R E W O R D
The first quarterly report, NAS 8-2696-QPR-0000 1, prepared after Modifi-
cation Number 6 to Contract NAS 8-2696, w a s originally issued October 30,
1964. revision of the original report.
1964 through September 30, 1964 is reported.
This report, dated January 20, 1965, is a complete and expanded Technical progress during the period August 1,
Work under this contract is being performed by the Research Division of
All is - Chalmer s Manufacturing Company, Milwaukee, Wisconsin. W i l l Mitchell,
Jr., is the Director of Research. Dr. Powell A. Joyner is the General Manager
of the Space and Defense Sciences Department of the Research Division.
ject type organization w a s formed to car ry out the program specified in the
contract. J. L. Platner, Program Manager, has direct responsibility for the
management and technical aspects of the program. Program management in-
cludes: D. P. Ghere, Assistant Program Manager; Dr. J. R. Hurley, Manager,
Systems Research and Development; P. D. Hess, Manager, Engineering; R. E.
Lochen, Manager, Fabrication and Testing; C. R. Martin, Manager, Quality
Assurance; Gunnar Johnson, Manager, Business Administration; and, M. J. Knuijt, Program Planner.
A pro-

I 1 I II It B t
SUMMARY
Because of an early delivery requirement of a 29 volt fuel cell breadboard system
to NASA ' s Manned Spacecraft Center (MSC), Houston, Texas, an all-out effort t w a s directed toward the fabrication and verification test of a 1800 watt, 29 - 2
volt, fuel cell breadboard system f o r delivery to MSC.
An existing 1.5 KW fuel cell breadboard system was dismantled and inspected and
design specifications were reviewed.
is included. A number of design modifications were made to permit an increase
in the rating of the design to 28 volts at 1800 watts.
board system was completed.
A summary of the tests on the 1. 5 KW unit
Refurbishing of the bread-
Fabrication of the fuel cell breadboard system for shipment to MSC is progressing
as planned and the contractual delivery date of November 5, This unit, rated at 1.8 KW at 29 f 2 volts,will be tested by NASA.
1964 appears valid.
During the reporting period, Modification Number 6 to Contract NAS 8-2696 w a s
executed.
opment on fuel cell systems.
technical plan and quality assurance plan.
to NASA in the form of an Operating Manual for the project. Included in the
manual were the coordinated plans for the three task parts, PERT schedules,
organization diagrams, definitions of responsibilities, laboratory procedures,
and documentation requirements.
The modification covered expanded and extended research and devel-
Significant effort was applied to the preparation of the
The overall Program Plan w a s submitted
A ser ies of two-cell tests were run to evaluate various cell constructions.
evaluation summary of these tests is included under Par t I Tasks.
An
Results of preliminary testing of a breadboard model of an electronic controller
# for a vapor pressure regulator a r e also reported on.

I N T R O D U C T I O N
1- SCOPE OF WORK REPORTED
Modification Number 6 to Contract NAS 8-2696 w a s executed during this reporting
period and has an effective date of August 14, 1964. Pr ior to this effective date
work w a s done under Modification Number 3 to Contract NAS 8-2696.
This report, therefore, covers the conclusion of the work under Modification 3 and
the start of the work under Modification 6 .
OBJ'ECTNEOF MODIFICATION 3 TO NAS 8-2696
Modification 3 to Contract NAS 8-2696 covered research and development work on
the evaluation and design of a hydrogen-oxygen capillary-type fuel cell system and
the fabrication of a 28 volt, 1.5 KW fuel cell assembly for verification of the
evaluation and de sign.
OBJECTIVE OF MODIFICATION 6 to NAS 8-2696
Modification 6 to Contract NAS 8-2696 further amplifies the work under this
contract "to accomplish adequate research and development of materials and
process and to establish engineering criteria that w i l l assure an operational
(fuel cell) system €or space vehicle applications".
I
To accomplish these contract objectives the work is divided into the following
three major task .groups.
Part I Tasks - Research and Technology
II Part I1 Tasks - Breadboard and Experimental Items
Part 111 Tasks - System Test Models
- 1-

Part I Tasks - Tasks include research studies, analyses, and tests to produce
an advance in technology f o r improving the space electrical power systems which
a re being developed. The following areas of fuel cell technology are to be inves-
tigated:
W a t e r Transport Studies
Cell Performance Characteristics
New Plate Designs; Seal and Gasket Material Evaluation
Cell Configuration Studies
Thermal Analysis Program
Coolant Gas Safety Studies
Water Recovery Methods
Overload Capabilities Analysis
Advanced Control Methods
Reactant Impurity Studie s
Shelf Life Determination
Work on Part I Tasks w i l l continue throughout the life of the contract.
Part I1 Tasks
system using August 1964 technology. This unit wi l l be delivered to NASA , MSC, Houston, Texas, f o r their testing and evaluation to establish mid 1964
technology and to assess early in the contract the problem areas that may exist
which would require particular attention in the development program. Two addi-
tional breadboard type fuel cell systems w i l l be built and used by Allis-Chalmers
for in-house development testing.
- Tasks include the early building of an experimental fuel cell
Part III Tasks - Tasks include the development and building of eight 29 volt,
2000 watt power systems for testing and evaluation purposes.
systems w i l l include all necessary controls and subsystems f o r self-sustained
These advanced
-2-

R
operation.
wi l l be designed to vent the by-products of the fuel cell reaction (heat and water
vapor) directly to space.
by-product water to provide a source of potable water.
be performed by both NASA and Allis-Chalmers. The following Fuel Cell
Systems and Components w i l l be built:
TWO types of power systems w i l l be delivered. The open loop type,
The closed loop type w i l l be designed to recover the
Tests and evaluations w i l l
System TESTING PROGRAM Number Allis-Chalmers MSFC MSC
~~ ~~~
In-house
In-house
Ac ce pt anc e
Acceptance
Systems and Subsystems
Components and Subsystems
Components and Subsystems
A c c e pt ance
----- Environmental
----- Engineering
(Refurbished)
Environmental and Design
4. %- Open Loop
Closed Loop
Equivalent Module s and Component s
JIJI %-%-
&I& %-%-T
I .
- 3-

RESULTS O F TESTING OF 1.5 K W EXPERIMENTAL FUEL CELL SYSTEM
Testing and analysis of the 1. 5 KW experimental breadboard was completed during
this report period.
an analysis of the test data obtained.
The following i s a description of the testing accomplished and
Instrumentation
(a) Thermal
Seventy-two thermocouples, in conjunction with a three-position switch
and twenty-four point temperature recorder, were utilized to monitor
the system's thermal characteristics.
Fifty-two of the thermocouples were positioned in the oxygen plates of
the module stack.
ponding to the thirty-five sections of the module; each plate serving two
cells.
canister wall , and primary and secondary coolant temperatures. Figure 1
shows the location of the secondary coolant se nsor instrumentation.
There w e r e thirty-five common oxygen plates corres-
The remaining twenty thermocouples were used to sense end plate,
Number 30 gauge iron-constantan thermocouple wire was used from the
installation to the copper junction block of the three-position switch.
Number 20 gauge Teflon-coated copper wire was used from the switch
to the 24-point recorder. Thermocouple junctions were coated with an
insulating lacquer and then covered with Teflon tape before insertion
into connector pins.
(b) Pressure
The pressure within the canister surrounding the module w a s measured
with a static pressure connection located at the top of the dome. This
- 4-

1 e - *
1' li:
sensed the pressure at the discharge of the heat exchanger and the suction
side of the circulating fans.
system, it was used as the reference pressure for all other pressure
reading s . As this was the lowest pressure point in the
The discharge pressure of the circulating fans w a s measured with a total
pressure tube located within the supply duct 10 inches from the fan. This
reading w a s the A P rise through the fan since the reference pressure w a s
at the fan suction.
The inlet pressure to the heat exchanger w a s measured with a pressure
tube pointed toward the end plate about one inch from the face of the
cooler. See Figure 2 for the exact location fo this pressure probe.
The static pressure connection located at the end of the supply duct on
the A-C side gave the pressure drop in the return passage and through
the heat exchanger.
The pressure of the reactant gas and water removal cavity was measured
with 0 - 50 psia pressure transducers.
w a s measured with calibrated flowmeters.
The flow of reactants and coolant
Summary of P res sure Measurements
1. Reference Pressure
Fan Suction - Top of canister. Also used as total
canister pres sure.
2. A P - Circulating Gas Fan 1 Discharge pressure measured in cooling duct 8-2" from top
plate. Total Pressure. One for each fan.
-5-

I'
3. A P - Across Heat Exchanger
Inlet measured at point one inch from cooler to top plate;
3-3/4" from common centerline of fans and 3/4" f rom
other cente rline.
4. A P - Across Heat Exchanger and Return Passage
Static pressure w a s measured at the bottom of cooling duct
on side A-C.
( c ) Electrical
The output of the module was measured with a dc voltmeter and a dc
ammeter.
with a voltmeter, ammeter, and wattmeter.
The power input to each of the circulating fans was monitored
Individual section voltages were monitored by means of leads passing
through specially constructed potting fixtures positioned in the bottom
end plate.
T e st Des c ription
The initial series of tests on the experimental breadboard had three main objec-
tives.
w a s to be obtained concurrently with characteristics of a secondary gas coolant
heat removal system.
setting to effect static moisture removal over the design electrical load range.
During the system's definition no attempt was made to optimize purge requirements.
Thermal characteristics of the breadboard system along with.proper cavity settings
were defined at 1/ 3, 21 3, and full load, and at 33% overload. Voltage-current
density performance was monitored at discreet intervals, and values were defined
at 1/6 full load increments from no-load to 6670 overload.
A definition of series-parallel 28 volt nominal fuel cell reactor performance
The third objective was to define the proper cavity pressure
. -6 -

T e s t Se que nce
The first test was performed utilizing gaseous helium a s the secondary coolant
supply and water as the primary coolant supply. Reactor load level w a s approxi-
mately 20 amperes (50 ASF) with canister and reactor pressure held at 35 psia
and inlet fin passage temperature held at 190" F.
set at 213 mm Hg (40% KOH and 195" F) and subsequently adjusted for best
performance. A 15 second reactant purge w a s set to occur at intervals of 15
minutes. The excess flow corresponded to approximately 3% of stoichiometric
reactant consumption.
Cavity pressure w a s initially
After a cursory analysis of the data obtained from the helium test, the remaining
tests in the definition ser ies were run utilizing hydrogen as the secondary coolant
and water-glycol (60% by weight) as the primary coolant. With the reactor at
atmospheric pressure, the canister was evacuated and purged with hydrogen to
flush out as much of the inerts as possible. Reactor pressure w a s returned to
35 psia and individual open-circuit voltages were noted, The reactor was then
heated to a 190" F inlet fin passage temperature with proper cavity pressure
defined from the previous test. Runs of 24 hours at approximately 20, 40, 60,
and 80 amperes were conducted to define o r confirm proper cavity pressure at
each level. Thermal data w a s collected.
Utilizing the cavity pressure and purge magnitude defined at the 60 ampere load,
tests at 40 and 20 ampere loads were performed, each of twelve-hour duration,
Differences from previous tests at the respective loads were noted and voltage-
current density data w a s recorded at arbitrary intervals.
Results of Te st
The 'nominal 28 volt,
hours under load,
trode construction, was noted during this period.
0.20 millivolts per hour at 100 ASF and 0.40 millivolts per hour at 200 ASF.
1.5 KW experimental unit successfully operated for 162
Only normal fuel cell degradation, associated with nickel elec-
The average section dropoff w a s
-7-

This contrasted to single cell dropoffs of 0. 10 millivolts per hour and 0. 15 millivolts per hour, respectively, recorded in previous tests. The secondary
heat removal blowers, although inadequate in capacity, provided tolerable thermal
control. The vacuum cavity controller, although requiring considerable manual
manipulation for thermal compensation, did provide the desired cavity settings.
At the outset of the test, meaningful thermal data could not be obtained on the
system at the 20 ampere load, because the heat rejected at this load level was
not sufficient to maintain the desired reactor temperature.
the secondary coolant loop was required to maintain the specified test thermal
conditions.
thermal insulation would have decreased the amount of this heat loss.
Heat injected via
This condition caused a slight modification in the test plan. Added
Helium was used as the secondary coolant during the initial 25 hours of operation.
Hydrogen w a s substituted for the remaining tests.
mary coolant during the entire operational period.
automatically controlled (full on or off) during those periods of time when cavity
pressure settings, volt-ampere characteristics, or purge requirements were
being defined.
the test load levels.
75" F to 135" F and the flow rate was varied as required.
Water was utilized as the pri-
The primary coolant flow w a s
It w a s manually controlled to provide system thermal balance at The primary coolant inlet temperature was varied from
Warmup of the system from room temperature to normal operating temperature
required li hours.
and circulating it through the heat exchanger to heat the secondary gas coolant.
The secondary coolant was then circulated in the normal manner, transferring
the heat energy to the fuel cell module.
The warmup was achieved by heating the primary coolant
The purge rate, interval, and duration were held constant for the first 100 hours
of operation.
load.
purge duration was reduced to a point where the total voltage began to decay.
From this point the purge duration was increased while the purge interval was
shortened.
The purge w a s set at approximately 3% of reactant demand at full
During the last 60 hours of operation, the purge rate was varied. The
-8-

t - A complete set of instrumentation readings was recorded at one-half hour
intervals during the entire operating period.
a sequential run number.
Each set of data w a s assigned
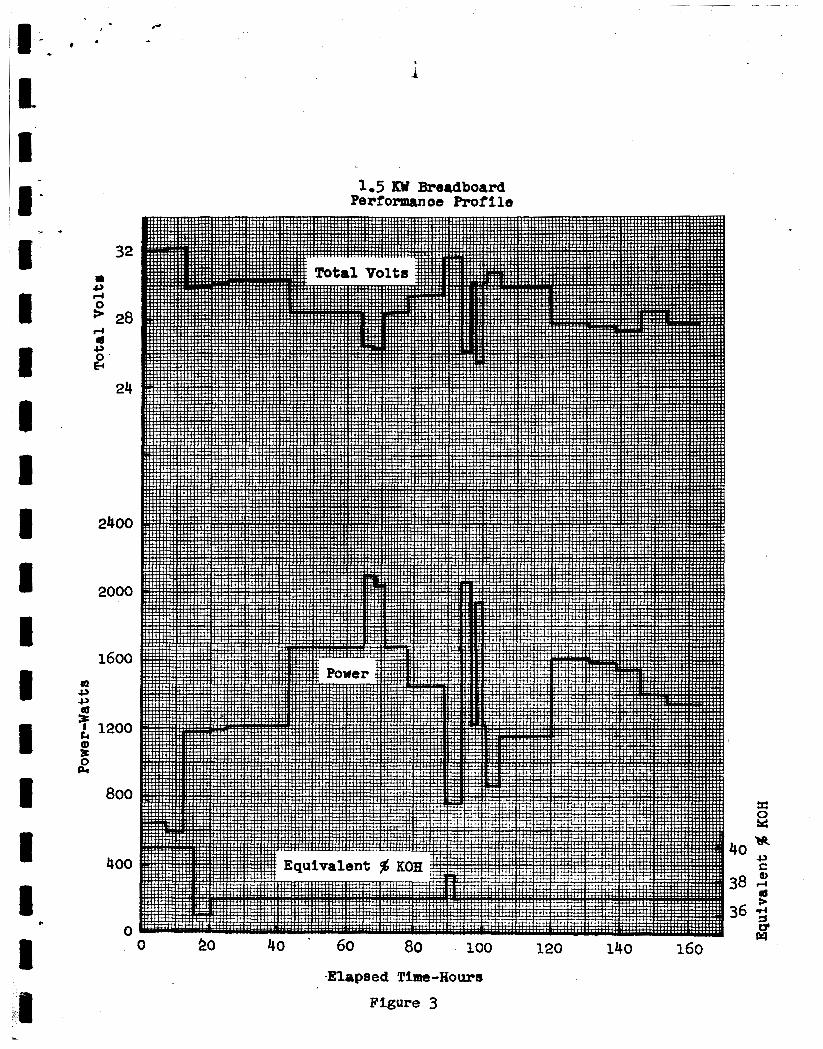
l - Load Profile
The reactor operated on a step load profile as shown in Figure 3.
Some apparent discrepancies between reactor voltage and power output can be
noted in the profile, i. e., increasing voltage with increasing load o r vice versa.
The following is an explanation of these discrepancies related to time in the load
prof ile.
Elapsed Period Explanat ion
12.2 - 19. 1 hours
19. 1 - 25
25 - 43
68.5 - 71
119. 5 - 131. 3
131.3 - 139.3
139.3 - 146.6
153.4 - 162.3
Cavity setting decreased to 36% KOH from 37%
Cavity setting 3770 and increased purge cycle
Operation after weekend shutdown
Slight degradation in performance noted
P u r g e duration 6 seconds
Purge duration 9.5 seconds
Purge duration 10 seconds, volt-ampere curve taken,
and slight alterations in wa te r cavity setting
Cavity leak and purge cycle manipulations
The average reading of the four thermocouples imbedded in the oxygen plates w a s
used to define an operating temperature. With this temperature and a pre-deter-
mined KOH concentration the corresponding cavity controller pressure setting w a s
defined from Figure 4. The optimum cavity setting for operation at all load levels
-9-
was found to correspond to a 37% KOH concentration.
from water samples varied between 6.9 and 9.8 with the majority falling in the
7.0 to 8.0 range.
The pH readings taken
Electrical Pe r f ormance
Voltage-current density characteristics were recorded at 5, 65, 101, and 140
hours of elapsed operating time.
160 hour period due to the unanticipated events which terminated the test.
total and individual section voltage values were recorded.
Observations were not taken at o r around the
Both
Figures 5 and 6 summarize data obtained. Total or average section voltage is
based on the measurements taken from all 35 sections.
System Pressure and Thermal Characteristics
During the 162 hours of operation various levels of steady state electrical load
were achieved and maintained f o r sufficient duration to obtain an indication of
secondary gas coolant subsystem performance as well as fuel cell thermal char-
acteristics.
primary coolant inlet temperature and varying the primary coolant flow rate until
the reactor internal temperatures (average sections 16 and 2 1) were stabilized.
This set condition was then maintained for approximately 1$ to 2 hours during
which time the steady state thermal and pressure characteristics were recorded.
The system was placed in thermal equilibrium by maintaining a fixed
Of the many sets of data taken under these conditions, a selected but representa-
tive number of test runs typical of 40,
in Table I.
50, 60, and 80 ampere loads a re summarized
A definition of the terms used in the table i s included with the table.
I .
The first set of data (column C) was obtained with a 39.5 ampere load (
full load), helium a s the secondary coolant, and a primary coolant (distilled water)
inlet temperature of 133°F. The next sevencolumns of data (D through H), with
2 /3
- 10-

I-.
I *- 1-
1
loads as noted, utilized hydrogen as the secondary medium, various fixed pri-
mary coolant inlet temperatures, and the first of two sets of hydrogen blowers
used in the testing period.
The bearing failure of one blower of the initial set at 101 elapsed hours resulted
in replacement of both blowers, per the vendor's recommendation, with single
phase units.
tially the same performance but much longer life.
and P) a re again with the hydrogen secondary coolant at the conditions noted,
but reflect the performance of the second set of circulating blowers.
cant decrease in blower characteristics is noted in comparison to the initial set.
It w a s the manufacturer's belief that the new units would give essen-
The last two sets of data (0
A signifi-
A thorough review of the temperature data recorded during the breadboard opera-
tion indicated, with a few exceptions, that the prescribed thermal characteristic
w a s obtained and the results were valid. Exceptionally good data was obtained
from the sensors imbedded in the oxygen plates of reactor sections 16 and 21.
There were three general areas in which the temperatures recorded were not
indicative and could not be correlated.
(a) The cell plate fin measurements taken at the secondary coolant fin
passage entrance (along the inlet duct) all appeared to be biased to
some extent. The magnitude of the observed temperature, near to
the inlet duct, increased from the top end plate (blower exit) along
the reactor length to the bottom end plate.
measurements taken at the fin passage exit increased along the length
of the reactor to the center section and then began to decrease toward the
bottom end plate.
expect a relatively symmetric thermal gradient to exist about the middle
of the stack length.
was sufficiently cooled by the secondary coolant in the inlet duct by
means of conduction, to bias the true plate fin reading.
In contrast, the plate fin
The latter trend was more reasonable as one would
The sheath in which the thermocouple was placed
-11-

I - . I ;
I
The primary coolant thermocouples placed in the aluminum fitting just
forward and aft of the heat exchanger gave some very erratic readings
and could not be correlated to the data recorded from the primary coolant
measurements taken in the lines external to the canister. The erroneous
information obtained was believed to have resulted from a second thermo-
electric junction formed in the return passage.
on the fact that a number of the readings were at or near the secondary
coolant temperatures recorded in the return passage.
couple lead w a s not continuous from the installation through the potting
fixture but w a s spliced inside of the canister, a secondary junction was
formed. A check on the installation prior to startup, at the 101 hour
elapsed shutdown, and during post checkout, did give a true temperature
r e adout.
This conclusion w a s based
Since the thermo-
A third a rea of primary concern was the secondary coolant thermal data
obtained from just aft of the heat exchanger and from forward of the blower
inlet.
the heat exchanger on side B-D was consistently 8 degrees lower than the
temperature recorded at the blower exit on that side.
temperature recorded on side A-C w a s consistently 2 to 3 degrees higher
than that recorded at the blower exit on that side.
of the heat exchanger at two locations and aft of each blower exit plane w a s
consistent within instrumentation errors .
that can be drawn for this anomaly unless that it is a function of the secon-
dary coolant flow field.
The temperature recorded by the thermocouple located just aft of
In contrast, the
Data recorded forward
There presently is no conclusion
The average of these two temperatures, in conjunction with the temperature
recorded forward of the heat exchanger, was utilized to define the weight
flow rate, or, with the calculated density, to define the volume flow rate
for the secondary coolant.
table was computed on this basis.
The blower performance noted in the summary
- 12-

I
8 '- From measured data and pressure values, an envelope of the estimated
system A P was drawn up.
7" F a previous calculation imposed a required hydrogen flow rate of
75 cfm per fan, corresponding to approximately 0.96 inches of H20 pres-
sure drop,
To minimize the cell gradient to approximately
Conclusions and Re commendations
The following comments were made after analysis of the tests which were run
on the 1.5 KW module.
Temperature Measurements
The installation utilized for measuring fin plate temperature was a thermocouple
imbedded in a sheath which w a s inserted in a tapered hole in the cell plate fin.
Due to its construction, the sheath lost some heat energy to the surrounding gas
and gained some heat energy from the fin of the cell plate.
temperature of the thermocouple was at some point between the f in temperature
and surrounding gas temperature.
for the cell plate fin w i l l be made during refurbishment of the unit.
Therefore, the
A modification of the thermocouple de sign
The thermocouples installed in aluminum fittings of the coolant lines near the
heat exchanger within the canister did not appear to be reading the true coolant
temperature.
canister appeared to be reading the true temperature,
tures were used for the heat balancing calculations.
The thermocouples installed in the coolant lines external to the
These latter tempera-
Radiation Los se s
There was a considerable variation in the amount of radiation losses calculated
at the higher loads. This variation could be due to the inaccuracy of test data ob-
- 13-

I .
@e:
tained.
It is the difference between the theoretical heat generated within the unit plus
the power input to the secondary coolant circulating fans, and the heat removed
by the heat exchanger (based on data).
The radiation loss is based on the thermal heat balance of the unit.
.
Fan Performance ~
At the end of the first 100 hours of operation, a failure occurred in one of the
off-the-shelf secondary coolant circulating fans. Visual inspection indicated
that the failure was due to a malfunction of one of the bearings. This failure
was discussed with the vendor who indicated that it must have been the result
of operating the unit in a low density atmosphere. The vendor recommended
that a varying flow density, high-altitude, motor-driven fan be used.
fans were installed in the unit and were operated approximately 60 hours with
no apparent mechanical difficulties.
fans.
revealed that these fans did not develop as much head a s the first units.
centrated effort should be expended to obtain the circulating fan performance
necessary to minimize the active area thermal gradient.
Such
A verification test was run on one of these
This test as well a s the results of the 1.5 KW module performance test
A con-
Water Removal Cavity Control
To eliminate manual adjustment a more sophisticated control should be developed
to automatically adjust the pressure of the water removal cavity to compensate
for cell temperature variations.
compensated vacuum control is being developed.
Both a mechanical and an electronic temperature
Circulating Coolant Control
The present control functioned very well a t steady load conditions.
time the load was changed, the control had to be reset to maintain a constant cell
However, each
c
A - 14-

I - temperature.
fully realized if the sensing thermocouple had been within the cell instead of
A more constant internal cell temperature may have been more
i
the cell plate fin. ~
I -
Power Circuit Control R No trouble w a s encountered with the present power circuit control.
8 Purge Svstem
The purge system functioned a s programmed.
Re actant Supply Subs y s tem
There were no indications of any malfunctions of this system.
Primary Coolant Inlet Temperature
The de sired o r limiting coolant inlet temperature was maintained by regulating
the flow of cooling water to the external cooler. At times it was advantageous
to use a mixture of cold water and steam to obtain a high inlet temperature of
the coolant (above 100" F). cooler the coolant inlet temperature w a s 80" to 90" F.
with distilled water.
coolant a mixture of 60% methanol and 40% water, by weight, since the primary
to secondary coolant heat exchanger w a s designed to these requirements and may
not operate as effectively with distilled water.
With the maximum flow of cold water to the external
These tests were run
In the near future the module should be run with the primary
- 15-
t
Static Moisture Removal Subsystem General Conclusions
A 28 volt 1500 wat t breadboard fuel cell system utilizing the Static Moisture
Removal System has been constructed and successfully operated for 162 hours
under load. Several periods of operation were demonstrated at 2000 w a t t s and
at a brief overload of 2580 watts, which is equivalent to 172% of rated load.
The Static Moisture Removal System has been proven by feasibility and bread- 2
board tests to be continuously operable over a range of cell loads up to 214 ma/cm I
Tests on the 28 volt breadboard system have further simplified the system by
verifying water removal from only one side of the cell.
Tests conducted on single fuel cell units employing the Static Moisture Removal
method have demonstrated extended operation at current densities of 300 ma/ cm
and above.
2
The Static System is well suited for operation in a space environment since
water transport occurs in the vapor state and all liquids in the system a re con-
tained in capillary pores.
significant thermal advantage is realized with this system. About 35 percent
of the waste heat burden produced in the cell may be ejected directly to space
vacuum as latent heat of vaporization of the product water, thus reducing the
heat burden imposed upon the space vehicle rejection system.
Where recovery of product water is not desired, a
The Static Moisture Removal Method in a non-condensing system eliminates the
requirements of recirculating reactant pumps, condensers and gas-water separa-
tors.
requirements, valves, piping and connections makes static moisture removal
an inherently more efficient and reliable system.
The absence of these components and their associated parasitic power
- 16-
.

I - PART I TASKS - RESEARCH AND TECHNOLOGY 1- Part I Tasks include research studies, analyses and tests to be conducted to
produce an advance in technology for improving the space electrical power sys- tems to be developed. The areas of particular interest are:
I*- (1) Methods of water recovery and storage of water in a zero gravity
environment.
(2) Improved and simplified thermal controls.
(3) Development of mathematical models of fuel cell systems from
which system performance can be predicted and optimized.
I c
(4) Continued parametric studies of capillary type fuel cells. 8 Technical Plan
During the reporting period the technical plan for the. Par t I Tasks w a s developed.
Each item under the work scope was broken down in sufficient detail to permit
construction of a PERT chart and a list of activity descriptions.
1 Technical Progress
Evaluation Tests of Cell Centerline Specification
A series of tests were conducted using two-cell parallel arrangement test cella
to evaluate the preliminary centerline specification. These test cell assemblies
utilized Allis-Chalmers silver electrodes and various anode structures and were
teated to observe the variations in performance between the several designs.
Table I1 shows the construction details of these test cells. I
- 17-

Test Conditions
or until failure, with the following load profile:
- All tests were continued for a minimum period of 50 hours,
Time Total Current
0 - 10 hours 40 amperes 10 - 40 home 64 amperes
40 - 50 hours 80 amperes
The tests were conducted with a cell temperature of 190" F and a reactant
pressure of 22.0 psig.
Discussion of Experimental Results - Table 111 summarizes the pertinent cell
parameters observed during the tests. Reference to Table I1 wil l reveal the
comparisons which should be made.
To gain a feeling for the magnitude of the performance variation between s'irhilar cells the groups 31 and 32, 34 and 36, 35 and 37 can be compared. The only
difference within a group w a s the number of support plaques.
would not be expected to affect cell performance.
This parameter
The voltages at 200 ASF:
Voltage at 200 ASF
Number of Support Plaques 1 2 AV2 - 1
a 77 - 8 1 ' . 04 . 797 . 806 .009
. 81 .78 -. 03 Average .7923 .7986
- 18-

If it assumed that the six voltage measurements listed above a re drawn from a
normally distributed population of cell voltages, the properties of the population
from which the sample w a s drawn can be inferred.
and standard deviation of an infinitely large set of cell voltage tests can be
estimated.
sample taken, which in this case is six.
merely the average of the test values,
That is, the mean voltage
The confidence limits of the estimates depend on the size of the
The estimate of the mean value is
M = ' t v i m - - . 796 volts
where:
M is the mean value
N
Vi
is the number of tests
is the voltage of the cth test
The standard deviation estimate of the voltages around the mean is given by
6 = 0.017 volts
For a sufficiently large number of tests, 68% of the test values w i l l lie in the
range of 0.796 to . 017 volts, 95% w i l l lie in the range of 0.796 f0.034 volts.
This assumed that M and 6 were correctly estimated. Since only six measure-
ments w e r e taken it cannot be said with certainty that the mean is 0.796 or the
standard deviation is 0.017. It can only be said that there is a certain probability
that these two values lie within a certain band.
T distribution that for the case at hand:
It can be shown by R. A. Fisher 's
Probability of True Mean Lying
Withih Confidence limits Confidence Limits
99.9% 99 % 95 %
0.748 - 0.844 0.768 - 0.824 0.778 - 0.814
- 19-

The estimate of the standard deviation for the fuel cell voltage is also not a
true value, but here again only the midpoint of a band which has a particular
probability of including the true but unknown value of 0- . The wider this
band i s chosen, the more probable it includes the true value of .
The mean value of cell voltage for one support plaque fuel cells is extremely
close to mean value for the two plaque cells, i. e., within 0.0063 volts.
this difference is very much smaller than the uncertainty attached to each of the
mean values, it is of no statistical significance.
is no variation of cell voltage with the number of support plaques used.
Since
This would indicate that there
The four types of anode material which were tested were designated:
( 1 ) Clevite No. 1
( 2 ) Clevite No. 2
t 3) A-C 464
(4) A-C 564
Comparison of the effect of anode material on performance w a s made by studying
the column variation of the following groupings.
Voltage at 200 ASF AV = V average - V
Number of Support plaque s 1 2 1 2
Type of Material
Clevite No. 1
Clevite No. 2
A-C 464
A-C 564
Average
.77
.797
.81
.792
.81 .022 -. 018
.801 -. 005 -. 014
.78 -. 018 .012
.771 --- . 021
.792 -. 0003 . 0003
-20-

e *
The trend in the column for one support plaque is not the same as the trend in
the column for two support plaques. Thus, it must be concluded, that within
normal current density ranges, the variations of anode base material which
were tried had no significant effect upon cell performance.
I he trend in performance due to a change in the plating density of catalyst on the
anode w a s obtained by comparing cells 34 (30-30) and 39 (20-20).
Catalyst Density
30-30 (30 mg/in2 Platinum - 30 mg/in Palladium
20-20 (20 mg/in2 Platinum - 20 mg/in Palladium
Voltage at 200 ASF
0.797
0.796
2
2
Thus, within the range of catalyst plating density tested, no variation in cell
~ ~ ~ ~ r f o r r n a n c e w a s evident.
Variation of cell voltage at constant current density as a function of membrane
thickness should be due to the change in voltage drop across the electrolyte.
l h i s is expressed by the equation
11 hen is the tortuosity * 3, and is defined by: equivalent distance traveled
lry a n ion = x straight line distance. P is the porosity of the asbestos and
is used here in the expression A - PA' where A is the actual area through which
-in ion can move, and A' is the normal cell surface area. J is the current den-
bity, and 3- is the electrolyte conductance which has been experimentally
determined for KOH - H20 solutions. For 200 ASF, normal operating tem-
paratures and concentration, and a change of length of 0.01 inches, the expected
change in voltage would be:
) volts 200 1 x - x 0.01 ( 3 AV = - .7 1.6 2.54 x 144
- - 0.0146 volts
-2 1-

.
This should compare with the voltage difference at 200 ASF, of the group 39,
40. The observed cell voltages a t 200 ASF were:
Cell Number
39 40
Spacing
0.03
0.02
Voltage at 200 ASF
0.794
0.840
- - 0.044
The fact that the measured value was 30 millivolts high could be attributed to
random cell-to-cell variation o r an erroneous estimate of
factor.
to establish the cause of the discrepancy.
, the tortuosity
Further testing of the statistically significant groups must be performed
Cells 42, 44, and 45 experienced difficulty and had to be shut down prior to
completion of the original test programs. 2 2
had been replated with catalyst from densities of 20 mg/in Platinum - 20 mg/in
Palladium to 30 mg/in Platinum - 30 mg/in2 Palladium. Tests were run on
the anode of cell 42 to determine its plating density, surface area, and porosity.
The results were:
These cells contained anodes which
2
Original Re plated (30-30) (20-20 to 30-30)
Measured Density (27.9-29.6) mg/in2 Pt (27-29.7) rng/in2 Pt (28. 1-29.4) mg/in2 Pd (25.5-29.9) mg/in2 Pd
(1.25 - 1.64) m2/gm 2 Measured Surface A r e a (1.22 - 1.32) m /gm
Measured Porosity (72. 3 - 73. 1) % (73.5 - 72.5) %
The above physical parameters show no obvious difference between the two types
of anodes. It is possible that other measurements may show some differences.
-22-

1- 1. i I'- i- t P 8 1 I 8
1 i 1 II: 4 1
e
l * t * ..
It is also possible that the short cell life is in no way connected with the type
of anode used.
Teardown reports on most of the cells noted that there w a s a white deposit on
the hydrogen electrode, usually near the gas inlet, A sample of this material
was obtained from cell 38 and chemically analyzed. The results were:
C02 - 24% K - 2 8 %
These a r e roughly the percentages which would be expected if the material were
KZC03 (3270 and 28%).
had any observable white deposit, the other electrode appeared to be clean.
of the KOH in the asbestos may have revealed the presence of GO2.
done.
previous cells.
between the tank and the cell a r e not being made as well as previously.
In cell number 38 only one of the hydrogen electrodes
Analysis
This w a s not
This could also explain the reason why white deposits were not noted in most
It is also possible that a less pure gas w a s used, or that connections
Figure 7 shows the observed average performance of cells 31 - 40. The apparent
degradation of performance with time may be due to a bias such as inert buildup
o r cell terminal corrosion. The observed decay w a s 0.3 millivolts per hour at
200 ASF. Cell number 38 shows only about 0. 1 millivolt per hour at 200 ASF.
Conclusions and Recommendations
( 1 ) No observable effect on cell performance due to the use of one o r
two support plaques.
(2) No observable effect on cell performance with catalyst loading in
the range of 20-20 - 30-30.
( 3) No difference in lot numbers of Clevite electrodes.
(4) No difference in A-C 464 or Clevite anode.
-23-

5 ) Statistical scatter of cell performance within a group of cells is
I I
i
expected to be large. Many
measure a re small. Thus,
samples should be used,
of the parameters which w e wish to
in future tests, statistically significant
EXAMPLE
The standard deviation of the group of six cells assumed to belong to
the same family w a s estimated to be = 0.017. By using properties
of tc t ilormal distribution it is possible to specify the number of separate
t e s t s
true m-an lies within a certain band 6 V with a probability P . N which must be considered in order to be able to say that the
P
90 %
95 70
39 70
99.4 Yo
6 V N
0.008 0.016
0.008 0.016
0.008 0. 016
0.008 0.016
12 3
17 4
30 8
49 12
-24-

I /. I- -
PART 11 TASKS - BREADBOARD AND EXPERIMENTAL ITEMS
Part I1 Tasks include the building of an experimental fuel cell system using
cur rent technology (August 1964) and the refurbishing and modification of an
existing 1500 watt system. The refurbished and modified system (A-C BB No. 1)
i s rated at 1800 watts at 29 volts, and w i l l be subjected to verification testing
at Allis-Chalmers.
tested and delivered for further testing by N A S A , MSC Houston, Texas. Another
28 volt, 2 KW breadboard system (A-C BB No. 2) wil l be built and used for
continued development testing at Allis-Chalmers in support of Part 111 Tasks.
These systems w i l l differ from the later advanced systems to be developed in
The other rated at 1800 watts at 29 volts, w i l l be acceptance
that the electrical and fluid control hardware w i l l be panel mounted on test boards.
Technic a1 Plan
Prior to the initiation of work on the Part 11 Tasks, a review of the work scope was made and a detailed schedule and technical plan w a s formulated.
plan and PERT schedule were included as part of the Operating Manual submitted
to NASA.
The technical
Technical Progress
The 1500 watt fuel cell system described in the first part of this report w a s dismantled and inspected. A Support Plate Log was initiated, at this time, to
provide an active history of all cell plates.
A design review of the 1.5 KW experimental unit reactor assembly, controls, and
instrumentation w a s made in preparation for modification and rebuilding of the
system. . The disassembled condition of the reactor, performance data obtained
during the 162 operating hours previously logged, and general operating tech-
niques required during the test were used as a cri teria for the review.
-25-

Fuel Cell System Modifications
A number of design modifications were executed to enhance the system perform-
ance of the Part I1 breadboards.
have been increased to 1.8 KW for the MSC breadboard and A-C BB No. 1, and
increased to 2.0 KW for the Allis-Chalmers breadboard No. 2, as shown on the
abbreviated performance specification included with this section.
tions incorporated into the redesign of A-C BB No. 1 and the MSC breadboard
a re summarized a s follows:
The nominal ratings of the Part I1 breadboards
The modifica-
(1) Cathode material changed from nickel to silver
(2) Support plaques used on both side of water removal membrane
instead of only on the vacuum side
( 3 ) Increased clearance for cell gaskets
(4) Increased secondary coolant passageways between hydrogen and
water removal plate s
(5) Improved t empe rature instrumentation installation technique s .
Instrument at ion
A review of temperature measurements taken during initial operation of the 1.5 KW
unit indicated that some of the data was biased. The specific a reas of concern were
oxygen plate temperatures recorded in the inlet duct region and redundant measure-
ments taken internal to the canister just before and aft of the heat exchanger. In both cases, temperatures were apparently influenced
tions in their respective areas. A new thermocouple
which should eliminate this problem.
-26-
by secondary coolant condi- installation has been tested

ABBREVIATED PERFORMANCE SPECIFICATION
FOR A-C AND MSC BREADBOARD UNITS
1 .- I' I
1 i 1 I 8 I i
Fuel Cell Module Design:
Rated Power:
Voltage Regulation:
35 series connected sections, each composed
of two parallel connected cells with each cell
having 0.2 f t2 active area.
1800 w a t t s nominal - MSC and A-C BB No. 1 2000 w a t t s nominal - A-C BB No. 2
MSC Unit - 29 f 2 volts, d. c. from 800 to
A-C BB No. 2 - 2 8 t 2 volts, d.c. for
1800 wat t s gross
normal load variations
Module Operating Temperature 195 f 5 F and 37 psia
and Pre s sure:
Pe r f ormance Requirements : 500 to 1400 w a t t s for 200 hours, continuous
MSC Unit 1800 for s ix hours duration
A-C BB NO. 2 800 to 2000 w a t t s for 720 hours
Thermal Control System
Primary Coolant:
Se c ondary Coolant:
Canister Pressure:
Water glycol or distilled water at inlet temperature of 70 +loo F
Helium or hydrogen at 175 10" F
Charged and maintained at 40 psia and maintained within ? 1 psi.

R.- B" - 1;-
Controls
The design of the electronic fuel cell w a t e r vapor cavity controller has been re-
viewed.
from an analysis of the basic circuit, the controller w a s modified to provide the
following features:
From operating experience gained during breadboard unit operation, and
(1) Percent KOH selector control
(2) Provision for a range of pressure transducer characteristic slopes
( 3 ) Temperature compensation within a range of 100 to 225" F
(4) Elimination of overshoot through a proportionate e r ro r correction,
variable duty cycle, trigger circuit for the vacuum solenoid valve.
A breadboard of this temperature compensated controller has been built for veri-
fication testing. In addition to the electronic
vacuum control development, an effort is underway to design a mechanical tem-
perature compensated vacuum regulator.
Initial testing has been successful.
A-C Breadboard No. 1 Refurbishment
The Allis-Chalmers 1.5 K W breadboard system w a s refurbished. The assembly
and preliminary system checkout were completed September 2 1,
tion logs and check sheets were implemented for record purposes.
1964. Configura-
Components for A-C fuel cell assemblies and canisters were received, inspected
and identified according to planned quality control procedures.
such a s asbestos, electrodes, plaques, support plates, catalyst materials, etc.,
were brought under lot control procedures.
Vital materials
The system testing was initiated and is still i n progress.
characteristics of the unit a re shown in Figure 8.
The initial performance
-27-
- .
MSC Breadboard Unit -
All major components for the fabrication of the MSC 1.8 KW breadboard w e r e
under construction by the end of August. The required cell plates, which are a long lead item in the fabrication, were completed on August 21,
tory of raw materials, and of finished components w a s initiated early in the
reporting period.
1964. An inven-
Al l components for the fuel cell assemblies and canisters were received, in-
spected and identified in accordance with planned quality control procedures.
Fabrication of the MSC 1.8 KW breadboard has progressed on schedule. Some
subassemblies have been completed and the stacking of the MSC fuel cell module
was completed.
The configuration and requirements of the MSC interface board which w i l l be
delivered with the fuel cell assembly, were received and the interface board
was designed.
Fabrication of the checkout board and the interface board for the MSC 1.8 KW
unit have been completed and the assembly of the boards has started.
-28-

PART III TASKS - SYSTEM TEST MODELS
Par t I11 Tasks include the development and building of eight advanced 29 volt,
2000 watt power systems for testing and evaluation purposes. These advanced
systems w i l l include all necessary controls and subsystems for self-sustained
operation.
w i l l be designed to vent the byproducts of the fuel cell reactions, heat and w a t e r
vapor, directly into space.
source of potable water.
and Allis-Chalmers.
Two types of power systems w i l l be delivered. The open loop type,
The closed loop type w i l l be designed to provide a
Tests and evaluations will be performed by both N A S A
Technical Plan
Tasks were. reviewed in depth and a technical plan for the Part I11 Tasks and a
quality assurance plan was prepared. A detailed PERT plan and a list of activity
descriptions were prepared.
Preliminary plans have been written to formalize flow of paper work from inception
of Purchase Requisition through to Receipt, Acceptance and Storage of material and
parts for this project.
materials and parts into sub-assemblie s and assemblies.
The procedures w i l l provide complete traceability of
Technical Progress
A design has been evolved for a temperature compensated vacuum regulator with
the intention of building and testing a prototype model. A preliminary concept of
a fuel cell primary coolant control was finished and the assembly of a breadboard
model of it has begun. An investigation of methods of maintaining a constant fuel
cell load current was initiated.
in laboratory testing.
pressure regulator were completed.
This constant current load device w i l l be useful
Verification tests on an electronic controller for a vapor
-29-

I
T
Procurement specifications for improved system control components such as
reactant regulators, solenoid valves, etc. , specifically designed and sized for
their intended application a re being reviewed and revised as required.
specifications for these components are also being written.
Test
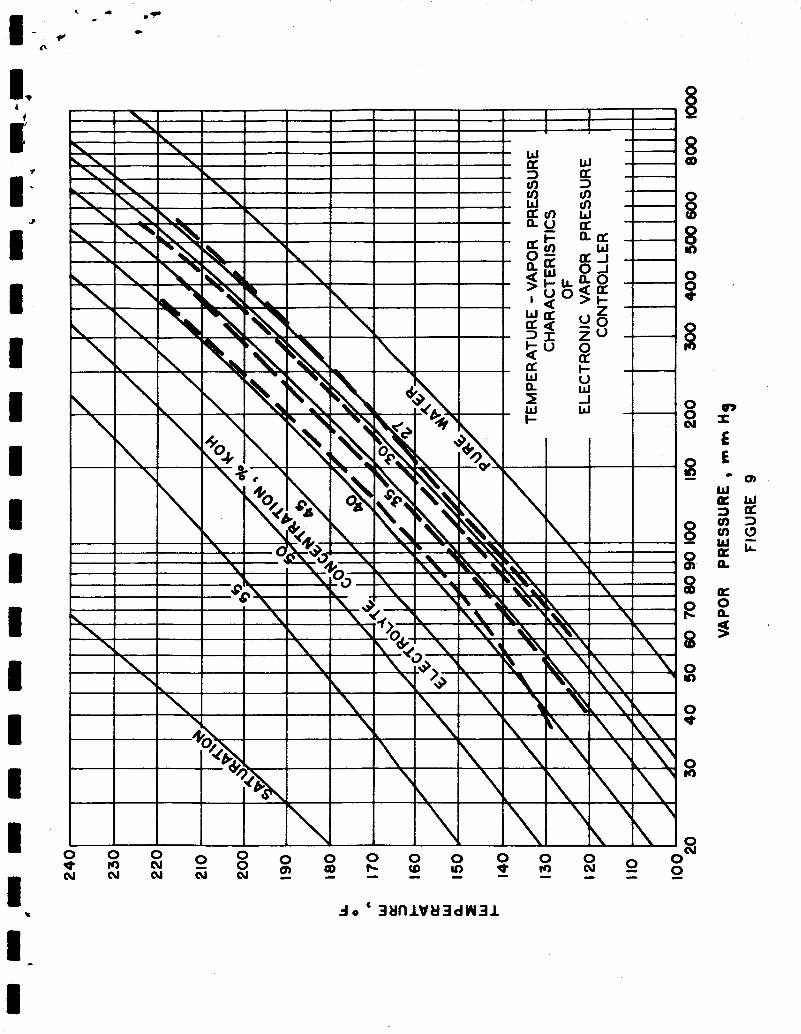
Electronic Controller for a Vapor Pres sure Regulator
The KOH electrolyte concentration in an operating fuel cell is dependent upon
the operating temperature and the vapor pressure in the water removal cavity
as shown in Figure 4. A temperature compensated, electronic controller circuit
for regulating this cavity vapor pressure has been developed. The developed cir- .
cuit de sign permits the direct application of commercially available microminiature
construction.
Basically the vapor pressure regulator wi l l sense the cell temperature and adjust
the water removal cavity pressure to maintain a preset electrolyte concentration.
Calibration tests of a breadboard model of this controller were run using a mock
fuel cell, and finally the controller w a s tested on an operating fuel cell system..
Typical test results a re shown in Figure 9. is capable of keeping the fuel cell at an optimum electrolyte concentration over a
wide range of cell temperatures.
230" F.
These results show that the controller
The present compensation range is from 120 to
-30-
TEST DATA DEFINITIONS FOR TABLE I
I' I 1 I I I I 8 1 1 1 1 1 8 1 I
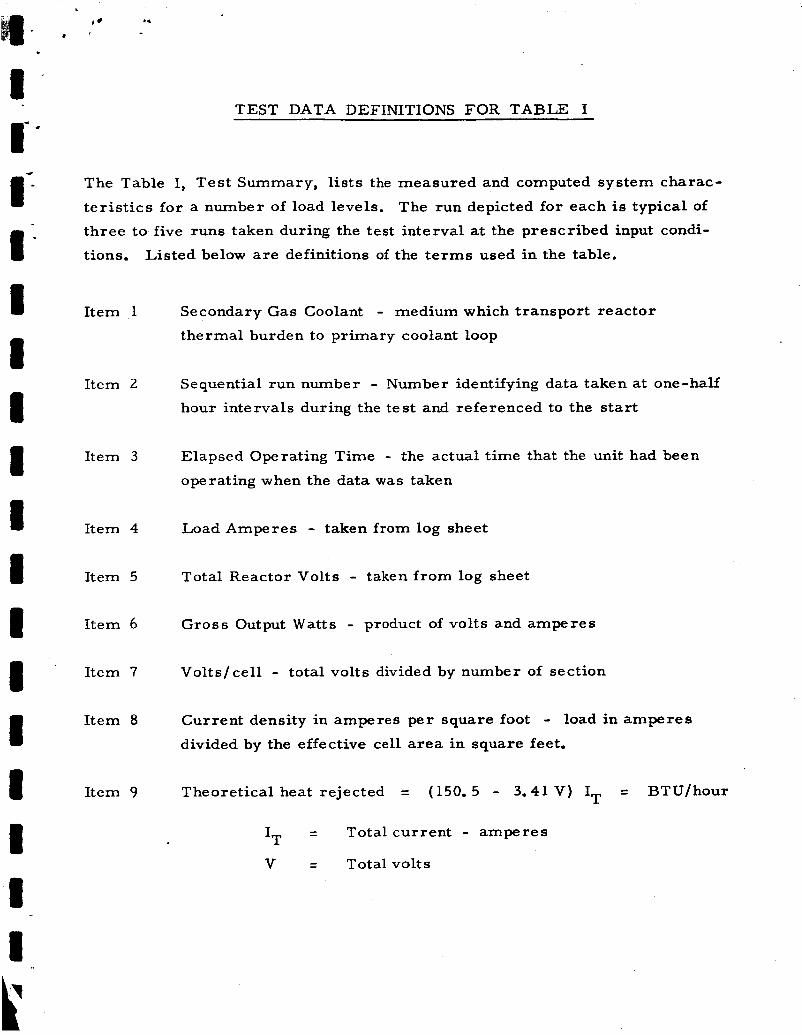
The Table I, Test Summary, lists the measured and computed system charac-
terist ics for a number of load levels. The run depicted for each is typical of three to five runs taken during the test interval at the prescribed input condi-
tions. Listed below are definitions of the terms used in the table.
Item 1
Item 2
Item 3
Item 4
Item 5
Item 6
Item 7
Item 8
Item 9
Secondary Gas Coolant - medium which transport reactor
thermal burden to primary coolant loop
Sequential run number - Number identifying data taken at one-half
hour intervals during the test and referenced to the start
Elapsed Operating Time - the actual time that the unit had been
operating when the data was taken
Load Amperes - taken from log sheet
Total Reactor Volts - taken from log sheet
Gross Output W a t t s - product of volts and amperes
Volts/cell - total volts divided by number of section
Current density in amperes per square foot - load in amperes
divided by the effective cell area in square feet.
Theoretical heat rejected = (150.5 - 3.41 V) IT = BTU/hour
IT = Totalcurrent - amperes
V = Total volts

Test Data Definitions for Table I (continued)
Item 10
Item 11
Item 12
Item 13
Item 14
Item 15
Item 16
Item 17
Item 18
Primary coolant inlet temperature - distilled water temperature
recorded (T/C 72) external to canister on inlet line to heat exchanger
AT Primary Coolant Heat Exchanger - distilled water temperature
rise across heat exchanger measured external to canister
Primary Coolant Flow - distilled water flow rate measured with a
calibrated flowmeter
Heat Removed in Heat Exchanger - product of primary coolant flow
rate and temperature rise
Total Fan Input - power input to both circulating blowers measured
with a wattmeter
Net Convective - Radiation Loss - Difference between theoretical
heat generated within the unit plus the energy input to the circulating
blowers and thermal burden removed by heat exchanger
AT Circulating Gas - secondary gas coolant temperature difference
recorded across heat exchanger
Flow of circulating gas lbs/hour - heat exchanger thermal burden
extracted divided by specific heat and temperature drop of gas across
the heat exchanger
Canister Pressure - secondary coolant total pressure measured
in the canister dome

Test Data Definitions for Table I (continued)
Item 19
Item 20
Item 21
Item 22
Items 23
and 24
Item 25
Item 26
Item 27
Flow of circulating gas - cfm/fan - divided by density equals total volume rate in cfm', One-half
of total volume rate will be capacity of one blower,
flow in pounds per hour
A P of circulating gas across fan in inches of water - taken from
log sheet
A P across heat exchanger - inches of water taken from log sheet
A P across heat exchanger and return passage - taken from log sheet
Taken from temperature data sheets
Average AT Fin Temperature - difference between the average
plate fin temperature at the fin passage exit plane and the plate fin
temperature at the passage inlet
AT across active area - measured temperature difference across
half width of cell active a rea taken at two sections
AT Plaque CL to fin exit - thermal gradient measured from
center of cell active area to plate fin passage exit.

c
a
- 0
B P
m J . m
4
d
f N m
0 n m
N 0:
I-
4 m m d 0 n
N n n N
N
n n' P
n
N r;
0
N x m
r: 2
0.
I- m m
i 0
3 s n m d
m
d 0
I- f . m 01 -
n
d . m i 2
* r:
m 0'
m i
n
I
5 a I - B
ir
E P
d d
0 TI
m e
bl
a
I Y Y
P 3 d t;
I
0
a'
1
3 E . m I
h
f d d
d
I d d
8
W >
...
Y
c;
a m
g a a a c a a a
a 3 . 3 a 1
a 2 2
E 1 h a Y
5 0 a a
a
.d
Y
d
0 N

M . 1. I t 1- I I I I I I I I I I I I I
U w
k
N
0
m 0
4
In
In 4
- 0
0"
m 0
0 m I 0 m
0 u 4 .r( >
Q ) O G 2
aG e In
=E= 4
u c
d
m
fu
0
N 4
In
m d
- 0
d m 0
0 M I 0 m
w 9 * u U
e" m =it 4
u 4
Ln m
fu
In . c(
4
In
m 4
- - 0 m 0
d
0 m I 0 m
4
m 0
4
4
In
m . 4
- b m 0
0
0 m I 0 m
26 u u z u
4
m 0 d 4
m In
0
4
- b
0' m 0
0 m I 0 m
* 9 m u 4
e" m 9 4
V U
CQ m
M
m 4 4
m m . 4
- 6
d m 0
0 m I 0 m
* 9 * u c
-? m =k 4
u U
4 *

O U O V w4
m si 3
n W W
bi 4
a, u c 2 k 0 % k a, a
tn m * . * a0
N In o1
tc 0 d
m
c

%I“--- - ,
x 202 X I I i I- ---
C 195.2 196.2%
) ‘ii Ka ! It
I82 172.5
11-
re0
1 u h
\
F-
FIGURE I
xOxY6OEN PLAlL U ) U T I O N S b 5 E U ” A U Y COOLANT
K€TUQN PASSAGE 0 SECONDARY COOLANT
B€FORE H U T EXCH. 40 SECONDARY COOLANT
INLET DUCT.

LOCATION - OF PAESSUAE; IMTRUMENTATIOM
PRESSURE
FIGURE
i
X
-Elapsed The-Hours
Pfgure 3

a a a 0
>

.
n *
I
36
34
32
3 30 U rl s r" 28 4:
rl
26
24
22
I l l I I I l 1 I .
I Y f i j ! ; 11.5 KU Breadboard Fuel C e l l System ' i f I j 1 Output Characteristics I
I
1 2 3 Electrical Output - Xilowat-cs 1
Figure 5

I
0 d . o\
0
co P- 0 0
e .. \D
0 0 0.

4
t I . e La* .-
<n >
n
tc) rr) 0 0 0 0
w W 3 L - J
Ji-
I I I
/ /
I
0 0 cu
L L <n a
I- z W a a 3
0 0 u)
0
. S l l O A - 3 9 V l l O h
c

t
Q Q) k Q, a E 4
co m