Warm-up – Wed. 4/15 Easter was Sunday, 4/05 Describe the price of Easter candy on Monday, 4/06,...
56
Warm-up – Wed. 4/15 Warm-up – Wed. 4/15 Easter Easter was was Sunday, Sunday, 4/05 4/05 Describe the Describe the price price of Easter of Easter candy on Monday, 4/06, compared candy on Monday, 4/06, compared to Saturday afternoon, 4/04? to Saturday afternoon, 4/04? Explain the Explain the need need for Easter for Easter candy on Monday 4/06, compared candy on Monday 4/06, compared to to Saturday afternoon, 4/04? Saturday afternoon, 4/04?
-
Upload
ezra-conley -
Category
Documents
-
view
214 -
download
0
Transcript of Warm-up – Wed. 4/15 Easter was Sunday, 4/05 Describe the price of Easter candy on Monday, 4/06,...

Warm-up – Wed. Warm-up – Wed. 4/154/15
Easter Easter waswas Sunday, Sunday, 4/054/05
Describe the Describe the priceprice of Easter candy on of Easter candy on Monday, 4/06, compared to Saturday Monday, 4/06, compared to Saturday afternoon, 4/04?afternoon, 4/04?
Explain the Explain the needneed for Easter candy on for Easter candy on Monday 4/06, compared to Monday 4/06, compared to Saturday afternoon, 4/04?Saturday afternoon, 4/04?

Lesson Essential Lesson Essential QuestionQuestion
How do you visually How do you visually represent changes in an represent changes in an
economic system? economic system?

VocabularyVocabulary
SupplySupply
DemandDemand
Supply/Demand CurvesSupply/Demand Curves
IncentivesIncentives

Supply and Supply and DemandDemandNotes, Graphing, and Lots and Lots Notes, Graphing, and Lots and Lots of Practice!!!of Practice!!!

““What is What is Economics?”Economics?”
Read to get a handle on this topic. Read to get a handle on this topic. It might be a quick review for you! It might be a quick review for you! Grab a highlighter and a pen if you Grab a highlighter and a pen if you don’t already have one out.don’t already have one out.

One thing to One thing to remember!remember!Everything we discuss today is Everything we discuss today is assuming we are in a PERFECT assuming we are in a PERFECT ECONOMIC WORLD!ECONOMIC WORLD!

The Basic Graph The Basic Graph (aka “The Starting (aka “The Starting Point”)Point”)

What do the letters What do the letters mean?mean?
X axis = Q = X axis = Q = Quantity Quantity
Y axis = P = Y axis = P = PricePrice
D = D = DemandDemand
S = S = SupplySupply
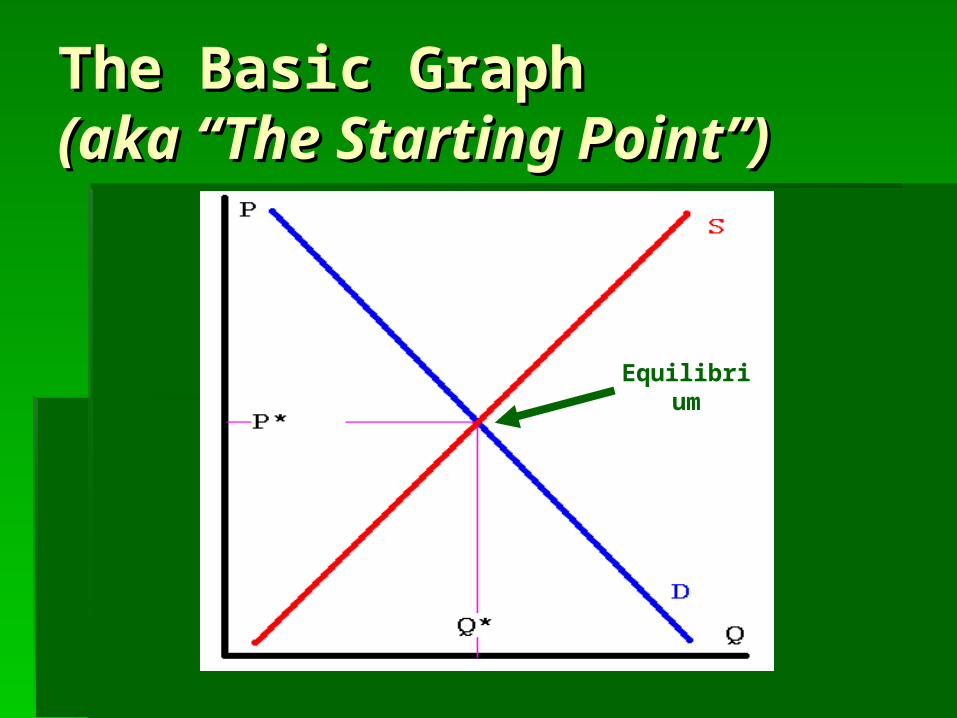
The Basic Graph The Basic Graph (aka “The Starting (aka “The Starting Point”)Point”)
Equilibrium

What do the letters What do the letters mean?mean?
““The Intersection” = The Intersection” = EquilibriumEquilibrium (shows (shows perfect supply/demand)perfect supply/demand)
Q* = Q* = Quantity Demanded/Supplied (at Quantity Demanded/Supplied (at the equilibrium price) the equilibrium price)
P* = P* = Equilibrium Price Equilibrium Price

Definition for SupplyDefinition for Supply(represents (represents ProducersProducers))
The total amount of a good or The total amount of a good or service producers are willing service producers are willing and able to and able to makemake at all at all pricesprices at a at a specific point in timespecific point in time..

Law of SupplyLaw of Supply
States that as the price States that as the price increasesincreases the quantity supplied the quantity supplied also also increasesincreases. The same . The same applies for a applies for a decreasedecrease in price. in price.
or

DETERMINANTSDETERMINANTS – Things – Things That Could That Could ShiftShift (change) (change) the the SupplySupply of a Product of a Product
Price and availability of Price and availability of landland, , laborlabor and/or and/or capitalcapital (factors of (factors of production) production) (e.g.: OJ v. cold winter)(e.g.: OJ v. cold winter)
New New technologytechnology (e.g.: cotton gin)(e.g.: cotton gin)
Number of other Number of other sellerssellers (e.g.: (e.g.: grocery stores in M’town)grocery stores in M’town)

DETERMINANTSDETERMINANTS – Things – Things That Could That Could ShiftShift (change) (change) the the SupplySupply of a Product, of a Product, cont.cont.
Price of Price of other goodsother goods someone could someone could produce produce (e.g.: fresh fruits and/or vegetables in (e.g.: fresh fruits and/or vegetables in the summer v. winter)the summer v. winter)
TaxTax Policy Policy (e.g.: GOVERNMENT(e.g.: GOVERNMENTif taxes increase then overall cost goes up)if taxes increase then overall cost goes up)
Let’s Practice!Let’s Practice!

Graphing a Graphing a ShiftShift in Supply in Supply(start w/ the basic graph)(start w/ the basic graph)
S2
S2

Graphing a Graphing a ShiftShift in in Supply Supply The NEW supply line (S2) is The NEW supply line (S2) is
called the called the Supply CurveSupply Curve.. It is a graphic representation of It is a graphic representation of
supply!supply!
That’s CrazyThat’s Crazy – it’s a – it’s a straight line, but don’t straight line, but don’t let that throw you off! let that throw you off!

Graphing a Graphing a ShiftShift in Supply in Supply (show the new (show the new price/quantity)price/quantity)
S2
P2
Q2
E2

Definitions for DemandDefinitions for Demand(represents (represents ConsumersConsumers))
The total amount consumers The total amount consumers are willing and able to are willing and able to buybuy at at all all pricesprices at a at a specific point in specific point in timetime..

Law of DemandLaw of Demand States that as the price States that as the price
increasesincreases the quantity the quantity demanded demanded decreasesdecreases. . Same applies for a Same applies for a decreasedecrease in price.in price.
or

DeterminantsDeterminants - things that - things that could could shiftshift (change) the (change) the DEMAND for a productDEMAND for a product
Tastes and Tastes and fadsfads (Q’back jerseys)(Q’back jerseys)
IncomeIncome (BMW dealerships in area)(BMW dealerships in area)
Number of Number of buyersbuyers (Burger King)(Burger King)

DeterminantsDeterminants - things that - things that could could shiftshift (change) the (change) the DEMAND for a product, DEMAND for a product, cont.cont.
FutureFuture price price expectationsexpectations (small cars - (small cars - when fuel prices go up)when fuel prices go up)
Price and availability ofPrice and availability ofSubstitutesSubstitutes (“Uggs” v. “Fuggs”)(“Uggs” v. “Fuggs”)
ComplimentsCompliments (jam/jelly w/ PB)(jam/jelly w/ PB)
Let’s Practice!Let’s Practice!

Graphing a Graphing a ShiftShift in Demand in Demand(start w/ the basic graph)(start w/ the basic graph)
D2
D2

Graphing a Graphing a ShiftShift in in Demand Demand
The NEW Demand line is called the The NEW Demand line is called the Demand CurveDemand Curve. .
It is a graphic representation of demand!It is a graphic representation of demand!
That’s Right Folks That’s Right Folks – – it’s also a straight line! it’s also a straight line!

Graphing a Graphing a ShiftShift in Demand in Demand (show the new (show the new price/quantity)price/quantity)
Q2
D2
P2E2

Closer – Wed., 4/15Closer – Wed., 4/15Please note the following on your closer worksheet:Please note the following on your closer worksheet:
Things you learned todayThings you learned today
Ways you can use this material in the futureWays you can use this material in the future
Nugget of advise to future students in this classNugget of advise to future students in this class


Warm-up – Thurs. 4/16Warm-up – Thurs. 4/16
Explain your answerExplain your answer::
The price of The price of goldgold just went up! Is there just went up! Is there an increase or decrease in the …an increase or decrease in the …
supplysupply of gold rings? of gold rings?demanddemand for silver? for silver?

A QuickA QuickReminder!Reminder!
Everything we discuss today is Everything we discuss today is assuming we are in a PERFECT assuming we are in a PERFECT ECONOMIC WORLD! You also are ECONOMIC WORLD! You also are focused on the HERE AND NOW!focused on the HERE AND NOW!

Let’s Get Let’s Get GraphingGraphing
but two last things . . . but two last things . . .
Now that you’ve got the idea of supply, Now that you’ve got the idea of supply, demand and their determinants,demand and their determinants,

IntroducingIntroducing
I R D LI R D LHe will be your best friend!He will be your best friend!
Always remember his name so you Always remember his name so you know whether to shift right or leftknow whether to shift right or left(for either supply or demand). . .(for either supply or demand). . .

I R D LI R D L stands for stands for . . . . . .
IIncreasencreaseRRightightDDecreaseecreaseLLefteft
You always want to You always want to ask the ask the same series of same series of questionsquestions to help you to help you
understand the understand the information that you information that you
will be graphing.will be graphing.
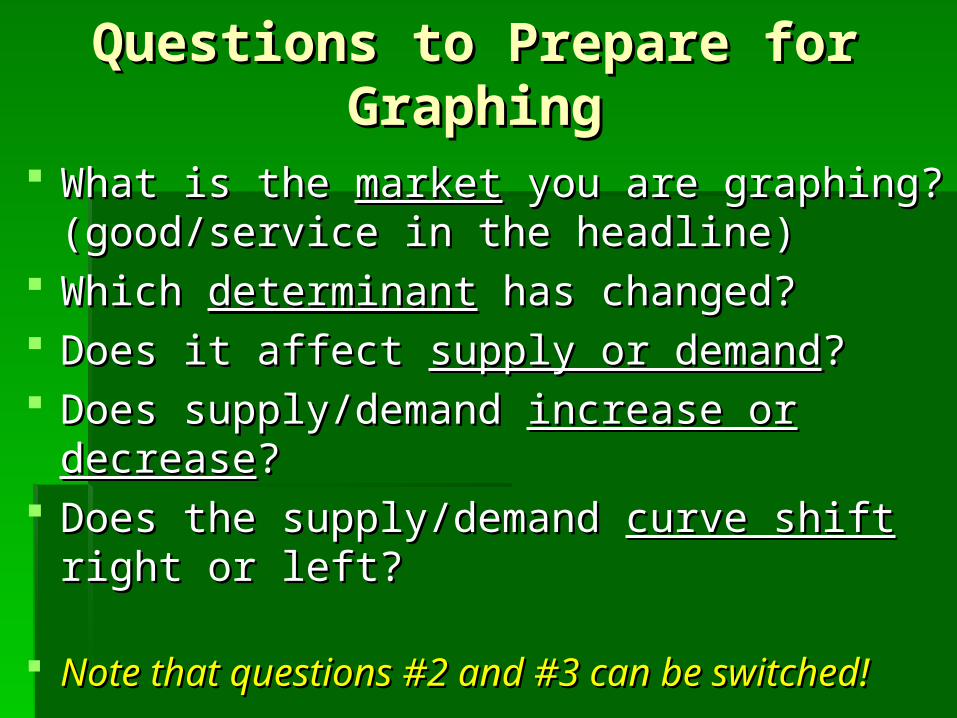
Questions to Prepare for Questions to Prepare for GraphingGraphing
What is the What is the marketmarket you are graphing? you are graphing? (good/service in the headline)(good/service in the headline)
Which Which determinantdeterminant has changed? has changed? Does it affect Does it affect supply or demandsupply or demand?? Does supply/demand Does supply/demand increase or decreaseincrease or decrease?? Does the supply/demand Does the supply/demand curve shiftcurve shift right or right or
left?left?
Note that questions #2 and #3 can be switched!Note that questions #2 and #3 can be switched!

Let’s Let’s Graph!Graph!
(white packet, p. 7)(white packet, p. 7)
Imagine you are reading a Imagine you are reading a newspaper and come across the newspaper and come across the
following headlines . . .following headlines . . .

Two Major Two Major Computer Computer
Manufacturers Manufacturers Build Five New Build Five New Factories – Factories – graph graph
computerscomputers

Two Major Computer Two Major Computer Manufacturers Build Five New Manufacturers Build Five New
FactoriesFactories What is the What is the marketmarket you are graphing? you are graphing? ComputersComputers Which Which determinantdeterminant has changed? has changed? Price and Availability of Price and Availability of CapitalCapital Does it affect Does it affect supply or demandsupply or demand?? SupplySupply Does supply Does supply increase or decreaseincrease or decrease?? Increase ↑Increase ↑ Does the supply Does the supply curve shiftcurve shift to the right or left? to the right or left? Right →Right →

SupplySupply of computers of computers increasesincreases because more because more factories are built.factories are built.
S2
P2
Q2
E2

Doctors announce Doctors announce benefits of eating benefits of eating ice ice
creamcream daily daily
Try AnotherTry Another

Doctors announce the benefits of Doctors announce the benefits of eating ice cream dailyeating ice cream daily
What is the What is the marketmarket you are graphing? you are graphing? Ice CreamIce Cream Which Which determinantdeterminant has changed? has changed? Taste and FadsTaste and Fads Does it affect Does it affect supply or demandsupply or demand?? DemandDemand Does demand Does demand increase or decreaseincrease or decrease?? Increase ↑Increase ↑ Does the demand Does the demand curve shiftcurve shift to the right or left? to the right or left? Right →Right →
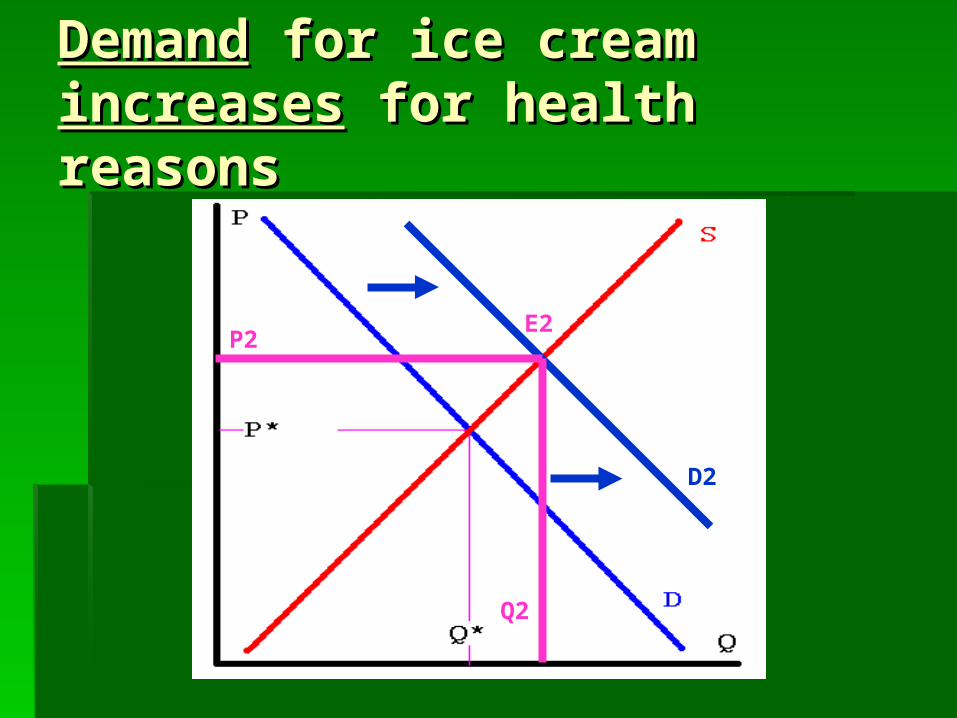
DemandDemand for ice cream for ice cream increasesincreases for health reasons for health reasons
Q2
D2
P2E2

Car Manufacturer Car Manufacturer Announces Plans for Announces Plans for SUVSUV Price Increase in Price Increase in
Two MonthsTwo Months
Here’s a Tricky OneHere’s a Tricky One

Don’t forget to ask the Don’t forget to ask the questions . . . questions . . .
What is the What is the marketmarket you are graphing? you are graphing? Which Which determinantdeterminant has changed? has changed? Does it affect Does it affect supply or demandsupply or demand?? Does supply/demand Does supply/demand increase or increase or
decreasedecrease?? Does the Does the curve shiftcurve shift to the right or left? to the right or left?

Demand for SUVs NOW!Demand for SUVs NOW!
Q2
D2
P2E2
Always read the Always read the headline for what headline for what it is it is right nowright now!!
Try not to read into it too much! Try not to read into it too much! Keep it simple!Keep it simple!

More Supply/Demand More Supply/Demand Practice GraphingPractice Graphing(yellow packet of graphs and other worksheets)(yellow packet of graphs and other worksheets)
Hmmmmmm . . . Hmmmmmm . . .
““The promise of his $20 The promise of his $20 allowance was enough allowance was enough incentiveincentive to get Bob to take out the trash.”to get Bob to take out the trash.”
What is an “incentive”?What is an “incentive”?What incentives are there for What incentives are there for
people to create new inventions?people to create new inventions?

Closer – Thurs., Closer – Thurs., 4/164/16““The promise of his $20 The promise of his $20
allowance was enough allowance was enough incentiveincentive to get Bob to take out the to get Bob to take out the
trash.”trash.”
Please write the following questions in your Please write the following questions in your notebook and answer:notebook and answer:
What is an “incentive”?What incentives are there for
people to create new inventions?

Closer – Thurs., 4/16Closer – Thurs., 4/16 Write the following statement on your sheet. Fill-in the blanks with Write the following statement on your sheet. Fill-in the blanks with
your own idea or ideas. Be ready to share!your own idea or ideas. Be ready to share!
Graphing Supply and Demand is _____________, Graphing Supply and Demand is _____________, because _______________________. because _______________________.
Graphing Supply and Demand is Graphing Supply and Demand is not as hard as I thought it would not as hard as I thought it would bebe, because , because Mrs. Parker taught me all the steps to do it well and I Mrs. Parker taught me all the steps to do it well and I paid attention!paid attention!


Toyota unveils new car that gets 97 mpg!

Don’t forget to ask the questions!
• What is the market you are graphing?
• Which determinant has changed?
• Does it affect supply or demand?
• Does supply/demand increase or decrease?
• Does the supply/demand curve shift to the right or left?

Demand increases for Toyotas with great gas mileage
P2
Q2
D2

Protected Owls Discovered in Lumber
Forest! Companies told to
discontinue logging.

Don’t forget to ask the questions!
• What is the market you are graphing?
• Does it deal with Supply or Demand?
• Does supply increase or decrease?
• Does the supply curve shift to the right or left?

Supply of lumber (logging) decreases due to protection of owls
S2
P2
Q2


![Easter 4 [2015]](https://static.fdocuments.net/doc/165x107/579054951a28ab900c91399f/easter-4-2015.jpg)