WARM UP AND PRESENTATION DEVICES EXPERIMENTED IN...
30
Statistica Applicata - Italian Journal of Applied Statistics Vol. 28 (1) 43 WARM UP AND PRESENTATION DEVICES EXPERIMENTED IN A CONJOINT-CHOICE SURVEY ON PREFERENCES FOR JOBS Luigi Fabbris, Francesca Miari and Manuela Scioni Statistics Department, University of Padua Abstract. We embedded a multifactorial experiment into a survey designed to collect data from graduates about the criteria they adopt while choosing a job opportunity. The experimental procedure consisted of three interconnected experiments: (a) a first one aimed to test how to ‘warm up’ respondents before starting a conjoint measurement exercise; (b) a second one to contrast two different choice procedures: the ‘conjoint choice’ of one job from a set of offered ones versus the choice of the mostly appealing attribute of each of them, and (c) another experiment to infer the optimum size of the job choice set. Jobs were portrayed through a sample of two-through-six attribute levels randomly selected from a set of dichotomous attributes. The experiment was administered to 7,102 Padua University graduates, out of which 3,628 completed the questionnaire. The experiments showed that respondents have to be ‘warmed’ with soft questions, that in a conjoint exercise the choice of a job from a set seems to respondents more realistic than pinpointing a significant feature that describes it, and finally that presenting a number of three or four job opportunities at a time makes it the choice more plausible than either two or six jobs. Keywords: Conjoint analysis; Factorial experiment; Respondent warm up; Choice strategy; Choice set size; Survey on graduates 1. INTRODUCTION In the following we present and discuss the results of a multifactorial statistical experiment carried out on a sample of graduates in order to enhance the data collection methodology of surveys conducted with a choice based conjoint (CBC) approach through a computer assisted questionnaire. The term conjoint measurement (Luce and Tukey, 1964; Tversky, 1967; Green and Rao, 1971) involves various techniques aimed to elicit people’s preferences by asking them to jointly evaluate two or more alternatives, instead of assessing their individual aspects, within a hypothetical context. It is widely applied in business, market research, transportation, environment, health and social decision making, and in all domains in which one wishes to elicit the preferences from
Transcript of WARM UP AND PRESENTATION DEVICES EXPERIMENTED IN...
Statistica Applicata - Italian Journal of Applied Statistics Vol. 28 (1) 43
WARM UP AND PRESENTATION DEVICES EXPERIMENTED INA CONJOINT-CHOICE SURVEY ON PREFERENCES FOR JOBS
Luigi Fabbris, Francesca Miari and Manuela Scioni
Statistics Department, University of Padua
Abstract. We embedded a multifactorial experiment into a survey designed to collect datafrom graduates about the criteria they adopt while choosing a job opportunity. Theexperimental procedure consisted of three interconnected experiments: (a) a first oneaimed to test how to ‘warm up’ respondents before starting a conjoint measurementexercise; (b) a second one to contrast two different choice procedures: the ‘conjoint choice’of one job from a set of offered ones versus the choice of the mostly appealing attribute ofeach of them, and (c) another experiment to infer the optimum size of the job choice set. Jobswere portrayed through a sample of two-through-six attribute levels randomly selectedfrom a set of dichotomous attributes. The experiment was administered to 7,102 PaduaUniversity graduates, out of which 3,628 completed the questionnaire. The experimentsshowed that respondents have to be ‘warmed’ with soft questions, that in a conjoint exercisethe choice of a job from a set seems to respondents more realistic than pinpointing asignificant feature that describes it, and finally that presenting a number of three or fourjob opportunities at a time makes it the choice more plausible than either two or six jobs.
Keywords: Conjoint analysis; Factorial experiment; Respondent warm up; Choice strategy;Choice set size; Survey on graduates
1. INTRODUCTION
In the following we present and discuss the results of a multifactorial statisticalexperiment carried out on a sample of graduates in order to enhance the datacollection methodology of surveys conducted with a choice based conjoint (CBC)approach through a computer assisted questionnaire.
The term conjoint measurement (Luce and Tukey, 1964; Tversky, 1967;Green and Rao, 1971) involves various techniques aimed to elicit people’s preferencesby asking them to jointly evaluate two or more alternatives, instead of assessingtheir individual aspects, within a hypothetical context. It is widely applied inbusiness, market research, transportation, environment, health and social decisionmaking, and in all domains in which one wishes to elicit the preferences from
44 Fabbris L., Miari F. and Scioni M.
citizens, customers or experts by either choosing among – or estimating trade-offsbetween – pertinent alternatives (see the references in Huber, 1997; SawtoothSoftware Inc., 1993-2013; Green et al., 2001; Gustafsson et al., 2003; Hainmuelleret al., 2013). Some choice experiments concern graduate recruitment and jobsearch processes (Logan, 1996; Douglas and Shepherd, 2002; Villosio, 2011;Humburg and Van der Velden, 2014)
Factorial experiments are widely used to infer about the optimum strategiesfor data collection in surveys, since it is possible to suggest a new technique onlyafter testing its effectiveness in obtaining more and better answers from the targetpopulation (Wallander, 2009).
We embedded our experiment into a survey on the elicitation of fresh-graduates’ preferences for possible jobs. The survey was carried out through aCAWI – Computer Assisted Web-based Interviewing – questionnaire conveyedthrough an email, with four recalls every two-three weeks. The survey is part of alarger research, whose acronym PETERE stands for Preferences for Employmentand Training as Elected by REcent graduates. In this paper, we will deal with thecontents of the survey as much as needed to make the outcomes of the experimentsensible.
Formally, a random sample of n’=7,102 graduates was drawn from thepopulation of Padua University students graduated in 2015. Sample units werecontacted by an email containing a link to an electronic questionnaire and n= 3,628graduates (51.1% of the contacted ones) opened it. Respondents had to completethe questionnaire alone, through their own computer, in their own time. This samplesize may support inference far better than the bottom limit stated in Amemiya(1981) of 30 sample units per experimental cell, a rule of thumb larger thananalogous ones proposed in Pearmain et al (1991) and Lancsar and Louviere(2008). The design of the experiment will be described in detail in Section 2.
The conjoint choice scenario was designed as follows: the possible jobs aboutwhich graduates were asked to express their preferences have been defined bycombining nine attributes that recur in job ads fostered by media. The attributes andtheir levels have been defined through topical research experience (Fabbris, 2012)and focus groups with academic experts. Pre-testing the topical questions andpiloting of the basic questionnaire were carefully done both in paper and inelectronic format1. So, with regard to survey aims, the selected attributes can beassumed to exhaust the salient beliefs of graduates about the choice of a job.
1 The risks related to the exclusion of relevant attributes are discussed, among the others, inSanbonmatsu et al. (2003) and Islam et al. (2007).
Warm up and presentation devices experimented in a conjoint-choice survey… 45
Since nine attributes at a time are too fatiguing to manage for respondents2,the possible jobs were defined through random sampling of the attribute levelsaccording to a fractional (factorial) experiment, a popular praxis in conjointmeasurement3 in particular for tasks designed for computer-assisted questionnaires.As a matter of fact, a full factorial design being unaffordable, we sampled theattribute levels and the possible jobs in a way that ensured the achievement of thestatistical conclusions as if a full design was applied. Moreover, respondents areassumed familiar with the attributes. So, given the random selection of the jobs’descriptors, all respondents can be assumed to be equally informative of theexperimental issues.
The rest of the paper is organised as follows: the main results of the experimentare described in Sections 3 and 4, in which both the quantity and quality ofresponses will be evaluated with respect to the experimental factors, the discussionand comparison of our outcomes with the literature are presented in Section 5 andthe conclusion in Section 6.
2. THE EXPERIMENTAL DESIGN
In the following we deal with methodological problems related to the plausibility,the efficiency and the effectiveness of preference elicitation through conjointmeasurement. We conjectured different ways of realising a conjoint exercise anddesigned a full factorial experiment to ascertain which data collection modes mayimprove the research setting. The experiment was designed to test the followinghypotheses:1. Is it worth ‘warming up’ respondents before a complex conjoint exercise and, if
so, how should we? Warming up respondents means announcing them that theyshould prepare themselves to face an uncommon task.
2. In a conjoint-choice environment, is it more convenient pinpointing a job froma basket of job opportunities and then eliciting its most qualifying characteristic,or directly selecting from a given set of characteristics those that qualify a
2 Scholars agree not to risk an information overload (Miller, 1956; Green and Srinivasan, 1978;Acito, 1979; Thomas, 1989). Malhotra et al. (1982) and Malhotra (1984) state, instead, thatrespondents are capable of processing ten attributes at a time without excessive strain andsustain that the more you interact with the interviewee and raise her interest the more positiveare the effects on survey results.
3 Louviere and Hensher (1983) is the seminal paper after which the preference experimentswere incorporated into choice exercises. For a survey of the literature, see Johnson et al.(2013).

46 Fabbris L., Miari F. and Scioni M.
preferred job? In other words, if one wishes eliciting job preferences from apopulation, is it methodologically preferable selecting a job as described by itsattributes or pinpointing the attributes that best describe respondents’ preferencesas regard jobs? Kuhfeld (2010a; 2010b) names ‘purely generic study’ the lattermode in which respondents evaluate just a bundle of attributes, as opposed toa ‘brand choice study’ in which the evaluated alternatives are, althoughhypothetical, conjoint units. Others (see the references quoted in Bettman et al.,1998) name the two strategies attribute-based and alternative-based, respectively.
2. Which is the ideal number of alternatives to submit in a conjoint-choice exercisefor the respondents to efficiently select their preferred jobs, and why?
From now on, we will refer to the three experimental factors as ‘respondentwarm up’, ‘choice strategy’, and ‘choice set size’, respectively.
Warm-up questions are supposed to be relevant when respondents needconcentration to achieve the survey tasks, recall from memory and evaluate thealternatives, and assemble a likely answer. It is to be highlighted that most graduatesat hand never worked and needed to guess what a job, presented in terms of fewattributes, was on about before expressing their preferences. The literature (seeJohnson and Orme, 1996; McCullough, 2002; Helm et al., 2011) states thatresponse reliability improves after respondents have done some related tasks. Infact, the longer you dialogue with respondents, the sooner they might endorseresearch objectives, ‘learn’ meanings and spend time evaluating the options. So, ifone wishes respondents to be aware since their first choice, a broad anticipation ofcontents is needed.
We defined four alternative questions for warming up respondents before theconjoint exercise: all questions started with a common sentence: ‘We are going toask you to evaluate some job opportunities you could be offered’; the additionalsentences that identify the four ‘warming’ formats were as follows:
1A) ‘No warm up’, namely just a basic sentence was added to the above: ‘Jobs willbe described by some attributes, similar to job ads or to offers after a job interview:tenure, closeness to home, type of activity, working conditions, and possiblerewards’. This mode represents the null hypothesis.
1B) Warming up through the more favourable levels of each job attribute (side A ofTable 1). The additional sentence was: ‘Before you evaluate them, would you pleasestate how much each of the following characteristics is important to you? [Verymuch, Fairly, Barely or Not at all]’. Appointed respondents had to read all the‘positive’ levels of the nine attributes.
Warm up and presentation devices experimented in a conjoint-choice survey… 47
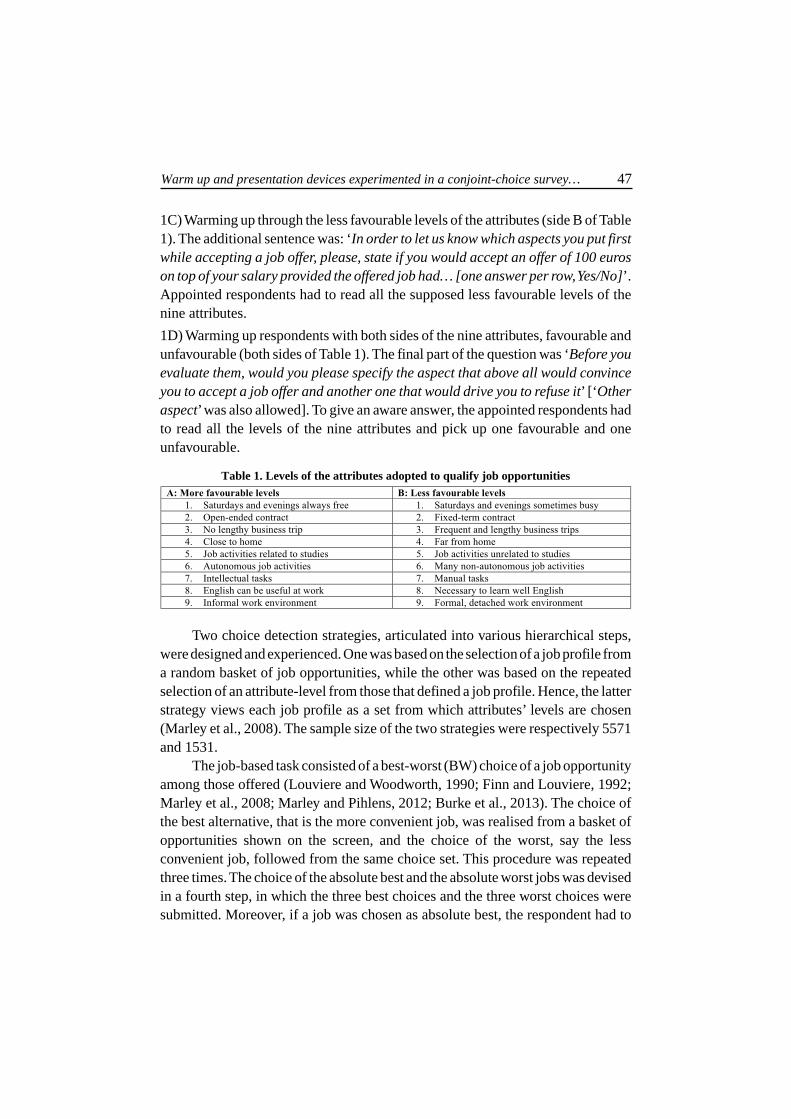
1C) Warming up through the less favourable levels of the attributes (side B of Table1). The additional sentence was: ‘In order to let us know which aspects you put firstwhile accepting a job offer, please, state if you would accept an offer of 100 euroson top of your salary provided the offered job had… [one answer per row, Yes/No]’.Appointed respondents had to read all the supposed less favourable levels of thenine attributes.
1D) Warming up respondents with both sides of the nine attributes, favourable andunfavourable (both sides of Table 1). The final part of the question was ‘Before youevaluate them, would you please specify the aspect that above all would convinceyou to accept a job offer and another one that would drive you to refuse it’ [‘Otheraspect’ was also allowed]. To give an aware answer, the appointed respondents hadto read all the levels of the nine attributes and pick up one favourable and oneunfavourable.
Two choice detection strategies, articulated into various hierarchical steps,were designed and experienced. One was based on the selection of a job profile froma random basket of job opportunities, while the other was based on the repeatedselection of an attribute-level from those that defined a job profile. Hence, the latterstrategy views each job profile as a set from which attributes’ levels are chosen(Marley et al., 2008). The sample size of the two strategies were respectively 5571and 1531.
The job-based task consisted of a best-worst (BW) choice of a job opportunityamong those offered (Louviere and Woodworth, 1990; Finn and Louviere, 1992;Marley et al., 2008; Marley and Pihlens, 2012; Burke et al., 2013). The choice ofthe best alternative, that is the more convenient job, was realised from a basket ofopportunities shown on the screen, and the choice of the worst, say the lessconvenient job, followed from the same choice set. This procedure was repeatedthree times. The choice of the absolute best and the absolute worst jobs was devisedin a fourth step, in which the three best choices and the three worst choices weresubmitted. Moreover, if a job was chosen as absolute best, the respondent had to
A: More favourable levels B: Less favourable levels
1. Saturdays and evenings always free 1. Saturdays and evenings sometimes busy
2. Open-ended contract 2. Fixed-term contract
3. No lengthy business trip 3. Frequent and lengthy business trips
4. Close to home 4. Far from home
5. Job activities related to studies 5. Job activities unrelated to studies
6. Autonomous job activities 6. Many non-autonomous job activities
7. Intellectual tasks 7. Manual tasks
8. English can be useful at work 8. Necessary to learn well English
9. Informal work environment 9. Formal, detached work environment
Table 1. Levels of the attributes adopted to qualify job opportunities

48 Fabbris L., Miari F. and Scioni M.
pinpoint the more convenient attribute among those that defined that job. In parallel,the more non-convenient attribute had to be selected among those that qualified theabsolute worst job.
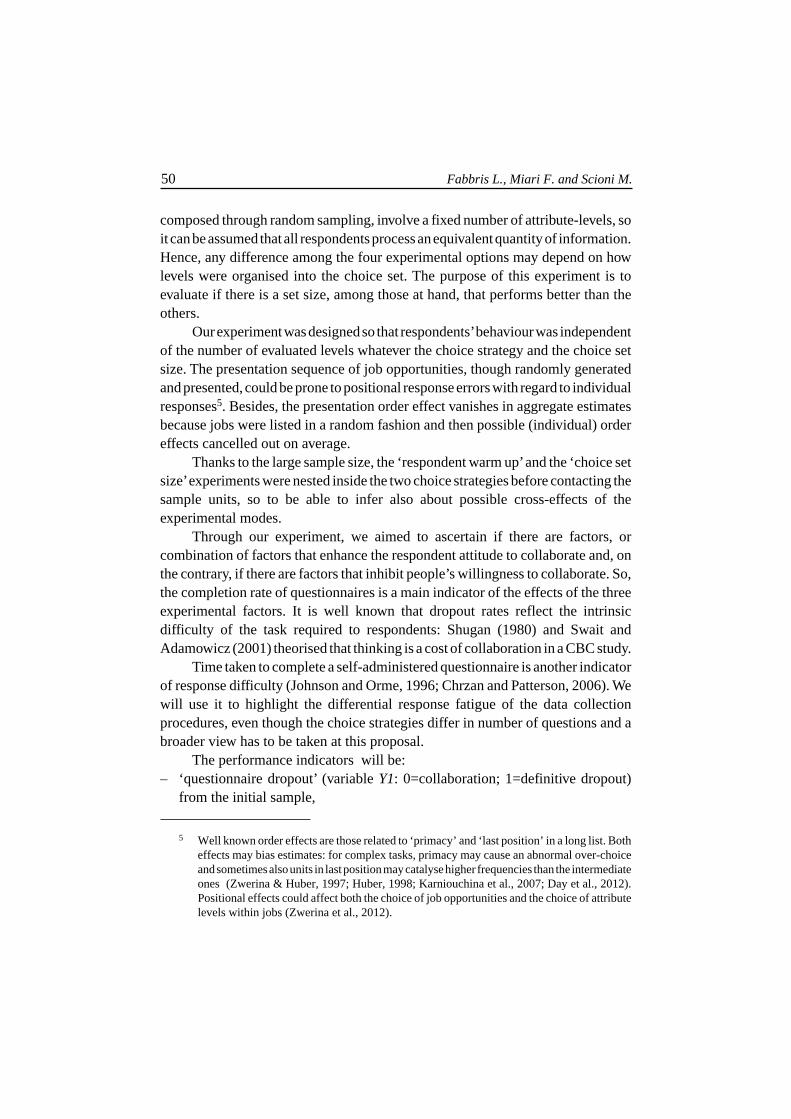
At the end of the procedure the respondent had to state if the job pinpointed asabsolute best was close enough to her ideal job to accept it. Similarly, the respondentwas asked to state if the option selected as absolute worst was far enough from ideal torefuse it. The job-based choice procedure is schematised in Figure 1, side A.
Figure 1. Task procedure of the two experimental choice designs
The choice sets for the attribute-based experiment appeared on the computerscreen of respondents in the same way as the job-based one, but tasks required torespondents were very different. For the attribute-based, each respondent was askedto choose two attributes (one best and one worst) of each job belonging to a choiceset. For instance, suppose the attribute-based procedure was applied to a choice setcomposed of four jobs qualified by three attributes. The respondent had to selecttwo attributes (one best and one worst) from each of the three descriptors of eachjob opportunity and then choose the best of the four best attributes and, analogously,the worst of the four worst attributes within any choice set. This procedure had tobe repeated three times with different choice sets and, finally, the absolute best of

Warm up and presentation devices experimented in a conjoint-choice survey… 49
the best attributes and the absolute worst of the worst attributes were chosen. Alsoin this case, the respondent was asked if her ideal job was well represented by thecharacteristic selected as ‘absolute’ best and if she would refuse a job having thecharacteristic selected as ‘absolute’ worst (see Figure 1, side B).
Finally, the experimental factor concerned with the size of the choice sets wasarticulated as follows.– At each choice round, a fixed number, h, of jobs was exhibited to respondents;
each job was defined by a fixed number, k, of attributes. The number of jobs ina task was either 2, 3, 4 or 6; the tasks were administered to respondents in arandom fashion so to obtain three random subsamples of equal size.
– The number of attribute levels shown to each respondent at each of the threechoice rounds was kept fixed at 12 (h*k = 12). So, both h and k assume the values2, 3, 4 and 6 in a reciprocal relation (h = 12 / k). This way, the choice tasks areindependent of the overall number of evaluated levels in the three rounds andeven the ultimate choice among partial choices –performed over a constant (3*k)number of attribute levels– does not depend on the number of attribute-levelsshown to respondents.
– Alternatives were defined by sampling the attribute levels from the ninedichotomous job descriptors. The process through which the alternatives werecreated and then randomized defines a fractional factorial experiment fullyindependent of the subject dealt with in this paper. In fact, for the choice setsdefinition, jobs were created by random sampling of attribute-levels, sets wereobtained randomly aggregating jobs and finally jobs were shown in a randomorder on the computer screen.
In the literature there is no definite agreement on the optimum number ofalternatives in a choice set and on the number of attributes that best qualify analternative, though both these numbers have to be low in practice because morecomplex tasks may decrease response quality and quantity4. In our case, all tasks,
4 Green and Srinivasan (1990), Pearmain et al (1991) and Bettman et al. (1998) suggest unupper limit of six or seven attributes. The upper limit should be even lower if some attributesare unfamiliar to or complex to figure out by respondents but could be larger in morefavourable circumstances (Sawtooth Software Inc, 1993-2013). The larger the choice set andthe number of attribute levels in a task, the larger the risk of superficial answers and ofinterrupting or deferring the interview (Tversky and Shafir, 1992; Steenkamp and Wittink,1994; DeShazo and Fermo, 2002; Hensher, 2006). The limit has to be lower if respondentshave problems of health or cognitive impairments or linguistic limitations. It is immediatealso that the upper bound tends to be lower with people whose available time for respondingis limited or the interview conditions are precarious. Moreover, a self-administeredquestionnaire might have an upper bound lower than an interviewer-administered datacollection mode.
50 Fabbris L., Miari F. and Scioni M.
composed through random sampling, involve a fixed number of attribute-levels, soit can be assumed that all respondents process an equivalent quantity of information.Hence, any difference among the four experimental options may depend on howlevels were organised into the choice set. The purpose of this experiment is toevaluate if there is a set size, among those at hand, that performs better than theothers.
Our experiment was designed so that respondents’ behaviour was independentof the number of evaluated levels whatever the choice strategy and the choice setsize. The presentation sequence of job opportunities, though randomly generatedand presented, could be prone to positional response errors with regard to individualresponses5. Besides, the presentation order effect vanishes in aggregate estimatesbecause jobs were listed in a random fashion and then possible (individual) ordereffects cancelled out on average.
Thanks to the large sample size, the ‘respondent warm up’ and the ‘choice setsize’ experiments were nested inside the two choice strategies before contacting thesample units, so to be able to infer also about possible cross-effects of theexperimental modes.
Through our experiment, we aimed to ascertain if there are factors, orcombination of factors that enhance the respondent attitude to collaborate and, onthe contrary, if there are factors that inhibit people’s willingness to collaborate. So,the completion rate of questionnaires is a main indicator of the effects of the threeexperimental factors. It is well known that dropout rates reflect the intrinsicdifficulty of the task required to respondents: Shugan (1980) and Swait andAdamowicz (2001) theorised that thinking is a cost of collaboration in a CBC study.
Time taken to complete a self-administered questionnaire is another indicatorof response difficulty (Johnson and Orme, 1996; Chrzan and Patterson, 2006). Wewill use it to highlight the differential response fatigue of the data collectionprocedures, even though the choice strategies differ in number of questions and abroader view has to be taken at this proposal.
The performance indicators will be:– ‘questionnaire dropout’ (variable Y1: 0=collaboration; 1=definitive dropout)
from the initial sample,
5 Well known order effects are those related to ‘primacy’ and ‘last position’ in a long list. Botheffects may bias estimates: for complex tasks, primacy may cause an abnormal over-choiceand sometimes also units in last position may catalyse higher frequencies than the intermediateones (Zwerina & Huber, 1997; Huber, 1998; Karniouchina et al., 2007; Day et al., 2012).Positional effects could affect both the choice of job opportunities and the choice of attributelevels within jobs (Zwerina et al., 2012).
Warm up and presentation devices experimented in a conjoint-choice survey… 51
– ‘response break off’ (variable‘Y2: 0=completion; 1=break off),
– ‘proportion of valid responses’ after standardisation (Y3) on a quantitative scale,
– ‘completion time’ (Y4) on a quantitative scale,
– ‘positive attitudes towards the filled in questionnaire’ that involved four variableson a 10-point interval scale (Y5: ‘interesting’; Y6: ‘clear’; Y7: ‘easy to answer’;Y8: ‘annoying or stressing’), and
– ‘distance from the ideal job’ (Y9), a dichotomous variable computed with thefollowing levels: 1 (chosen job is close to ideal) and 0 (job far from ideal).
The latter indicator reveals which choice procedure more than others detectedif the respondent’s preferred job was close to ideal. This purpose is relevant for theanalysis of preferences/utilities because it evokes the concept of ‘willingness toaccept’ a job (see also Diamond and Hausman, 1994; McFadden, 1994; McCullough,2002). For our aims, the closeness between selected and ideal jobs is an indicatorof design convenience. As a matter of fact, designs that drive the respondents’choices closer to her ideal position can be considered more appropriate than others.
Finally, we are interested in detecting if one or more experimental modesbiased the obtained responses. Since it is not possible to validate responses with‘true’ data, we will infer about response quality by evaluating the consistency of thecollected data through the experimental modes (see also Elrod, 2001; Swait &Adamowicz, 2001; Bech et al., 2007).
3. RESULTS OF THE EXPERIMENTS
The performance indicators described in Section 2 are now analysed in relation toeach experimental factor. The indicators are described in Section 3.1 and theanalysis of the experimental performances are described in Sections 3.2 through 3.4as for the warm up, the choice strategy and the choice set size, respectively.
3.1 STUDY OF PERFORMANCE INDICATORS
The indicators of the effects of the three experiments are presented in Tables 2 to9. It can be immediately perceived that experimental modes do not influencenotably the respondents’ participation at the survey. The largest range of the breakoff rate as caused by the experimental modes is lower than 3.5% and the mediantimes for questionnaire completion differ to each other by less than one and a halfminute. The main reason is that the overall efficiency of the questionnaire, giventhat more than 90% of respondents completed the questionnaire once they open it,leaved narrow room for improvement. So, even small improvements in participationinduced by a data collection mode should be appraised.

52 Fabbris L., Miari F. and Scioni M.
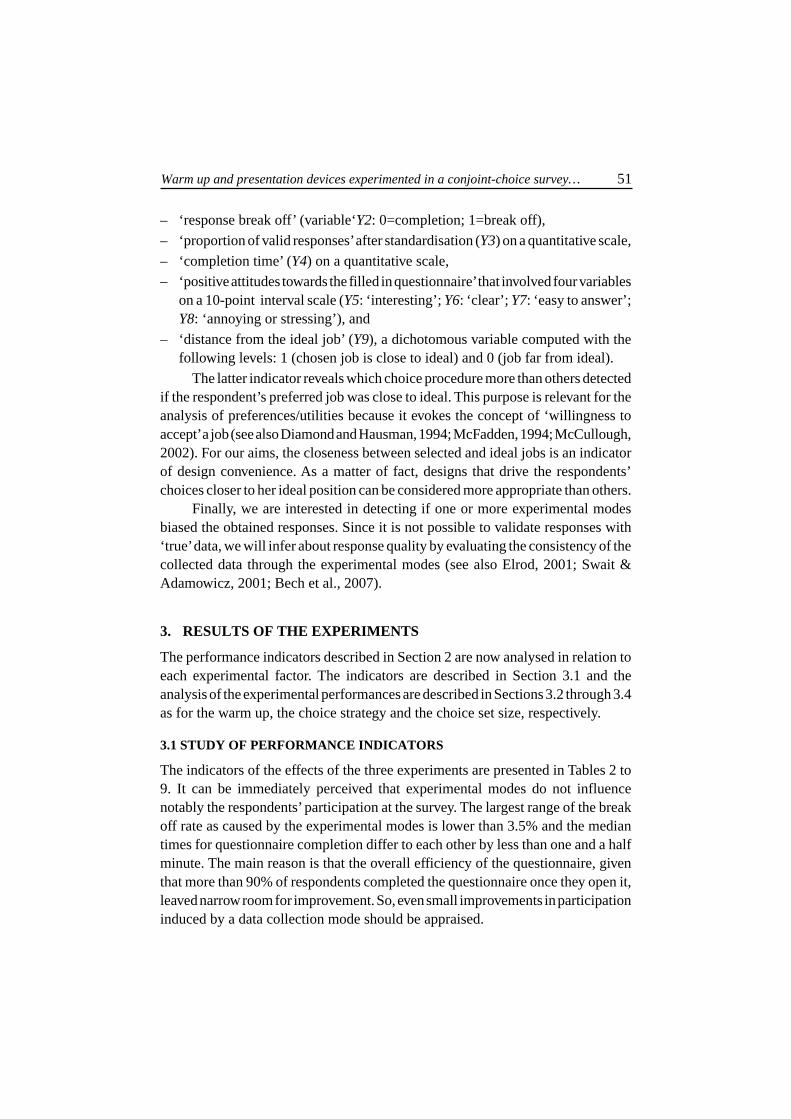
The distribution of time taken to fill in the questionnaire is presented in Figure2. Time can be considered the mixture of two right tailed distributions, one, smaller,with a mode at zero and the other with a mode close to the median. The former oneis the distribution of graduates who open the electronic questionnaire and close itbefore going to the second page. These people do not go through the conjointexercise. The latter distribution is that of respondents who close with a certain timevariability the questionnaire. Some of them completed the questionnaire in morethan one occasion and this lengthened the overall time. For this reason we will usethe median, instead of the mean time to evaluate the differences between experi-mental modes.
Figure 2. Time taken by respondents to complete the questionnaire (n=3232)
The differences are larger if the perception of questionnaire quality isconsidered: differences between perceived clarity or easiness can amount to 7 or8%. These indicators will be used to corroborate the experimental results assumingthe respondents’ viewpoints.
It is to be highlighted that jobs selected at the end of a job-based choiceprocedure are close to ideal in more than 90% of cases. Besides, no experimentalmode, nor a combination of experimental modes has led the choice of a job closeto ideal in less than 83% of cases (Miari, 2015).
Another general consideration stems from our analysis: no experimentalmode affected the chance of opening the electronic questionnaire. This is ratherobvious because graduates could not know about the experiment before opening thequestionnaire, nevertheless it is comforting that the data showed what expected.
Warm up and presentation devices experimented in a conjoint-choice survey… 53
3.2 WARM UP OUTCOMES
We analysed the relationships between the warm up modes and the outcomeindicators (Table 2) and carried out a series of multivariate regression analyses toexplain the break off rate (Table 3), the proportion of valid responses (Table 4), thequestionnaire completion rate (Table 5), the respondents’ perception of questionnairequality (Table 6) and the closeness between the estimated job preferences and theideal job (Table 7) using the experimental modes as predictors. The analyses revealthat warm up questions are somewhat relevant to respondents, but the way peopleare warmed up may originate differently oriented reactions.– Positively-oriented questions favoured a larger response rate than the neutral
mode, whatever the choice strategy and even within the respondents’ groupswith higher propensity to respond. In fact, as presented in Table 4, if the choicequestions were anticipated by a simple and positively-oriented question, themean number of obtained responses was significantly higher than the neutralmode. This happened both in case the regression model involved just theexperimental variables and when individual graduates’ characteristics wereallowed to enter the model. These characteristics are: the degree major, withengineers giving less responses than graduates of other disciplines, the degreelevel, with respondents with a Master degree having a higher propensity torespond than Bachelors’, and graduates who did not work at graduation beingmore keen to collaborate to the survey. The relevance of the positive orientationas a warming mode can be measured by the high rate of explained deviance,which is 3.1% of the total deviance.
– The effect of a doubly-oriented question as a warm up device is totally different.All the computed indicators were not significant or showed a negative, significanthint that respondents perceived the question as stressing, employed significantlymore time to complete the questionnaire and chose a job that was far from ideal.
– The null mode, the one that led respondents straight to the choice questions,showed worse returns in terms of response rate but the best evaluation in termsof clarity, ease of responding and low stress and also induced respondents tochoose jobs closer to ideal than the other options.
– The only irrelevant mode for warming up respondents was the question basedon unfavourable job attributes, which showed quantitative returns and levels offavour from respondents similar to the no-warm mode. It is to be reminded,though, that this question was designed in an uncommon way: respondents havebeen asked to evaluate attributes one by one stating if they would accept a jobwith a possibly-negative attribute whether they were offered 100 euro on top oftheir salary. So, we are not allowed to state if the lower involvement of graduates

54 Fabbris L., Miari F. and Scioni M.
with such a warm up strategy depended on the negativity of the attribute-levelsor on the bewilderment caused by a question eventually perceived as odd bygraduates.
Indicator Warm-up modes Signific
ance None Positive Negative Both
1. Questionnaire dropout rate (a) 49.8 51.3 51.6 51.7
2. Break off rate (b) 11.5 10.4 11.2 9.4
3. Proportion valid responses (b) 91.3 92.8 92.2 92.7
4. Median completion time (b) 19.2 20.2 19.9 20.8 *
5. % interesting © 55.9 55.7 52.9 55.4
6. % clear © 71.0 69.6 68.8 69.0
7. % easy to answer © 82.0 80.9 81.0 80.2
8. % annoying/stressing© 27.7 31.6 30.5 33.0
9. % choice close to ideal (d) 90.6 90.0 89.0 87.3
Significance levels: *: <5%; **: <1%; ***: <1%o; Sample sizes: a: 7102; b: 3628; c=3174; d=3332
Table 2. Indicators of experimental effects of warming-up respondents
Table 3. Logistic (stepwise) regression of response break off (n=3,628)
Significance levels: *: <5%; **: <1%; ***: <1%o;
Only experimental variables Experimental variables and respondent’s
attributes
Parameter Estimate s.e. Significance Estimate s.e. Significance
Intercept -1.887 0.108 *** -2.189 0.133 ***
Choice set size: 3 vs. 2 -0.310 0.153 * -0.335 0.173
4 vs. 2 -0.348 0.152 * -0.272 0.169
6 vs. 2 -0.161 0.150 -0.092 0.167
Master degree vs. Bach = = = -0.500 0.138 ***
Worked at graduation = = = 0.579 0.122 ***
Pseudo R2 = 0.0018; Rescaled R
2 = 0.0035;
AIC=2503.4; BIC=2527.8
Pseudo R2 = 0.011; Rescaled R
2 = 0.025;
AIC=2108.7; BIC=2145.7
Table 4. OLS (stepwise) regression of proportion of valid responses (n=3,628)
Significance levels: *: <5%; **: <1%; ***: <1%o;
Only experimental variables Experimental variables and respondent’s
attributes
Parameter Estimate s.e. Significance Estimate s.e. Significance
Intercept 4.225 0.077 *** 3.886 0.113 ***
Warm up: favourable 0.296 0.105 *** 0.306 0.105 ***
unfavourable 0.078 0.106 0.090 0.106
both fav. & unf. 0.150 0.106 0.150 0.105
Choice strategy: attribute-
based
-0.952 0.091 *** -0.966 0.092 ***
Science vs. Engineering = = = 0.393 0.163 *
Life sciences vs. Engin = = = 0.413 0.110 ***
Social sciences vs. Engin = = = 0.337 0.109 ***
Humanities vs. Engin = = = 0.365 0.127 ***
Master degree vs. Bach = = = 0.262 0.080 ***
Worker at graduation = = = -0.190 0.084 *
R2 = 0.0325; Adjusted R
2 = 0.0314;
AIC=8980.0; BIC=5499.0
R2 = 0.0408; Adjusted R
2 = 0.0381;
AIC=8961.9; BIC=5481.0

Warm up and presentation devices experimented in a conjoint-choice survey… 55
Significance levels: *: <5%; **: <1%; ***: <1%o
Only experimental variables Experimental variables and
respondent’s attributes
Parameter Estimate s.e. Signific. Estimate s.e. Signific.
Intercept 20.177 0.509 *** 21.747 0.541 ***
Warm up: favourable levels 0.830 0.508 0.776 0.496
unfavourable levels 0.381 0.512 0.339 0.500
both favourable & unfav 1.721 0.512 *** 1.708 0.500 ***
Choice set size: 3 vs. 2 1.297 0.531 * 1.140 0.521 *
4 vs. 2 1.061 0.526 * 0.632 0.517
6 vs. 2 0.806 0.537 0.514 0.526
Male vs. Female = = = -1.206 0.364 ***
Grade: ≥ 100/110 vs. ≤ 87 = = = -1.149 0.376 ***
88-99 vs. ≤ 87 = = = 21.747 0.541 ***
R2 = 0.0052; Adjusted R
2 = 0.0035;
AIC=20885; BIC=17267
R2 = 0.0112; Adjusted R
2 = 0.0090;
AIC=20189; BIC=16649
Table 5. OLS (stepwise) regression of completion time (n=3,628)
Table 6. OLS (stepwise) regression of interest, clarity, ease and anxiety from questionnaireas perceived by respondents (n=3,174; both experimental and respondents’
characteristics are allowed in the models)
Significance levels: *: <5%; **: <1%; ***: <1%o;
Interest Clarity Ease Anxiety
Intercept 5.472*** 6.303*** 7.435*** 3.912***
Warm up: favourable levels 0.248
unfavourable levels 0.067
both favourable & unfavourable 0.411**
Choice strategy: attribute-based -0.238* -0.372*** -0.369***
Science vs. Engineering 0.344* 0.168 -0.001
Life sciences vs. Engineering 0.298* 0.140 -0.190
Social sciences vs. Engineering 0.238* 0.237* -0.444**
Humanities vs. Engineering 0.374** 0.386** -0.214
Grade: ≥ 100 / 110 vs. ≤ 87 -0.365* 0.520**
88-99 / 110 vs. ≤ 87 -0.409* 0.265
Master degree vs. Bachelor -0.266**
Worker at graduation vs. Not working -0.295**
R2 (just experimental modes) = 0.0014 0.0045 0.0053 0.0036
R2 (experimental + personal variables) = = 0.0075 0.0097 0.0152
Table 7. Logistic (stepwise) regression of close-to-ideal choice using experimental modes aspredictors6 (n=3332)
Significance levels: *: <5%; **: <1%; ***: <1%o;
Estimate s.e. Significance
Intercept 1.991 0.153 ***
Warm up: favourable attribute-levels -0.052 0.167
unfavourable attribute-levels -0.206 0.165
both favourable & unfavourable -0.358 0.160 **
Choice strategy: attribute-based -0.821 0.125 ***
Choice set size: 3 vs. 2 0.648 0.160 ***
4 vs. 2 0.590 0.156 ***
6 vs. 2 0.730 0.165 ***
Pseudo R2 = 0.0187; Rescaled R
2 = 0.0377; AIC=2230.8;
BIC=2279.7
6 As for the other performance indicators, we allowed for the respondents’ attributes to enterthe model, but no attribute resulted significant.
56 Fabbris L., Miari F. and Scioni M.
3.3 CHOICE STRATEGY OUTCOMES
Almost all the performance indicators correlate with the adopted choice strategy.The job-based strategy comes out neatly as the best strategy, as opposed to theattribute-based one: the latter strategy correlates to larger probabilities of breakingoff questionnaires, though this difference is not statistically significant.
Moreover, the job-based procedure gave a higher proportion of jobs, chosenby graduates, close to ideal than the attribute-based one and respondents appreciatedthe former way of putting questions for its clarity, ease to respond and lowerannoyance than the latter.
At the end, the distance from ideal is just 9.1% in questionnaires adopting thejob-based strategy and 17% in the case in which questioning was based just onattributes (Table 8). In other words, out of 100 people responding to questionnaires,almost 91 stated that the job selected through the job-based procedure mirrored therespondent’s ideal job, whilst this number was just 83 if an attribute-basedprocedure was adopted. The gap between the two strategies is significant also asindicator of the direction to undertake if one’s strategic purpose is to design amethod to elicit what respondents’ have in mind, they may or may not know itbeforehand7.
This approach is consistent with the principle that preferences for complexoptions are often devised, not merely revealed, in answering contingent questionseven if respondents do have firm value systems (Bettman et al., 1998). This isparticularly true for comparative choices. With an appealing image by Gregory etal. (1993), it may be stated that respondent’s choices are constructed on the spot,rather than uncovered as if they were hidden in the memory. Moreover, the targetof defining a job close to ideal was achieved with the perception of a lower burdenput on respondents. The job-based strategy was deemed by graduates as significantlyclearer (7.3% more) and easier to fill (again 7.3% more) than the competingstrategy, without requiring additional time in questionnaire filling. Ceteris paribus,also the interest for the job-based questionnaire differs mildly but significantly fromthe other strategy.
A significant difference between the two strategies was also ascertained asregards the rate of induced stress: that of the attribute-based strategy is higher thanthe job-based one of about 5 percentage points (34.8% versus 29.7%, see Table 8).This difference vanishes if the both-positive-and-negative question for warming up
7 The reader interested on consumers’ choice processes can read, among the others, Bettmanet al. (1998).

Warm up and presentation devices experimented in a conjoint-choice survey… 57
respondents and personal characteristics of graduates (engineering as disciplinaryfield, low degree mark, possession of a Bachelor degree, and working at graduation)are considered as additional explanatory variables in the model. This means thatquestioning devices perceived as stretches by respondents may cumulate theireffects during the response process and progressively irritate respondents. Ashighlighted by the much larger level of R-squared induced by respondents’individual characteristics, the stress cumulated during the filling of the questionnaireseems to be much more affected by question content than by the experimentalmodes. In fact, even the stress rate of the job-based strategy is of the order of a non-ignorable 30%, which may depend more on the general questioning style than onthe choice exercise per se. Definitely, the suggested job-based strategy may beconsidered an encouraging starting point for questionnaire designers.
3.4 CHOICE SET SIZE
The results from the experiment on the optimal choice set size are described in Table9 and, as before, are summarised in the regression models presented in Tables 3through 7. If we articulate the results’ presentation according to response rate,perceived quality, and proximity between chosen and ideal job, we can state that:– The choice set sizes that give significantly lower proportions of break-off rates
and slightly more responses in higher median completion times are the 3-job andthe 4-job sets (Tables 3, 4 and 5). These effects tend to vanish, though, if thecharacteristics of respondents are introduced into the model. In fact, theinsertion of two dummy variables that identify students working before graduationand graduates possessing a Master degree neutralise partially or fully thehighlighted effects on the break off rate. Moreover, the insertion of anotherdummy representing males neutralises the effects of the choice set sizes upon
Table 8. Indicators of experimental effects of choice strategy
Indicator Choice design Significance
Job-based Attribute-based
1. Questionnaire dropout rate (a) 51.5 49.5
2. Break off rate (a) 10.8 9.8
3. Proportion valid responses (b) 92.4 91.9
4. Median completion time (b) 19.8 21.0
5. % interesting © 55.5 53.2
6. % clear © 71.1 63.8 ***
7. % easy to answer © 82.5 75.2 ***
8. % annoying or stressing © 29.7 34.8 **
9. % choice close to ideal (d) 90.9 83.0 ***
Significance levels: *: <5%; **: <1%; ***: <1%o; Sample sizes: a: 7102; b: 3628; c=3174; d=3332

58 Fabbris L., Miari F. and Scioni M.
completion time. The pseudo R-square is much larger if the individual characte-ristics are present in the model than if just this experimental variable is present. Thus, individual variables are more relevant as indicators of outcome than the experimental ones and, it is to be remembered that in our analyses, the outcomes of the experimental factors must be analysed alone, without their possible interactions with the individual variables.
– The questionnaire quality perceived by respondents is not influenced bydifferences in the choice set size, at least as far as the sizes experienced in ourexercise are concerned (Tables 6 and 9).
– Closeness to ideal is lower if the size of choice sets is two. The distance fromideal is much higher than the other evaluated options. This suggests that a best-worst choice is not suitable if respondents evaluated just two job profilesbecause the random draw of jobs could present a respondent with both good jobsor both low-profile jobs and she might be embarrassed while forced to confer anegative meaning to a good job or a positive meaning to a low-profile job,respectively. Moreover, in two-job choice sets, jobs were described by sixattributes and one may have difficulties in effectively comparing job profilesdescribed by so many attributes at a time.
– Choice sets of size six can give choices close to ideal in 91.3% of cases, thehighest proportion, even though they are not considered clear and easy as theother experimental options, in particular the size=3. In fact, the number ofdescriptors being just two per job, it is easier for a respondent to match theattributes of the offered jobs with those she mostly esteems.
Table 9. Indicators of experimental effects of choice set size
Indicator Number of job opportunities in a choice set (k) Signific
ance 2 3 4 6
1. Questionnaire dropout rate(a) 49.9 52.4 50.5 51.5
2. Break off rate (b) 12.5 9.4 9.7 11.4
3. Proportion valid responses (b) 92.1 92.4 93.0 91.5
4. Median completion time (b) 19.3 20.7 20.1 19.7
5. % interesting © 55.9 54.7 54.1 55.5
6. % clear © 69.5 71.7 69.1 67.9
7. % easy to answer © 82.3 81.8 80.7 79.4
8. % annoying or stressing © 31.1 32.6 28.6 30.9
9. % choice close to ideal (d) 84.8 90.3 89.5 91.3 ***
Significance levels: *: <5%; **: <1%; ***: <1%o; Sample sizes: a: 7102; b: 3628; c=3174; d=3332

Warm up and presentation devices experimented in a conjoint-choice survey… 59
3.5 INTERACTION BETWEEN EXPERIMENTAL MODES
We checked the significance of the interactions between two couples of experimen-tal factors: (i) choice strategy and choice set size, and (ii) choice strategy and warmup device. The data were analysed through logistic regression whose results aresummarised in Tables 10 and 11.
Table 10. Logistic regression analysis of response break off caused by the interactionsbetween choice strategy and choice-set size and stepwise analysis with experimental
and individual explanatory variables (n=3,628)
Experimental factors Experimental factors and
respondents’ characteristics
Estimate Significance Estimate Significance
Intercept -1.876 *** -2.180 ***
Job-based & choice set=2 0 0
Job-based & choice set=3 -0.276 -0.257
Job-based & choice set=4 -0.330 * -0.259
Job-based & choice set=6 -0.184 -0.152
Attribute-based & choice set=2 -0.117 -0.078
Attribute –based & choice set=3 -0.475 -0.690 *
Attribute –based & choice set=4 -0.443 -0.336
Attribute-based & choice set=6 -0.127 0.083
Master’s degree vs. Bachelor = = -0.496 ***
Working at graduation vs. Not work. = = 0.575 ***
Pseudo R2 = 0.0020; Rescaled
R2 = 0.0041; AIC=2510.1;
BIC=2559.6
Pseudo R2 = 0.0119; Rescaled
R2 = 0.0262; AIC=2113.9;
BIC=2175.6
Significance levels: *: <5%; **: <1%; ***: <1%o
Table 11. Logistic regression analysis of response break off caused by the interactionbetween choice strategy and warm up mode and stepwise analysis with experimental
and individual explanatory variables (n=3,628)
Experimental factors Experimental factors and
respondents’ characteristics
Estimate Significance Estimate Significance
Intercept -1.952 *** -2.171 ***
Job-based & warm up=No warm up 0 0
Job-based & warm up=favourable -0.222 -0.315
Job-based & warm up=unfavourable -0.049 -0.111
Job-based & warm up=both -0.222 -0.291
Attribute-based & No warm up -0.234 -0.297
Attribute-based & warm up=favour. -0.055 -0.022
Attribute-based & warm up=unfavour. -0.226 -0.200
Attribute-based & warm up=both -0.638 -0.837 *
Master’s degree vs. Bachelor = = -0.499 ***
Working at graduation vs. Not work. = = 0.568 ***
Pseudo R2 = 0.0018; Rescaled
R2 = 0.0037; AIC=2510.8;
BIC=2560.4
Pseudo R2 = 0.0121; Rescaled
R2 = 0.0267; AIC=2113.1;
BIC=2174.8
Significance levels: *: <5%; **: <1%; ***: <1%o
60 Fabbris L., Miari F. and Scioni M.
The only interaction that positively affected the questionnaire completion ratewas that between a job-based choice strategy and a set size of four. Let us remindthat, considering only the main effects, three was the significant set size.
If we allow graduates’ characteristics to enter the model as explanatoryvariables, the four-job set size is no longer significant whilst the interaction betweena three-job choice and the attribute-based strategy becomes significant togetherwith the two dummy variables representing graduates not working at graduation,and possessing a Master degree. The two individual variables represent againparticular groups of graduates, since graduates working at graduation alreadygained a job and those possessing a Bachelor degree might perceive themselves asa lower-profile category among the higher-educated ones. This implies thatquestions were basically designed to represent the conditions of unemployed,Master-possessing graduates.
Even though no interaction between the choice strategy and the warming upfactor was significant, the individual variables that characterise graduates whopossess a Bachelor degree or started working before graduation influenced thebreak-off rate. The insertion of these two dummies made it irrelevant, as a factor ofbreak-off reduction, the administration of the warm-up question with both favourableand unfavourable levels in conjunction with the attribute-based strategy. This ratherstrange result could stem from the absolutely deleterious effect of these individualvariables on the response rate.
4. DID THE EXPERIMENTS INFLUENCE THE OBTAINEDRESPONSES?
In order to detect a possible influence of the experiment on data collection modeswe estimated a conditional logistic regression model on final choices of the best andworst attributes (McFadden 1974; Manski and McFadden, 1981; Louviere andWoodworth, 1983). With reference to a respondent, the job attribute chosen as bestwas indexed as 1, that chosen as worst was indexed as -1 and non-choices wereindexed as 0. The scores of the first preference factor were then linearly regressedon the experimental modes as explanatory variables. The null hypothesis was thatthe experimental modes did not influence the obtained responses. We did notinclude individual characteristics not to confound the possible effects on the choiceprocess deriving from the experiments. The results of the multinomial logisticregression analysis are presented in Table 12 and those of the linear regressionanalysis in Table 13.

Warm up and presentation devices experimented in a conjoint-choice survey… 61
Table 12. Multinomial logistic regression analysis of best-worst choices according to jobattributes (n=3232; maximum likelihood estimation; R2 = 0.174; Wald test = 3280 on
18 df)
Parameter Estimate
Saturdays and evenings always free 0.164
Saturdays and evenings sometimes busy -0.696***
Open-ended contract 1.852***
Fixed-term contract -1.135***
No lengthy business trip -0.073
Frequent and lengthy business trips -0.906***
Close to home 0.512***
Far from home -0.933***
Job activities related to studies 2.636***
Job activities unrelated to studies -2.554***
Autonomous job activities 0.917***
Many non-autonomous job activities -1.375***
Intellectual tasks 0.778***
Manual tasks -0.272**
English can be useful at work -0.109
Necessary to learn well English -0.419***
Informal work environment 0.645***
Formal, detached work environment -0.677***
Significance levels: *: <5%; **: <1%; ***: <1%o
Table 13. Linear regression analysis of the preference factor according to data collectionmodes, based on all units and after trimming 5% tailsg
Parameter All units 5% trimmed
Intercept 2.825*** 2.919***
Warm up: favourable attribute-levels 0.017 0.071
unfavourable attribute-levels -0.042 -0.055
both favourable & unfavourable -0.015 -0.005
Choice strategy: attribute-based 0.532*** 0.550***
Choice set size: 3 -0.108 -0.187*
4 -0.003 -0.063
6 -0.013 -0.044
(n=3338; R2 = 0.017;
F-statistic = 8.39 on 7
and 3330 df)
(n=3284; R2 = 0.021;
F-statistic = 9.98 on 7
and 3276 df)
Significance levels: *: <5%; **: <1%; ***: <1%o
The analysis highlights what follows.a) The warm-up experiment did not show any statistical effect on the job choices
expressed by graduates. This means that we can warm up respondents withoutbiasing preference data.
62 Fabbris L., Miari F. and Scioni M.
b) The choice strategy influenced the responses in a significant way. The choicesof respondents obtained with the attribute-based strategy turned out to be morepositively oriented than those obtained with the job-based strategy. In otherwords, while selecting the best or worst features of a job, respondentsexperimentally assigned to the attribute-based strategy tended to pinpoint thelevels that were most often chosen by the whole sample of respondents. Thistendency may mean that respondents arrived at the final choice of attributes witha lower level of attention, reduced the variability of their choices, and were lessoriented to identify their final choice with her ideal job. Conversely, the strategyof choosing first a job and then its qualifying attributes doubled the respondent’sreflection and induced more heterogeneity on the attributes’ final choices.
c) As far as the set size is concerned, only job sets of size three showed a 5%significance. These results are in harmony with those related to choice strategy:at a given choice stage, a short list of attribute-levels, limiting the choicepossibilities, may induce individuals to respond, erroneously, in conformitywith the majority of respondents. We estimated another model to check whetherthe choice strategy interacted with the size of the set exhibited to respondents,but no interaction showed significant effects and even the mild effect of sizethree lost significance. Hence, we are allowed to conclude that only the choicestrategy did significantly influence the research contents.
5. DISCUSSION
The results of the experimented factors related to warming up respondents beforea conjoint exercise and to the number of jobs to be included in a choice set can bevalued within the general theory of cognitive simplicity, that is, in order to surveypeople, communication has to be as simple as possible. Indeed, our experimentsshowed that warming up respondents gives in general better outcomes if questionsare simply and positively worded. Helm et al. (2011) arrived at similar conclusions:the best way to warm up respondents is to supply information consisting ofattributes that are as natural as possible.
Our analyses ascertained that graduates who started working before graduationand those possessing only a Bachelor degree are much less favourable to respondto questions grounded on the hypothesis that respondents are looking for an afreshjob. The case of Bachelors is consistent with those in the literature (Gruca, 1989):they may have perceived questions as difficult to process since master-oriented.
As for students working at graduation, we could conjecture that the choiceprocess was faced by people who knew too much of the topical matter, – having
Warm up and presentation devices experimented in a conjoint-choice survey… 63
already gone through the recruitment process before graduation – and may havebeen annoyed by questionnaires because they entered jobs less qualified than thosethought for graduates in the experiment.
Generally speaking, all graduates whose relationships with work and educationare peculiar may perceive both the survey per se and the work-related questions ina more arguable manner than those who never worked8.
As concerns the warming up devices, the experiment showed that a simplequestion using just positively oriented attribute-levels may give more and betteranswers, as opposed to no-warming or complex warming-strategies.
We evaluated the effect of the presentation of choice sets of 2, 3, 4 and 6 jobsopportunities, each job being described by 6, 4, 3 and 2 attribute levels, respectively.We showed that a number of three jobs described by four attributes gave betteroutcomes in terms of response rate and respondents’ perceived suitability torepresent their job preferences. In addition, the offer of two jobs at a time describedby six attributes was deemed as inappropriate, determining a proportion of jobchoices close to ideal much lower than all the other options. Instead, the choiceamong six jobs described by just two attributes made it larger the probability thatthe respondent’s final choice of a job was close to ideal. Though, the choice amongsix jobs was not considered easy to answer by respondents and induced many ofthem not to complete the questionnaire.
De Bekker-Gross et al. (2015), reviewing 69 comparable references onhealthcare related CBC studies in 2012, ascertained that most common studies had4 to 6 attributes and 9 to 16 choice sets per respondent. It is worth reminding thatin our experiment the number of choice sets presented to each respondent spannedfrom 6 to 18 (i.e. three times the number of experimented choice set sizes in eachsingle task). We highlighted that the solution with nine choice sets, namely a choiceset of three jobs per task, may be optimal, a value close to the lowest extreme of theinterval defined by the quoted authors.
The experiment on the more suitable choice strategy compared an alternative-based choice procedure with an attribute-based one. We showed that:a) For both the experimented strategies, the best and the worst job characteristics
were chosen at the end of a hierarchical process that added information at each
8 People who possess a lower ‘ability to choose’ (Amaya-Amaya et al., 2004; Shugan, 1980;Swait and Adamovicz (2001) may adopt simplifying or compensatory strategies as choicecomplexity increases, or they may defer or avoid choices, or choose to maintain the status quoas complexity of the task required to respondents in CBC experiments (number of alternatives,length of task, processing capabilities implied by task, time pressure, correlation betweenattributes) increases. They might also do more mistakes in particularly complex situations.
64 Fabbris L., Miari F. and Scioni M.
step and allowed us to testify that the expressed choices can be considered ashighly rational for graduates.
b) At the end of each choice procedure, the job-based strategy works better indefining a job close to ideal since it induced respondents to (unconsciously)apply, at each evaluation step, a compensatory strategy, holistically evaluatingthe exhibited job opportunities. Namely, respondents appraise each job in a waythat negative attribute-levels may be partially or fully compensated by thoseperceived as positive. This principle does not apply to the attribute-basedstrategy because in this case the choice is analytic rather than holistic, meaningthat the attribute-level chosen as best at a given choice step is the best amongthose administered and, analogously, the one chosen as worst is the worst at thesame step.
c) Respondents showed to prefer the procedure consisting of choosing a job froma set and then defining the reasons of that choice, instead of the strategy ofselecting the attribute levels that define a preferable job by identifying thefeatures of good jobs.
The job-based strategy seems preferable in CBC studies in all cases when acompensatory choice process is expected, in particular when the displayed attributesrepresent the alternatives in an impressionistic way and the researcher wishes thatchoices incorporate the randomness implied by this approximation (Clark andToner, 1997). That is, nearly always.
The response effect of the two strategies was compared from a psychologicalviewpoint9. Some scholars (Tversky, 1972; Bettman et al., 2013) stated thatattribute-based processing is often easier than that based on alternatives because theformer strategy is non-compensatory and assumes that respondents are able just toevaluate each possible attribute level, whilst the latter is compensatory and assumesthat respondents are able to assign a subjective value to each possible alternative.
The way people behave while collaborating to a choice exercise depends alsoon data collection design and the local environment. In other words, a choice is amatter of bounded rationality (Simon, 1955; Timmermans, 1993; Bettman et al.,2013), since it is the effect of a rational process conditional to the measurementsetting. In fact, part of the literature stemming from Simon’s concept of boundedrationality suggests that increasing the size of the exhibited choice set may alter the
9 Also the experiences of rating-based versus choice-based full profile conjoint models showedanalogous results (see, among the others, Elrod et al., 1992; Tversky et al., 1990; Adamoviczet al., 1998; Boyle et al., 2001; Siikamäki and Layton, 2008).
Warm up and presentation devices experimented in a conjoint-choice survey… 65
choice strategy of respondents, in particular they may take shortcuts such as usingnon-compensatory strategies that eliminate peculiar alternatives or choosingamong fewer relevant alternatives.
Other scholars (Hanley et al., 2001, 2002) suggest instead that if respondentsare faced with a hierarchy of information request the estimated models canimprove10. Others (Johnson, 1988; Louviere and Timmermans, 1990; Oppenwal etal., 1994; Oppenwal and Vriens, 2000; Molin and Timmermans, 2009) highlightedthat respondents should be helped at the initial steps of the process to classify jobattributes in few perceptual dimensions – called ‘decision construct’ or ‘choiceconstruct’– since, through this classification, they achieve self-consciousness ofwhat the questionnaire is on about. This way, the respondents’ final judgement canbe better informed and better integrated into a consistent information frame.
What stemmed from our experiment is that the more complex choice process,involving first the choice of a job and then that of an attribute-level that qualifies thechosen job, was not only perceived by graduates as a more natural way of simulatinga bargaining process similar to those in the job market, but also drew their choicesclose to the unknown ideal job, even though just a small sample of possible jobs wasexhibited to respondents during their individual choice process11.
It is not to be excluded that the simulation of offering and choosing jobattributes made some graduates more aware of the parameters that could be used inreal situations for accepting or refusing jobs. This type of learning is probably thereason why the respondents reacted better with the more complex strategy, insteadof the other that involved less cognitive burden but also a lower cognitiveachievement. This hypothesis implies that also the emotional involvement ofrespondents plays a major role in determining quantity and quality of responses inchoice processes.
A possible limitation of our outcomes may be the type of surveyed population,which could be considered particularly educated in filling questionnaires andcapable of comprehending the essential meanings with a lower number of questions.Our outcomes may also depend on the best-worst technique as choice tool for our
10 The complexity of the data collection system for CBC purposes, once a threaten to estimation,is no longer a methodological problem (Kamakura, 1989; Mc Fadden, 1989; Hajivassiliou,1993; Haaijer et al., 1996).
11 Louviere (1988) listed other advantages of conjoint choice experiments, as compared toconventional conjoint analysis, that are not relevant to our analyses. In fact: (a) there is nodifference in scale between respondents, (b) respondents can evaluate a larger number ofprofiles, (c) choice probabilities can be directly estimated and one does not need ad hoc andpotentially incorrect assumptions in order to create computerized choice simulators.

66 Fabbris L., Miari F. and Scioni M.
CBC experiment. In fact, choosing from a set of three jobs means that a best-worstrule orders, according to a preference scale, the first, the intermediate and the worstunits at each step of a job-based procedure. This may be one of the reasons why theoffer of three alternatives in a choice set shows better outcomes.
A final consideration concerns the types of attributes used in our experiment.The attributes employed to describe the job opportunities had both positive andnegative levels. Some of the levels did not exhaust the possible levels of a givenattribute. Thus respondents had to balance each level of an attribute with itsopponent in order to define the relative importance of the level as an aspect of theoffered job. The possible conflicts that could involve attributes that have bothpositive and negative levels in choice processes are described also in Fischer et al.(2000), Haaijer et al. (2000), Sanbonmatsu et al. (2003) and Islam et al. (2007).
Moreover, the question about the worst job and the worst attribute-level(necessary to perform a BW task) added further conflict to the procedure, since thecause of refusing the worst job usually is not the mirror image of the reason foraccepting the best one. Certainly, in our experiment, these conflicts between polesof attributes did require a deeper attention of respondents during the choice processand strengthened respondents’ awareness.
The attribute “Autonomous job activities” as opposed to “Many non-autonomous job activities” and “Job activities related to studies” as opposed to “Jobactivities unrelated to studies” presented very small variability in distribution sincerespondents expressed almost unanimous choices in the positive direction andbehaved differently (not necessarily as in mirror) when asked to choose anundesirable aspect of a to-be-refused job. Even though these two attributes do notapply for the analysis of trade-offs (the winner is always the positively orientedlevel, see Fowkes and Wardman, 1988), the negatively-oriented level may becomeimportant in a BW scaling because it can enlarge the boundaries of the analysisempirical choices and could serve in a compensatory choice process.
6. CONCLUSION
This paper describes the results of three experiments, nested to each other to forma single orthogonal design, aimed to suggest new techniques for optimally designingcomputer-assisted questionnaires in CBC surveys. It is worth reminding that theexperiments were not focused on the predictive nature of conjoint analysis but juston its analytic power. We evaluated also a selected set of two-way interactions.
We succeeded in our purpose for we established that there is a better way ofwarming up respondents in view of a conjoint-type experiment, a better size of
Warm up and presentation devices experimented in a conjoint-choice survey… 67
choice sets, at least in the hypothesised situation with 12 attribute-levels shown ateach choice task, and a more effective strategy to elicit preferences about jobcharacteristics from graduates. These outcomes might help researchers to optimallydesign their electronic questionnaires for conjoint choice experiments.
Of course, this is nothing but a fragment of what could be done to improvequestionnaire design and conjoint measurement techniques. Moreover, the potentialimprovements are of the order of some per cent points, because all but onetechniques consist of adaptations of popular practices. Nevertheless, followingJohnson (2006), we suggest that in stated conjoint analysis everything matters andhope that our outcomes can encourage other purposive research.
We have found that not only warming up respondents with simple, enoughgeneral, one-minute questions does not burden respondents but may also improvequality of responses. Instead, we did not find evidence that inserting a warm-upquestion could raise the quantity of responses.
A size of two jobs is to be excluded for choice sets unless the number of job-describing attributes is much less than six; we can hazard that no more than fourattributes should describe a job. A size of six jobs described by two attributes is veryeffective in choosing the job features that best represent the ideal job, which is thevery target of choice exercises. Remembering that this situation was not consideredsimpler nor clearer by respondents, it would be interesting to check in a futureexperiment what could happen in terms of closeness to ideal if respondents wereasked to choose among a set of six jobs described by more than two attributes.
The setting of our experiment implied that the product of the size set numbertimes the number of attributes was 12. So, we are not allowed to infer if other setsizes could be better than the experienced one, for instance if a job set of four withfour attributes each, or if a six jobs by three attributes task could be better than threejobs times four levels task that we highlighted as best. This could be matter for otherresearch exercises.
We have tested also the suitability of a complex job-based strategy as analternative to an attribute-based choice procedure. All the computed indicatorsshowed that the original job-based strategy worked effectively in the field andperformed better than the other one. The job-based strategy was perceived bygraduates as that more closely approximating real-word decision making. We usedthe closeness between chosen and ideal job characteristics as an indicator ofcontingent consequence and ascertained that the job-based simulator ended withmore than 90% choices close to ideal, whilst the other strategy ended with 83%choices close to ideal. Even if the simulation is hypothetical, we can conclude thatgraduates appreciated the fun and imagination implied by both choice simulators
68 Fabbris L., Miari F. and Scioni M.
but considered far more realistic the job-based one.Some graduates behaved differently from the general sample. From most of
the analyses it stemmed that people with just a Bachelor degree and those whostarted working before graduation felt the survey and the questionnaire far fromtheir interests. Also graduates in engineering indirectly showed peculiar expectationsfrom the survey. It is worth raise doubts for a general extension of the surveyoutcomes also to these partially-interested groups and it could be opportune to carryout new surveys with specific questionnaires for them.
A possible limit of our experiments was highlighted by the multivariateanalysis of the break-off rate introducing the graduates’ individual characteristicsas explanatory variables. This analysis highlighted a mild inter-correlation betweenthe choice set size, on the one side, and the possession of a Bachelor degree and thefact of working before graduation, on the other side. This type of correlation doesnot threaten the inference drawn from the experiments, but it signals that inferencebased on responses of graduates with lower motivations to collaborate to theuniversity’s survey has to be careful.
Another limitation of our experiment was that the attribute-level strategyintroduced unwanted homogeneity to the obtained responses. The risk that theimplementation of experiments may influence responses is always present in suchsurveys. This may mean that in a ‘content’ analysis of the expressed preferences thechoice strategy dummy should be considered as an additional, hopeless predictorin a content’s regression analysis.
ACKNOWLEDGEMENTS
This study was pursued as a part of the 2014-17 University of Padua project CPDA143505, titled “The preferences of Veneto entrepreneurs as for graduates selectionelicited through conjoint analysis: The Electus project” coordinated by L. Fabbris.The authors share the responsibility of the whole paper, though L. Fabbris wroteSections 1 and 6, M. Scioni wrote Sections 2, 4 and 5, and F. Miari wrote Section 3.
REFERENCES
Acito, F. (1979). An investigation of the reliability of conjoint measurement for various orthogonaldesigns,” in R.S. Franz, R.H. Hopkins and A. Toma (eds) Proceedings Southern MarketingAssociation 1979 Conference. University of Southwestern Louisiana: 175-178.
Adamowicz, W., Boxall, P., Williams, M. and Louviere J.J. (1998). Stated preference approaches formeasuring passive use values: Choice experiments and contingent valuation. In AmericanJournal of Agricultural Economics. 80: 64-75.

Warm up and presentation devices experimented in a conjoint-choice survey… 69
Amemiya, T. (1981). Qualitative response models: A survey. In Journal of Economic Literature.19(4): 1483-1536.
Bech, M., Gyrd-Hansen, D., Kjaer, T., Lauridsen, J. and Sørensen, J. (2007). Graded pair comparison:Does strength of preference matter? Analysis of preferences for specialised nurse home visitsfor pain management. In Health Economics. 16: 513-529.
Bettman, J.R., Luce, M.F. and Payne, J.W. (1998). Constructive consumer choice processes. InJournal of Consumer Research. 25(3): 187-207.
Boyle, K.J., Holmes, T.P., Teisl, M.F. and Roe, B. (2001). A comparison of conjoint analysis responseformats. In American Journal of Agricultural Economics. 33(2): 441-454.
Burke, P.F., Louviere, J., Wei, E., MacAulay, G., Quail, K. and Carson, R. (2013). Overcomingchallenges and improvements in best-worst elicitation: Determining what matters to Japanesewheat millers, Centre for the Study of Choice, University of Technology, Sydney.
Chrzan, K. and Patterson, M. (2006). Testing for the optimal number of attributes in Maxdiffquestions, Sowtooth Software. Inc., Sequim,WA.
Clark, S.D. and Toner, J.P. (1997). Application of Advanced Stated Preference Design Methodology,Working Paper 485, Institute for Transport Studies, University of Leeds, UK.
Day, B., Bateman, I.J., Carson, R.T., Dupont, D., Louviere, J.J., Morimoto, S., Scarpa, R. & Wang,P. (2012). Ordering effects and choice set awareness in repeat-response stated preferencestudies. In Journal of Experimental Economics and Management. 63: 73-91.
De Bekker-Gross, E.W., Donkers, B., Jonker, M.F. and Stolk, E.A. (2015). Sample size requirementsfor discrete-choice experiments in healthcare: A practical guide. In Patient. 8: 373-384.
DeShazo, J.R. and Fermo, G. (2002). Designing choice sets for stated preference methods: The effectsof complexity on choice consistency. In Journal of Environmental Economics and Manage-ment. 44: 123-143.
Diamond, P.A. and Hausman, J.A. (1994). Contingent valuation: Is some number better than nonumber?, In The Journal of Economic Perspectives. 8(4): 45-64.
Douglas, E. and Shepherd, D. (2002). Self-employment as a career choice: Attitudes, entrepreneurshipintentions, and utility maximization. In Entrepreneurial Theory and Practice. 26(3): 81-90.
Elrod, T. (2001). Recommendations for validation of choice models, Proceedings of the SawtoothSoftware Conference, September 2001: Sequim, WA.
Elrod, T., Louviere J.J. and Davey, K.S. (1992). An empirical comparison of rating-based and choice-based conjoint models. In Journal of Marketing Research. 29: 368-377.
Fabbris L. (2012). Indicators of Higher Education Effectiveness, McGraw-Hill Education, Milan,Italy.
Finn, A. and Louviere, J.J. (1992). Determining the appropriate response to evidence of publicconcern: The case of food safety. In Journal of Public Policy and Marketing. 11(1): 12-25.
Fischer, G.W., Luce, M.F. and Jia, J. (2000). Attribute conflict and preference uncertainty: Effects onjudgment time and error. In Management Science. 46 (1): 88–103.
Fowkes, A.S. and Wardman, M. (1988). The design of stated preference travel choice experimentswith special reference to interpersonal taste variations. In Journal of Transport Economics andPolicy. 22(1): 27–44.
Gregory, R., Lichtenstein, S. And Slovic, P. (1993). Valuing environmental resources: A constructiveapproach. In Journal of Risk and Uncertainty. 7: 177-197.

70 Fabbris L., Miari F. and Scioni M.
Green, P.E., Krieger, A.M. and Wind, Y. (2001). Thirty years of conjoint analysis: Reflections andprospects. In Interfaces. 31(3): 556-573.
Green, P.E. and Rao, V.R. (1971). Conjoint measurement for quantifying judgmental data. In Journalof Marketing Research. 8: 355-363.
Green, P.E. and Srinivasan, V. (1990). Conjoint analysis in marketing research: New developmentsand directions. In Journal of Marketing. 54(4): 3-19.
Gruca, T.S. (1989). Determinants of choice set size: An alternative method for measuring evoked sets,in: T.K. Srull (ed.) Advances in Consumer Research, Volume 16, Association for ConsumerResearch, Provo, UT: 515-521.
Gustafsson, A., Herman, A. and Huber, F. (2003). Conjoint Measurement. Methods and Applications,Springer-Verlag, Berlin.
Haaijer, M.E., Vriens, M., Wansbeek, T.J. and Wedel, M. (1996). Predictions in conjoint experiments:The X-factor probit model, SOM theme B: Inter-firm Interactions: Marketing and Networks,University of Groningen, The Netherlands.
Haaijer, R., Kamakura, W. and Wedel, M. (2000). Response latencies in the analysis of conjointchoice experiments. In Journal of Marketing Research. 37: 376-382.
Hainmueller, J., Hopkins, D.J. and Yamamoto T. (2013). Causal inference in conjoint analysis:Understanding multidimensional choices via stated preference experiments. In PoliticalAnalysis. 22(1): 1-30.
Hajivassiliou, V.A. (1993). Simulation estimation methods for limited dependent variable models, InG.S. Maddala, C.R. Rao and H.D. Vinod (Eds.) Handbook of Statistics, Vol. 11, 519-543.
Hanley, N., Mourato, S. and Wright, R.E. (2001). Choice modelling approaches: A superioralternative for environmental valuation? In Journal of Econometric Surveys. 15(3): 435-462.
Hanley, N., Wright, R.E. and Koop, G. (2002). Modelling recreation demand using choice experiments:Climbing in Scotland. In Environmental and Resource Economics. 22: 449-466.
Helm, R., Buehren, C. and Pabst, R. (2011). Warm-ups before preference measurement, WorkingPapers in Business, Economics and Management Information Systems No. 460, University ofRegensburg, Germany.
Hensher, D. (2006). Revealing differences in willingness to pay due to the dimensionality of statedchoice designs: An initial assessment. In Environmental & Resource Economics. 34: 7–44.
Huber, J. (1997). What WE Have Learned from 20 Years of Conjoint Research: When to Use Self-Explicated, Graded Pairs, Full Profiles or Choice Experiments, Sawtooth Software ResearchPaper Series, Sawtooth Software, Inc., Sequim, WA.
Humburg, M. and Van der Velden, R. (2014). Skills and the Graduate Recruitment Process: Evidencefrom Two Discrete Experiments, Paper No. RM/14/003, Maastricht University, The Netherlands.
Malhotra, N.K. (1984). Methodological advance in consumer research, in T.C. Kinnear (ed.) NA -Advances in Consumer Research, 11, Association for Consumer Research, Provo, UT: 63-65.
Malhotra, N.K., Jain A.K. and Lagakos, S. (1982). The information load controversy: An alternativeviewpoint. In Journal of Marketing. 46(2): 27-37.
Manski, C.F. and McFadden, D. (eds) (1981). Structural Analysis of Discrete Data and EconometricApplications, MIT Press, Cambridge.
Marley, A., Flynn, T.N. and Louviere, J.J. (2008). Probabilistic models of set-dependent and attribute-level best-worst choice. In Journal of Mathematical Psychology. 52: 281-296.
Warm up and presentation devices experimented in a conjoint-choice survey… 71
Marley, A. and Pihlens, D. (2012). Models of best-worst choice and ranking among multiattributeoptions (profiles). In Journal of Mathematical Psychology. 56: 24-34.
McCullough, D. (2002). A user’s guide to conjoint analysis. In Marketing Research. 14(2): 18-23.
McFadden, D. (1974). Conditional logit analysis of qualitative choice behavior, in P. Zarembka, ed.,Frontiers in Econometrics, Academic Press, New York: 105-142.
McFadden, D. (1989). A method of simulated moments for estimation of discrete response modelswithout numerical integration. In Econometrica. 57(5): 995-1026.
McFadden, D. (1994). Contingent valuation and social choice. In American Journal of AgriculturalEconomics. 76: 689-708.
Miari, F. (2015). Esperimenti sul modo di porre le domande per la misura delle preferenze. Tesi dilaurea, Dipartimento di Scienze Statistiche, Università degli studi di Padova.
Miller, G.A. (1956). The magic number seven, plus or minus two: Some limits on our capacity forprocessing information. In The Psychological Review. 63: 81-97.
Molin, E. and Timmermans, H. (2009). Hierarchical information integration experiments andintegrated choice experiments. In Transport Reviews. 29(5): 635-655.
Oppewal, H.,‘Louviere, J.J. and Timmermans, H.J.P. (1994). Modeling hierarchical conjoint processeswith integrated choice experiments. In Journal of Marketing Research. 31: 92-105.
Oppenwal, H. and Vriens, M. (2000). Measuring perceived service quality using integrated conjointexperiments. In International Journal of Bank Marketing. 18(4): 154-169.
Pearmain, D., Swanson, J., Kroes, E. and Bradley, M. (1991). Stated Preferences Techniques: AGuide To Practice, 2nd edition, Steer Davis Gleave and Hague Consulting Group, The Hague,The Netherlands.
Sanbonmatsu, D.M., Kardes, F.R., Houghton, D.C., Ho, E.A. and Posavac, S.S. (2003). Overestimatingthe importance of the given information in multiattribute consumer judgment. In Journal ofConsumer Psychology. 13(3): 289-300.
Sawtooth Sofware Inc. (1993-2013). The CBC System for Choice-Based Conjoint Analysis. Version8, Sawtooth Sofware Technical Paper Series, Sawtooth Software, Inc., Sequim, WA.
Sawtooth Software Inc. (1993-2013). The CBC System for Choice-Based Conjoint Analysis,Sawtooth Software Technical Paper Series, Orem, Utah.
Shugan, S.M. (1980). The cost of thinking. In Journal of Consumer Research. 7(2): 99-111.
Siikamäki, J and Layton, D.F. (2006). Discrete Choice Survey Experiments: A Comparison UsingFlexible Models, Discussion Paper 05-60, Resources, Washington, DC.
Simon, H.A. (1955). A behavioral model of rational choice. In The Quarterly Journal of Economics.69(1): 99-118.
Steenkamp, J.E. and Wittink, D.R. (1994). The metric quality of full-profile judgments and thenumber-of-attribute-level effect in conjoint analysis. In International Journal of Research inMarketing. 11(3): 275-286.
Swait, J. and Adamowicz, W. (2001). The influence of task complexity on consumer choice: a latentclass model of decision strategy switching. In Journal of Consumer Research. 28(1): 135-148.
Thomas, S.G. (1989). Determinants of choice set size: An alternative method for measuring evokedsets. In Advances in Consumer Research. 16: 515-521.
Timmermans, D. (1993). The impact of task complexity on information use in multi-attribute decisionmaking. In Journal of Behavioral Decision Making. 6(2), 95-111.

72 Fabbris L., Miari F. and Scioni M.
Tversky, A. (1967). A general study of polynomial conjoint measurement. In Journal of MathematicalPsychology. 4: 1-20.
Tversky, A. (1972). Elimination by aspects: A theory of choice. In Psychological Review. 79(4): 281-299.
Tversky, A. and Shafir, E. (1992). Choice under conflict: The dynamics of deferred decisions. InPsychological Science. 6: 358-361.
Tversky, A., Slovic, P. and Kahneman, D. (1990). The causes of preference reversal. In AmericanEconomic Review. 80(1): 24-1.
Villosio, C. (2011). What makes a good candidate? The preferences of HR managers about newgraduated job-seekers, Laboratorio R. Revelli, Turin, Italy (mimeo).
Wallander, L. (2009). 25 years of factorial surveys in sociology: A review. In Social ScienceResearch. 38: 505-520.
Zwerina, K. and Huber, J. (1997). Deriving Individual Preference Structures for Practical ChoiceExperiments, Working Paper, Fuqua School of Business, Duke University.
Zwerina, K., Huber, J. and Kuhfeld, W. (2012). A general method for constructing efficient choicedesigns (http://support.sas.com/resources/papers/tnote/tnote_marketresearch.html).