Warm Up 1. The probability of getting the numbers 1,2,3,4 out of hat are 3/8, 3/8,1/8,1/8....
15
Warm Up 1. The probability of getting the numbers 1,2,3,4 out of hat are 3/8, 3/8,1/8,1/8. Construct a probability distribution (table) for the data and a probability distribution histogram. a) Find P(X>1.5) b) Find the largest number A for which P(X<A) <.8 2. Draw the density curve given by the line segment going from (0,0) to (X,1). a) Find P(X=.5) b) P(X>.5) c) P (.5<X<1.5) AP Statistics, Section 7.2, Part 1 1 Don’t turn in your homework yet
-
Upload
bryce-watkins -
Category
Documents
-
view
217 -
download
0
description
Section Means and Variances of Random Variables AP Statistics
Transcript of Warm Up 1. The probability of getting the numbers 1,2,3,4 out of hat are 3/8, 3/8,1/8,1/8....

Warm Up 1. The probability of getting the numbers 1,2,3,4
out of hat are 3/8, 3/8,1/8,1/8. Construct a probability distribution (table) for the data and a probability distribution histogram.
a) Find P(X>1.5)b) Find the largest number A for which P(X<A) <.8
2. Draw the density curve given by the line segment going from (0,0) to (X,1).
a) Find P(X=.5) b) P(X>.5)c) P (.5<X<1.5)
AP Statistics, Section 7.2, Part 11
Don’t turn in your homework yet

Warm Up In playing a modified version of the daily 3 players
select a three digit number less than 600. Such that the first digit is 0-5 and the next two digits are 0-9. It cost $2 to play but if you win you get $600.
1. Calculate the average winnings. (expected payout)
2. Why is this not a fair game?3. Calculate the standard deviation and variance of
average winnings. 4. Calculate the average profit.
2
Section 7.2.1Means and Variances of Random VariablesAP Statistics

Random Variables: Mean
The Probabilities pi must satisfy two requirements:1. Every Probability pi is a number between 0 and 1.2. p1+p2+…+pn=1 pi represents the probability of the individual event xi
AP Statistics, Section 7.2, Part 14
1 1 2 2 3 3X n n
X i i
p x p x p x p x
p x

AP Statistics, Section 7.2, Part 1 5
Random Variables: Example
The Michigan Daily Game you pick a 3 digit number and win $500 if your number matches the number drawn. It costs $1 to play a single game.
What is the average winnings (payout) ?
.001(500) .999 0
.50 0
.50
X
Is this a fair game?
This tells you the average you will win per play in the long run. (Does not take your cost into account)

Fair Game
Average winning=cost of playing
AP Statistics, Section 7.2, Part 1 6
AP Statistics, Section 7.2, Part 1 7
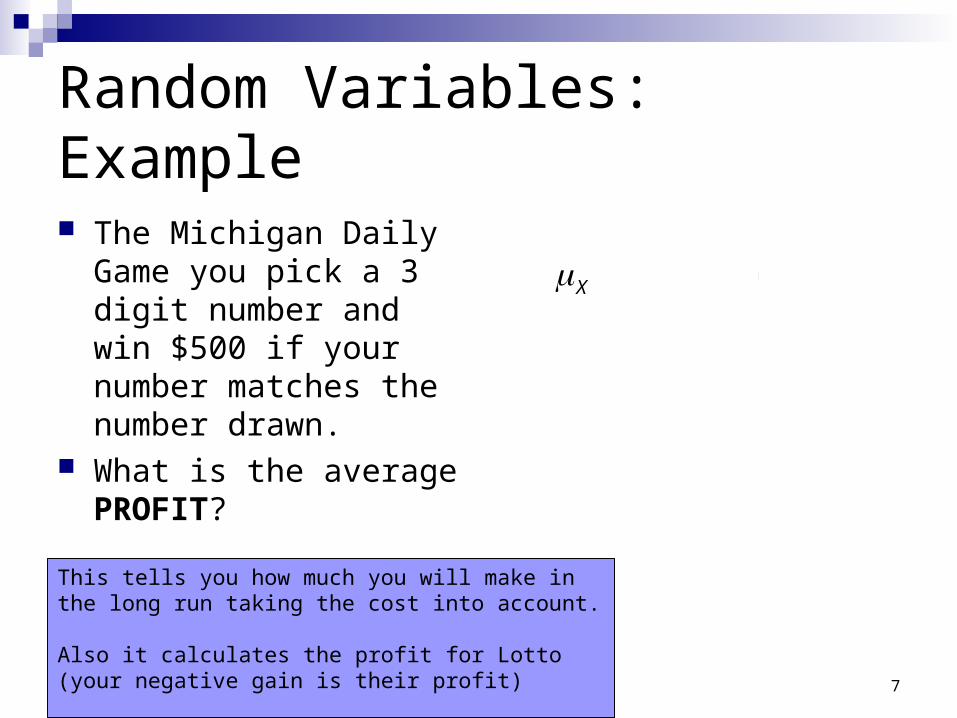
Random Variables: Example
The Michigan Daily Game you pick a 3 digit number and win $500 if your number matches the number drawn.
What is the average PROFIT?
.001(499) .999 1
.499 .999.50
X
This tells you how much you will make in the long run taking the cost into account.
Also it calculates the profit for Lotto (your negative gain is their profit)
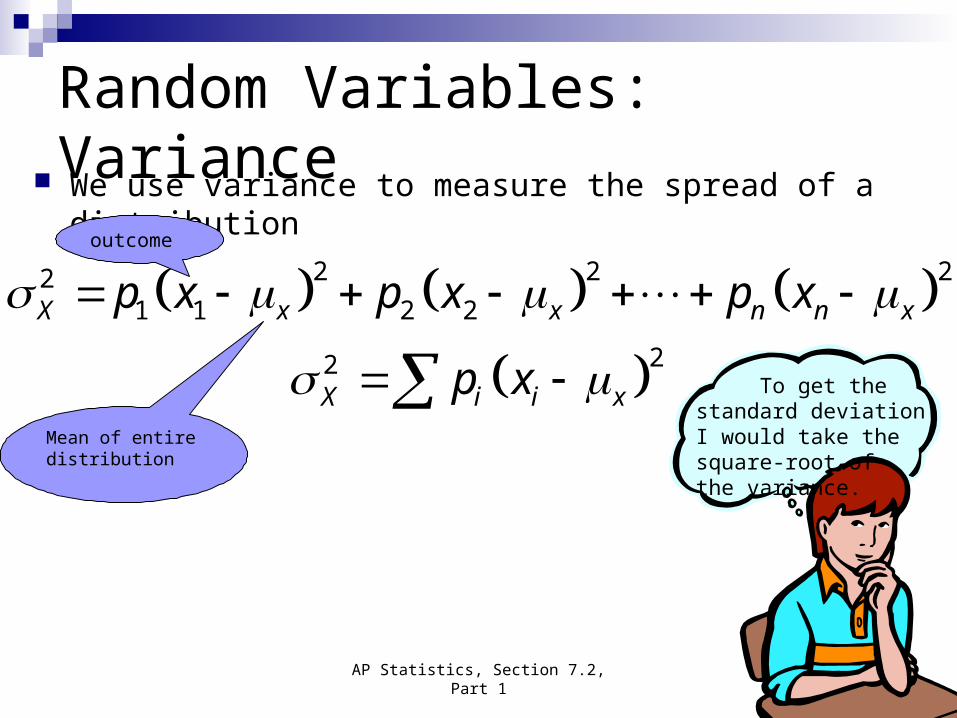
Random Variables: Variance We use variance to measure the spread of a distribution
AP Statistics, Section 7.2, Part 1 8
2 2 221 1 2 2
22
X x x n n x
X i i x
p x p x p x
p x
Mean of entire distribution
outcome
To get the standard deviation I would take the square-root of the variance.

AP Statistics, Section 7.2, Part 1 9
Example: Calculating variance and standard deviation The Michigan Daily
Game you pick a 3 digit number and win $500 if your number matches the number drawn.
The average winnings is 0.5
2 2
2
(500 .5) .001
0 .5 .999
249.50025 .24975249.7515.8
X
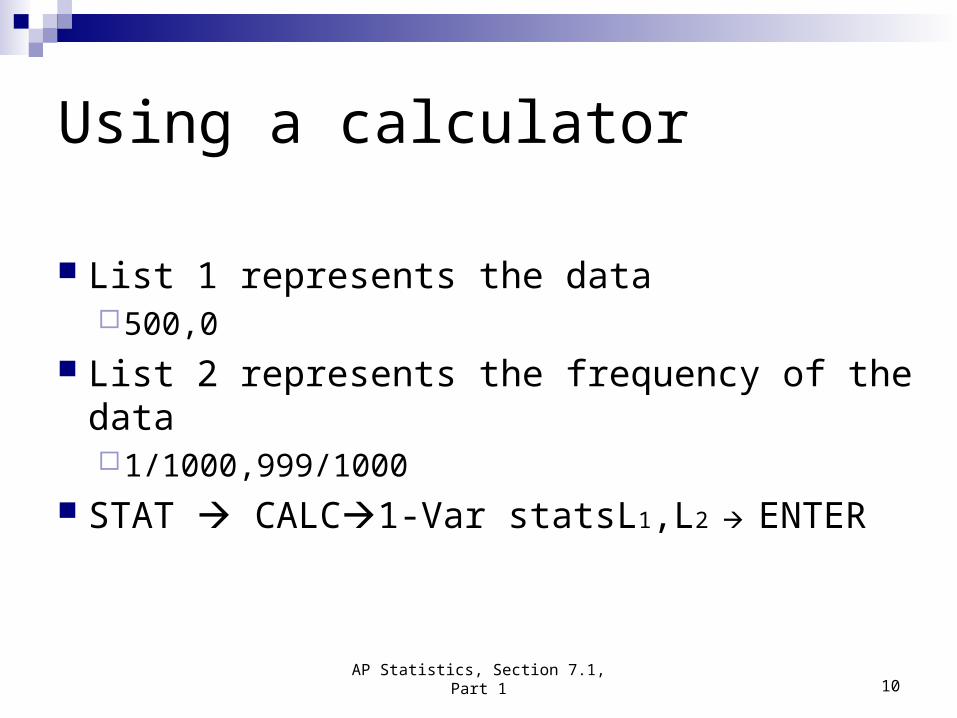
Using a calculator
List 1 represents the data 500,0
List 2 represents the frequency of the data1/1000,999/1000
STAT CALC1-Var statsL1,L2 ENTER
AP Statistics, Section 7.1, Part 1 10

AP Statistics, Section 7.2, Part 1 11
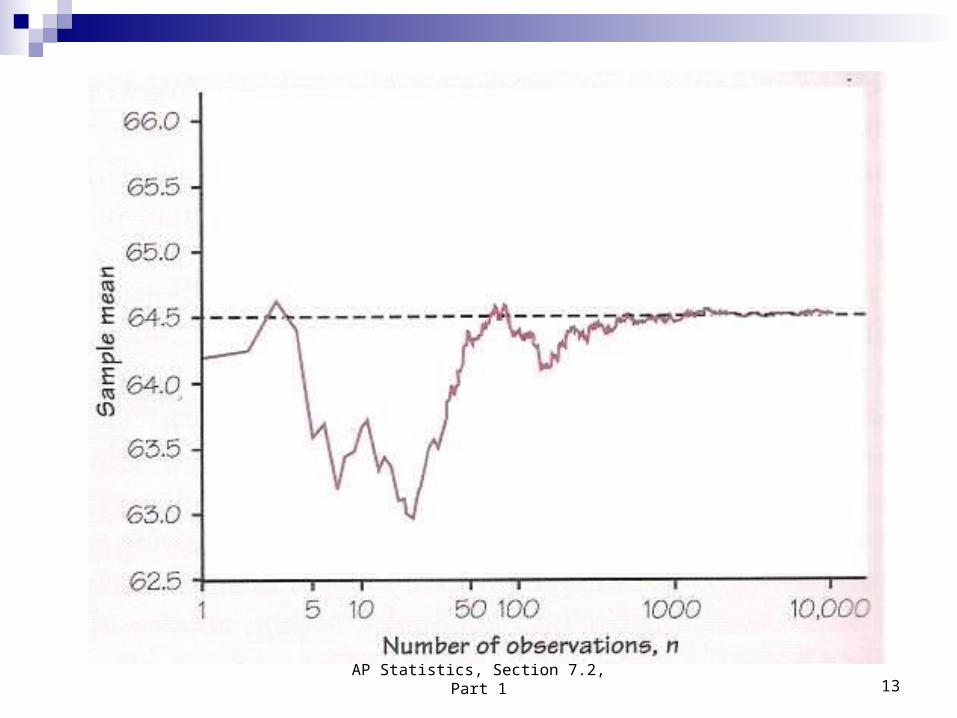
Law of Large Numbers Draw independent observations at random from
any population with finite mean μ. Decide how accurately you would like to
estimate μ. As the number of observations drawn increases,
the mean x-bar of the observed values eventually approaches the mean μ of the population as closely as you specified and then stays that close.
Samples

AP Statistics, Section 7.2, Part 1 12
Example
The distribution of the heights of all young women is close to the normal distribution with mean 64.5 inches and standard deviation 2.5 inches.
What happens if you make larger and larger samples…
AP Statistics, Section 7.2, Part 1 13

AP Statistics, Section 7.2, Part 1 14
Law of Small Numbers
Most people incorrectly believe in the law of small numbers.
“Runs” of heads/tails, black/red Something is “due”

AP Statistics, Section 7.2, Part 1 16
Assignment
Exercises: