
Warhammer* 40,000*: Dawn of War II*: Retribution ...
23
Warhammer* 40,000*: Dawn of War II*: Retribution* Performance case study Relic Entertainment and Intel Corporation Contents Abstract ......................................................................................................................................................... 2 Overview ....................................................................................................................................................... 2 Picking a representative scene ..................................................................................................................... 3 Major bottleneck: On the CPU or GPU?........................................................................................................ 6 More real-time data: Roughly what were we doing? ................................................................................... 9 Looking at a frame: Details emerged .......................................................................................................... 11 Frame budget: Confirming that terrain was expensive .............................................................................. 14 Experiments: Try to speed up the terrain ................................................................................................... 15 Experiment: Clamping Max MIP level ..................................................................................................... 15 Experiment: Eliminating ‘texkill’ ............................................................................................................. 15 Experiment: Eliminating unnecessary texture reads .............................................................................. 16 Experiment: Avoiding overdraw of pixels under HUDs .......................................................................... 19 Results in the final game ............................................................................................................................. 20 Conclusion ................................................................................................................................................... 22 About the authors ....................................................................................................................................... 22
Transcript of Warhammer* 40,000*: Dawn of War II*: Retribution ...

Warhammer* 40,000*: Dawn of War II*: Retribution* Performance case study Relic Entertainment and Intel Corporation
Contents Abstract ......................................................................................................................................................... 2
Overview ....................................................................................................................................................... 2
Picking a representative scene ..................................................................................................................... 3
Major bottleneck: On the CPU or GPU?........................................................................................................ 6
More real-time data: Roughly what were we doing? ................................................................................... 9
Looking at a frame: Details emerged .......................................................................................................... 11
Frame budget: Confirming that terrain was expensive .............................................................................. 14
Experiments: Try to speed up the terrain ................................................................................................... 15
Experiment: Clamping Max MIP level ..................................................................................................... 15
Experiment: Eliminating ‘texkill’ ............................................................................................................. 15
Experiment: Eliminating unnecessary texture reads .............................................................................. 16
Experiment: Avoiding overdraw of pixels under HUDs .......................................................................... 19
Results in the final game ............................................................................................................................. 20
Conclusion ................................................................................................................................................... 22
About the authors ....................................................................................................................................... 22

Abstract During the development of Warhammer* 40,000*: Dawn of War* II: Retribution*, engineers from Relic Entertainment and Intel Corporation analyzed the game for performance on mainstream PCs. We used a PC with a 2nd generation Intel® Core™ processor with Intel® HD Graphics 3000. At the time, Retribution was GPU-bound on that system. This case study describes the steps we took to find and speed up the most time-consuming areas of the game. Looking at the GPU workload, the pixel shaders for the terrain took more time than any other parts of the frame, so we experimented to find the best ways to speed up the terrain. We tried several techniques: clamping the maximum MIP level, removing ‘texkill’, eliminating overdraw of the pixels under the game’s HUD, and reducing texture sampling. After studying the terrain shaders in detail, they were improved by adding a threshold test to avoid certain texture loads. After this change, Retribution now runs 1.4x faster at the target resolution and quality settings on the test machine.
Overview As they were developing Retribution, Relic engineers wanted the game to run great on Intel graphics hardware. Older generations of this hardware have not been up to the task, but the latest generation can run games like Retribution quite well. Relic and Intel engineers studied the game’s performance and worked together to optimize the game. After optimization, Retribution looks and plays great on Intel graphics hardware, and we hope you enjoy playing it! This case study will help you better understand how to find and eliminate similar issues in your games. For general guidance on tuning games on Intel graphics parts, see the Intel Graphics Developer’s Guide. In this case study, we used the Intel® Graphics Performance Analyzers (Intel® GPA) to measure and analyze Retribution in order to set the stage for tuning the game. Intel GPA also let us try many graphical experiments in real time before making any changes to the game code. If you’re not familiar with GPA, you’ll get a sense of it in this case study, or you can get more info from the Intel GPA site. During development, the most expensive part of each frame, by far, was rendering the terrain. In that part of the frame, time was mostly being spent in pixel shaders, which were sampling and blending a large amount of textures. The pixel shaders were changed to be more selective, so that they only load/blend textures above a certain threshold. After implementing that change in the pixel shaders, the game runs much better and looks great. We tried several other experiments to speed up the game, but the resulting improvements were small in comparison with this one change.

Picking a representative scene Before optimizing, we needed to know where to look (any time you optimize, you need a well-defined “workload” to measure ). To get a quick sense of the game’s performance under various conditions, we brought up different scenes from the campaigns and did a few simple experiments while watching the frame rate. For this, a simple frame rate monitor like Fraps works great, or you can use the Intel® GPA System Analyzer Heads-up Display (HUD) to watch the frame rate (this HUD is added to your game when you profile in real time). The idea here, before doing any analysis, is to get a quick sense of where your game shows average and worst-case performance, so you can study those cases. For games that have single-player campaigns and multiplayer modes, campaigns are generally easier to benchmark. The Retribution campaigns have similar performance with multiplayer, so we started with the campaigns for simplicity. If the two were very different, we would have analyzed both. We tried a variety of resolutions, but the most interesting results were at 1280x800. This was the resolution range where some of the quality settings ran fine and others ran too slow, so it gave us a
great starting point to understand performance while the game was in development. Figure 1, Figure 2,
and Figure 3 show the performance at 1280x800 resolution, at the predefined “Low”, “Medium”, and “High” quality settings (see the game’s graphics options). While the game does let you zoom the camera in and out from the default camera height, all tests were done at the default zoom level.
Quality 1280x800
Frame rate (FPS)
Low 33
Medium 20
High 20
Figure 1: Prologue

Quality 1280x800
Frame rate (FPS)
Low 32
Medium 17
High 14
Figure 2: Ork Campaign – Typhon Primaris
Quality 1280x800
Frame rate (FPS)
Low 37
Medium 19
High 17
Figure 3: Space Marine Campaign – Calderis
Of those scenes, the Ork scene (Figure 2) had the lowest frame rates.

Retribution also includes a built-in Performance Test that shows a representative battle. It’s a great way to simulate a multiplayer game workload in a repeatable way. If you’re developing a multiplayer game, you should consider adding a built-in performance test like this; it’s great to give your customers a quick way to see the performance of their configuration settings. It’s also a very handy way to benchmark. (To find the Performance Test in Retribution, look in Graphics Options.)
Figure 4 shows the results of running the Performance Test at “Low”, “Medium”, and “High” quality settings. Here we didn’t need to use Fraps to collect the data. The game reports average, min, and max results with the average shown here.
Quality 1280x800
Frame rate (FPS)
Low 31
Medium 17
High 15
Figure 4: Performance Test
Even though we were just picking a workload for benchmarking, this was a good time to start thinking about what we saw. These tests suggested a number of possible contributors to frame rate, but the number of characters had no large effect on the frame rate. Later experiments would help us narrow it down. At this point, our working theory was that the terrain was affecting the frame rate more than other elements of the scene were. There are other tools in the HUD to help with a rough assessment of this. See the discussion of wireframe below.
Looking across all of the campaign scenes and the Performance Test, we saw good performance at Low quality settings. Although the game was playable at 15 FPS, both Medium and High quality left some room for improvement. We decided to focus our attention on Medium quality first. The Performance Test and the Ork scene had about the same average frame rate, which was slower than the other two cases. Of the two, it was easy to capture nearly-identical frames each time we brought up the Ork campaign. This let us easily make changes and consistently test them. We expected that performance improvements we made for the Ork scene would improve the Performance Test as well (and we confirmed that later).
So, the rest of this analysis was done using the Ork scene shown above, at 1280x800 resolution and Medium quality, unless noted.

Major bottleneck: On the CPU or GPU?
With a workload to study, it was time to locate the major bottleneck. If the game was mostly GPU bound, we could speed up the game by making graphical changes.
Intel GPA can install a HUD that runs on top of your game. Figure 5 shows it running on Retribution. This HUD shows real-time performance metrics and lets you take different kinds of captures of your game as it runs. The HUD also includes some simple tests so you can check in real time if your game has a GPU bottleneck. These tests (known as overrides) let you change aspects of how the graphics pipeline works or change in real time how the game presents content to the driver and hardware, so you can measure the impact of those changes. Since you see and measure the changes from each override in real time, you can get a very quick sense of how the game is spending its time.
Figure 5: GPA HUD on top of the Ork scene, showing real-time metrics
The simplest override is the Disable Draw Calls override. With this override, all draw calls into the graphics driver are short-circuited, so they return immediately without doing anything. Since draw calls are discarded, the game display goes black while the override is in use. This does not disturb the rest of the rendering, so the game continues to run although we can’t see anything. The relative change in frame rate shows whether the draw calls are consuming a small or large amount of the frame time.

We also have the Null Hardware override. When Null Hardware is used, the driver processes all calls as usual, but simply discards all calls and data as they would normally be provided to the hardware. The Null Hardware override thus includes all the overhead of the driver; the Disable Draw Calls override does not include any driver overhead for draw calls. The Null Hardware override lasts for a few seconds before reverting (you can configure its duration in Properties).
By comparing the performance using these overrides with the original frame rate, you can see how much of each frame was spent in the hardware, in the graphics driver, and in game code plus DirectX* and the operating system.
The HUD also supplies a number of other overrides. Table 1 shows the ones we tried, along with their results for this scene.
Table 1: Overrides and their performance
Override FPS
Original – baseline 16
Disable Draw Calls 105
Null Hardware 52
Simple PS 52
2x2 Textures 25
1x1 Scissor Rect 51
When we compared the original frame rate to Disable Draw Calls, we saw a large performance jump. This told us that the draw calls (in both the driver and the hardware) were taking a large portion of the frame time. With this override, the frame rate went from 16 FPS to 105 FPS, a 6.6x speedup! This override shows how your game would run if the graphics driver and hardware were infinitely fast. Without any graphics driver or hardware time, this game ran at 105 FPS. Clearly, this game was bound somewhere in the GPU hardware and/or driver.
Looking at the other results, we saw Null Hardware run at 52 FPS, about a 3.3x speedup. This is about half of the Disable Draw call frame rate, so clearly a large amount of each frame is spent in the graphics driver, but an even larger part of the frame is spent in the hardware.
To better understand how the hardware was getting used in real time, we tried a few other overrides. But what do they show? The 2x2 Textures override shows how the game runs with simple textures (reducing texture load times and texture processing in pixel shaders). The 1x1 Scissor Rect override turns off pixel processing by passing only a single pixel through the pipeline. Finally, the Simple PS override replaces all pixel shaders with a trivial shader that emits a constant color.

These overrides told the rest of the story. Reducing the game to a single pixel gave a frame rate about the same as null hardware. Swapping to a simple pixel shader also gave about the same performance as null hardware. Using simple textures we saw a 1.6x speedup, which is only a modest gain when compared with the Null Hardware result. So, some amount of each frame was dominated by the use of more complex textures, but the majority of the frame time in the hardware was spent processing pixels in the pixel shaders.
Other overrides will sometimes show interesting results at this point, but this combination gave us a clear direction for more analysis. In particular, for other games you might learn much from the Z, culling, and alpha overrides, and from showing overdraw visualization and wireframe.
To confirm that we were bottlenecked in the hardware, we also used GPUView (from the Windows* Performance Toolkit, part of the Windows SDK). When we looked at the CPU queue, we could see that the queue was full all the time. This showed that the hardware always had queued work available for it, so we knew that the game was running faster than the hardware could process.
Figure 6: GPUView shows a full context CPU queue
In Figure 6, the GPU HW queue is at the top, and the context CPU queue is the large, filled region on the bottom. You can see the commands flow down in the queue over time. Here we clicked on one Present packet to highlight it. You can see it progress down the queue until it was processed on the right of the figure.

In this trace, the queue held about 2.5 frames worth of commands at all times (when the queue is this full, you can tell by scrolling through the queue and counting the Present packets). It’s good for a game to pipeline its frames to keep slower graphics hardware from going idle between frames, as long as you’re careful to not run too far ahead. Later experiments confirmed that Retribution pipelined at most three frames in the queue. Any more would have started to add a noticeable UI latency, so this looked like the right amount of queued work.
It was now clear that our bottleneck was in the GPU hardware. Armed with this information, it was almost time to capture a frame for deeper analysis. But first, we could learn more by looking at real-time data in the HUD.
More real-time data: Roughly what were we doing?
The real-time counters displayed by the HUD can give a good sense of how a frame runs. Using Intel GPA on any DirectX graphics hardware, the HUD shows HW and SW counters from the CPU and DirectX. When Intel GPA run on Intel graphics hardware, they also show hardware counters that are specific to Intel graphics hardware.
The HUD can show four counters at a time. You can show different counters by looking at the HUD monitor’s profile settings. Changes take effect immediately.
First, we noted all the metrics that the HUD can display. Then we did some experiments with the overrides in the HUD and captured those values as well to see how the data changed.
The data in Table 2 shows a few areas for investigation, but mostly we confirmed what we found by looking at the frame rate changes from the overrides. A large amount of each frame was spent on the GPU, and most of that was in pixel shaders.

Table 2: Counter detail with overrides
Counter No Overrides
Simple PS
2x2 Tex 1x1 Scissor
Notes
FPS 16 52 25 51
Draw calls 675 Same Same Same Good; calls were batched well.
Vertices 3M Same Same Same A fairly large number of vertices.
VS Invocations
883K Same Same Same
Pixels Rendered
7M 8M 7-8M 4
%GPU EUs Active
40% 33% 58% 35% Active Execution Units (EUs) were relatively low. Look at how to keep the EUs more active.
%EUs Active in PS
78% 11% 76% 3% Most EUs were running pixel shaders.
%EUs Active in VS
22% 89% 24% 97% The rest were running vertex shaders.
%GPU EUs stalled
45% 35% 30% 40% A fairly high amount of stalls, only improved somewhat by simplifying the pixel shader, texture, and reducing the pixel count.
%EUs Stalled in PS
80% 26% 60% 6% Most stalled EUs were in pixel shaders.
%EUs Stalled in VS
19% 74% 40% 94% A few of the stalled EUs were running vertex shaders.
GPU Frequency
1300 Mhz Same Same Same Good; this GPU has a variable frequency, and it was running at its maximum.
%Samplers Stalled
1% 0% 2% 0% Texture stalls weren’t the problem.
%Samplers Busy
80% 3% 63% 3% Texture samplers were busy.
PS Duration (µsecs)
40K 2400 23K 500 Nearly all frame time was spent here.
Primitive count
847K Same Same Same
Post clip Prim count
503K Same Same Same
PS Invocation 13M Same Same 4
PS killed pixels
1M 406K 813K 0

Counter No Overrides
Simple PS
2x2 Tex 1x1 Scissor
Notes
Clipper Invocations
847K Same Same Same
Locks per frame
158 Same Same Same
Lock time per frame
80 µsecs Same Same Same Locking was not slowing the frame.
GPU Texture Reads
415M bytes
5M 4-6M 4M
Texture Mem Reads
7B bytes/sec
220M 130M 230M
Post-Filter Texels
71M 1M 67M 1M
RT Changes 8 Same Same Same A modest number of render targets. Reducing this might speed up the frame.
RT Data Gets 0 0 0 0
State Changes
9945 Same Same Same Lots of state changes. Reducing this might speed up the frame.
With this information, it was time to capture a single frame, so we could study how we were spending time in the pixel shaders.
Looking at a frame: Details emerged
After capturing a frame in the Intel GPA HUD and exiting the game, we used the Intel GPA Frame Analyzer to show the frame with detailed stats about how it was drawn. In Frame Analyzer, the frame is also “live” and can be experimented on, so you can try various changes and see the impact.
Figure 7 shows how Frame Analyzer displays all the calls across the captured frame. Each unit of work (an “erg”) in the frame is drawn at the top, and the rest of the window holds various summary and detail panes. We can display the ergs in various ways to better understand them. The default view is shown here, but it can also be useful to plot GPU breakdown vs. GPU duration. See the dropdowns in the corner for various options.
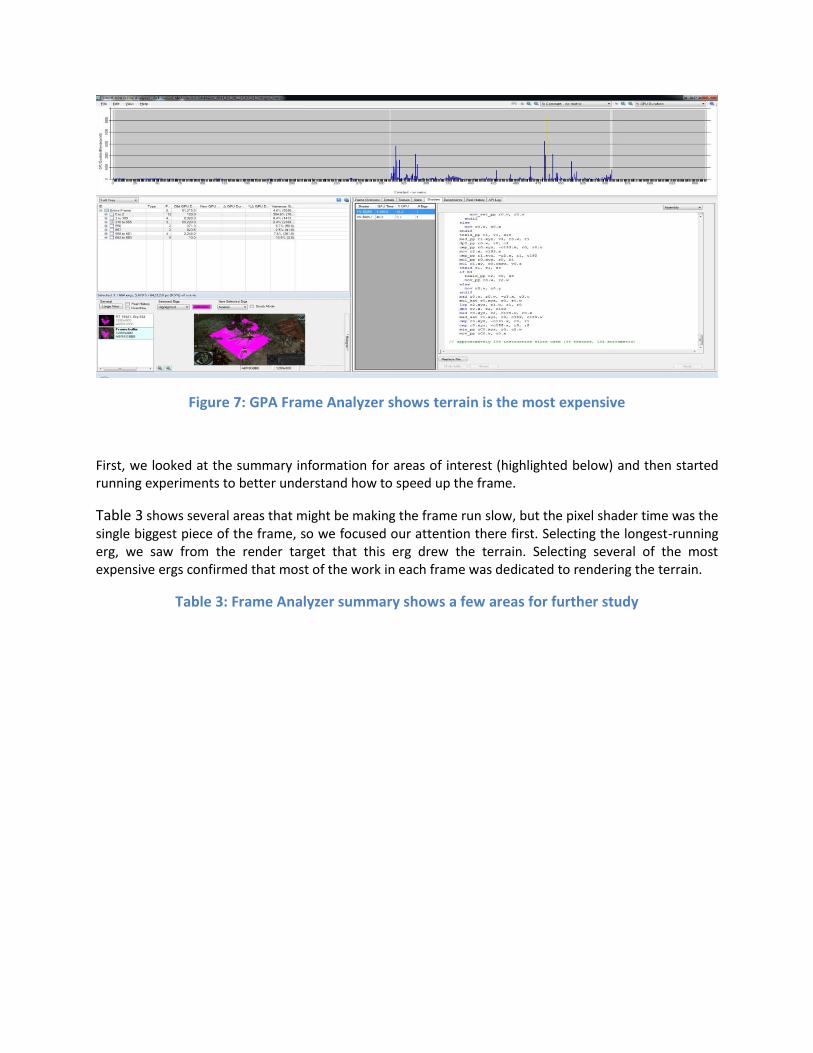
Figure 7: GPA Frame Analyzer shows terrain is the most expensive
First, we looked at the summary information for areas of interest (highlighted below) and then started running experiments to better understand how to speed up the frame.
Table 3 shows several areas that might be making the frame run slow, but the pixel shader time was the single biggest piece of the frame, so we focused our attention there first. Selecting the longest-running erg, we saw from the render target that this erg drew the terrain. Selecting several of the most expensive ergs confirmed that most of the work in each frame was dedicated to rendering the terrain.
Table 3: Frame Analyzer summary shows a few areas for further study

Metric Data Notes
Main GPU Duration 62 ms
VS Duration 10.5 ms Not as long as the PS duration, but the frame still spent a lot of time in vertex shaders.
PS Duration 40.6 ms The majority of the frame time was here.
Input Assembler
Vertices 2.5 M Vertex count was a bit high.
Primitives 834 K
Vertex Shader
VS Invocations 868 K
Rasterizer Clipper Invocations
834 K
Post-Clip Primitives
491 K
% Clipper Active 0.0%
% Prim Setup Active
0.3%
Pixel Shader PS Invocations 12.5 M This is high and may have been slowing the frame; there were ~1M pixels in the final render target.
PS Killed Pixels 1.3 M Many pixels killed. How can we keep them from getting killed?
Execution Units
GPU EUs Active 40%
GPU EUs Stalled 44%
EUs Active in VS 22%
EUs Active in PS 78%
EUs Stalled in VS
20%
EUs Stalled in PS
80%
Output-Merger
Pixels Rendered 7.24 M
Blended Pixels 5.2 M
Texture Sampler
%Sampler Busy 80%
Post-Filter Texels
70 M
%Sampler Stalled
0.7%
Memory GPU Texture Reads
452 MB Reading a large amount of textures each frame.

Frame budget: Confirming that terrain was expensive
It can be useful to look at your game’s frame “budget”, to see how much of each frame is spent on each part of its rendering. This lets you decide if the right amount of each frame is devoted to the right geometry and the right look. By selecting different ergs among the longest-running group of ergs, we could see that most of the longest-running ergs were dedicated to rendering the terrain. But how much?
To find out, we manually picked different ergs to see which ones rendered the terrain. Tip: often, terrain work is grouped together, so the terrain ergs are next to each other in the timeline, and can be multiply selected at once. When we knew the first and last ergs that contributed to the terrain (or post-processing, or characters, or whatever), we selected all the interesting ergs to see a summary of the terrain work.
When we selected the terrain ergs, we saw that just over half of the frame time was spent on the terrain. The total frame time was 63.8 msec or 15.6 FPS. Of that, terrain time was 32.6 msec or 51% of the total frame.
Looking closer at the longest-running ergs, we saw that they had the most complex pixel shaders in the game. They tended to have many texture reads, with as many as 36 texture reads per pixel. Each shader sampled up to 8 terrain texture layers (at 4096x512), plus some additional textures.
The terrain textures looked like this:
Figure 8: Sample terrain texture

Experiments: Try to speed up the terrain
Now that we had located slow parts of the frame, it was time to try to speed up the frame. In Frame Analyzer we can change many aspects of how a frame is drawn and see the effect immediately.
Experiment: Clamping Max MIP level
With so many textures, we hoped that reducing the MIP levels of the textures might give us a large speedup.
In Frame Analyzer, we selected the ergs in question and manually overrode the MIP level on each of the terrain textures. Here’s what it looked like.
Table 4: Higher MIP levels ran faster but at much lower quality
MIP Level 0 1 2 3
Frame Time 63.8 ms
57.1 ms 51.6 ms 49. ms
% Time 89.5% 81% 77.2%
Screen snip
MIP level 1 still looked OK, but the visual quality beyond that was unacceptable. We found only a modest speedup at MIP level 1. This change might have been useful, but it would not solve the larger performance issue.
Experiment: Eliminating ‘texkill’
In Frame Analyzer, you can edit the pixel shaders directly to try various scenarios. Some of the shaders included use of ‘texkill’, which can sometimes be replaced with faster code. We tried replacing the ‘texkill’s with a fall back path that simply outputs a transparent black pixel. We found no significant performance change; the original code was fine.

Experiment: Eliminating unnecessary texture reads
Looking at the shaders more closely, we found areas that had many texture lookups. In the Terrain Tile shader (PSTileLow), every terrain texture layer is sampled and then blended. The blend uses a number of computed Weight factors and other parameters. Figure 9 shows the original shader code from PSTileLow.
Figure 9: PSTileLow shader showing layer blending
That was the PSTileLow shader. There was also a higher-fidelity version, PSTileHigh (see Figure 10). That version has similar sampling logic, but it will only sample terrain layers if the Weight is above a certain threshold value. This keeps the shader from working with textures that don’t contribute much to the desired result. Changing the PSTileLow shader to use the same technique gives a more complicated looking shader, and one we hoped might run faster.
[unroll]
for (int layer = 0; layer < maxLayers; ++layer)
{
…
albedoSum += tex2D(LayerSamplerLow[layer],
groundCoords).rgb * groundWeight;
albedoSum += tex2D(LayerSamplerLow[layer],
cliffSideCoords).rgb * cliffSideWeight;
albedoSum += tex2D(LayerSamplerLow[layer],
cliffFrontCoords).rgb * cliffFrontWeight;
}
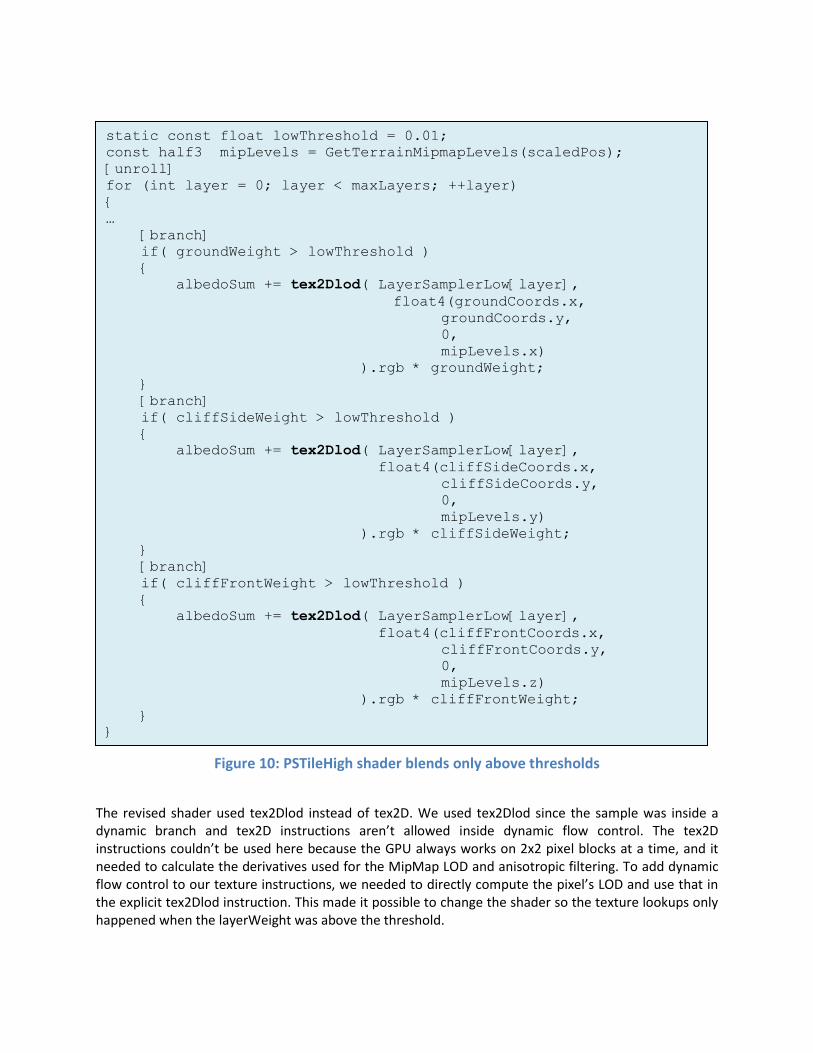
Figure 10: PSTileHigh shader blends only above thresholds
The revised shader used tex2Dlod instead of tex2D. We used tex2Dlod since the sample was inside a dynamic branch and tex2D instructions aren’t allowed inside dynamic flow control. The tex2D instructions couldn’t be used here because the GPU always works on 2x2 pixel blocks at a time, and it needed to calculate the derivatives used for the MipMap LOD and anisotropic filtering. To add dynamic flow control to our texture instructions, we needed to directly compute the pixel’s LOD and use that in the explicit tex2Dlod instruction. This made it possible to change the shader so the texture lookups only happened when the layerWeight was above the threshold.
static const float lowThreshold = 0.01;
const half3 mipLevels = GetTerrainMipmapLevels(scaledPos);
[unroll]
for (int layer = 0; layer < maxLayers; ++layer)
{
…
[branch]
if( groundWeight > lowThreshold )
{
albedoSum += tex2Dlod( LayerSamplerLow[layer],
float4(groundCoords.x,
groundCoords.y,
0,
mipLevels.x)
).rgb * groundWeight;
}
[branch]
if( cliffSideWeight > lowThreshold )
{
albedoSum += tex2Dlod( LayerSamplerLow[layer],
float4(cliffSideCoords.x,
cliffSideCoords.y,
0,
mipLevels.y)
).rgb * cliffSideWeight;
}
[branch]
if( cliffFrontWeight > lowThreshold )
{
albedoSum += tex2Dlod( LayerSamplerLow[layer],
float4(cliffFrontCoords.x,
cliffFrontCoords.y,
0,
mipLevels.z)
).rgb * cliffFrontWeight;
}
}

Although Frame Analyzer isn’t a full shader debugger, we can change the shader by hand (dynamically), to test our changes. In this case, when we changed the shader, we saw some significant changes.
Table 5: Threshold check speeds up the frame
Original w/ Threshold check Speedup
Terrain Render time 32.57 ms 14.75 ms 2.2x
Total Frame Time 63.99 ms 46.06 ms 1.4x
Adding the threshold check gave us a major speedup on the slowest part of the frame and a significant speedup to the whole frame. To understand this change even better, we wondered if reducing the memory reads per pixel would give a speedup. So we looked at the MIP level of the textures in question to give us smaller textures to load. Table 6 shows the results, highlighting the significant differences.
Table 6: Adding threshold check makes shaders run faster
Metric Experiments on Medium
Original Threshold check
Threshold check + MIP clamp to 1
FPS 1 / FrameTime 15.6 FPS 21.7 FPS 22.1 FPS
Main GPU Duration 62 ms 43 ms 42 ms
VS Duration 10.5 ms 10.1 ms 10 ms
PS Duration 40.6 ms 27.7 ms 26.9 ms
Execution Units GPU EUs Active 40% 51% 52%
GPU EUs Stalled 44% 37% 36%
EUs Active in VS 22% 25% 25%
EUs Active in PS 78% 76% 76%
EUs Stalled in VS 20% 30% 31%
EUs Stalled in PS 80% 70% 69%
Texture Sampler %Sampler Busy 80% 72% 72%
Post-Filter Texels 70 M 40 M 40 M
%Sampler Stalled 0.7% 1.5% 1.6%
Memory GPU Texture Reads 460 MB 81 MB 53 MB
The modified pixel shader with the threshold check did run faster. As we expected, the overall frame ran faster, and we showed a significant reduction in GPU duration and specifically in PS duration. There is a reasonable drop in post-filter texels, as we would expect, and a significant drop in GPU texture reads. While clamping the MIP level to 1 also ran slightly faster, that gain was small in comparison. Also, the frame looked nearly identical to the original frame, so changing this shader had no negative effects.

So, the MIP change was not worthwhile, but the pixel shader edits were a major speedup. These results were measured when the few most expensive shaders were changed by hand. When all similar shaders were changed across the game, the frame rate went up to 24 FPS.
Experiment: Avoiding overdraw of pixels under HUDs Looking at the game, there are two significant HUD areas: the mini-map and the unit info/command area. Both areas contain irregular opaque objects that get rendered on top of everything else on the screen. They’re highlighted in Figure 11.
Figure 11: These HUDs cover ~10% of the screen real estate
All pixels rendered beneath the HUD are simply overdrawn when the HUD is rendered. They take up roughly 10% of the screen real estate. What if there was a way to avoid that overdraw by not rendering those pixels in the first place? It sounds simple to avoid calculating the wasted pixels by reordering, so the HUD is rendered first. That way, we could let the graphics hardware’s early-Z detection save us from calculating any pixel beneath the HUD. This was not so simple here because the game uses multiple render targets. The game has render passes for color, lighting, and post processing. It wouldn’t make sense to draw the HUD first, because then the HUD would be subject to post processing passes.

It is possible to block out the HUD regions in the earlier render targets using simple quads with a depth of zero. This could be as simple as issuing one extra Clear call right after clearing the surface at the start of the frame. This Clear would set the depth buffer to zero for the rectangular parts of the frame that would eventually hold the HUD. When the Intel engineers were considering this, they did not have access to the source code to make this change. Instead, an internal development tool was used to block out these rectangles in all the overdrawn render targets. This increased the frame rate from 24 to 27 FPS, for a 1.1x speedup. Because of the added complexity of in-game toggles for the HUD and varying HUD locations (e.g., between letterbox and widescreen modes), implementing this would have required significant engineering as well as content pipeline changes, so this change was postponed. There are also other HUDs that might have theoretically yielded a still bigger speedup, but they’re very small and would have had minimal impact.
Results in the final game
After incorporating the shader threshold changes discussed above, the game runs much faster. Before optimization, the Ork scene ran at 17 FPS at 1280x800 and Medium quality. Running on the latest graphics drivers, the released game runs at 24 FPS, or a 1.4x speedup. The same change also yields a similar speedup at low quality and similar speedups on other levels and on the game’s built-in Performance Test.
Now, when we examine a frame, we see much less time spent on the terrain. Figure 12 shows the frame capture with the terrain ergs highlighted. From the highlighted parts of the frame preview, you can see that this is terrain.
Figure 12: Terrain now takes up a smaller part of the frame

Looking at the same view but displaying the ergs with GPU duration and GPU breakdown, it is even more obvious. In Figure 13 we can see that the terrain takes up about 26% of the frame, which is a big improvement. Before these changes, terrain had taken over half of the frame. This confirms that the single biggest bottleneck on the GPU has been optimized.
Figure 13: Terrain shown with GPU duration and breakdown
Looking at this another way, how much did the CPU and GPU workload balance change from optimization? The HUD overrides give us a fast way to tell.
Table 7: Overrides before and after changes
Override Original FPS Final FPS
Original – baseline 16 24
Disable Draw Calls 105 100
When we run with draw calls disabled, the game runs at about the same speed as before. This shows that the performance of the game on the CPU is largely unchanged. The actual FPS, though, tells the whole story; it’s significantly faster due to speeding up the slowest terrain pixel shaders.

Conclusion
This case study shows some useful techniques for finding graphics bottlenecks and making and measuring experimental changes. There are more techniques that can be used. Retribution did not have this issue, but if your game has intermittent drops in frame rate, you can set up triggers from the Intel GPA Monitor to capture the slow frames. If you’re not sure what the data means, the newest versions of Intel GPA include a feature called Advisor that can make recommendations based on your measurements. Advisor was first released as a Beta feature in version 4.3.
We hope these techniques are useful for you on your project! You can learn more about Intel GPA and download it from www.intel.com/software/gpa.
About the authors
Paul Lindberg is a Senior Software Engineer in Developer Relations at Intel. He helps game developers all over the world to ship kick-ass games for the PC.
Doraisamy Ganeshkumar is a Senior Software Engineer on the Intel Developer Relations team. He helps PC game developers optimize pre-launch titles using the latest Intel technologies. His current focus is to help provide the best Out of Box gaming experience for PC gamers.
Special thanks to Juancho Buchanan and Karl Schmidt from Relic and Mark DeLoura and Morten Haugaard from THQ for all their work on performance improvements to the game and contributions to this case study.
Notices INFORMATION IN THIS DOCUMENT IS PROVIDED IN CONNECTION WITH INTEL PRODUCTS. NO LICENSE, EXPRESS OR IMPLIED, BY ESTOPPEL OR OTHERWISE, TO ANY INTELLECTUAL PROPERTY RIGHTS IS GRANTED BY THIS DOCUMENT. EXCEPT AS PROVIDED IN INTEL'S TERMS AND CONDITIONS OF SALE FOR SUCH PRODUCTS, INTEL ASSUMES NO LIABILITY WHATSOEVER AND INTEL DISCLAIMS ANY EXPRESS OR IMPLIED WARRANTY, RELATING TO SALE AND/OR USE OF INTEL PRODUCTS INCLUDING LIABILITY OR WARRANTIES RELATING TO FITNESS FOR A PARTICULAR PURPOSE, MERCHANTABILITY, OR INFRINGEMENT OF ANY PATENT, COPYRIGHT OR OTHER INTELLECTUAL PROPERTY RIGHT. UNLESS OTHERWISE AGREED IN WRITING BY INTEL, THE INTEL PRODUCTS ARE NOT DESIGNED NOR INTENDED FOR ANY APPLICATION IN WHICH THE FAILURE OF THE INTEL PRODUCT COULD CREATE A SITUATION WHERE PERSONAL INJURY OR DEATH MAY OCCUR. Intel may make changes to specifications and product descriptions at any time, without notice. Designers must not rely on the absence or characteristics of any features or instructions marked "reserved" or "undefined." Intel reserves these for future definition and shall have no responsibility whatsoever for conflicts or incompatibilities arising from future changes to them. The information here is subject to change without notice. Do not finalize a design with this information. The products described in this document may contain design defects or errors known as errata which may cause the product to deviate from published specifications. Current characterized errata are available on request. Contact your local Intel sales office or your distributor to obtain the latest specifications and before placing your product order.

Copies of documents which have an order number and are referenced in this document, or other Intel literature, may be obtained by calling 1-800-548-4725, or go to: http://www.intel.com/design/literature.htm Software and workloads used in performance tests may have been optimized for performance only on Intel microprocessors. Performance tests, such as SYSmark and MobileMark, are measured using specific computer systems, components, software, operations, and functions. Any change to any of those factors may cause the results to vary. You should consult other information and performance tests to assist you in fully evaluating your contemplated purchases, including the performance of that product when combined with other products. Any software source code reprinted in this document is furnished under a software license and may only be used or copied in accordance with the terms of that license. Intel, Core, and the Intel logo are trademarks of Intel Corporation in the US and/or other countries. Copyright © 2012 Intel Corporation. All rights reserved. *Other names and brands may be claimed as the property of others.


![[Warhammer] Warhammer 40,000 Roleplay - Dark Heresy - Character Folio](https://static.fdocuments.net/doc/165x107/55cf916c550346f57b8d6eec/warhammer-warhammer-40000-roleplay-dark-heresy-character-folio.jpg)