Walton County Chamber of Commerce February 12, 2014 1.Examine the Data for Education in Georgia...
36
-
Upload
janet-rowlison -
Category
Documents
-
view
213 -
download
0
Transcript of Walton County Chamber of Commerce February 12, 2014 1.Examine the Data for Education in Georgia...


Walton County Chamber of Commerce
February 12, 2014
1. Examine the Data for Education in Georgia
2. Economic Impact of Georgia Non-
Graduates
3. Strengthening the Birth to Work Pipeline
4. What Can We Do?

Examine the Data for Education in Georgia

Academic Achievement Milestones
School Readiness
Literacy by 3rd Grade
Numeracy by 8th Grade
High School Graduation
Workforce and/or College Ready

School ReadinessPercent of Children with School Readiness Skills

NAEP 4th Grade ReadingPercent At or Above Proficient
2005 2007 2009 2011 201325%
27%
29%
31%
33%
35%
37%
39%
33%
35% 35%
34%
37%
30%31%
32%32%
34%
26%
28% 28%
32%
34%
20th StateU.S.Georgia

2005 2007 2009 2011 201320%
22%
24%
26%
28%
30%
32%
34%
36%
38%
40%
31%
35%36% 37% 37%
29%
31%
33%
34% 34%
23%
25%
27%
28%29%
20th StateU.S.Georgia
NAEP 8th Grade MathPercent At or Above Proficient

Georgia High School Graduation Rates
Source: The Governor’s Office of Student Achievement, State Report Cards.
Year WaltonCounty Social Circle
State High School
Graduation Rate
2011 74.7% 68.5% 67.5%
2012 74.2% 71.9% 69.7%
2013 80.7% 75.6% 71.5%
StatewideHigh School Drop-
Outs
21,844
22,155
21,401
65,400
Economic Impact of Georgia Non-Graduates

Education Pays
Source: *U.S. Bureau of Labor Statistics Table A-4. Employment status of the civilian population 25 years and over by educational attainment.
**U.S. Bureau of Labor Statistics Table 5. Quartiles of usual weekly earnings of full-time wage and salary workers.
EDUCATIONAL ATTAINMENT & EMPLOYMENT
Unemployment Rate* December 2013
Median Wkly Earnings** (& approx.
annual)
15% 10% 5% 0% 0 200 600 1000
3.3 Bachelor’s Degree & Higher $1,189 ($61,828)
6.1 Some college/ Associate Degree $741 ($38,523)
7.1 HS Graduates, No College
$651 ($33,852)
9.8 Less than a High School Diploma
$457 ($23,764)

High School Graduation Rates by County, 2012

Unemployment Rate by County, May 2013

Compounded Impacts of High School Non-Completion
Source: Levin, H., et al., (2007). The Costs and Benefits of an Excellent Education for All of America’s Children.
INDIVIDUALS THE COMMUNITY
Lower Lifetime Earnings Reduced buying power & tax revenues; less economic growth
Decreased health status; Higher mortality rates; More criminal activity
Higher health care & criminal justice costs
Higher teen pregnancy rates; Single motherhood
Higher public services costs
Less voting; Less volunteeringLow rate of community involvement

Strengthening the Birth to Work Pipeline

Strengthening the Birth to Work Pipeline
KEY ISSUE
#1Early Life Experiences
KEY ISSUE
#2Academic Achievement K-12
KEY ISSUE
#3Transitions to Work or College

0
200
400
600
800
1000
1200
9 12 15 18 21 24 27 30 33 36
Age of child in months
Voc
abu
lary
Siz
eDisparities in Early Vocabulary Growth
Source: Hart, B. and Risley, T. R. (2003). “The Early Catastrophe: The 30 Million Word Gap by Age 3.”
Professional Families 1,116 words
Working Class Families 749 words
Welfare Families 525 words

Economic Benefits of Early Education:Perry Preschool Study
Source: Schweinhart, L.J., et al. (2005). Lifetime effects: The High/Scope Perry Preschool study through age 40.
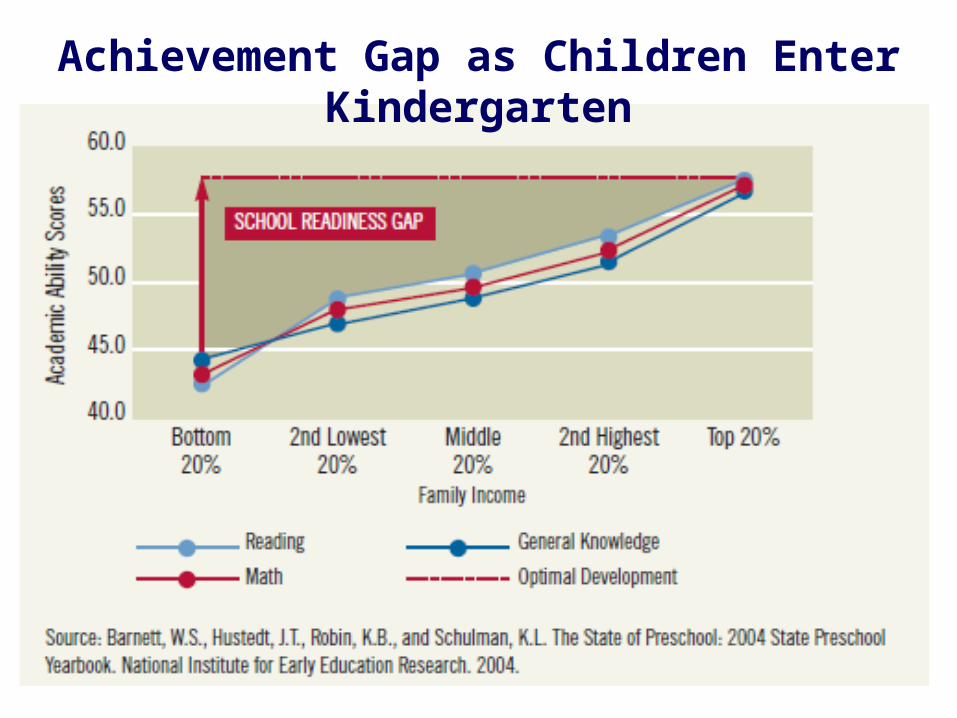
Achievement Gap as Children Enter Kindergarten

Essential Building Blocks of High Performing States
Higher Standards
Rigorous Curriculum
Clear Accountability System
Statewide Student Information System
Leadership Training

The Changing Face of Georgia
Series1
0% 10% 20% 30% 40% 50% 60%
White 8%
All 16%
African-American 20%
Living in poverty 38%
Asian 45%
Hispanic 49%
2001-2010: Percent Population Increase

4-Year Graduation Rate, 2013Georgia Walton
CountySocial Circle
All 72% 81% 76%
Asian 82% 100% N/A
White 79% 82% 81%
African-American 64% 74% 62%
Hispanic 62% 87% N/A
Low-Income 63% 73% 61%
English Language Learners
44% N/A N/A

100 Georgia Ninth Graders
* Data provided by the Technical College System of Georgia . Based on 2008 graduation data

Predicted Workforce Gap
Source: Complete College Georgia,: Georgia’s Higher Education Completion Plan 2012
42%
2012 2020
43% Current Path
60% Complete College Georgia
250,000 additional graduates
Georgia’s Young Workforce with a Certificate or College Degree
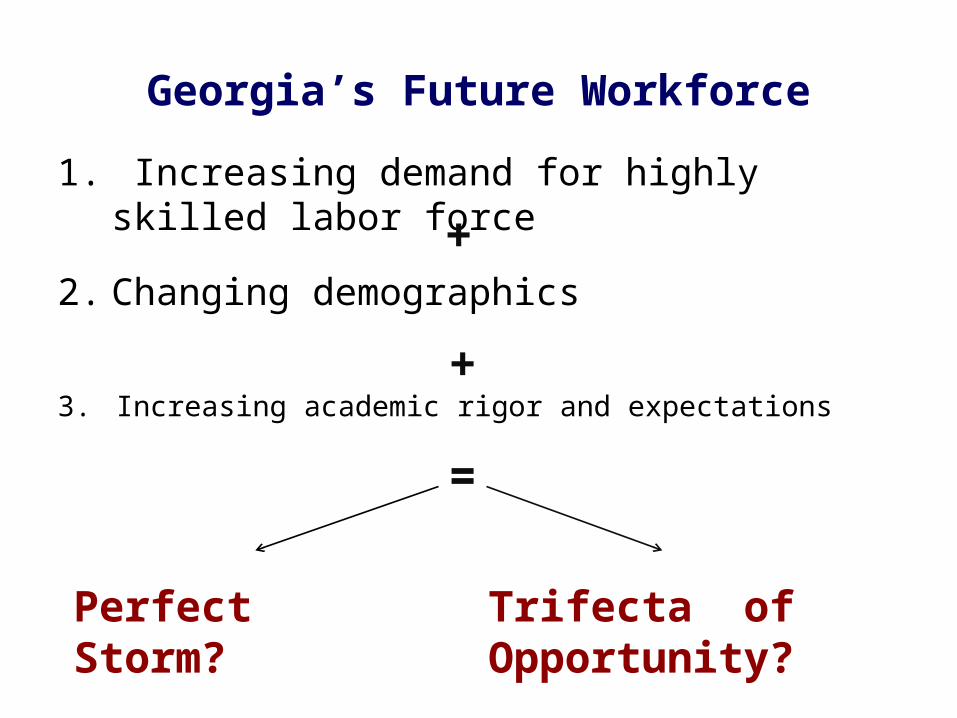
3. Increasing academic rigor and expectations
Georgia’s Future Workforce
1. Increasing demand for highly skilled labor force
2. Changing demographics+
+
=
Perfect Storm? Trifecta of Opportunity?

What can we do?

Profile of Child, Family and Community Wellbeing – Walton County*
Indicator Year Walton County Rate
Georgia Rate
Low birth weight 2011 10.1% 9.4%
Teen pregnancies, ages 15-17 (per 1,000) 2011 18.6 28.1
Substantiated incidents of Child Abuse and/or neglect (per 1,000)
2012 7.0 8.0
Incidences of STDs, ages 15-19 (per 1,000) 2012 37.0 28.6
Children absent more than 15 days from school 2012 8.6% 8.4%
Teens not in school and not working, ages 16-19
2012 15.1% 11.1%
High school graduates eligible for HOPE scholarship
2011 40.6% 33.2%
Children living with single parent 2012 22.6% 33.2%
Children living in poverty 2012 21.9% 27.3%
* Data provided by Georgia Kids Count, Georgia Family Connection Partnership, http://www.gafcp.org

3rd Grade Reading Achievement in Georgia:Closing the Gaps
Source: Georgia Department of Education.
% of Students Exceeding Standards
2010 2011 2012 2013-10%
0%
10%
20%
30%
40%
50%
60%
70%
All Black HispanicWhite Low-Income

3rd Grade Reading Achievement
Source: Georgia Department of Education.
% of Students Exceeding Standards
2010 2011 2012 201320%
30%
40%
50%
60%
70%
36%
40%
51%
37%
45%
52% 56%
34%
39%
47%
61%
Georgia Walton County Social Circle

8th Grade Math Achievement in Georgia:Closing the Gaps
Source: Georgia Department of Education.
% of Students Exceeding Standards
2010 2011 2012 20130%
5%
10%
15%
20%
25%
30%
35%
40%
45%
All Black HispanicWhite Low-Income
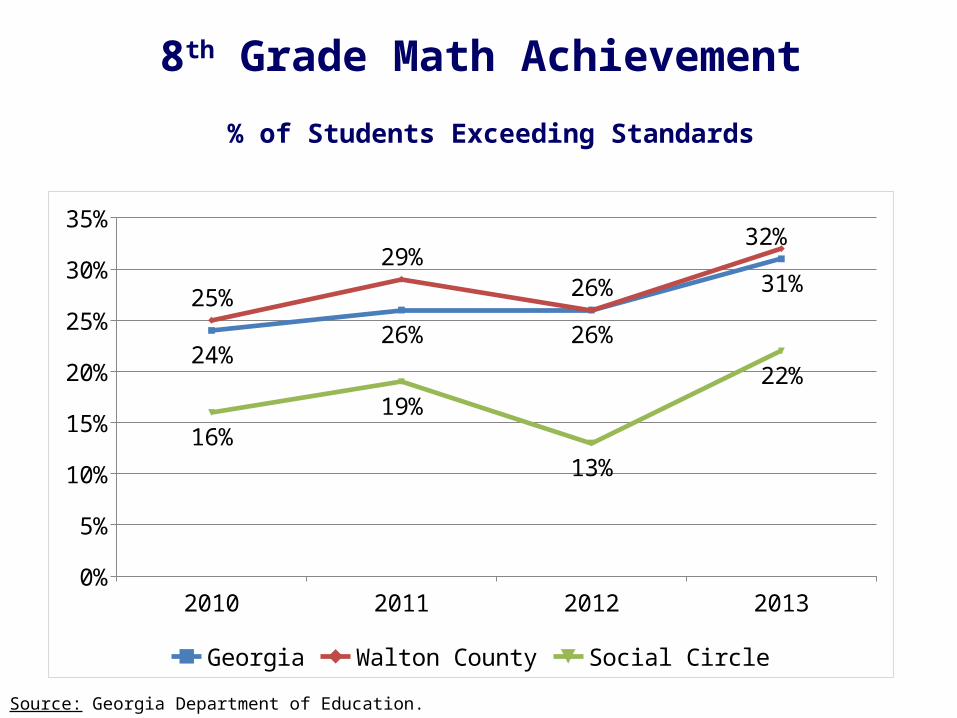
8th Grade Math Achievement
Source: Georgia Department of Education.
% of Students Exceeding Standards
2010 2011 2012 20130%
5%
10%
15%
20%
25%
30%
35%
24%26% 26%
31%25%
29%26%
32%
16%19%
13%
22%
Georgia Walton County Social Circle
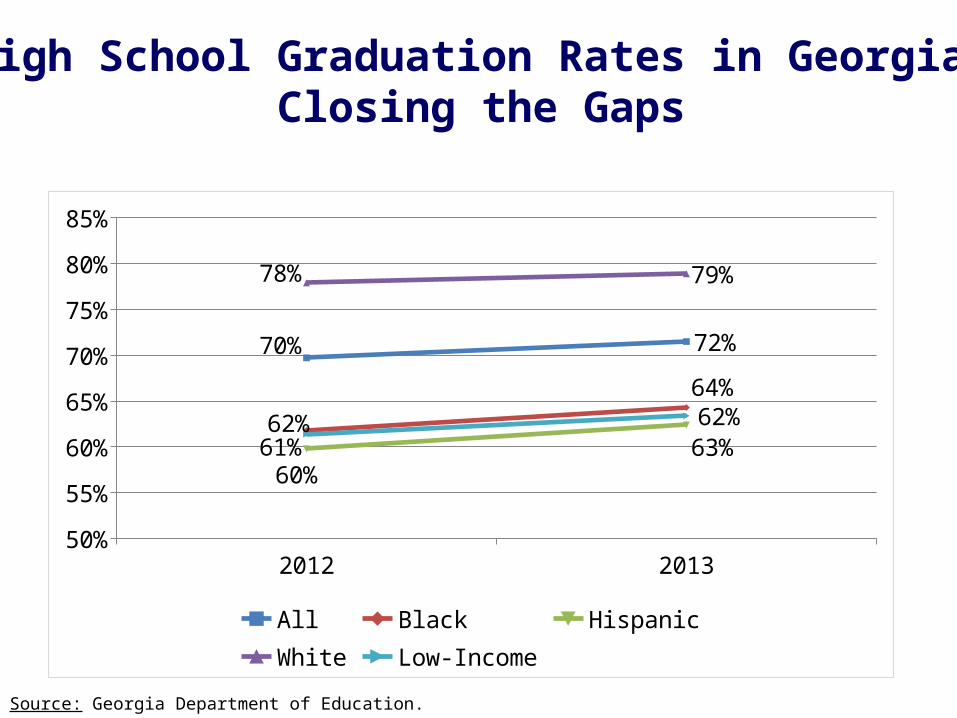
High School Graduation Rates in Georgia:Closing the Gaps
Source: Georgia Department of Education.
2012 201350%
55%
60%
65%
70%
75%
80%
85%
70% 72%
62%
64%
60%
62%
78% 79%
61% 63%
All Black HispanicWhite Low-Income

High School Graduation Rates in Georgia:Closing the Gaps
Source: Georgia Department of Education.
2011 2012 201360%
65%
70%
75%
80%
85%
68%70%
72%
75%74%
81%
69%72%
76%
Georgia Walton County Social Circle

How Will You Insulate the Birth to Work Pipeline?
LEARNING & SOCIAL SUPPORTS
Childcare Providers
Afterschool Programs
Academic Supports
Job Training
Civic Opportunities
Early Childhood
K – 12 SystemPost Secondary
Work & Career
ESSENTIAL COMMUNITY SERVICES
Transportation Health Housing Financial
Source: The Forum for Youth Investment
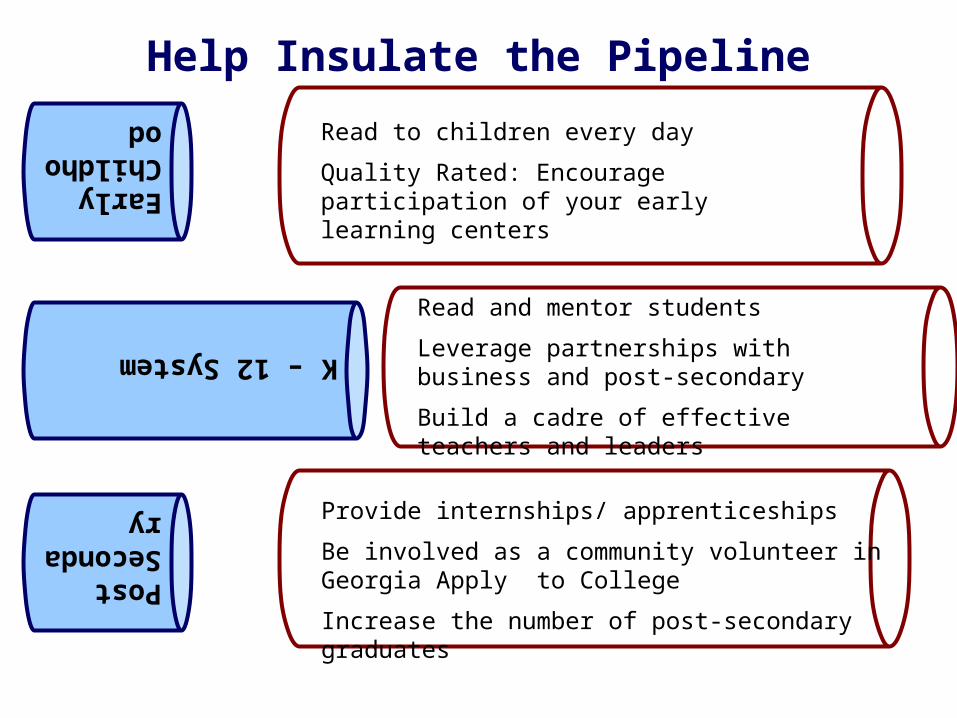
Help Insulate the Pipeline
Post Secondary
Read to children every day
Quality Rated: Encourage participation of your early learning centers
Read and mentor students
Leverage partnerships with business and post-secondary
Build a cadre of effective teachers and leaders
Provide internships/ apprenticeships
Be involved as a community volunteer in Georgia Apply to College
Increase the number of post-secondary graduates
Early Childhood
K – 12 System

Aligning Educational Strategies
Aligned Acts of Improvement
Random Acts of Improvement
GOALS
GOALS

Connect with us
Twitter: @GAPartnership Facebook: Georgia Partnership for Excellence in Education Instagram: @GAPARTNERSHIP
LinkedIn: Georgia Partnership for Excellence in Education
Website: www.gpee.org