Walter C. Babel III SAIC Qamar A. ShamsNASA Langley Research Center James F. BockmanNASA Langley...
44
Walter C. Babel III SAIC Qamar A. Shams NASA Langley Research Center James F. Bockman NASA Langley Research Center Qualitative Analysis of MEMS Microphones Qualitative Analysis of MEMS Microphones 16th ANNUAL 2004 INTERNATIONAL MILITARY & AEROSPACE / 16th ANNUAL 2004 INTERNATIONAL MILITARY & AEROSPACE / AVIONICS COTS CONFERENCE, EXHIBITION & AVIONICS COTS CONFERENCE, EXHIBITION & SEMINARS SEMINARS
-
Upload
christian-kenne -
Category
Documents
-
view
219 -
download
1
Transcript of Walter C. Babel III SAIC Qamar A. ShamsNASA Langley Research Center James F. BockmanNASA Langley...

Walter C. Babel III SAICQamar A. Shams NASA Langley Research CenterJames F. Bockman NASA Langley Research Center
Qualitative Analysis of MEMS MicrophonesQualitative Analysis of MEMS Microphones
16th ANNUAL 2004 INTERNATIONAL MILITARY & AEROSPACE /16th ANNUAL 2004 INTERNATIONAL MILITARY & AEROSPACE /AVIONICS COTS CONFERENCE, EXHIBITION &AVIONICS COTS CONFERENCE, EXHIBITION &
SEMINARSSEMINARS

Introduction
MEMS Microphones are desirable for NASA applications
because they have:•Small Volume
•Low Mass
•Low Power
•Low Voltage
•Low Cost
Before they can be used in mission-critical applications, they need to be thoroughly tested

B&K 4134 Microphone Overview
•Very High Quality•Industry Standard•PULSE System/Software•High Voltage Required

Electret Microphone Overview
•Small•Cheap•Lower Quality
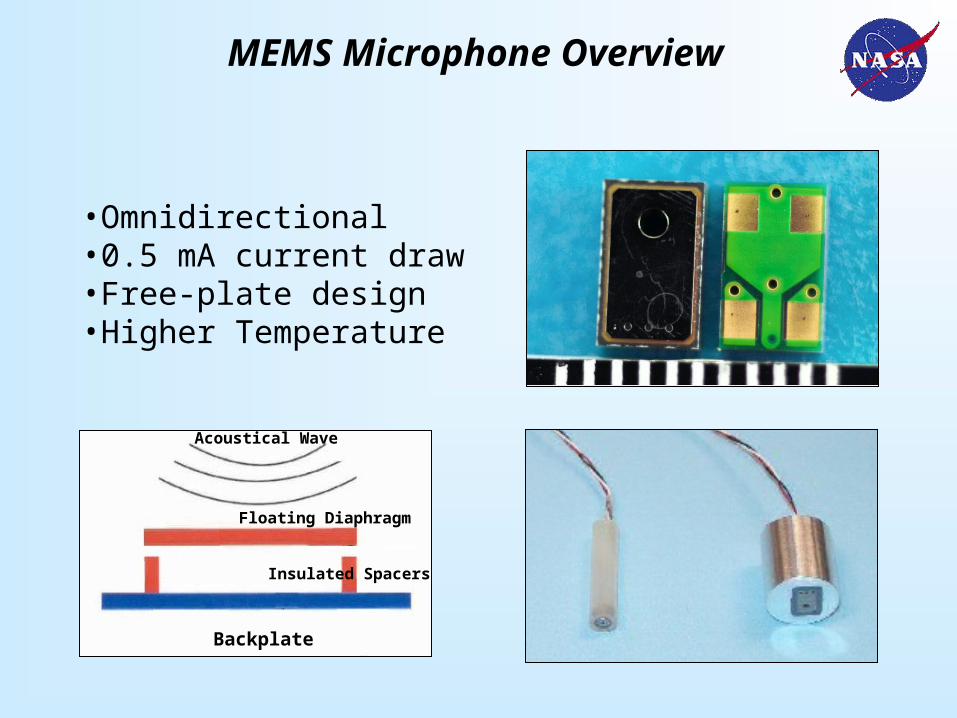
MEMS Microphone Overview
Backplate
Acoustical Wave
Floating Diaphragm
Insulated Spacers
•Omnidirectional•0.5 mA current draw•Free-plate design•Higher Temperature

General General Comparison
B&K 4134 Electret MEMS Volume >150 mm3 100 mm3 25 mm3 Support Electronics High Medium Low Power Low Low Low Voltage 200V 3V 1-3V Mass High Low Low Cost Very High Low Low Sensitivity High Medium Medium Range <100KHz <20 KHz <50 KHz Temperature Low Low Medium

MEMS Capacitive Microphone Design
Acoustical Wave
Clamped DiaphragmBackplateAirgap
Acoustical Wave
Insulated Spacers
Floating Diaphragm
Blackplate
• Is an electrostatic transducer
• Capacitance change due to an external mechanical input (electrostatic transducer)
• Clamped diaphragm introduces nonlinearities associated with in-built residual stress in the diaphragm
• The SiSonic design uses a flat free-plate that is held in proximity to the back plate by electrostatic attraction.
• As diaphragm is a free-plate (it has no edge moments and has no tension), it has higher fidelity than a clamped arrangement.

SiSonic MEMS Microphones
SP0101NZ SP0102NC SP0103NC
SP0101NZ•10K Ohms Output impedance
•0.5 mA max. current drain
SP0102NC•100 Ohms Output impedance•0.25 mA max. current drain
SP0103NC•100 Ohms Output impedance
•0.35 mA max. current drain
•Integrated Amplifier

Basic Structure of MEMS Microphone
Diaphragm
Spacers
Base

SP0101 General Outline
backV
Signal
CCV
OUT
Charge Pump
Detection Circuit
Microphone Diaphragm Power and Detection

SP0102 General Outline
backV
Signal
CCV
OUT
Charge Pump
Detection Circuit
Microphone Diaphragm Power and Detection

SP0103 General Outline
backV
Signal
CCV
OUT
Charge Pump
Detection Circuit
20 dBAmplifier
Microphone Diaphragm Power and Detection
extRextC

Basic Functional Analysis(Clamped and Free floating diaphragm)
The model of clamped and free floating movable plate capacitor is shown by:
FE can be calculated by differentiating the stored energy of the capacitor w.r.t. the position of the movable plate:
xKdt
xdmF
2
2
where F is the electrostatic attraction force caused by supply voltage V.
The mechanical elastic force FM can be expressed as:
xKF M
where K is a spring constant and is assumed to be linear.
)Vx
kAε
2
1(
dx
d - )CV
2
1(
dx
dF 202
E
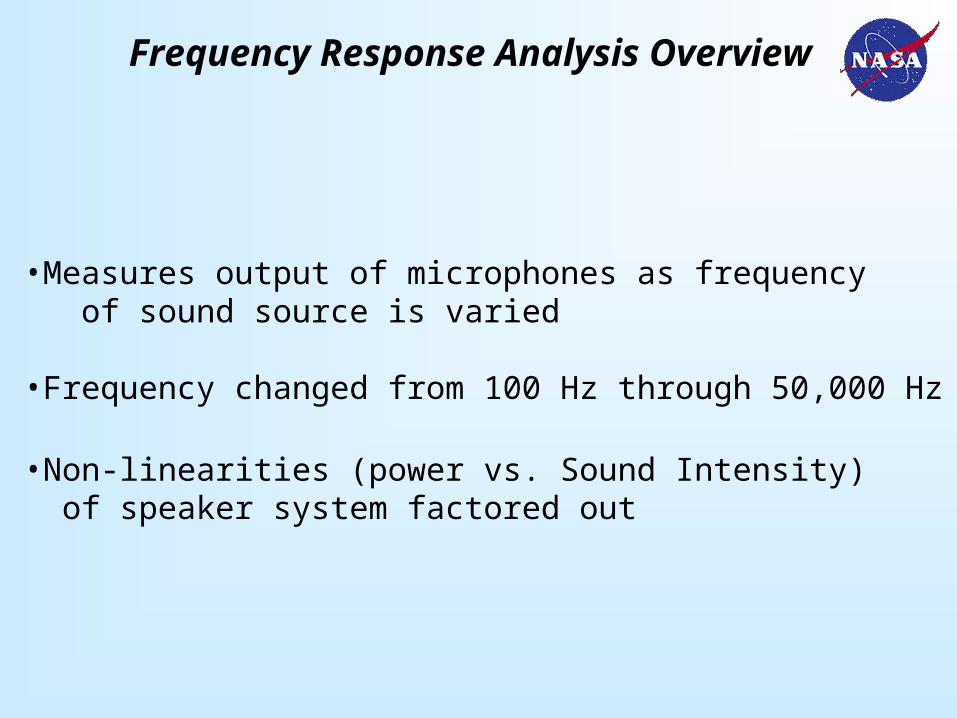
Frequency Response Analysis Overview
•Measures output of microphones as frequency of sound source is varied
•Frequency changed from 100 Hz through 50,000 Hz
•Non-linearities (power vs. Sound Intensity) of speaker system factored out

SP0101NC3 / SP0102NC3 / SP0103NC3Frequency Response Testing
MEMSMicrophone High-Pass
Filter (10Hz)
Buffer
n x
nx Amplifier
Hardware
Software
FFT
Voltmeter
ChannelSelect
HardDisk
backV
Signal
CCV
OUT
Charge Pump
Detection Circuit
MEMS Microphone Power and Detection

Anechoic Chamber Test Setup

0
0.2
0.4
0.6
0.8
1
1.2
1.4
1.6
1.8
2
0 1000 2000 3000 4000 5000 6000 7000 8000 9000 10000
SP0101
SP0102
SP0103
Am
plit
ud
e (
V)
Frequency (Hz)
MEMS Microphone Comparison100 -10000 Hz

MEMS Microphone Comparison100Hz – 25kHz
Am
plit
ud
e (
V)
Frequency (Hz)
0
0.5
1
1.5
2
2.5
3
3.5
4
4.5
5
0 5000 10000 15000 20000 25000
SP0101
SP0102
SP0103

0%
20%
40%
60%
80%
100%
120%
140%
160%
180%
200%
0 1000 2000 3000 4000 5000 6000 7000 8000 9000 10000
SP0101
SP0102
SP0103
MEMS Microphone Comparison100Hz – 10kHz
Frequency (Hz)
Am
plit
ud
e (
% o
f 1kH
z V
alu
e)

MEMS Microphone Comparison100Hz – 25kHz
Am
plit
ud
e (
% o
f 1
kHz
Valu
e)
Frequency (Hz)
0%
100%
200%
300%
400%
500%
600%
0 5000 10000 15000 20000 25000
SP0101
SP0102
SP0103

MEMS MEMS Array Test Layout Test Layout
Anechoic Chamber
MEMSArray Speaker
Amplifier
LabVIEWHardware

MEMS Array Close-UpMEMS Array Close-Up
Audio Source
Numbering Convention
MEMS Array
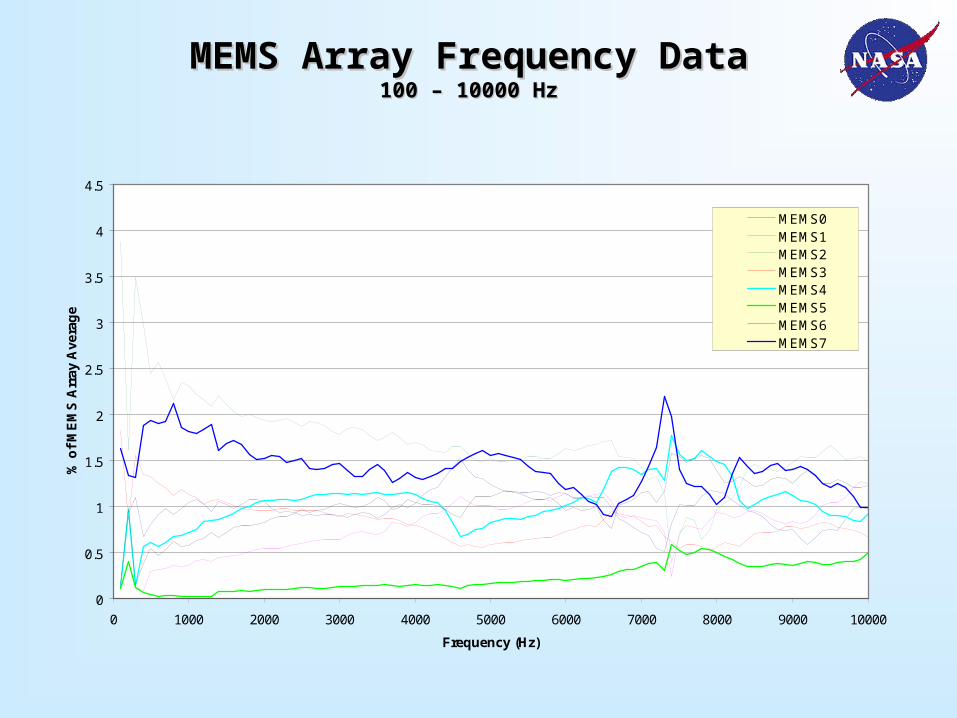
MEMS Array Frequency ResponseLabVIEW Qualifying ProgramMEMS Channels 0 through 7
100-10000 Hz
0
0.5
1
1.5
2
2.5
3
3.5
4
4.5
0 1000 2000 3000 4000 5000 6000 7000 8000 9000 10000
Frequency (Hz)
% o
f M
EM
S A
rray
Ave
rag
e
MEMS0MEMS1MEMS2MEMS3MEMS4MEMS5MEMS6MEMS7
MEMS Array Frequency DataMEMS Array Frequency Data100 – 10000 Hz100 – 10000 Hz
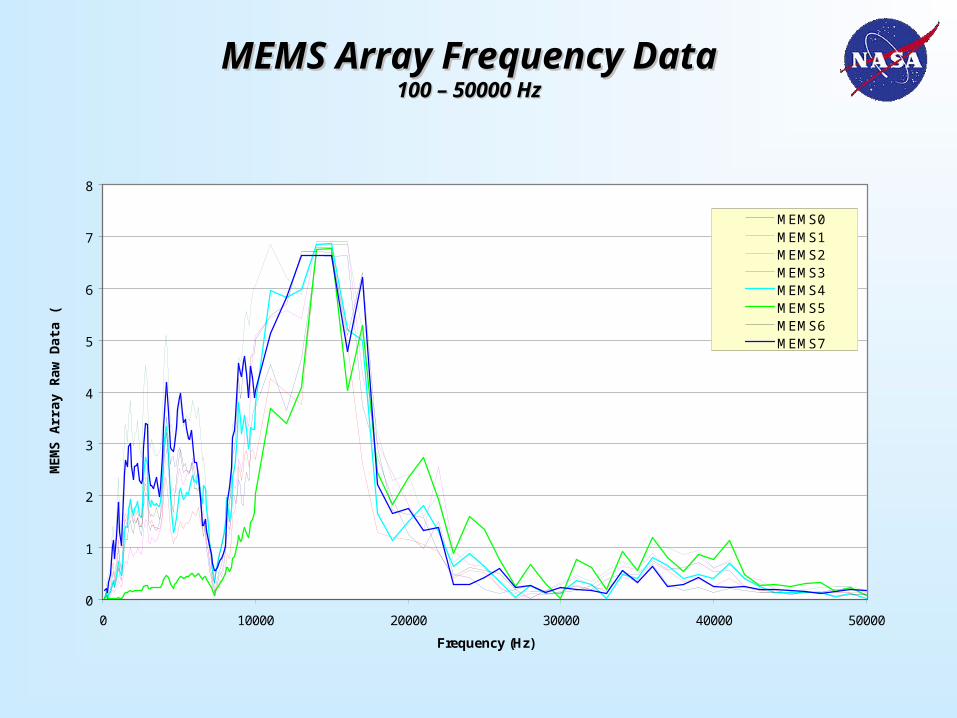
MEMS Array Frequency Response (Raw Data)LabVIEW Qualifying ProgramMEMS Channels 0 through 7
100-50000 Hz
0
1
2
3
4
5
6
7
8
0 10000 20000 30000 40000 50000
Frequency (Hz)
ME
MS
Arr
ay R
aw D
ata
(V)
MEMS0MEMS1MEMS2MEMS3MEMS4MEMS5MEMS6MEMS7
MEMS Array Frequency DataMEMS Array Frequency Data100 – 50000 Hz100 – 50000 Hz
MEMS Array Frequency DataMEMS Array Frequency Data100 – 10000 Hz100 – 10000 Hz
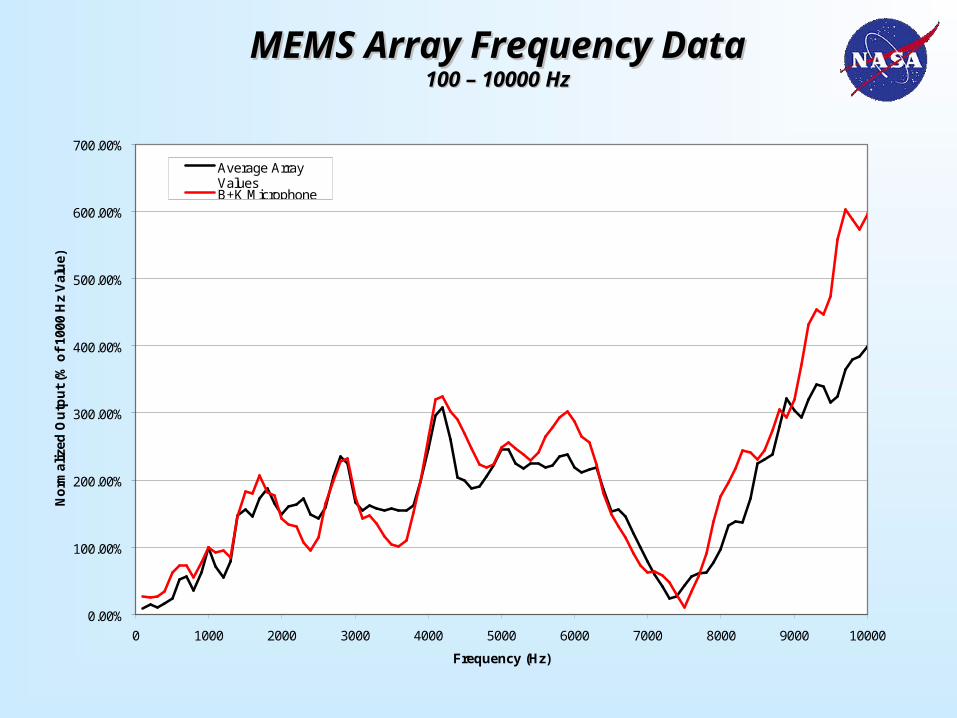
MEMS Array Comparison
0.00%
100.00%
200.00%
300.00%
400.00%
500.00%
600.00%
700.00%
0 1000 2000 3000 4000 5000 6000 7000 8000 9000 10000
Frequency (Hz)
No
rmal
ized
Ou
tpu
t (%
of
1000
Hz
Val
ue)
Average ArrayValuesB+K Microphone

MEMS Array Frequency DataMEMS Array Frequency Data100 – 10000 Hz100 – 10000 HzMEMS / Standard Comparison
0.00%
20.00%
40.00%
60.00%
80.00%
100.00%
120.00%
140.00%
160.00%
180.00%
200.00%
0 1000 2000 3000 4000 5000 6000 7000 8000 9000 10000
Frequency (Hz)
No
rmal
ize
d O
utp
ut
(% o
f 10
00
Hz
Va
lue)
Percent Comparison

As can be seen from the last slide, testing showedevidence of sharp discrepancies between the B+K
standard and the MEMS microphones tested
Although many of the discrepancies can be attributed todifferences in holder types and not the microphonesthemselves the data seemed to indicate mechanical
resonances in the MEMS diaphragm
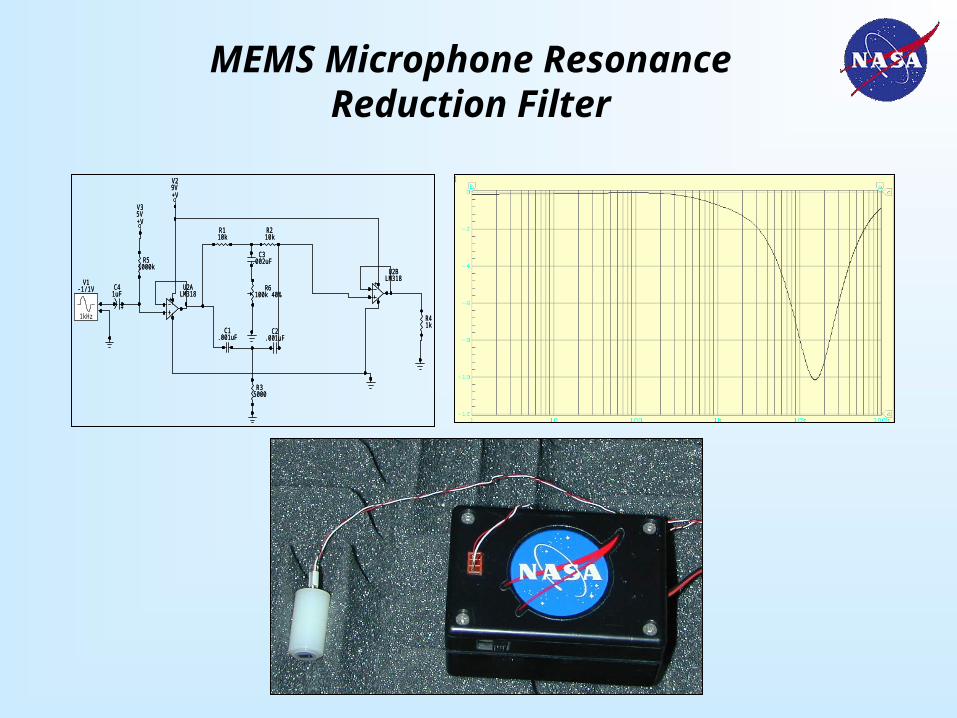
MEMS Microphone Resonance Problem

MEMS and Electret Microphone Comparison0.1V p-p from Function GeneratorPreAmp Gain to Speaker = 12dB, PostAmp Gain from Microphone= 50
Raw Data
0
0.5
1
1.5
2
2.5
3
3.5
4
4.5
0 2000 4000 6000 8000 10000 12000 14000 16000 18000 20000
Frequency (Hz)
Vo
ltag
e (V
olt
s)
MEMS Microphone
Electret Microphone
MEMS Microphone Resonance Data

MEMS and Electret Microphone Comparison0.1V p-p from Function Generator, PreAmp Gain to Speaker = 12dB, PostAmp Gain from Microphone= 50
Normalized to 1000 Hz Value
0%
200%
400%
600%
800%
1000%
1200%
0 2000 4000 6000 8000 10000 12000 14000 16000 18000 20000
Frequency (Hz)
% o
f 1
000
Hz
Val
ue
MEMS Microphone
Electret Microphone
MEMS Microphone Resonance DataNormalized to 1000Hz
+V
V35V
+
C41uF
+V
V29V
+
U2BLM318
+
U2ALM318
R6100k 40%
1kHz
V1-1/1V
C3.002uF
C2.001uF
C1.001uF
R51000k
R41k
R35000
R210k
R110k
+V
V35V
+
C41uF
+V
V29V
+
U2BLM318
+
U2ALM318
R6100k 40%
1kHz
V1-1/1V
C3.002uF
C2.001uF
C1.001uF
R51000k
R41k
R35000
R210k
R110k
MEMS Microphone ResonanceReduction Filter

Effect of Filter on MEMS MicrophoneData Normalized to 1000 Hz
100-20000 Hz
0%
50%
100%
150%
200%
250%
300%
350%
400%
450%
500%
0 2000 4000 6000 8000 10000 12000 14000 16000 18000 20000
Frequency (Hz)
% o
f 10
00 H
z V
alu
e
Filtered
Unfiltered
Overdriven Amplifer
MEMS Microphone ResonanceReduction Filter

Linear Testing•Used to determine location of sound source
Directionality Testing OverviewDirectionality Testing Overview
Rotational Testing•Used to determine “omnidirectionality” of microphone
MEMS Array ?? ??

Linear Array Directionality Testing
Linear Testing•Eight equidistant MEMS microphones•LabVIEW acquires data•Weighted average determines sound location in x-axis

Anechoic Chamber
Stepper Motor
50x Amplifier
Speaker
Microphone
Stepper MotorControl Board
LabVIEWHardware
12V/1A Power Supply
Computer
Rotational Directionality Testing

Preliminary Directional Test - 1 kHz
Note: Circle has radius of 1.5 volts
Rotational Testing•MEMS microphones tested against electret•Rotated through 360 degrees in 3.6 degree steps•“Omnidirectionality” dependent on package style•For similar packages, electret and MEMS are similar
Rotational Directionality TestingRotational Directionality Testing

Background Noise Measurement of MEMS Microphones
(MEMS Microphone isolated from ambient sounds and vibration)
• Acoustic isolation is achieved by means of high vacuum.
• Microphone remains close to room temperature and pressure
• Attainable levels of isolation (e.g., -155 dB at 40 Hz) enable noise measurements at frequencies as low as 2 Hz.)
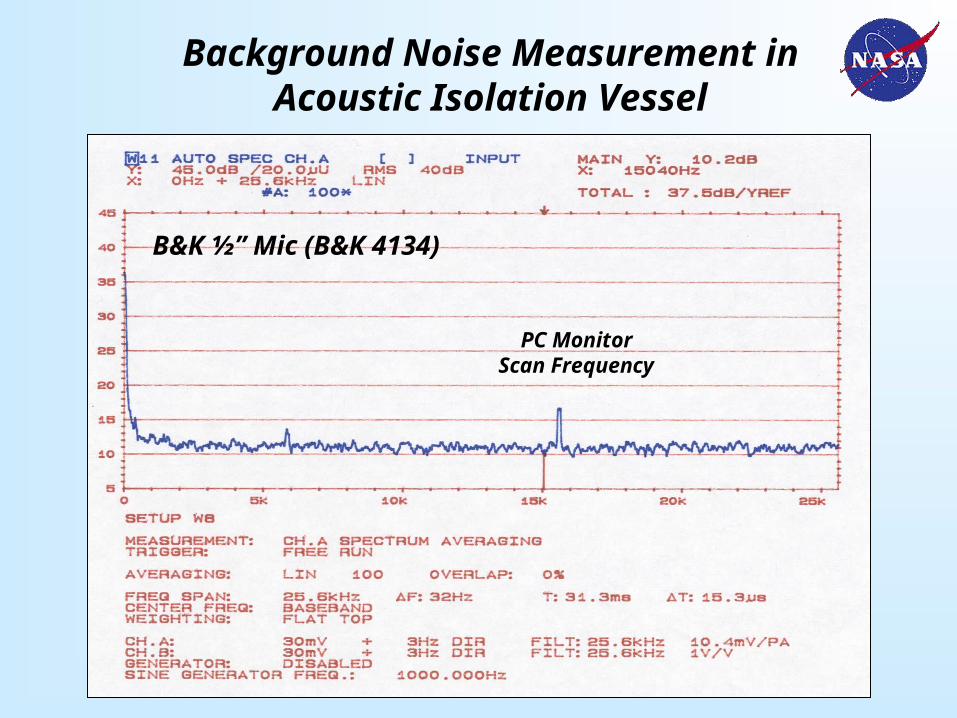
Background Noise Measurement inAcoustic Isolation Vessel
PC MonitorScan Frequency
B&K ½” Mic (B&K 4134)

Environmental Testing Overview
Humidity Effect on MEMS Microphone
0
5
10
15
20
25
30
35
40
45
50
0 10 20 30 40 50 60 70 80 90 100
% (Humdiity)O
ffse
t (m
V)
Humidity Testing•Preliminary environmental tests•LabVIEW acquires data•No functional change for large humidity range
No Change

Radiation Testing Overview
Radiation Testing•Preliminary radiation exposure tests (Co-60)•Capacitive elements = radiation detectors•No functional change for 4000 kpm (DC offset, noise)
50x Amplifiero’scope
Co-60Cobalt-60 gamma source
V

Current MEMS Microphone Work

Current MEMS Microphone Work

Current MEMS Microphone Work

Current MEMS Microphone Work

Conclusions
MEMS Microphones are adequate for many distributed or disposable systems
External circuitry is currently required to minimize
effects of resonance of MEMS units
Savings in space, weight, and cost make them useful for certain NASA applications, but
cannot be considered a “replacement technology” at
this time.
![MARY (TUT) HEDGEPETH NASA ORAL HISTORY · 6/12/2001 · Langley Field, [Hampton,] Virginia [NACA Langley Aeronautical Laboratory / (1958) NASA Langley Research Center]. My salary](https://static.fdocuments.net/doc/165x107/5f7335b4760f060dd62414fb/mary-tut-hedgepeth-nasa-oral-history-6122001-langley-field-hampton-virginia.jpg)