Wallboard Datasheet UCCX€¦ · storestheuserpreferencesbutnocustomer!data!coming!fromCisco!UCCX.!...
20
Comstice Wallboard Solution For Cisco UCCX Data Sheet 25 February 2016 Comstice Ltd All Rights Reserved
Transcript of Wallboard Datasheet UCCX€¦ · storestheuserpreferencesbutnocustomer!data!coming!fromCisco!UCCX.!...

08 Fall
Comstice Wallboard Solution For Cisco UCCX
Data Sheet
25 February 2016 Comstice Ltd All Rights Reserved
2
1. Introduction This document aims to provide the details of Comstice Wallboard Solution. The document also covers the wallboard interface features, options and required hardware and software for the solution.
3
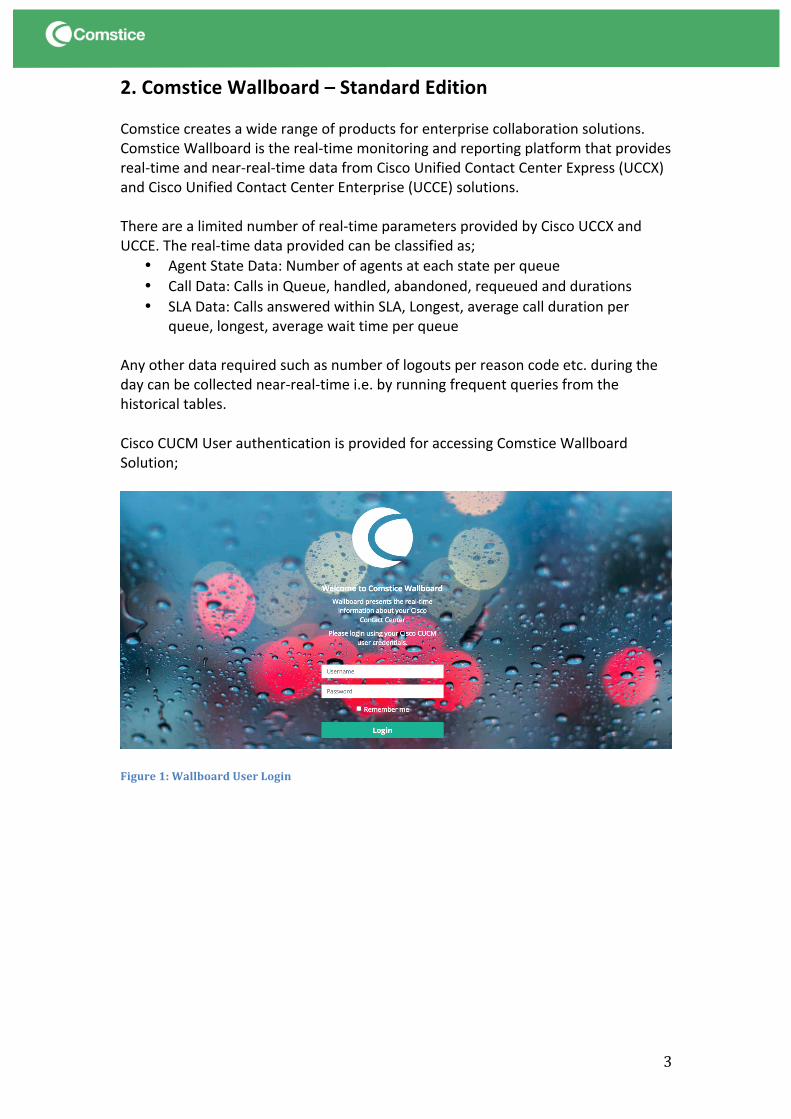
2. Comstice Wallboard – Standard Edition Comstice creates a wide range of products for enterprise collaboration solutions. Comstice Wallboard is the real-‐time monitoring and reporting platform that provides real-‐time and near-‐real-‐time data from Cisco Unified Contact Center Express (UCCX) and Cisco Unified Contact Center Enterprise (UCCE) solutions. There are a limited number of real-‐time parameters provided by Cisco UCCX and UCCE. The real-‐time data provided can be classified as;
• Agent State Data: Number of agents at each state per queue • Call Data: Calls in Queue, handled, abandoned, requeued and durations • SLA Data: Calls answered within SLA, Longest, average call duration per
queue, longest, average wait time per queue Any other data required such as number of logouts per reason code etc. during the day can be collected near-‐real-‐time i.e. by running frequent queries from the historical tables. Cisco CUCM User authentication is provided for accessing Comstice Wallboard Solution;
Figure 1: Wallboard User Login

4
2.1 Box View
Figure 2: Box View
Wallboard Box View displays a graphical representation of the contact center performance at that day. It provides information about the agent states, call volumes and average waiting and handling times of the calls. Each box has individual settings where user can select the agents, queues and type of the call stats they would like to see (presented, answered, abandoned etc.). For the hourly charts, user can specify the start and end time of the chart time axis. Once saved, user-‐level settings are stored in local Wallboard database and remembered in the next login.
5
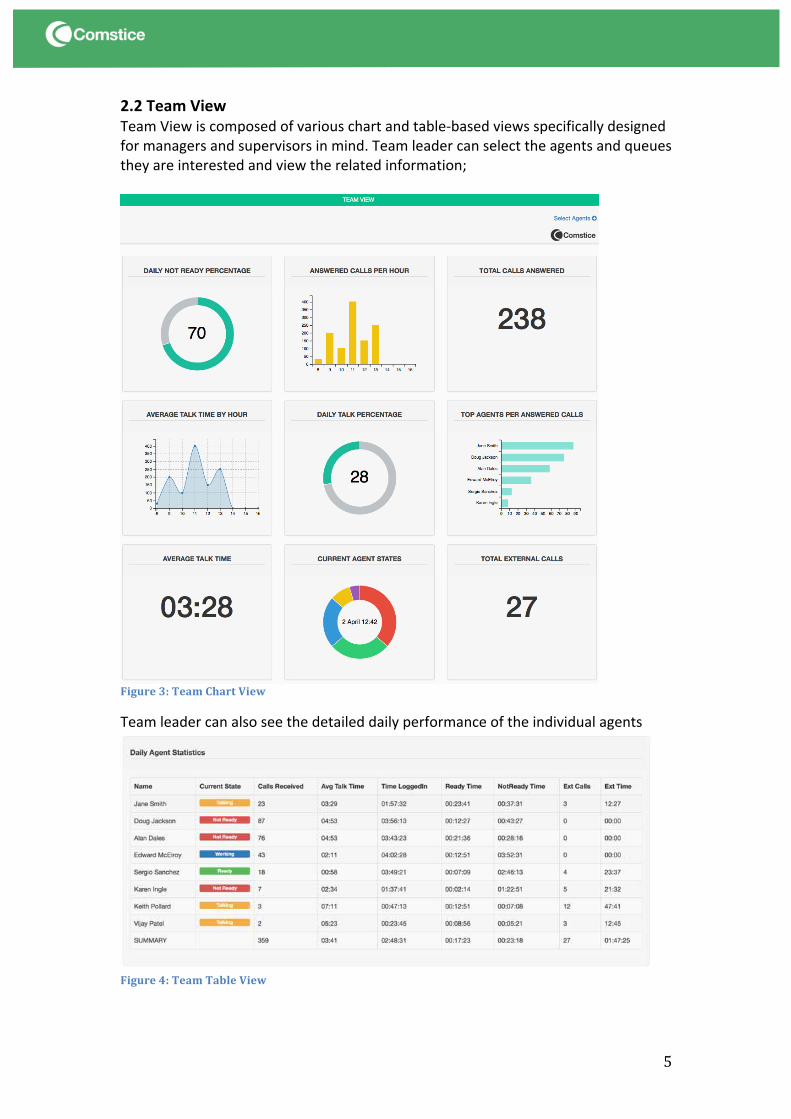
2.2 Team View Team View is composed of various chart and table-‐based views specifically designed for managers and supervisors in mind. Team leader can select the agents and queues they are interested and view the related information;
Figure 3: Team Chart View
Team leader can also see the detailed daily performance of the individual agents
Figure 4: Team Table View

6
It is also possible to present the agent details on a large screen;
Figure 5: Team Table View – Large Screen
In case some of the team members are doing callbacks with or without Outbound Dialer feature, team
Figure 6: Callback Agents – No Outbound Dialer
2.3 Queue Views Comstice Wallboard can also show the details of each queue such as incoming calls and the callback queue.
Incoming Calls Queue View
Wallboard can present every single call in the queue with the details such as called number, queue name and wait time. If there is a database integration with

7
the CustomerDB, we can also display the customer name when calling number has a match in the database. Users can filter this view based on the CSQs they are interested in to see.
Callback Queue View If there is a callback option configured on Cisco UCCX to avoid customers to stay on the line while retaining their place in queue, Wallboard can also display the details of the customers waiting to be called back;
Agent View Wallboard can also show the details of each agent, including the reason codes when they are in Not Ready state and queue details of the incoming call when they are in Talking state;

8
Wallboard Tabular Views Wallboard views provide fully customizable view to the user. Each row and column can be added or removed based on the preference.
Figure 7: Large Wallboard View
9
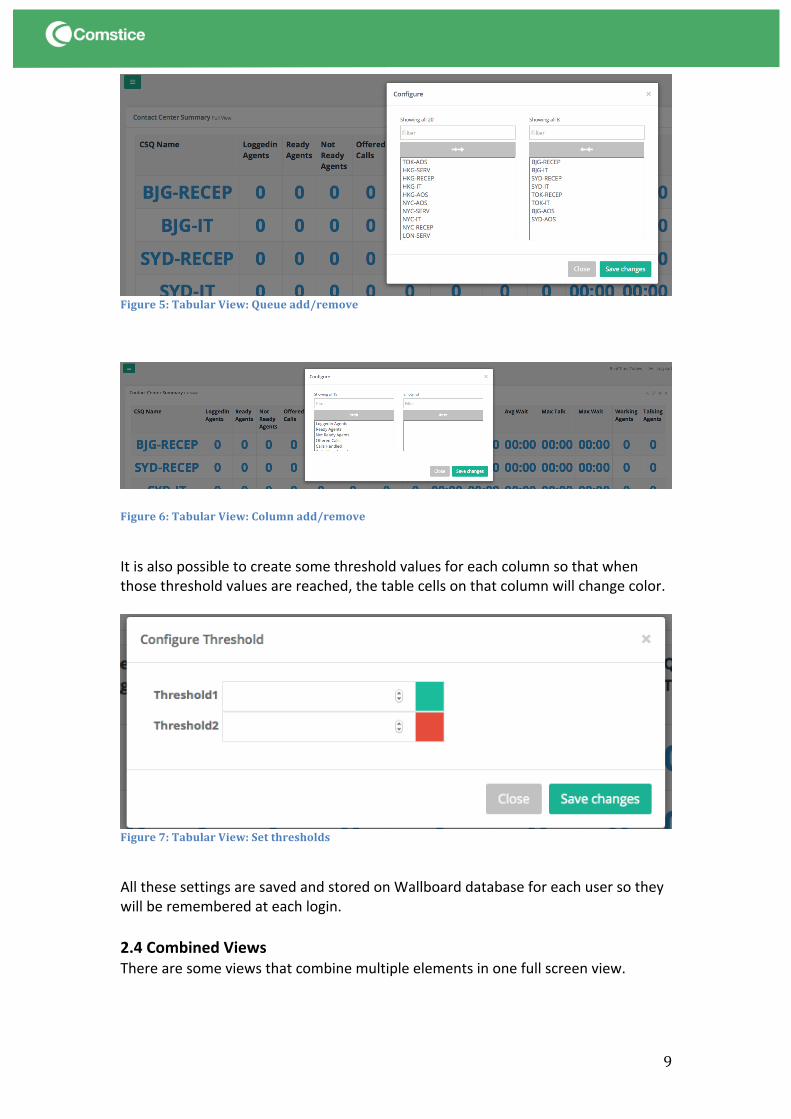
Figure 5: Tabular View: Queue add/remove
Figure 6: Tabular View: Column add/remove
It is also possible to create some threshold values for each column so that when those threshold values are reached, the table cells on that column will change color.
Figure 7: Tabular View: Set thresholds
All these settings are saved and stored on Wallboard database for each user so they will be remembered at each login. 2.4 Combined Views There are some views that combine multiple elements in one full screen view.
10
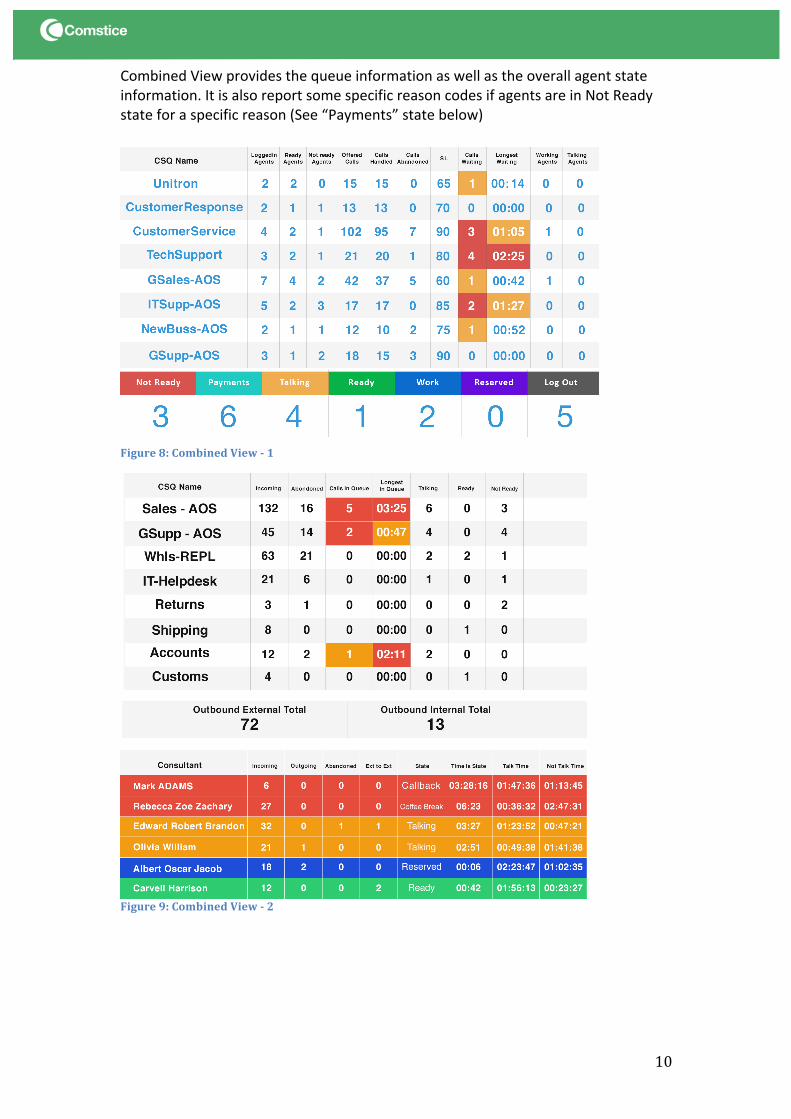
Combined View provides the queue information as well as the overall agent state information. It is also report some specific reason codes if agents are in Not Ready state for a specific reason (See “Payments” state below)
Figure 8: Combined View -‐ 1
Figure 9: Combined View -‐ 2
11
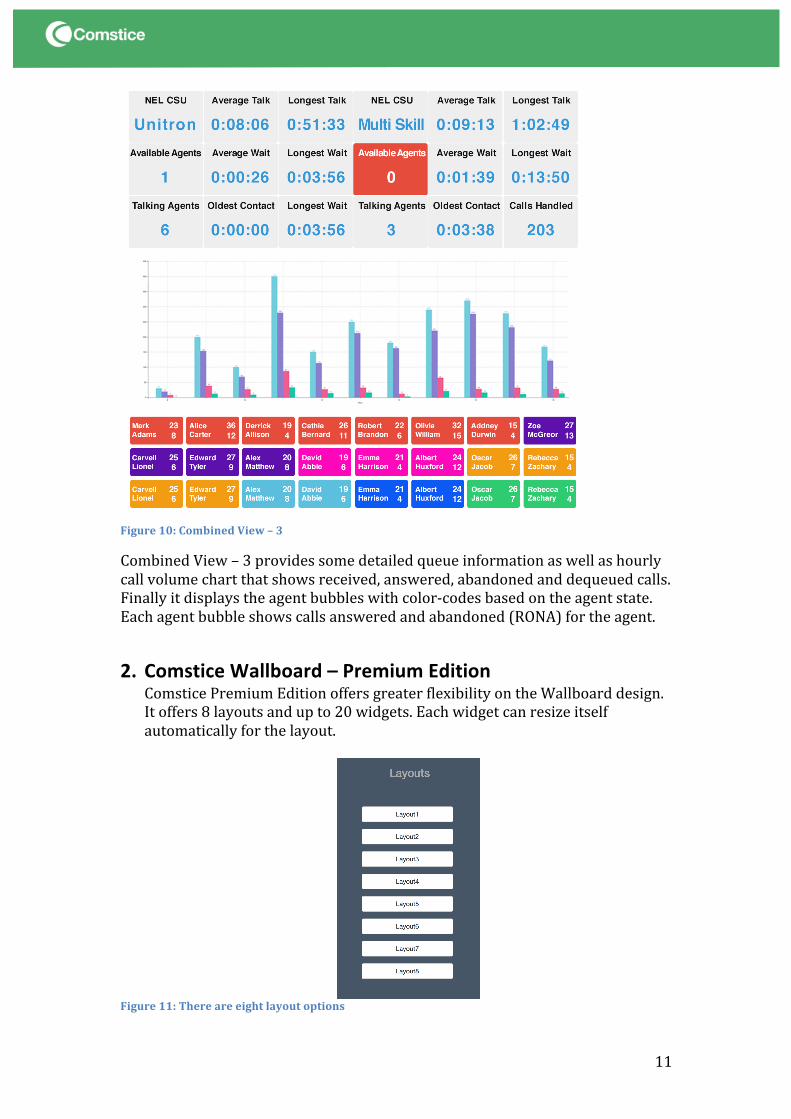
Figure 10: Combined View – 3
Combined View – 3 provides some detailed queue information as well as hourly call volume chart that shows received, answered, abandoned and dequeued calls. Finally it displays the agent bubbles with color-‐codes based on the agent state. Each agent bubble shows calls answered and abandoned (RONA) for the agent.
2. Comstice Wallboard – Premium Edition Comstice Premium Edition offers greater flexibility on the Wallboard design. It offers 8 layouts and up to 20 widgets. Each widget can resize itself automatically for the layout.
Figure 11: There are eight layout options
12
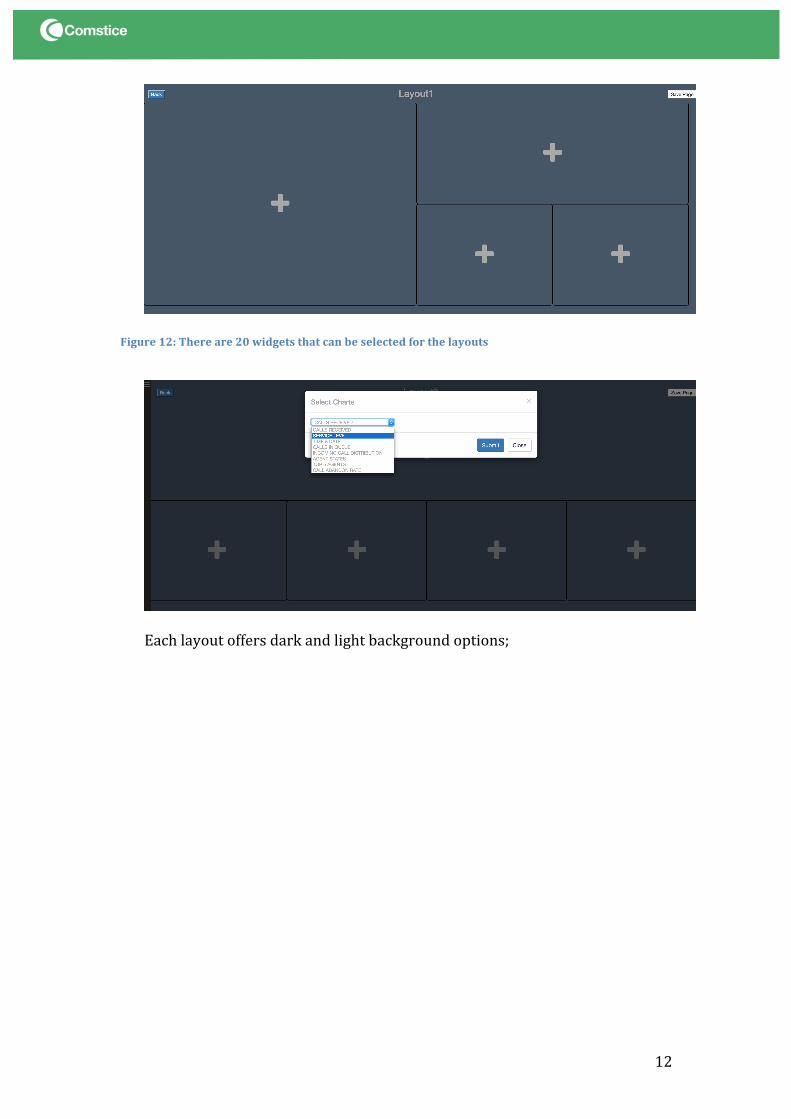
Figure 12: There are 20 widgets that can be selected for the layouts
Each layout offers dark and light background options;

13
Figure 13: Currently available layouts
Layout Examples: Dark Background
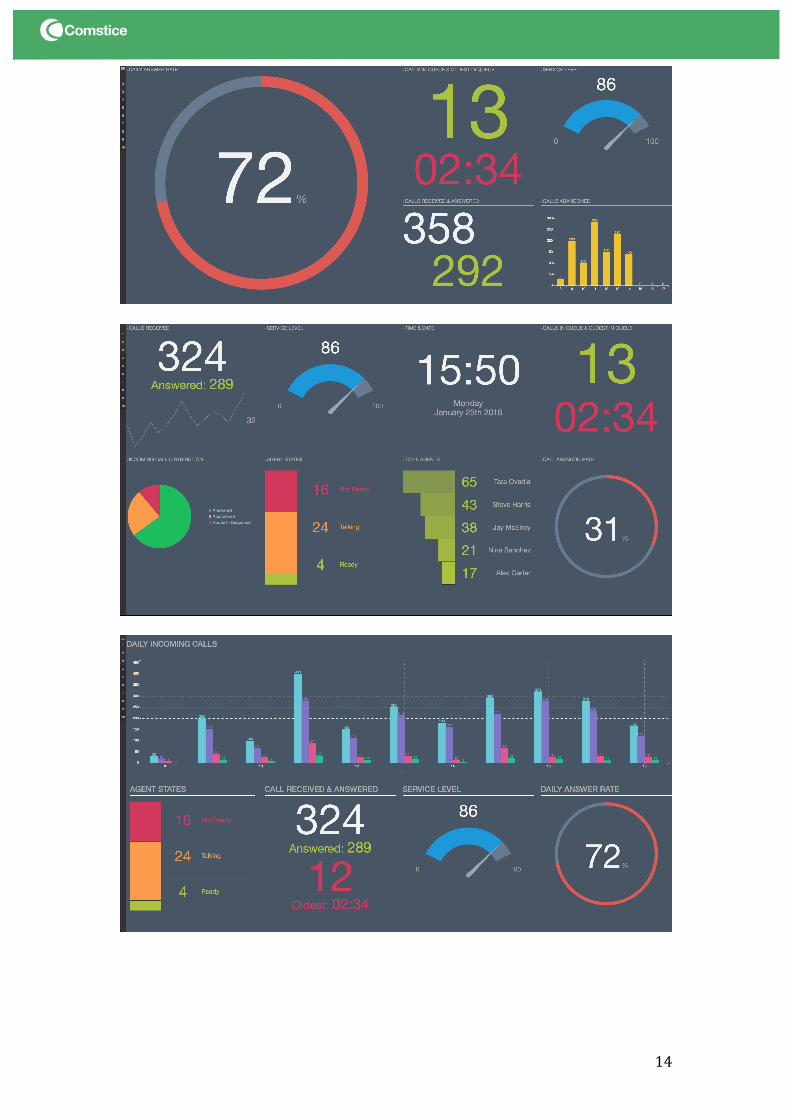
14
15
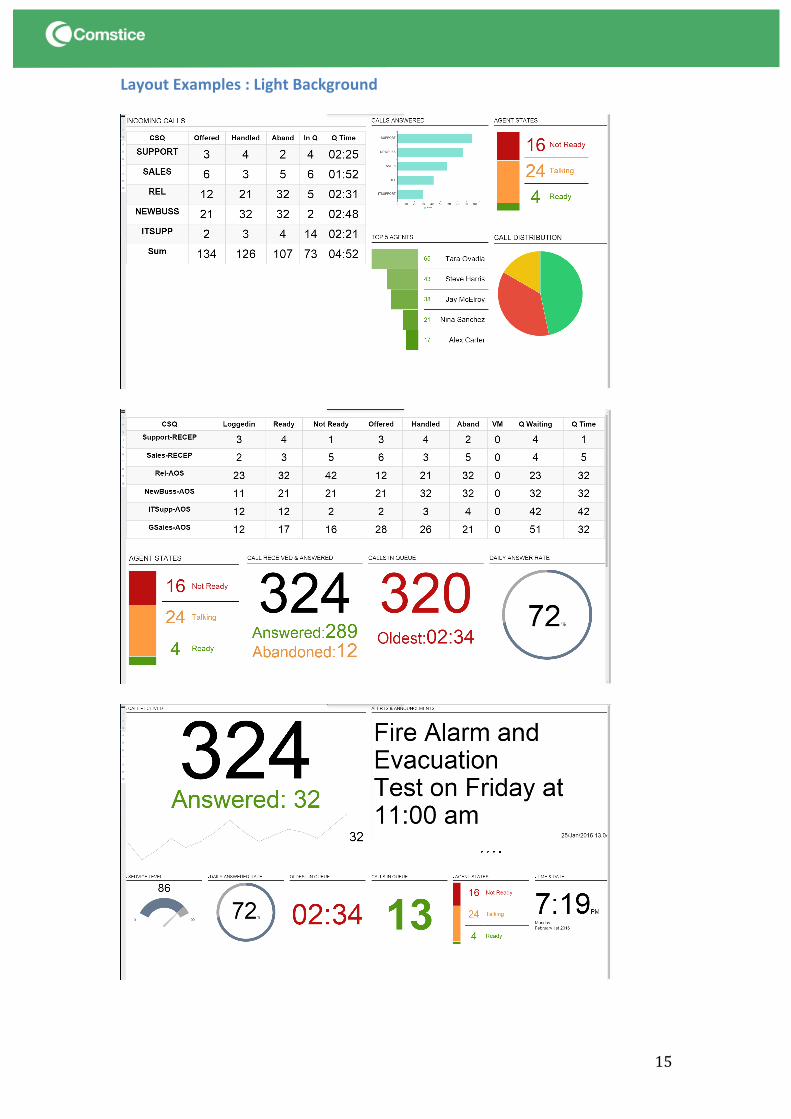
Layout Examples : Light Background

16
4. User Permissions and Profiling Comstice Wallboard Premium also offers profiling option so that administrators can restrict the agents and queues each user can see. By creating profiles and assigning usernames to the specified profiles, you can control what information each user can access;
17
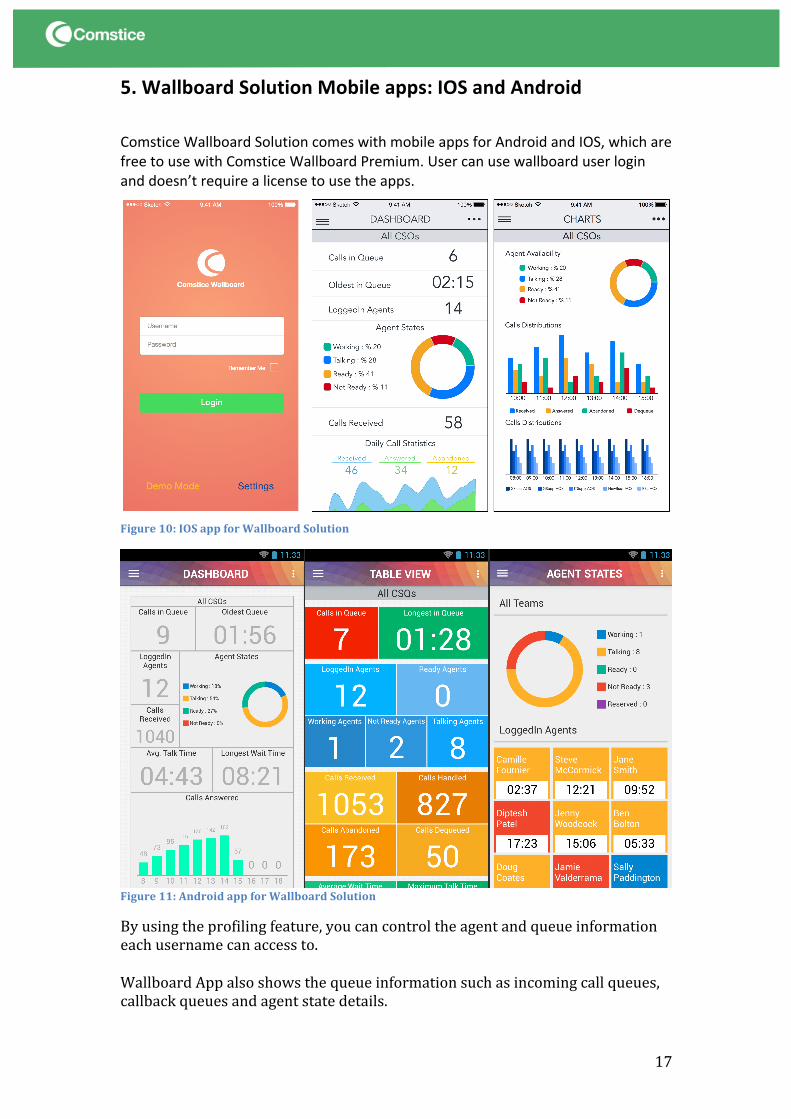
5. Wallboard Solution Mobile apps: IOS and Android
Comstice Wallboard Solution comes with mobile apps for Android and IOS, which are free to use with Comstice Wallboard Premium. User can use wallboard user login and doesn’t require a license to use the apps.
Figure 10: IOS app for Wallboard Solution
Figure 11: Android app for Wallboard Solution
By using the profiling feature, you can control the agent and queue information each username can access to. Wallboard App also shows the queue information such as incoming call queues, callback queues and agent state details.
18
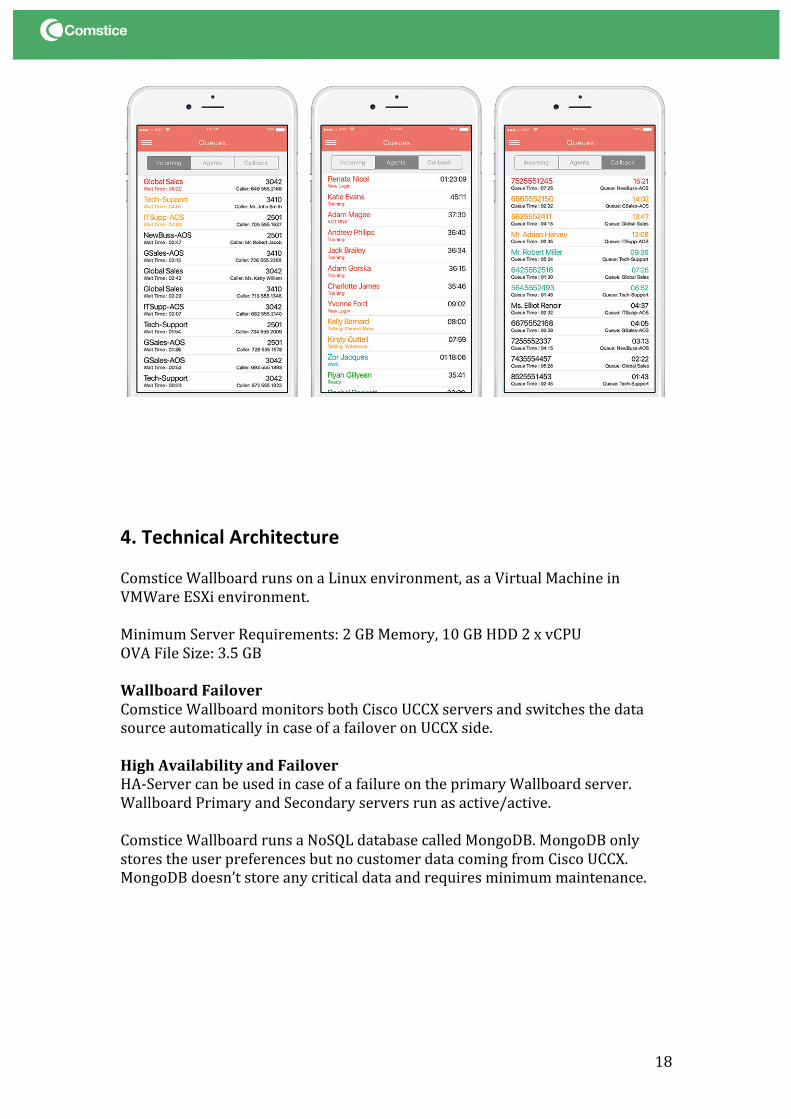
4. Technical Architecture Comstice Wallboard runs on a Linux environment, as a Virtual Machine in VMWare ESXi environment. Minimum Server Requirements: 2 GB Memory, 10 GB HDD 2 x vCPU OVA File Size: 3.5 GB Wallboard Failover Comstice Wallboard monitors both Cisco UCCX servers and switches the data source automatically in case of a failover on UCCX side. High Availability and Failover HA-‐Server can be used in case of a failure on the primary Wallboard server. Wallboard Primary and Secondary servers run as active/active. Comstice Wallboard runs a NoSQL database called MongoDB. MongoDB only stores the user preferences but no customer data coming from Cisco UCCX. MongoDB doesn’t store any critical data and requires minimum maintenance.

19
5. Support
What does it cover? Comstice provides a software maintenance support for the Comstice Wallboard software. Standard Support is provided on a 48-‐hr response and up to 7 business days fix basis due to all the dependencies around the solution. Priority Support is provided on up to 4-‐hr response and up to 48 hours fix basis due to all the dependencies around the solution. Support service provided by qualified engineers via email or WebEx. Either by using the VPN account provided to Comstice Support team or via WebEx with customer engineer, troubleshooting steps are performed. All hardware provided by Comstice for Wallboard solution comes with 1-‐year guarantee and if found faulty, usually replaced within 7 business days. 5.1 How to raise a support ticket? End customers or partners can raise a support tickets online from www.comstice.com/support or by calling Comstice Support Desks from +1-‐713-‐357-‐7724.

20