Wall temperature and system mass effects in a ... · • Connecting rod length: ... 14 mm . Piston...
12
PROCEEDINGS OF ECOS 2016 - THE 29 TH INTERNATIONAL CONFERENCE ON EFFICIENCY, COST, OPTIMIZATION, SIMULATION AND ENVIRONMENTAL IMPACT OF ENERGY SYSTEMS JUNE 19-23, 2016, PORTOROŽ, SLOVENIA Wall temperature and system mass effects in a reciprocating gas spring Aly I. Taleb a , Paul Sapin a , Christoph Barfuss a , Alexander J. White b , Dražen Fabris a,c and Christos N. Markides a,* a Clean Energy Processes (CEP) Laboratory, Department of Chemical Engineering, Imperial College London, London, United Kingdom. ( * Corresponding author: [email protected] ) b Department of Engineering, University of Cambridge, Cambridge, United Kingdom. c Department of Mechanical Engineering, Santa Clara University, Santa Clara, United States. Abstract: Reciprocating-piston devices can be used as high-efficiency compressors or expanders in small-scale Rankine cycle engines for power generation or in energy storage systems. The thermodynamic performance of piston-cylinder devices is adversely affected by the unsteady heat transfer between the compressed/expanded gas and the surrounding cylinder walls. Gas springs are an excellent model for the study of these losses because they exhibit the same complex heat transfer due to periodic pressure oscillations while avoiding the complexities of gas intake or exhaust. In this paper, results from CFD simulations of gas springs are compared to experimental data obtained in a piston-cylinder crankshaft-driven gas spring that experiences mass leakage. The temperature of the walls of the gas spring and the system mass are not known precisely in the experiments and are important parameters that determine the operation and performance of the system. The aim of this paper is to use complementary experimental and computational data in order to study the effects of these two parameters. Initial (mass) and boundary (wall temperature) conditions of the CFD are varied to match experimental measurements. It is found that the mass of the system has little influence on the temperature while an increase leads to a higher mean cyclic pressure without affecting the pressure ratio. In other words, the mass in a perfectly sealed gas spring only influences the operational pressure but not the performance of the system. Keywords: Unsteady heat transfer, Computational Fluid Dynamics, Gas spring. 1. Introduction There is an interest in providing more efficient power production from low grade energy sources and technologies for energy storage from intermittent renewable energy. Low-temperature heat recovery technologies, e.g. Organic Rankine Cycles, and large-scale energy storage systems such as Pumped Thermal Electricity Storage [1] depend on efficient compression and expansion processes. In particular, the loss mechanisms involved in compression and expansion processes have a strong negative impact on the round-trip efficiency of energy storage systems. In comparison to turbomachines, positive-displacement compressors – or expanders – such as piston-cylinder systems, are promising solutions for high pressure ratio, small scale, or intermittent operation. The main loss mechanism in reciprocating-piston devices is the heat exchange between the gas and the surrounding walls. Other losses due to gas intake and exhaust can be reduced by careful design and valve timing. This in-cylinder heat transfer due to pressure fluctuations has been studied in gas spring configurations, i.e. without complex effects of gas intake/exhaust. Pfriem [2] was the first to predict analytically a phase difference between the bulk gas-to-wall temperature difference and the wall heat flux for an oscillating gas flow with important pressure variations. Lee [3] then developed a model for low Péclet numbers with a complex Nusselt number. Kornhauser and Smith [4-5] conducted experiments and proposed a set of empirical Nu-Re correlations with an additive imaginary part to account for the phase shift between the bulk gas-wall temperature difference and the instantaneous heat flux. However, these correlations are restricted to low compression ratios and do not include mass losses.
Transcript of Wall temperature and system mass effects in a ... · • Connecting rod length: ... 14 mm . Piston...
PROCEEDINGS OF ECOS 2016 - THE 29TH INTERNATIONAL CONFERENCE ON
EFFICIENCY, COST, OPTIMIZATION, SIMULATION AND ENVIRONMENTAL IMPACT OF ENERGY SYSTEMS
JUNE 19-23, 2016, PORTOROŽ, SLOVENIA
Wall temperature and system mass effects in a reciprocating gas spring
Aly I. Taleba, Paul Sapina, Christoph Barfussa, Alexander J. Whiteb, Dražen Fabrisa,c and Christos N. Markidesa,*
a Clean Energy Processes (CEP) Laboratory, Department of Chemical Engineering, Imperial College London, London, United Kingdom. (*Corresponding author: [email protected] )
b Department of Engineering, University of Cambridge, Cambridge, United Kingdom. c Department of Mechanical Engineering, Santa Clara University, Santa Clara, United States.
Abstract:
Reciprocating-piston devices can be used as high-efficiency compressors or expanders in small-scale Rankine cycle engines for power generation or in energy storage systems. The thermodynamic performance of piston-cylinder devices is adversely affected by the unsteady heat transfer between the compressed/expanded gas and the surrounding cylinder walls. Gas springs are an excellent model for the study of these losses because they exhibit the same complex heat transfer due to periodic pressure oscillations while avoiding the complexities of gas intake or exhaust. In this paper, results from CFD simulations of gas springs are compared to experimental data obtained in a piston-cylinder crankshaft-driven gas spring that experiences mass leakage. The temperature of the walls of the gas spring and the system mass are not known precisely in the experiments and are important parameters that determine the operation and performance of the system. The aim of this paper is to use complementary experimental and computational data in order to study the effects of these two parameters. Initial (mass) and boundary (wall temperature) conditions of the CFD are varied to match experimental measurements. It is found that the mass of the system has little influence on the temperature while an increase leads to a higher mean cyclic pressure without affecting the pressure ratio. In other words, the mass in a perfectly sealed gas spring only influences the operational pressure but not the performance of the system.
Keywords: Unsteady heat transfer, Computational Fluid Dynamics, Gas spring.
1. Introduction
There is an interest in providing more efficient power production from low grade energy sources and technologies for energy storage from intermittent renewable energy. Low-temperature heat recovery technologies, e.g. Organic Rankine Cycles, and large-scale energy storage systems such as Pumped Thermal Electricity Storage [1] depend on efficient compression and expansion processes. In particular, the loss mechanisms involved in compression and expansion processes have a strong negative impact on the round-trip efficiency of energy storage systems. In comparison to turbomachines, positive-displacement compressors – or expanders – such as piston-cylinder systems, are promising solutions for high pressure ratio, small scale, or intermittent operation.
The main loss mechanism in reciprocating-piston devices is the heat exchange between the gas and the surrounding walls. Other losses due to gas intake and exhaust can be reduced by careful design and valve timing. This in-cylinder heat transfer due to pressure fluctuations has been studied in gas spring configurations, i.e. without complex effects of gas intake/exhaust. Pfriem [2] was the first to predict analytically a phase difference between the bulk gas-to-wall temperature difference and the wall heat flux for an oscillating gas flow with important pressure variations. Lee [3] then developed a model for low Péclet numbers with a complex Nusselt number. Kornhauser and Smith [4-5] conducted experiments and proposed a set of empirical Nu-Re correlations with an additive imaginary part to account for the phase shift between the bulk gas-wall temperature difference and the instantaneous heat flux. However, these correlations are restricted to low compression ratios and do not include mass losses.
In the present article, experimental measurements are compared with CFD results where both the wall temperature and system mass are varied. The experiment uses a commercial crankshaft driven compressor converted into a gas spring by removing intake and exhaust parts. Three bulk parameters are measured throughout the cycles: pressure, volume and temperature. In addition, equation of state, continuity, energy and momentum balance equations are solved in an ideal gas spring (without mass leakage) with a CFD code in OpenFOAM. The experimental methods and the CFD code are presented respectively in section 2 and 3. Effects of mass (initial condition) and wall temperature (boundary condition) on the CFD calculation is discussed in section 4. The comparison between the numerical and experimental results is the presented in section 5.
2. Experimental methods
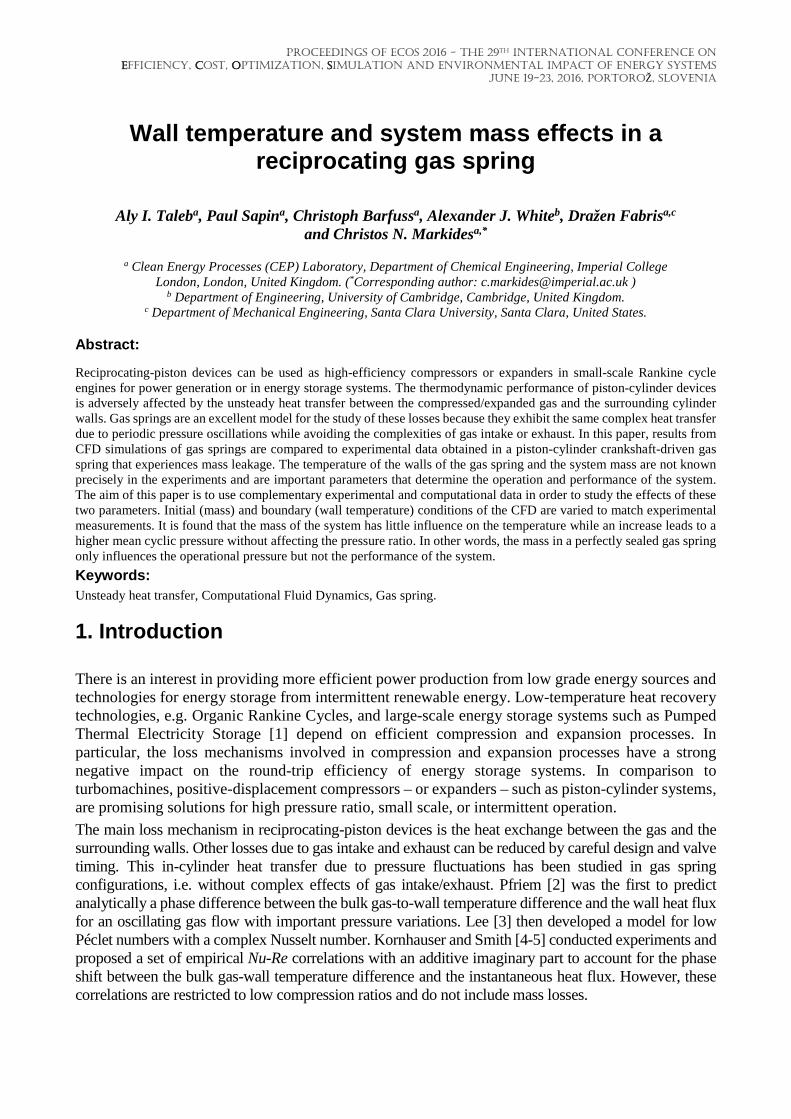
2.1. Experimental setup In the experiment, a piston-cylinder compressor is operated as a gas spring. The geometry and the measurements are indicated in Fig. 1. The piston is driven by an induction motor and the system dimensions are:
• Bore diameter: � � 105mm; • Stroke length: � � 2 ∙ � � 78mm; • Connecting rod length: �� � 148.5mm; • Dead volume height:��� � 14mm.
Piston rings – or split rings – fit into a groove on the outer diameter of the piston to limit mass transfers between the compression chamber and the crank case. A pressure transducer (PX35D0 by OMEGA, 0.25% accuracy) is connected to the top of the compression chamber to measure the pressure, P. The volume, V, is obtained by measuring the crank angle θ with a rotary sensor (shaft encoder BMSV30 by BAUMER, 1024 steps per revolution) and by using the following crankshaft relationship:
� � ��1 � cos �� � �� �1 � �1 � � !"#$% sin% �(,
(1)
where x is the height of the piston, as measured from top dead center (TDC) in Fig.1. Given the dead volume and the stroke length, the volume ratio, )�, is 6.6.
Fig. 1 Sketch of the experimental setup
The temperature within the gas chamber is measured by an in-house developed system using ultrasonic transducers to determine the speed of sound in the gas. An ultrasonic pulse signal is emitted by a piezoelectric ceramic transducer and travels up to another transducer diametrically opposed. The time of flight *+ of the pulse signal is then calculated using the pulse compression method, as described in detail by Mathie et al. [6], from which the velocity c of the ultrasonic wave is deduced. The gas temperature is finally calculated from the relationship between this velocity c and the gas temperature T characteristic of an isentropic wave propagation:
, � -./0 (2)
The system therefore measures the average temperature along the distance separating the sensors. Interested readers may refer to Mathie et al. [6] for more details on this measurement technique.
2.2. Procedure and data acquisition Before running the experiment, the compression chamber as well as the bottom chamber are purged and filled with nitrogen, thus removing most humidity in the system. Humidity can indeed be an issue, especially at bottom dead centre (BDC) where the temperature is low enough (below 200 K) that ice crystals may nucleate in the gas space, disturbing the ultrasonic signal transmission.
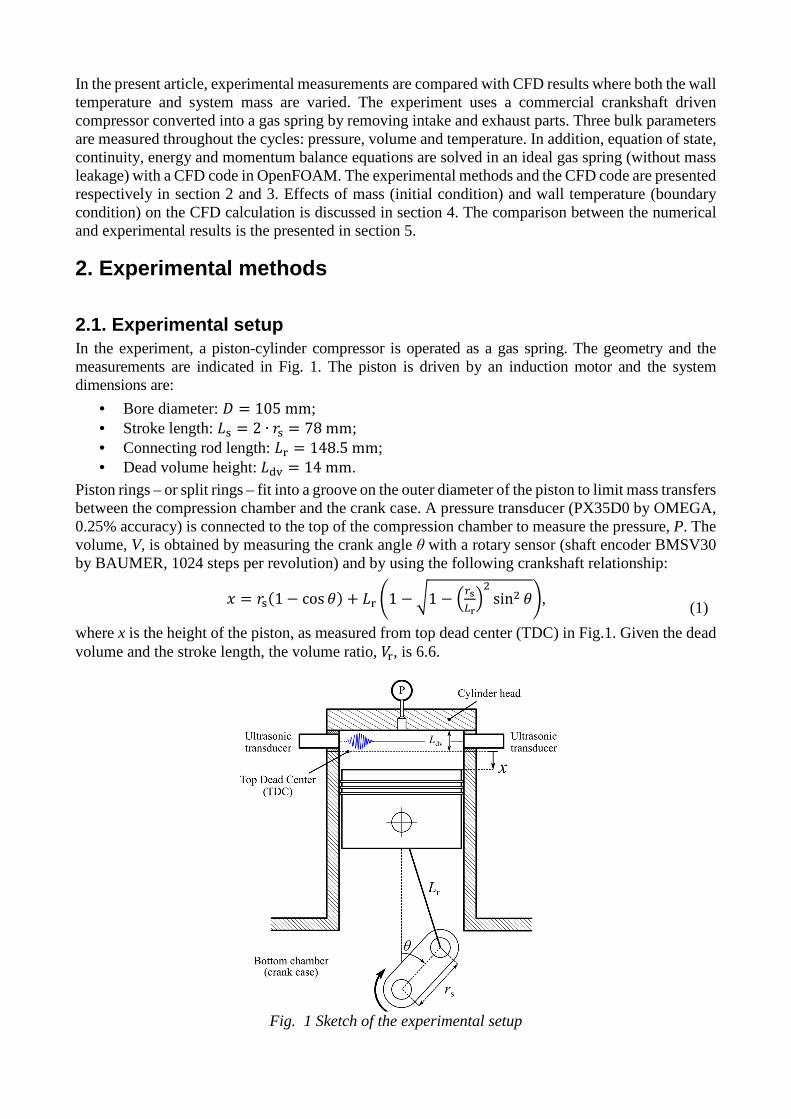
At the start of a run (* � 0), the piston is manually placed at TDC, which corresponds to� � 0. At this time, the system mass is minimum. During the first piston oscillations, the mass leakage to and from the compression chamber results in a net increase of the mean mass in the system. The mean pressure through the cycles thus increases until a cyclic steady state is reached (where the cycle-to-cycle variation is less than 0.5 %) resulting in a consistent pressure wave, as shown in Fig. 2.
Experimental data only consider the last 1 cycles, as shown in Fig. 2. Hereafter in this article, the data presented are averaged over the last 1 � 20 cycles of each run in order to provide cycle average information. Experiments are run from 25 to 164 rpm.
Fig. 2. Pressure evolution during a whole run. Crank rotational speed2 � 109.34rpm.
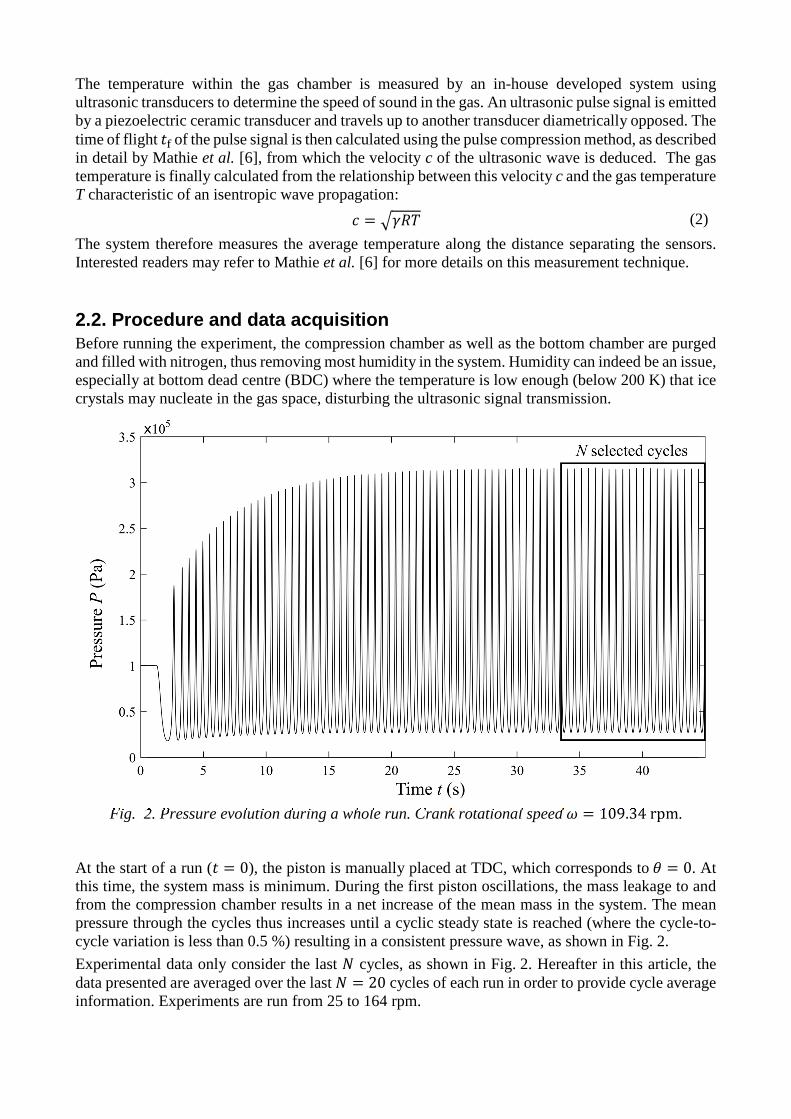
2.3. Pressure ratio for a range of frequencies The pressure ratio, 7�, is measured for a range of motor frequencies and plotted in Fig. 3 as a function of the oscillatory Péclet number 789 defined by Pfriem [1] as: 789 � 2�:%4; , (3)
where 2 is the oscillation frequency in rad/s, �: is the hydraulic diameter at mid-stroke and ; is the thermal diffusivity of nitrogen. According to Fig. 3, the pressure ratio increases with the Péclet number, towards the isentropic pressure ratio that is )�< � 14.1. This is in good agreement with the experimental observations made by Kornhauser and Smith [5]. For high Péclet numbers (789 = 50), losses decrease with increasing 789 [5,6]. As the rotational speed increases, cycle time reduces, decreasing the net heat transfer to and from the cylinder walls and reducing the mass leakage flow, thus approaching adiabatic compression and expansion processes.
3. CFD Model
3.1. Geometry and mesh A CFD model was developed for the gas spring in the open source CFD code OpenFOAM (v. 2.4.0). A wedge with a width of 0.02rad is modelled. The circumferential width of the wedge is resolved with one layer of cells making the simulation two dimensional. This is a reasonable assumption, as the gas spring is axisymmetric. Figure 4 shows the modelled wedge of the gas spring cylinder.
A dynamic mesh is used to model the changing volume of the compression space where the moving lower boundary is defined as the piston. Every node in the mesh moves vertically relative to the stationary piston head (top boundary) and the moving piston head (bottom boundary). Nodes closer to the piston head move to a greater extent than nodes closer to the cylinder head leading to a distortion (or compression) of the mesh as in Fig. 5. The mesh is modelled to have an aspect ratio of
Fig. 3 Pressure ratio in the experimental setup for a range of rotational speeds
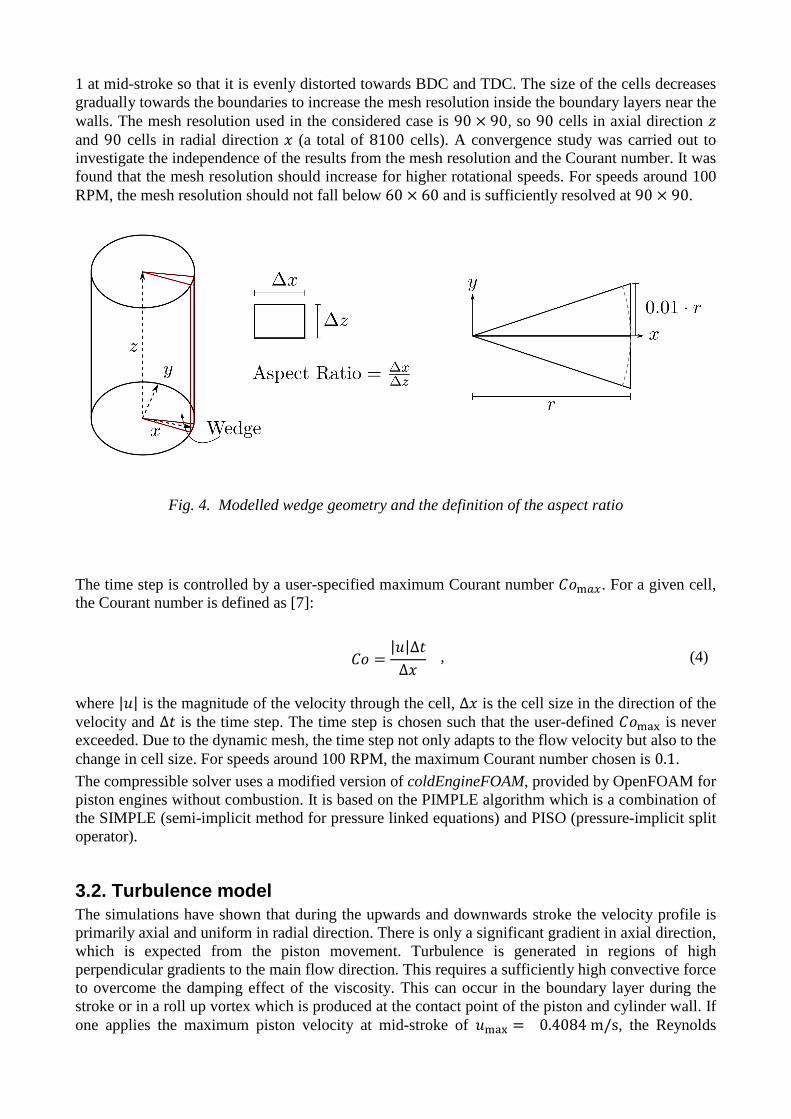
1 at mid-stroke so that it is evenly distorted towards BDC and TDC. The size of the cells decreases gradually towards the boundaries to increase the mesh resolution inside the boundary layers near the walls. The mesh resolution used in the considered case is 90 × 90, so 90 cells in axial direction A and 90 cells in radial direction � (a total of 8100 cells). A convergence study was carried out to investigate the independence of the results from the mesh resolution and the Courant number. It was found that the mesh resolution should increase for higher rotational speeds. For speeds around 100 RPM, the mesh resolution should not fall below 60 × 60 and is sufficiently resolved at 90 × 90.
Fig. 4. Modelled wedge geometry and the definition of the aspect ratio
The time step is controlled by a user-specified maximum Courant number CDEFG. For a given cell, the Courant number is defined as [7]:
CD =
|I|Δ*
Δ� , (4)
where |I| is the magnitude of the velocity through the cell, Δ� is the cell size in the direction of the velocity and Δ* is the time step. The time step is chosen such that the user-defined CDEKL is never exceeded. Due to the dynamic mesh, the time step not only adapts to the flow velocity but also to the change in cell size. For speeds around 100 RPM, the maximum Courant number chosen is 0.1.
The compressible solver uses a modified version of coldEngineFOAM, provided by OpenFOAM for piston engines without combustion. It is based on the PIMPLE algorithm which is a combination of the SIMPLE (semi-implicit method for pressure linked equations) and PISO (pressure-implicit split operator).
3.2. Turbulence model The simulations have shown that during the upwards and downwards stroke the velocity profile is primarily axial and uniform in radial direction. There is only a significant gradient in axial direction, which is expected from the piston movement. Turbulence is generated in regions of high perpendicular gradients to the main flow direction. This requires a sufficiently high convective force to overcome the damping effect of the viscosity. This can occur in the boundary layer during the stroke or in a roll up vortex which is produced at the contact point of the piston and cylinder wall. If one applies the maximum piston velocity at mid-stroke of IEKL = 0.4084m/s, the Reynolds
number in the case of 100RPM is /8 = 2717 for the boundary layer and/8 = 2022 for the corner vortex. Because of the absence of perpendicular gradients, the uniform core flow is considered to be laminar and has no affect in turbulence generation in the boundary layer. Thus, the boundary can be compared to the impulsive boundary layer on a rotary disk described by Chin and Litt [9] who claim a critical Reynolds number of /8Q�RS,UV = IEKL�/W = 170000 for experiments on the transition of a boundary layer on smooth rotary disks. For the corner vortex, a turbulent transition was found at a Reynolds number of /8Q�RS,XY = IEKLZS�[\]/W = 12500 by Tabaczynski et al. [10]. It can be assumed that there is no generation of turbulence from these regions and therefore a laminar assumption of the flow can be justified. Lekić and Kok [8] carried out CFD simulations of Kornhauser and Smith’s [4,5] experimental setup. They stated that turbulence has a small impact on the governing physical phenomena in their simulations.
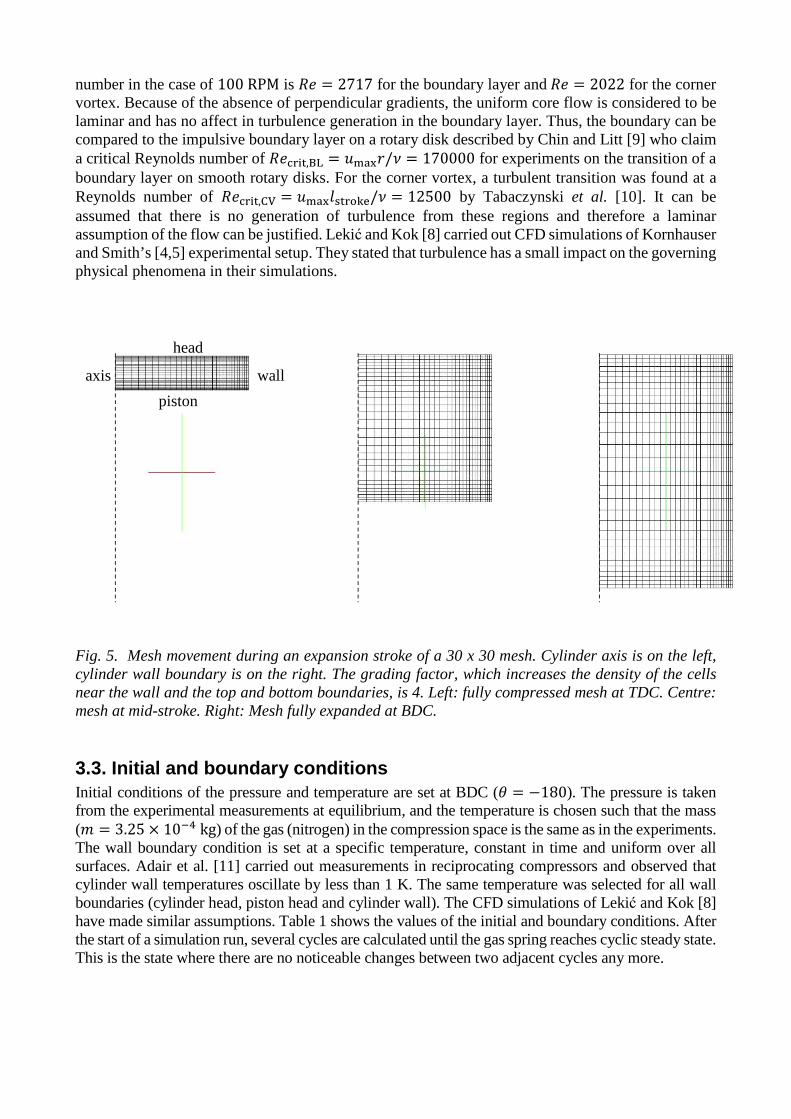
Fig. 5. Mesh movement during an expansion stroke of a 30 x 30 mesh. Cylinder axis is on the left, cylinder wall boundary is on the right. The grading factor, which increases the density of the cells near the wall and the top and bottom boundaries, is 4. Left: fully compressed mesh at TDC. Centre: mesh at mid-stroke. Right: Mesh fully expanded at BDC.
3.3. Initial and boundary conditions Initial conditions of the pressure and temperature are set at BDC (� = −180). The pressure is taken from the experimental measurements at equilibrium, and the temperature is chosen such that the mass (^ = 3.25 × 10_`kg) of the gas (nitrogen) in the compression space is the same as in the experiments. The wall boundary condition is set at a specific temperature, constant in time and uniform over all surfaces. Adair et al. [11] carried out measurements in reciprocating compressors and observed that cylinder wall temperatures oscillate by less than 1 K. The same temperature was selected for all wall boundaries (cylinder head, piston head and cylinder wall). The CFD simulations of Lekić and Kok [8] have made similar assumptions. Table 1 shows the values of the initial and boundary conditions. After the start of a simulation run, several cycles are calculated until the gas spring reaches cyclic steady state. This is the state where there are no noticeable changes between two adjacent cycles any more.
piston
wall
head
axis
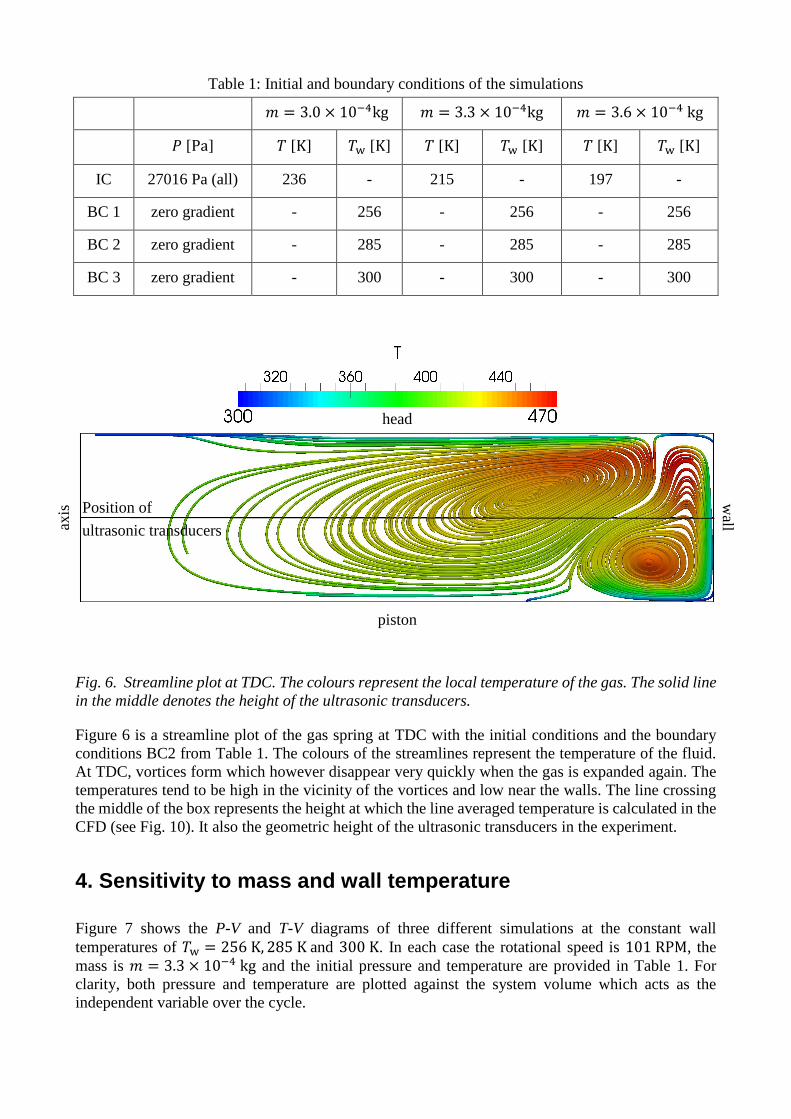
Table 1: Initial and boundary conditions of the simulations
^ � 3.0 × 10_`kg ^ = 3.3 × 10_`kg ^ = 3.6 × 10_`kg
7 [Pa] 0 [K] 0d [K] 0 [K] 0d [K] 0 [K] 0d [K]
IC 27016 Pa (all) 236 - 215 - 197 -
BC 1 zero gradient - 256 - 256 - 256
BC 2 zero gradient - 285 - 285 - 285
BC 3 zero gradient - 300 - 300 - 300
Fig. 6. Streamline plot at TDC. The colours represent the local temperature of the gas. The solid line in the middle denotes the height of the ultrasonic transducers.
Figure 6 is a streamline plot of the gas spring at TDC with the initial conditions and the boundary conditions BC2 from Table 1. The colours of the streamlines represent the temperature of the fluid. At TDC, vortices form which however disappear very quickly when the gas is expanded again. The temperatures tend to be high in the vicinity of the vortices and low near the walls. The line crossing the middle of the box represents the height at which the line averaged temperature is calculated in the CFD (see Fig. 10). It also the geometric height of the ultrasonic transducers in the experiment. 4. Sensitivity to mass and wall temperature
Figure 7 shows the P-V and T-V diagrams of three different simulations at the constant wall temperatures of 0d = 256K, 285Kand 300K. In each case the rotational speed is 101RPM, the mass is ̂ = 3.3 × 10_`kg and the initial pressure and temperature are provided in Table 1. For clarity, both pressure and temperature are plotted against the system volume which acts as the independent variable over the cycle.
Position of
ultrasonic transducers Position of
ultrasonic transducers axis
wall
head
piston
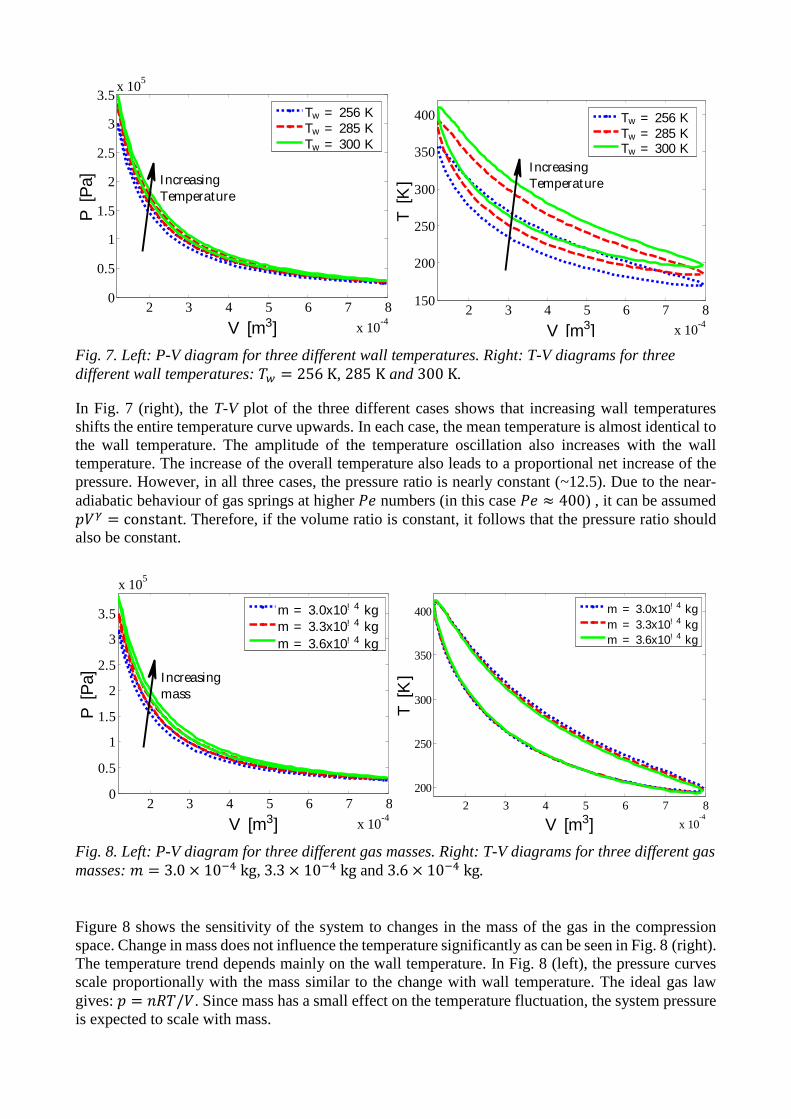
Fig. 7. Left: P-V diagram for three different wall temperatures. Right: T-V diagrams for three different wall temperatures: 0e � 256K, 285 K and 300K.
In Fig. 7 (right), the T-V plot of the three different cases shows that increasing wall temperatures shifts the entire temperature curve upwards. In each case, the mean temperature is almost identical to the wall temperature. The amplitude of the temperature oscillation also increases with the wall temperature. The increase of the overall temperature also leads to a proportional net increase of the pressure. However, in all three cases, the pressure ratio is nearly constant (~12.5). Due to the near-adiabatic behaviour of gas springs at higher 78 numbers (in this case 78 ≈ 400) , it can be assumed g)< = constant. Therefore, if the volume ratio is constant, it follows that the pressure ratio should also be constant.
Fig. 8. Left: P-V diagram for three different gas masses. Right: T-V diagrams for three different gas masses: ^ = 3.0 × 10_`kg,3.3 × 10_`kg and 3.6 × 10_`kg.
Figure 8 shows the sensitivity of the system to changes in the mass of the gas in the compression space. Change in mass does not influence the temperature significantly as can be seen in Fig. 8 (right). The temperature trend depends mainly on the wall temperature. In Fig. 8 (left), the pressure curves scale proportionally with the mass similar to the change with wall temperature. The ideal gas law gives: g = i/0/). Since mass has a small effect on the temperature fluctuation, the system pressure is expected to scale with mass.
2 3 4 5 6 7 8
x 10-4
0
0.5
1
1.5
2
2.5
3
3.5x 10
5
V [m3]
P[P
a]
Tw = 256 KTw = 285 KTw = 300 K
IncreasingTemperature
2 3 4 5 6 7 8
x 10-4
150
200
250
300
350
400
V [m3]
T[K
]
Tw = 256 KTw = 285 KTw = 300 K
IncreasingTemperature
2 3 4 5 6 7 8
x 10-4
0
0.5
1
1.5
2
2.5
3
3.5
x 105
V [m3]
P[P
a]
m = 3.0x10! 4 kgm = 3.3x10! 4 kgm = 3.6x10! 4 kg
Increasingmass
2 3 4 5 6 7 8
x 10-4
200
250
300
350
400
V [m3]
T[K
]
m = 3.0x10! 4 kgm = 3.3x10! 4 kgm = 3.6x10! 4 kg
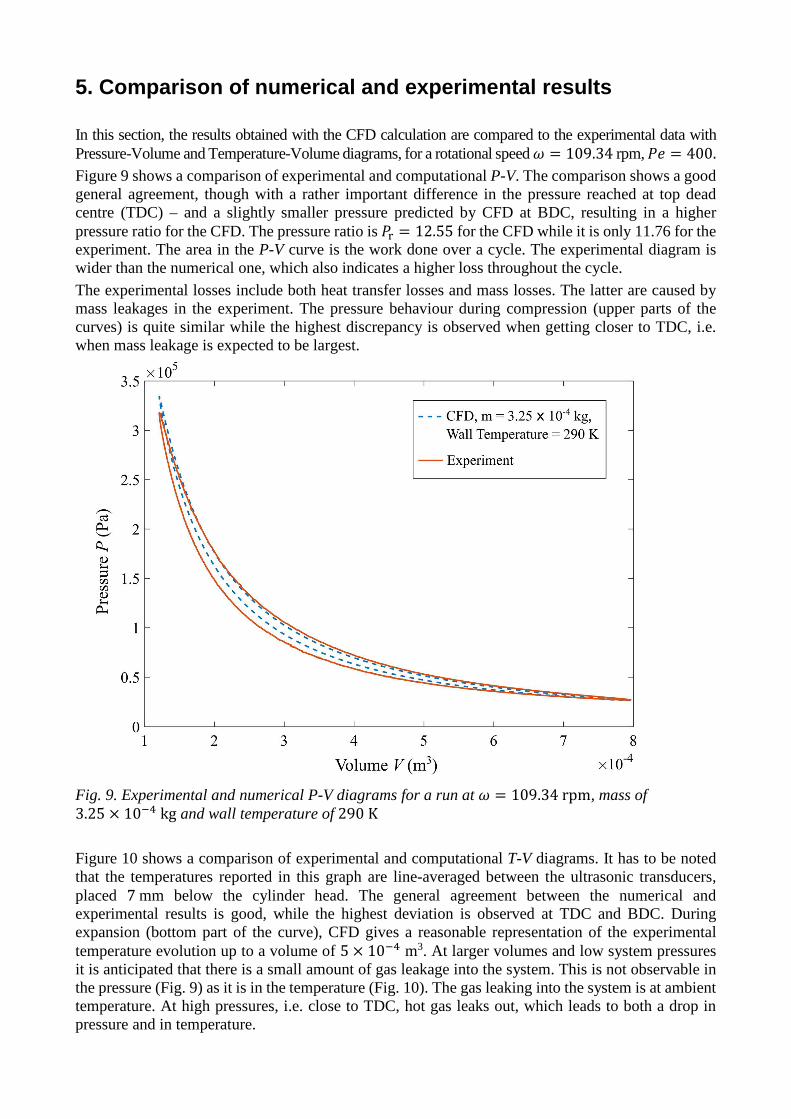
5. Comparison of numerical and experimental results In this section, the results obtained with the CFD calculation are compared to the experimental data with Pressure-Volume and Temperature-Volume diagrams, for a rotational speed 2 � 109.34 rpm, 78 � 400. Figure 9 shows a comparison of experimental and computational P-V. The comparison shows a good general agreement, though with a rather important difference in the pressure reached at top dead centre (TDC) – and a slightly smaller pressure predicted by CFD at BDC, resulting in a higher pressure ratio for the CFD. The pressure ratio is 7� � 12.55 for the CFD while it is only 11.76 for the experiment. The area in the P-V curve is the work done over a cycle. The experimental diagram is wider than the numerical one, which also indicates a higher loss throughout the cycle.
The experimental losses include both heat transfer losses and mass losses. The latter are caused by mass leakages in the experiment. The pressure behaviour during compression (upper parts of the curves) is quite similar while the highest discrepancy is observed when getting closer to TDC, i.e. when mass leakage is expected to be largest.
Fig. 9. Experimental and numerical P-V diagrams for a run at 2 � 109.34rpm, mass of 3.25 @ 10_`kg and wall temperature of290K
Figure 10 shows a comparison of experimental and computational T-V diagrams. It has to be noted that the temperatures reported in this graph are line-averaged between the ultrasonic transducers, placed 7mm below the cylinder head. The general agreement between the numerical and experimental results is good, while the highest deviation is observed at TDC and BDC. During expansion (bottom part of the curve), CFD gives a reasonable representation of the experimental temperature evolution up to a volume of 5 @ 10_` m3. At larger volumes and low system pressures it is anticipated that there is a small amount of gas leakage into the system. This is not observable in the pressure (Fig. 9) as it is in the temperature (Fig. 10). The gas leaking into the system is at ambient temperature. At high pressures, i.e. close to TDC, hot gas leaks out, which leads to both a drop in pressure and in temperature.
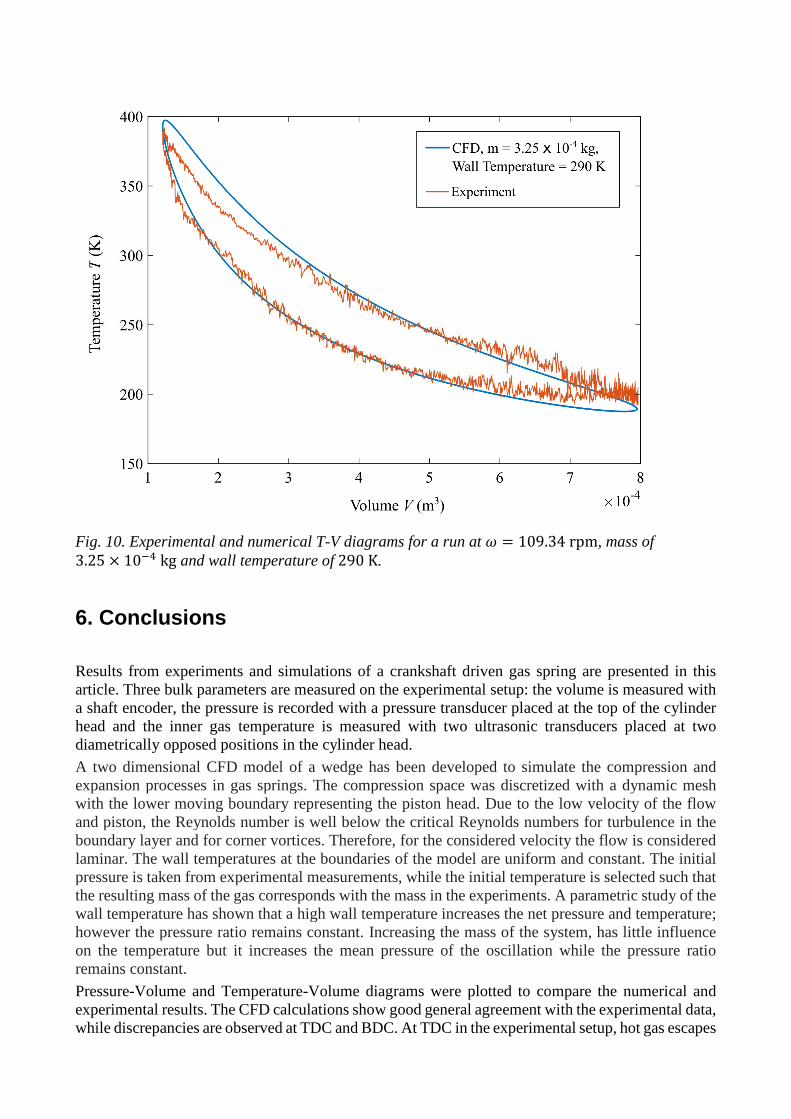
Fig. 10. Experimental and numerical T-V diagrams for a run at 2 � 109.34rpm, mass of 3.25 @ 10_`kg and wall temperature of290K.
6. Conclusions Results from experiments and simulations of a crankshaft driven gas spring are presented in this article. Three bulk parameters are measured on the experimental setup: the volume is measured with a shaft encoder, the pressure is recorded with a pressure transducer placed at the top of the cylinder head and the inner gas temperature is measured with two ultrasonic transducers placed at two diametrically opposed positions in the cylinder head.
A two dimensional CFD model of a wedge has been developed to simulate the compression and expansion processes in gas springs. The compression space was discretized with a dynamic mesh with the lower moving boundary representing the piston head. Due to the low velocity of the flow and piston, the Reynolds number is well below the critical Reynolds numbers for turbulence in the boundary layer and for corner vortices. Therefore, for the considered velocity the flow is considered laminar. The wall temperatures at the boundaries of the model are uniform and constant. The initial pressure is taken from experimental measurements, while the initial temperature is selected such that the resulting mass of the gas corresponds with the mass in the experiments. A parametric study of the wall temperature has shown that a high wall temperature increases the net pressure and temperature; however the pressure ratio remains constant. Increasing the mass of the system, has little influence on the temperature but it increases the mean pressure of the oscillation while the pressure ratio remains constant.
Pressure-Volume and Temperature-Volume diagrams were plotted to compare the numerical and experimental results. The CFD calculations show good general agreement with the experimental data, while discrepancies are observed at TDC and BDC. At TDC in the experimental setup, hot gas escapes
from the compression chamber, leading to a decrease of the inner temperature and pressure, while ambient gas is sucked back in at BDC, leading to an increase of the inner temperature. These mass leakages can potentially explain the observed deviations.
From the comparison between experimental and numerical results, it appears necessary to establish a relation between the line-averaged temperature obtained with the ultrasonic sensors and the mean temperature to determine both the total system energy and the mass in the experimental gas spring. Thus, the mass leakages and thermal losses in the experiment can be decoupled.
Acknowledgments This work was supported by the UK Engineering and Physical Sciences Research Council (EPSRC) grant number EP/J006041/1.
Nomenclature
c sound velocity, m/s
L length, m
P pressure, Pa
Pr pressure ratio
Pe9 Oscillatory Péclet number R specific gas constant, J/(kg K)
r radius, m
t time, s
T temperature, K
V volume, m3
Vr pressure ratio
Greek symbols γ heat capacity ratio
θ crank angle, rad
ω crank rotational speed, rad/s (or rpm)
Subscripts and superscripts dv dead volume
f time of flight
g gas
s stroke
r connecting rod
Abbreviations BDC bottom dead centre
rpm revolution per minute
TDC top dead centre
References
[1] White A., Parks G., Markides C.N., Thermodynamic analysis of pumped thermal electricity storage. Applied Thermal Engineering 2013;53(2):291-8.
[2] Pfriem H., Periodic Heat Transfer at Small Pressure Fluctuations. Washington, United States; NACA Technical Memorandum (1943 Sept.) No.1048.
[3] Lee K., A simplistic model of cyclic heat transfer phenomena in closed spaces. In : Proc., Intersoc. Energy Convers. Eng. Conf.,1983, United States. Framingham, Massachusetts.
[4] Kornhauser A.A., Smith J.L., The effects of heat transfer on gas spring performance. Journal of Energy Resources Technology 1993;115(1):70-75.
[5] Kornhauser A.A., Smith J.L., Application of a complex Nusselt number to heat transfer during compression and expansion. Journal of Heat Transfer 1994;116(3):536-542.
[6] Mathie R., White A.J. and Markides C.N., Ultrasonic measurements of unsteady heat transfer in a reciprocating gas spring. In: International Conference on Heat Transfer, Fluid Mechanics and Thermodynamics, 2014, United States. Orlando, Florida.
[7] Wendt J.F., Computational fluid dynamics: an introduction. Berlin, Germany: Springer-Verlag; 2009.
[8] Lekić U., Kok J.B., Heat transfer and fluid flows in gas springs. Open Thermodynamics Journal. 2010;4:13-26.
[9] Chin D.-T., Litt M., An electrochemical study of flow instability on a rotating disk. Journal of Fluid Mechanics 1972;54(4):613-25.
[10] Tabaczynski R.J., Hoult D.P., Keck J.C., High Reynolds number flow in a moving corner. Journal of Fluid Mechanics 1970;42(2):249-25.
[11] Adair R.P., Qvale E.B., Pearson J.T., Instantaneous heat transfer to the cylinder wall in reciprocating compressors. In: Proceedings of the International Compressor Engineering Conference; 1972; West Lafayette, USA.